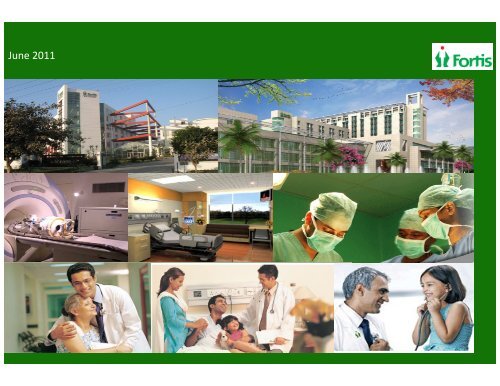
June 2011 - Fortis Healthcare
June 2011 - Fortis Healthcare
June 2011 - Fortis Healthcare

Create successful ePaper yourself
Turn your PDF publications into a flip-book with our unique Google optimized e-Paper software.
<strong>June</strong> <strong>2011</strong>
Disclaimer<br />
This presentation may not be copied, published, distributed or transmitted. The presentation has been prepared solely by the company.<br />
Any reference in this presentation to “<strong>Fortis</strong> <strong>Healthcare</strong> (India) Limited” shall mean, collectively, the Company and its subsidiaries. This<br />
presentation has been prepared for informational purposes only. This presentation does not constitute a prospectus, offering circular or<br />
offering memorandum and is not an offer or invitation to buy or sell any securities, nor shall part, or all, of this presentation form the basis of,<br />
or be relied on in connection with, any contract or investment decision in relation to any securities. Furthermore, this presentation is not and<br />
should not be construed as an offer or a solicitation of an offer to buy securities of the company for sale in the United States, India or any<br />
other jurisdiction.<br />
Securities may not be offered or sold in the United States absent registration or an exemption from registration. Any public offering in the<br />
United States may be made only by means of an offering document that may be obtained from the Company and that will contain detailed<br />
information about the Company and its management, as well as financial statements. Any offer or sale of securities in a given jurisdiction is<br />
subject to the applicable laws of that jurisdiction.<br />
This presentation contains forward-looking statements based on the currently held beliefs and assumptions of the management of the<br />
Company, which are expressed in good faith and, in their opinion, reasonable. Forward-looking statements involve known and unknown risks,<br />
uncertainties and other factors, which may cause the actual results, financial condition, performance, or achievements of the Company or<br />
industry results, to differ materially from the results, financial condition, performance or achievements expressed or implied by such forwardlooking<br />
statements. Given these risks, uncertainties and other factors, recipients of this presentation are cautioned not to place undue<br />
reliance on these forward-looking statements.<br />
The Company assumes no responsibility to publicly amend, modify or revise any forward-looking statements, on the basis of any subsequent<br />
development, information or events, or otherwise. Unless otherwise stated in this presentation, the information contained herein is based on<br />
management information and estimates. The information contained herein is subject to change without notice and past performance is not<br />
indicative of future results. The Company may alter, modify or otherwise change in any manner the content of this presentation, without<br />
obligation to notify any person of such revision or changes.<br />
By attending this presentation you acknowledge that you will be solely responsible for your own assessment of the market and the market<br />
position of the Company and that you will conduct your own analysis and be solely responsible for forming your own view of the potential<br />
future performance of the business of the Company.<br />
Neither the delivery of this presentation nor any further discussions of the Company with any of the recipients shall, under any circumstances,<br />
create any implication that there has been no change in the affairs of the Company since that date.<br />
2
Agenda<br />
A. <strong>Healthcare</strong> Industry in India<br />
B. Company Overview<br />
C. Recent Developments<br />
D. Financials
<strong>Healthcare</strong> Sector: Favorable industry dynamics<br />
<strong>Healthcare</strong> Services remains attractive to both public and private market investors<br />
Strong Cash<br />
Generation<br />
Characteristics<br />
Increasing Public<br />
Outsourcing<br />
Increasing Private<br />
Payers<br />
<strong>Healthcare</strong> without<br />
Binary Risk<br />
<strong>Healthcare</strong><br />
Sector<br />
Scalable Business<br />
Models<br />
Favorable<br />
Underlying<br />
Demographics<br />
Scarcity of Quality<br />
Assets<br />
Defensive Growth<br />
Characteristics<br />
Considerable<br />
Consolidation<br />
Opportunities<br />
Rise of Independent<br />
Providers<br />
4
Hospitals: Proxy for India’s <strong>Healthcare</strong> Boom<br />
• The <strong>Healthcare</strong> delivery market in India pegged at around US$ 45 billion in 2010<br />
• While globally healthcare is typically provided through a largely government-funded public system, the<br />
Indian healthcare industry is dominated by the private sector<br />
• India has ~17% of the world's population, but one of the poorest healthcare infrastructures among growing<br />
economies and the lowest spend on healthcare (~4.5% of GDP)<br />
• Demographic changes, improving income levels, changing lifestyles, and rising insurance penetration etc<br />
will result in a rise in discretionary spending on healthcare<br />
• Accessible, reliable and affordable healthcare<br />
continues to be a challenge<br />
Indian <strong>Healthcare</strong> Market (US$bn)<br />
CAGR: 12%<br />
• Opportunity in healthcare being significantly<br />
leveraged by private healthcare providers<br />
• Expected to generate employment opportunities for<br />
9 million people by 2012<br />
Source: Analyst Research<br />
5
Indian <strong>Healthcare</strong> Delivery<br />
20%<br />
80%<br />
Govt.<br />
Sector<br />
70%<br />
Pvt.<br />
Sector<br />
30%<br />
Population<br />
Govt.<br />
22%<br />
Out of<br />
Pocket 70%<br />
Others<br />
7%<br />
Insurance<br />
1%<br />
Hospitals in the Country<br />
<strong>Healthcare</strong> Expenditure<br />
6
Evolution of <strong>Healthcare</strong> in India<br />
Very Low <strong>Healthcare</strong> Spend as % of GDP<br />
High Disease Burden & Insufficient Facilities<br />
20%<br />
6%<br />
8% 8%<br />
9%<br />
1%<br />
Disease Beds Doctors Nurses Community & Lab<br />
burden health workers technicians<br />
Significantly Low Hospital Beds Per 10,000 Population<br />
Changing Age Profile of Indian Population<br />
139<br />
72<br />
39 34 32 31 30<br />
24 22<br />
9<br />
Japan France UK CanadaSingapore US China Brazil Thailand India<br />
Source: WHO, FICCI, Ernst & Young, Analyst Research<br />
7
Current Status Of Global <strong>Healthcare</strong><br />
<br />
There is a wide discrepancy in the world with regards to the amount of health expenditures both relative to GDP and in absolute terms<br />
Health Expenditure (% of GDP)<br />
Developed Countries<br />
Developing Countries<br />
Health Expenditure Per Capita (US$)<br />
Developed Countries<br />
Developing Countries<br />
Source: The World Pharmaceutical Markets Fact Book 2009 from Espicom Business Intelligence; CIA World Factbook
Lifestyle Changes Driving Diseases Which Require<br />
Hospitalisation<br />
Changing Disease Profile<br />
Expected No. of Cardiac Patients in India<br />
Lifestyle<br />
Diseases<br />
Number of people (in million)<br />
45.0<br />
72.1<br />
Acute<br />
Diseases<br />
2008 2018E<br />
Estimated No. of Diabetes Patients<br />
Cancer and Cardiac –<br />
Grows widely in the<br />
lifestyle segment<br />
• Lifestyle diseases are set to assume a greater share of the healthcare<br />
market<br />
• Lifestyle diseases such as cardiac diseases require hospitalization and<br />
are more expensive to treat hence increasing the in-patient revenues<br />
Number of people (in million)<br />
39.0<br />
49.4<br />
2008 2018E<br />
Source: CII-McKinsey, CRISIL Research<br />
9
India: Potential to Become the Global <strong>Healthcare</strong><br />
Destination<br />
Overview Cost of Important Procedures (US $)<br />
• Medical value travel is one of the most lucrative segments of<br />
the healthcare sector and is expected to grow into a US$ 1.5<br />
billion industry by 2012<br />
Heart Surgery<br />
US UK Thailand Singapore India<br />
100,000 41,726 14,250 15,312 6,000<br />
• Potential to contribute US$ 1.2 – 2.4 billion additional<br />
Heart Valve Replacement<br />
1,60,000<br />
30,000<br />
10,500<br />
13,000<br />
6,000<br />
revenue for up-market tertiary care hospitals by 2012, and<br />
Bone Marrow Transplant<br />
250,000<br />
292,470<br />
62,500<br />
150,000<br />
30,000<br />
will account for 3 – 5% of total healthcare market<br />
Liver Transplant<br />
300,000<br />
200,000<br />
75,000<br />
140,000<br />
45,000<br />
Knee Replacement<br />
48,000<br />
50,109<br />
8,000<br />
25,000<br />
6,000<br />
Hip Replacement<br />
38,000<br />
18,000<br />
10,000<br />
12,000<br />
6,000<br />
Key Drivers For The Growth<br />
• Quality healthcare at fraction of the cost<br />
• Availability of skilled doctors & hospitals<br />
• Good reputation of Indian doctors<br />
• Upsurge of lifestyle diseases<br />
Issues<br />
• Inadequate healthcare infrastructure<br />
• Unstructured medico legal jurisdiction<br />
• Indians hospitals’ standards below par against the global<br />
benchmarks of care<br />
• Lack of accredited hospitals and follow up care<br />
10
Health Insurance<br />
Growing Share Of Urban Middle Class Households<br />
Health Insurance Market Size (US$ mn)<br />
100%<br />
80%<br />
60%<br />
3.3% 5.2% 7.0%<br />
44.2%<br />
52.5%<br />
58.6%<br />
7,000<br />
6,000<br />
5,000<br />
4,000<br />
CAGR: 32%<br />
6,207<br />
40%<br />
3,000<br />
20%<br />
52.5%<br />
42.3%<br />
34.5%<br />
2,000<br />
1,000<br />
494<br />
713<br />
1,127<br />
1,472<br />
0%<br />
2001-02 2006-07E 2010-11E<br />
0<br />
2006 2007 2008 2009 2015E<br />
US$ 12,800<br />
Health insurance market in India is expected to grow at a CAGR of 32% to reach<br />
a market size of US$ 6.21bn by FY15<br />
• One of the fastest growing free economy<br />
• Ranked 4th largest economy in the world in terms of<br />
purchasing power parity<br />
• Higher service mix, increasing urbanization<br />
• Overall penetration at 2%.<br />
• Growth driven by:<br />
a) increasing awareness,<br />
b) soaring healthcare costs and<br />
c) demographic profile of the people<br />
Source: CRISIL Research<br />
11
Agenda<br />
A. <strong>Healthcare</strong> Industry in India<br />
B. Company Overview<br />
C. Recent Developments<br />
D. Financials
The <strong>Fortis</strong> Edifice…..<br />
“Vision”<br />
“To create a world-class integrated healthcare delivery system in India, entailing the<br />
finest medical skills combined with compassionate patient care”<br />
Globally respected<br />
healthcare organization known for<br />
Clinical excellence and Distinctive Patient care<br />
“Achieved by”<br />
Talented<br />
people<br />
Strong value<br />
system<br />
Efficient<br />
systems<br />
Responsibility<br />
towards<br />
stakeholders<br />
“Foundation” of<br />
Trust<br />
13
<strong>Fortis</strong> <strong>Healthcare</strong>: The first decade of growth<br />
• Incorporated in 1996, <strong>Fortis</strong> is second largest healthcare chain in India built on a focused organic and inorganic strategy<br />
• 56* healthcare delivery facilities<br />
• 31 operating hospitals,<br />
• 17 satellite and heart command centers and<br />
• 8 hospitals under development<br />
• Listed on Indian stock exchanges with a market capitalization of c.USD1.5bn (May <strong>2011</strong>)<br />
• International and Nationally accredited facilities by JCI, NABH, NABL along with quality certifications by ISO Standards 9001 / 14001<br />
• Acquired 10 hospitals from Wockhardt Hospitals in 2009 and gained pan India presence and had recently acquired a ~25.3% stake in<br />
Parkway Holdings (Southeast Asia’s leading healthcare service provider with a network of 20** hospitals with more than 3,400 beds<br />
throughout Asia) and has chosen to exit considering higher valuations<br />
Started first hospital at<br />
Mohali<br />
Acquired Escorts chain of hospitals<br />
Acquired Malar Hospitals,<br />
Chennai<br />
Took a significant step in establishing <strong>Fortis</strong><br />
as a Global <strong>Healthcare</strong> Brand by its attempt<br />
to acquire Parkway Holdings Ltd – Asia’s<br />
finest healthcare provider, but exited<br />
considering high valuations of the asset<br />
Acquired Strategic stake in<br />
Super Religare<br />
Laboratories (SRL)<br />
Enters Delhi<br />
Commences operations at<br />
Noida<br />
Revenues grow<br />
4x with strong<br />
presence in NCR<br />
Listed on BSE and NSE<br />
with a market cap of<br />
USD543mn<br />
Starts hospital at Jaipur<br />
Company achieves<br />
profitability on<br />
consolidated basis<br />
Rights Issue<br />
Acquired 10 hospitals from Wockhardt<br />
Have signed 5 O&M contracts till<br />
date and progressing towards<br />
ongoing projects in tier II cities<br />
Commenced two Greenfield facilities at<br />
Shalimar Bagh, Delhi and Anandpur,<br />
Kolkata; Launched an Oncology block at<br />
Mulund, Mumbai<br />
14<br />
* Includes projects under development
Key Differentiators – Success Drivers<br />
Brand<br />
Strong IT system<br />
Differentiated Model –<br />
Doctor engagement, Deep<br />
penetration Strategy, Pan<br />
India presence<br />
Execution capabilities –<br />
M&A deals, Integration and<br />
turnaround<br />
Key<br />
Differentiators<br />
People focus<br />
Stress on Quality, Patient<br />
Centricity<br />
Operational Synergies –<br />
FOS, TRM, PSM<br />
15
Organisational Chart<br />
Managing Director<br />
Chief Financial<br />
Officer<br />
President – Strategy,<br />
Organisational<br />
Development &<br />
Projects<br />
Chief Executive Officer<br />
Vice President – Corporate<br />
Affairs<br />
Head – Growth &<br />
Business Planning<br />
Chief People<br />
Officer<br />
Head-<br />
Information<br />
Technology<br />
Chief Financial<br />
Controller<br />
Chief Sales<br />
Director-<br />
Marketing &<br />
Corporate<br />
Communications<br />
Director-Medical<br />
Operations<br />
Group<br />
Regional / Zonal<br />
Directors*<br />
Head – Internal<br />
Audit<br />
* The business is bifurcated into three regions headed by Regional Directors (RDs) for respective regions.<br />
16
Driving Efficiencies<br />
Branding & Marketing<br />
• Conveying Value Proposition<br />
Operating Efficiency<br />
• ARPOB, ALOS, Occupancy<br />
• Gross Margins, EBIDTA<br />
• Bed to Nurse ratio<br />
• Supply Chain Management<br />
• Best practice benchmarking<br />
• DSO/ Inventory Days<br />
• Surgical : Non Surgical<br />
• Shared Service Centres<br />
• FOS, MOS, Patient Satisfaction Index<br />
Maximizing Return<br />
on Invested<br />
Capital<br />
Capital Efficiency<br />
• Optimize Capex<br />
• Cheap Finance<br />
• Model of Growth<br />
• Outsourcing<br />
• Off Balance Sheet<br />
• Turn key/ PPP/ Leased Premises<br />
• Technology Management : COE<br />
Processes<br />
• IT system, Protocols, SOP’s, Governance,<br />
• Trust and Transparency , Integration<br />
Capability, Project Execution<br />
People<br />
• Motivated, Trained and Engaged Staff:<br />
Service Excellence, Academics &<br />
Research, HR Processes<br />
17
Deep Pan India Presence<br />
18<br />
Presence across<br />
- 15 States<br />
- 30 Cities<br />
Focus<br />
Areas<br />
Owned Facility<br />
Managed Facility<br />
Heart Command<br />
Centers (HCCs)<br />
Projects<br />
Category wise<br />
Total Capacity<br />
Operational Beds No. of Hospitals<br />
Owned 4,716 2,941 22<br />
Managed 1,576 800 26<br />
Projects 1,945 - 8<br />
Grand Total 8,237 3,741 56<br />
Region wise<br />
North 4,538 1,977 29<br />
South 1,469 663 10<br />
West 1,270 685 6<br />
East 840 306 8<br />
International 120 110 3<br />
Grand Total 8,237 3,741 56<br />
Maturity wise<br />
More than 5 years 766 542 45<br />
3 to 5 years 2,806 1,908 27<br />
1 to 3 years 851 616 8<br />
Less than 1 year 1,919 675 9<br />
Projects 1,945 - 8<br />
Grand Total 8,237 3,741 56<br />
Not included in above map are international hospitals, and projects<br />
* Expansion of beds at Mulund hospital is a project, but does not add a new hospital to the total number of hospitals. Although, the beds considered as part of capacity in Project stage
Growth strategy<br />
Focused and<br />
Aggressive<br />
Growth Strategy<br />
Improving<br />
Operational<br />
Performance<br />
Leveraging<br />
People and<br />
Technology<br />
Reinforce presence in already present<br />
regions<br />
Flexible approach to expansion through<br />
Green Field, Brown Field, O&M<br />
agreements, Asset Light model and Public<br />
Private Partnerships (PPP)<br />
Replicate its North India model to<br />
establish a network of super-specialty<br />
“Centers of Excellence” and multispecialty<br />
hospitals delivering quality<br />
healthcare, to all regions<br />
19<br />
Execution capabilities –<br />
Greenfield projects, M&A deals,<br />
Integration and turnaround<br />
Maximize efficiency through strategies<br />
such as common procurement unit for<br />
medical equipments and supplies<br />
Improve occupancy rates by<br />
expanding its reach and increasing<br />
community outreach programs to gain<br />
market share<br />
Increase its average income per bed<br />
in use by focusing on high-end<br />
healthcare services, reducing the<br />
average length of stay of in-patients<br />
Supply Chain Management,<br />
Shared Service Centers<br />
FOS, MOS,<br />
Attract and retain clinical staff with<br />
reputations for clinical excellence in their<br />
communities<br />
Training and skill enhancement<br />
programs<br />
Adopting latest medical equipment and<br />
technology<br />
Focusing on evolving a robust IT<br />
platform for seamless integration of<br />
information<br />
Motivated, Trained and Engaged<br />
Staff: Service Excellence,<br />
Academics & Research, HR<br />
Processes
Typical Tertiary Care Model (200 Beds - Owned facility)<br />
500<br />
400<br />
Indicative Hospital Operating Model<br />
Book Breakeven<br />
[1.3x – 1.5x of CAPEX]<br />
4x<br />
Land<br />
Other Equip<br />
Medical<br />
Equip<br />
Building &<br />
Utilities<br />
13%<br />
12%<br />
25%<br />
50%<br />
Revenues<br />
CAPEX<br />
Cost of set up is<br />
` 60 – 90 lacs/ bed<br />
Debt: Equity – 1:1<br />
ROCE = 26%<br />
ROE = 20%<br />
300<br />
200<br />
100<br />
0<br />
(100)<br />
x<br />
38%<br />
38%<br />
Cash Breakeven<br />
EBITDA<br />
Breakeven<br />
40% 36%<br />
(16%)<br />
31%<br />
33%<br />
16%<br />
23%<br />
30%<br />
30% Occupancy<br />
85%<br />
Year 1 Year 2 Year 3 Year 4 Year 5<br />
23%<br />
20%<br />
28%<br />
31% 29%<br />
Variable Personnel SG&A Cost EBIDTA<br />
28%<br />
17%<br />
28%<br />
27%<br />
20
Asset Light Model (200 Beds)<br />
Land 13%<br />
Other<br />
Equip<br />
12%<br />
Medical<br />
Equip<br />
Building &<br />
Utilities<br />
25%<br />
50%<br />
CAPEX<br />
Revenues<br />
500<br />
400<br />
300<br />
200<br />
100<br />
0<br />
38%<br />
40%<br />
Cash Breakeven<br />
EBITDAR<br />
Breakeven<br />
Indicative Hospital Operating Model<br />
Book Breakeven<br />
31%<br />
33%<br />
36%<br />
[1.3x – 1.5x of CAPEX]<br />
Besides<br />
elongated book<br />
28%<br />
breakeven<br />
period, <strong>Fortis</strong>’ to<br />
6%<br />
witness higher<br />
17%<br />
23%<br />
returns on its<br />
8%<br />
investment<br />
16% 20%<br />
ROCE = 51%<br />
28%<br />
ROE = 39%<br />
Cost of set up is<br />
` 60-90 lacs/ bed 30%<br />
Occupancy 85%<br />
(100)<br />
Debt: Equity – 1:1<br />
x<br />
18%<br />
38%<br />
(16%)<br />
11%<br />
23%<br />
30%<br />
31%<br />
Year 1 Year 2 Year 3 Year 4 Year 5<br />
28%<br />
29%<br />
Variable Personnel SG&A Cost EBIDTAR* Rent<br />
4x<br />
5%<br />
27%<br />
<strong>Fortis</strong> to invest<br />
only on Medical<br />
and Other<br />
equipment (~37%<br />
of project cost).<br />
21<br />
*EBITDAR is Earnings before Interest, Tax, Depreciation, Amortisation and Rent/lease
Focus on ARPOB<br />
Surgical vs. Non Surgical<br />
Medical Program<br />
Critical Care Beds vs.<br />
General Care Beds<br />
Total Revenue<br />
Pricing<br />
Specialties Chosen<br />
Average<br />
Revenue Per<br />
Occupied Bed<br />
(ARPOB)<br />
=<br />
÷<br />
Average Length of<br />
Stay (ALOS)<br />
Patient Turnover<br />
Occupied Beds<br />
Volumes<br />
Bed Utilization<br />
No. of Procedures<br />
A Hospital must grow its ARPOB, as when the occupancies go up it ensures that incremental beds are filled with high value added business<br />
22
<strong>Fortis</strong> has Achieved Growth Both through Successful<br />
Acquisitions and Value Added Services<br />
Ramp up at an acquired facility – <strong>Fortis</strong> Malar, Chennai<br />
Extracting value from M&A: Escorts Delhi<br />
90.0<br />
80.0<br />
70.0<br />
60.0<br />
50.0<br />
` Cr.<br />
40.0<br />
30.0<br />
20.0<br />
10.0<br />
0.0<br />
Acquired<br />
<strong>Fortis</strong> Malar in<br />
February 2008<br />
14.0<br />
17.9<br />
4.1 4.2<br />
67% CAGR<br />
33.2<br />
1.1<br />
64.1<br />
9.4<br />
83.3<br />
FY07 FY08 FY09 FY10 FY11<br />
Operating Revenue<br />
EBITDA<br />
14.2<br />
` Cr.<br />
90.0<br />
80.0<br />
70.0<br />
60.0<br />
50.0<br />
40.0<br />
30.0<br />
20.0<br />
10.0<br />
-<br />
Grown twice on quarterly basis since 2008<br />
78.0<br />
69.9<br />
54.5<br />
41.4<br />
10.9 13.6 13.4<br />
4.3<br />
Q3FY08 Q3FY09 Q3FY10 Q3FY11<br />
Operating Revenue EBITDA<br />
Extracting value from M&A: Escorts Amritsar<br />
Performance of a Greenfield facility: Jaipur<br />
70.0<br />
60.0<br />
50.0<br />
40.0<br />
` Cr.<br />
30.0<br />
20.0<br />
10.0<br />
0.0<br />
61.6<br />
33% CAGR<br />
50.1<br />
41.2<br />
25.9<br />
14.6 15.4<br />
9.7<br />
2.9<br />
FY08 FY09 FY10 FY11<br />
Operating Revenue EBITDA<br />
` Cr.<br />
25.0<br />
20.0<br />
15.0<br />
10.0<br />
5.0<br />
-<br />
(5.0)<br />
6x growth on quarterly numbers<br />
4x on annual basis since inception<br />
20.7<br />
16.7<br />
9.0<br />
3.6<br />
5.9<br />
3.4<br />
4.5<br />
(1.7) (2.2) (0.5)<br />
Q2FY08 Q3FY08 Q3FY09 Q3FY10 Q3FY11<br />
Operating Revenue EBITDA<br />
23
<strong>Fortis</strong> Approach to Industry Challenges<br />
Key Challenges<br />
<strong>Fortis</strong> Approach<br />
Shortage of<br />
skilled medical<br />
professionals<br />
High start up<br />
costs and capex<br />
requirements<br />
Lack of<br />
standardization /<br />
quality<br />
Technological<br />
obsolescence<br />
Maintaining<br />
medical ethics<br />
• Focus on CME, research and accolades<br />
• Aligned compensation structure, ESOPs<br />
• Foothold in more than one hospital<br />
• Nursing school and DNB programs<br />
• Competence to strike deals, invest in green field hospitals, acquire hospitals, and O&Ms<br />
• Partnership with government for PPP projects<br />
• Centralising of common services to achieve economies of scale<br />
• Concept and designed to reduce capex per bed<br />
• Innovative models to finance medical equipments<br />
• Accreditation of hospitals, laboratories, and blood banks by national and international authorities<br />
• Focus on best practices and continuous review by a strong team<br />
• Innovative tie ups<br />
• “Center of Excellence” Approach helps recycle technology around the network<br />
• Centralized Specialist group owning technologies across network<br />
• Medical Advisory Board; Accreditation committee at each hospital<br />
• Executive counsel taking call on key hospital discussions<br />
• Code of Ethics; Whistle blower policy<br />
24
Agenda<br />
A. <strong>Healthcare</strong> Industry in India<br />
B. Company Overview<br />
C. Recent Developments<br />
D. Financials
SRL Acquisition & Rationale<br />
<br />
Acquisition of strategic stake in SRL – India’s leading diagnostic company<br />
Acquired 42.7 million equity shares representing 82.2% of the paid up capital as on April 14, <strong>2011</strong><br />
<br />
Post PE investment (AVIGO and Sabre), it would represent 71.5% of expanded capital<br />
<br />
<br />
<br />
<br />
<br />
Total purchase price of ~Rs 803.7 Crore on cash basis; valuation based on arm length price paid by AVIGO<br />
for minority stake of 8.9% and lower than 4.2% by Sabre capital<br />
<strong>Fortis</strong>-SRL deal valued at 2.2x Sales and 12x EBITDA (FY12E); compares favourably to SRL - PDSPL deal<br />
and Dr Lal Pathlab – TA Associate deal<br />
To become an integrated healthcare player with presence in all major verticals<br />
To participate in high growth segment of healthcare industry with huge potential<br />
SRL offers a strong fit due to:<br />
<br />
<br />
<br />
<br />
<br />
Geographical Complementarities<br />
Pan India presence<br />
Strong talent pool<br />
Well established brand and strong logistics network<br />
Synergistic with the hospital business<br />
26
Two-way Synergy – Many New Upsides<br />
Patient footfalls in Unified <strong>Fortis</strong><br />
Network<br />
Geographical Complementarities<br />
• Increased opportunity from repeat customers of <strong>Fortis</strong> and SRL<br />
• 25 % of the Path and Radiology testing is followed by hospital<br />
accessions – OPD/IPD conversions<br />
• Favorable demographic and macroeconomic trend<br />
• <strong>Fortis</strong> to leverage on SRL’s presence and leadership in 400 cities<br />
for its tier II and tier III expansion plan<br />
Quality Improvement<br />
In-house Radiology & Pathology<br />
Large Database for CRM, Research<br />
and Reach<br />
• Highly skilled talent pool to help take the hospital diagnostic<br />
excellence to the next level<br />
• To result in enhanced Patient safety and better Clinical outcome<br />
• <strong>Fortis</strong> and SRL to cross leverage on SRL’s comprehensive<br />
offering of ~3,300 tests and its strong all-modaility experience<br />
and expertise in radiology for better managing in-hospital<br />
diagnostics.<br />
• Combined entities will access the large unified<br />
customer/patient/doctor database and significantly increase their<br />
ability serve the nationwide patient population.<br />
27
Established and Wide Geographical Presence<br />
Geographical Presence<br />
Present in ~400 cities in India<br />
Has won FICCI’s award for Operational<br />
Excellence (2010), Frost & Sullivan Award for<br />
Excellence in Diagnostics (2008 , 2009) and<br />
rated the most innovative diagnostic company<br />
by Business Today<br />
North India<br />
Reference Labs 1<br />
Pathology Labs 27<br />
Radiology Labs 1<br />
Wellness Centers 4<br />
Collection Centers 339<br />
East India<br />
Reference Labs 1<br />
Pathology Labs 18<br />
Radiology Labs -<br />
Wellness Centers 1<br />
Collection Centers 218<br />
India<br />
Internation<br />
al<br />
Total<br />
Reference Labs 6 2 (1) 8<br />
Pathology Labs 164 - 164 (2)<br />
Radiology Labs 17 - 17<br />
Wellness Centers 15 (3) - 15<br />
Collection Centers 865 23 888 (2)<br />
Source: Company<br />
1 – Includes 1 reference lab in Nepal and a service agreement for a reference lab in Dubai <strong>Healthcare</strong> City.<br />
2 – Includes 25 pathology labs run through franchisees and 875 collection centers run through franchisee.<br />
3 – 12 Wellness Centers are in existing labs.<br />
28<br />
West India<br />
Reference Labs 3<br />
Pathology Labs 50<br />
Radiology Labs 13<br />
Wellness Centers 5<br />
Collection Centers 194<br />
South India<br />
Reference Labs 1<br />
Pathology Labs 69<br />
Radiology Labs 3<br />
Wellness Centers 5<br />
Collection Centers 114
Financials: 2010-11 (Scenario)*<br />
<strong>Fortis</strong> +SRL<br />
Revenue<br />
Rs 1483 Cr<br />
EBITDA<br />
Rs 209 Cr<br />
Rs 507 Cr<br />
Rs 88 Cr<br />
Increases revenue by<br />
32% while impacting<br />
profitability marginally<br />
Revenue***<br />
Rs 1960 Cr<br />
EBITDA<br />
Rs 297 Cr<br />
PAT<br />
Rs 124 Cr<br />
Rs 4 Cr**<br />
PAT<br />
Rs 128 Cr<br />
*Financials have been annualized based on Q4FY11 for SRL and include FY11 for <strong>Fortis</strong><br />
**PAT for SRL is after Interest costs of ~ Rs 45 Cr , which will substantially go down post IPO<br />
***Net of inter-company revenue<br />
29<br />
29
Recent Deals<br />
1. O&M agreement with O.P. Jindal Hospital, Raigarh, Chhattisgarh<br />
100 bed multi-speciality secondary care hospital<br />
Located within the campus of Jindal Steel & Power Limited<br />
2. Reverse O&M agreement with Vivekanand Hospital Moradabad, Uttar Pradesh<br />
150 bed multi-speciality secondary care hospital ; Premises also house a Nursing College and a Nursing School<br />
Located in Moradabad, North Eastern UP, the hospital was set up under a Trust in 1985.<br />
Constructed over a 6.3 acre land with a built up area of 198,000 sq ft<br />
3. O&M agreement with East Coast Hospital in Pondicherry<br />
100 bedded facility with a plan to expand it to a 250 bed facility<br />
To be operational by Q1FY12<br />
4. Reverse O&M agreement with Lifeline Hospital, Alwar, Rajasthan<br />
100 bedded facility with a plan to expand it to a 150 bed facility<br />
Constructed over a 3 acre plot with a built up area of 100,000 sq ft<br />
5. Public Private Partnership with State of Uttarakhand<br />
To set up a 50 bed Cardiac Centre at Deen Dayal Upadhyaya (Coronation) Hospital at Dehradun<br />
To be operational by Q2FY12<br />
30
Upcoming Greenfield Hospitals<br />
No. Location Beds Area & Land<br />
Ownership<br />
Date of Commencement<br />
Estimated<br />
Capex (INR<br />
Cr)<br />
Status<br />
1. Kangra 100 37,000 sq. ft., B. Lease Q2 FY12 24<br />
• Civil and interior work completed<br />
• Medical equipment have been ordered<br />
• Facility being handed over to operations<br />
2. Dehradun 50<br />
27,000 sq.ft, Public Private<br />
Partnership<br />
Q3FY12 15<br />
• Civil construction work of the hospital<br />
building is complete<br />
• Some delays in handing over premises<br />
• Equipment ordered<br />
• Work on interiors is on<br />
3. Gurgaon 450** 11 Acres, Owned Q4 FY12 325 • Medical equipment ordered<br />
• Rs 235 Cr has been spent till March’11.<br />
4. Ludhiana – 1 200 1,55,000 sq. ft., B. Lease Q2 FY13 50<br />
5. Peenya, Bangalore 120 ~70,000 Sq ft; B. Lease FY13 18<br />
6. Ludhiana – 2 75 60,000 sq ft. B. Lease FY 13 20<br />
• Construction in full swing. Casting of<br />
columns in progress<br />
• Project on schedule<br />
• Building construction work is delayed by<br />
landlord<br />
• Approval from govt. authorities received;<br />
design work underway<br />
7. Gwalior 200 2.5 Acres, L. Lease FY14 72 • CLU permission awaited from authorities<br />
8. Ahmedabad 200 1,55,000 sq. ft., B. Lease FY14 50 • Approval from govt. authorities awaited<br />
Total 1,395 574<br />
** Only for Phase – 1, total size of the project is 1000 beds<br />
31
Agenda<br />
A. <strong>Healthcare</strong> Industry in India<br />
B. Company Overview<br />
C. Recent Developments<br />
D. Financials
Operating Revenue and PAT<br />
450.0<br />
415.6<br />
INR Cr.<br />
39.0<br />
400.0<br />
350.0<br />
329.5<br />
337.9<br />
357.8<br />
371.4<br />
34.5<br />
29.4<br />
34.0<br />
29.0<br />
Revenues<br />
124%<br />
300.0<br />
27.2<br />
24.0<br />
250.0<br />
232.5<br />
21.7<br />
21.6<br />
20.8<br />
19.0<br />
PAT<br />
3.9x<br />
200.0<br />
150.0<br />
100.0<br />
185.4 190.5<br />
13.0<br />
7.6<br />
Q1FY10 Q2FY10 Q3FY10 Q4FY10 Q1FY11 Q2FY11 Q3FY11 Q4FY11<br />
Operating Revenues<br />
PAT<br />
14.0<br />
9.0<br />
4.0<br />
33<br />
3
Revenue breakup<br />
Speciality wise<br />
Category wise<br />
Gastro, 2%<br />
Onco, 5%<br />
Neuro, 6%<br />
Ortho, 8%<br />
MSH,<br />
8% OPD, 19%<br />
Cardiac, 35%<br />
Other, 16%<br />
Renal, 4%<br />
Pulmo, 2%<br />
Gynae, 2%<br />
Others, 10%<br />
PSU's, 10%<br />
TPA, 14%<br />
CGHS, 3%<br />
ECHS, 7%<br />
International<br />
, 5%<br />
Corprates<br />
and Others,<br />
4%<br />
Cash, 58%<br />
Others,<br />
Focus on key specialties<br />
11%<br />
SAARC,<br />
Cardiac, Neuro, Ortho,<br />
USA, 7%<br />
15%<br />
Renal & Onco to<br />
continue…<br />
Middle<br />
Africa, 40%<br />
East, 27%<br />
34<br />
34<br />
International revenue<br />
Cash business is ~63% of<br />
overall business<br />
International patients<br />
contributes 5% to <strong>Fortis</strong>’<br />
network revenue
Growth Driven by Steadily Increasing Occupancy Rates<br />
Leading to Improving Operating Parameters…<br />
Occupancy<br />
80%<br />
70%<br />
63%<br />
68%<br />
74%<br />
72%<br />
60%<br />
50%<br />
40%<br />
FY08 FY09 FY10 FY11<br />
Average Revenue Per Operating Bed (Rs. Million)<br />
Average Length of Stay (days)<br />
8.10<br />
8.30<br />
8.10<br />
7.65<br />
4.30 4.20 4.10<br />
3.70<br />
FY08 FY09 FY10 FY11<br />
FY08 FY09 FY10 FY11<br />
35
Significant Increase in No. of Procedures with a Focus on<br />
Key Specialty Areas (Cardiac, Neuro, etc.)<br />
Cardiac<br />
Ortho<br />
55,000<br />
45,000<br />
35,000<br />
25,000<br />
39,651<br />
3,662<br />
20,851<br />
51,866 10.767<br />
8,000<br />
4,482 +31% 7,083<br />
7,013<br />
+52%<br />
6,000<br />
26,830<br />
4,553<br />
4,000<br />
15,000<br />
5,000<br />
-5,000<br />
10,777<br />
8,214<br />
6,924<br />
9,777<br />
FY10<br />
FY11<br />
CTVS & Pediatrics PTCA CAG Others<br />
2,000<br />
0<br />
2,530<br />
FY10<br />
Knee Replacements<br />
3,754<br />
FY11<br />
THR & Others<br />
Neuro<br />
Dialysis<br />
5,000<br />
4,000<br />
4,928<br />
+62%<br />
60,000<br />
50,000<br />
44,096<br />
62,315<br />
+41%<br />
3,000<br />
2,000<br />
2,709<br />
40,000<br />
30,000<br />
20,000<br />
1,000<br />
10,000<br />
0<br />
FY10<br />
FY11<br />
0<br />
FY10<br />
FY11<br />
36
Summary : Consolidated Profit and Loss – FY 2010-11<br />
FY11<br />
Particulars<br />
Base operations<br />
(Rs Cr.)<br />
%<br />
Parkway<br />
(Rs Cr.)<br />
Total<br />
(Rs Cr.)<br />
Operating Revenue 1,482.8 94.1% - 1,482.8<br />
Other Income * 92.3 5.9% 366.6 458.9<br />
Total Income 1,575.1 100.0% 366.6 1,941.7<br />
Direct Costs 393.0 24.9% - 393.0<br />
Employee Costs 273.1 17.3% - 273.1<br />
Other Costs 607.6 38.5% 161.0 768.6<br />
EBITDA 301.4 19.1% 205.6 507.0<br />
Finance Costs 69.6 4.4% 180.4 250.0<br />
Depreciation & Amortization 104.5 6.6% - 104.5<br />
PAT after minority interest and share in<br />
associates<br />
Operating EBITDA 209.1 14.1%<br />
106.4 6.8% 18.0 124.4<br />
• Rs 85 Cr of the Other Income constitutes interest & such income from deployment of surplus funds<br />
Note : The nos. have been restated and realigned to reflect profit from base operations separately<br />
37<br />
3
FY11 Comparative Financials – Base Operations<br />
Particulars<br />
FY11<br />
(Rs Cr.)<br />
%<br />
FY10<br />
(Rs Cr.)<br />
% Growth (%)<br />
Operating Revenue 1,482.8 100.0% 937.9 100.0% 58.1%<br />
Direct Costs 393.0 26.5% 262.7 28.0% 49.6%<br />
Employee Costs 273.1 18.4% 195.0 20.8% 40.1%<br />
Other Costs * 607.6 41.0% 339.8 36.2% 78.8%<br />
Operating EBITDA 209.1 14.1% 140.4 15.0% 48.9%<br />
Other Income 92.3 6.2% 50.1 5.3% 84.2%<br />
Finance Costs 69.6 4.7% 57.3 6.1% 21.4%<br />
Depreciation & Amortization 104.5 7.0% 59.9 6.4% 74.4%<br />
PAT after minority interest and share<br />
in associates<br />
106.4 7.0% 69.5 7.4% 53.1%<br />
EPS for the period** (Rs) 3.23 2.61<br />
*Increase in other costs is primarily due to doctor engagement model at newly acquired hospitals.<br />
**EPS calculated on reported consolidate net profits for the relevant year<br />
38<br />
3
Maturity-wise Performance – FY 11: Main Hospitals<br />
Maturity<br />
5 Years and<br />
Above<br />
(Four hospitals)<br />
Revenue<br />
Contribution<br />
EBITDA<br />
Contribution<br />
Average<br />
EBITDA<br />
margin *<br />
Average<br />
Occupancy<br />
Average<br />
ARPOB (Rs<br />
Cr)<br />
24% 34% 26.0% 80% 1.00<br />
14% of operating beds aged 5 years<br />
and above contributes 24% to<br />
revenue<br />
3 years to 5<br />
Years (Nine 58% 62% 20.0% 78% 0.83<br />
Hospitals)<br />
One to three<br />
Years (Eight<br />
Hospitals)<br />
Upto one year<br />
(Three Hospitals)<br />
13% 9% 13.9% 57% 0.63<br />
5% (5)% (18.4)% 37% 0.34<br />
Average - - 18.8% 72% 0.81<br />
51% of operating beds are 3 to 5<br />
years of age and contributes 58% to<br />
revenue<br />
16% of operating beds are 1 to 3<br />
years of age and contributes 13% to<br />
revenue<br />
18% of operating beds are up to 1<br />
year of age and contributes just 5% to<br />
revenue<br />
* Average EBITDA margin has been calculated on Unit basis<br />
39
Balance Sheet as at March 31, <strong>2011</strong><br />
Balance Sheet<br />
Rs Crore<br />
Shareholder’s Equity* 3,313<br />
Foreign Currency Convertible Bonds (FCCB’s)# 446<br />
Debt 642<br />
Total Capital Employed 4,401<br />
Goodwill 885<br />
Net Fixed Assets (including CWIP of Rs 270 Crore) 1,910<br />
Investments<br />
Net Cash Surplus*** 854<br />
* Shareholder’s Equity is inclusive of Revaluation Reserve and Minority Interest<br />
** Net Current Assets includes Deferred Tax Assets<br />
*** Net Cash Surplus excludes FCCB’s<br />
#<strong>Fortis</strong> issued US$ 100 million,5% convertible bonds due in May 2015 convertible at Rs 167 per equity share; redeemable on or after May 2013<br />
40<br />
- in Associates 28<br />
- Deposits (including Inter-Corporate Deposits) 1,348<br />
- Liquid and Mutual Funds 62<br />
Cash and Bank Balances 86<br />
Net Current Assets** 82<br />
Total Fixed Assets 4,401
Summing Up<br />
• <strong>Healthcare</strong> Sector poised to grow<br />
<strong>Healthcare</strong><br />
Sector<br />
• Growth led by Lifestyle Diseases and Insurance Penetration<br />
• Government recognizes the need to partner with Private Sector<br />
• <strong>Healthcare</strong> expenditure estimated to be 6% of GDP by 2012 & employ around 9 million people<br />
• One of the largest private healthcare delivery player in India<br />
<strong>Fortis</strong><br />
<strong>Healthcare</strong><br />
• Aggressively grown from 1 hospital in 2001 to a network of 56* hospitals in <strong>2011</strong> with ~ 8,000*<br />
beds<br />
• Leadership in Cardiac Sciences, Neuro Sciences and Orthopedics<br />
• Evolved the Business Model and high level of Brand Equity<br />
• Proven ability to acquire, integrate and turn around<br />
• Providing attractive value propositions to various segments of market<br />
* Estimated number of hospitals and beds is including hospitals under projects stage<br />
41
Analyst Coverage<br />
Broker* Analyst name Comments<br />
B&K<br />
Bank of America<br />
Vikash Singh<br />
Prasad Deshmukh<br />
B&K maintains its positive outlook on <strong>Fortis</strong> due to<br />
its focus on profitable growth, improvement in<br />
realization and operational efficiency across its<br />
facilities<br />
Expects strong growth in earnings as majority beds<br />
will turn profitable going ahead<br />
Centrum Rahul Gaggar Positive on the company’s growth prospects<br />
CITI<br />
Prashant Nair / Anshuman Gupta<br />
Goldman Sachs Balaji V Prasad / Rishi Jhunjhunwala -<br />
ICICI Direct<br />
IDFC<br />
Rashesh Shah<br />
Nitin Agarwal / Ritesh Shah<br />
Over the longer term, CITI forecasts sustained<br />
growth & improvement in profitability as the new<br />
hospitals scale up<br />
<strong>Fortis</strong>’ constant growth focus and<br />
strong management team supports our positive<br />
outlook on the company<br />
FHL continues to pursue its strategy to grow<br />
aggressively with sustained focus on operational<br />
parameters<br />
JP Morgan<br />
Morgan Stanley<br />
UBS<br />
Princy Singh / Dinesh S. Harchandani, CFA<br />
Saniel Chandrawat / Sameer Baisiwala, CFA<br />
Ajay Nandanwar<br />
Asset light strategy to help <strong>Fortis</strong> scale up at a<br />
faster pace and improve its capital return profile.<br />
Bullish on <strong>Fortis</strong>’ ability to execute aggressive<br />
expansion plans<br />
Optimistic about <strong>Fortis</strong>’ opportunities ahead, its<br />
ability to improve the operating performance of its<br />
acquired hospitals<br />
* In Alphabetical order
THANK YOU…<br />
<strong>Fortis</strong> <strong>Healthcare</strong> (India) Limited