asia bond monitor - AsianBondsOnline - Asian Development Bank
asia bond monitor - AsianBondsOnline - Asian Development Bank
asia bond monitor - AsianBondsOnline - Asian Development Bank

You also want an ePaper? Increase the reach of your titles
YUMPU automatically turns print PDFs into web optimized ePapers that Google loves.
Asia Bond Monitor<br />
Table 1: Size and Composition of the LCY Bond Market in the People’s Republic of China<br />
Amount (billion) Growth Rates (%)<br />
Sep-10 Oct-10 Nov-10 Dec-10 Sep-10 Oct-10 Nov-10 Dec-10<br />
CNY USD CNY USD CNY USD CNY USD y-o-y q-o-q m-o-m m-o-m y-o-y q-o-q m-o-m<br />
Total 20,013 2,991 19,896 2,983 20,176 3,026 20,165 3,052 21.4 3.6 (0.6) 1.4 15.1 0.8 (0.1)<br />
Government 15,905 2,377 15,744 2,360 15,943 2,391 15,908 2,408 15.6 1.9 (1.0) 1.3 10.3 0.02 (0.2)<br />
Treasury Bonds 6,398 956 6,444 966 6,544 982 6,663 1,008 13.1 5.4 0.7 1.6 16.1 4.1 1.8<br />
Central <strong>Bank</strong> Bonds 4,442 664 4,208 631 4,232 635 4,085 618 10.5 (6.3) (5.3) 0.6 (3.5) (8.0) (3.5)<br />
Policy <strong>Bank</strong> Bonds 5,064 757 5,092 763 5,167 775 5,160 781 24.2 5.5 0.6 1.5 16.0 1.9 (0.1)<br />
Corporate 4,108 614 4,151 622 4,233 635 4,257 644 50.5 10.9 1.0 2.0 37.2 3.6 0.6<br />
Policy <strong>Bank</strong> Bonds<br />
China <strong>Development</strong> <strong>Bank</strong> 3,662 547 3,672 551 3,738 561 3,680 557 24.6 5.8 0.3 1.8 15.0 0.5 (1.5)<br />
Export–Import <strong>Bank</strong> of China 509 76 518 78 518 78 553 84 36.3 5.9 1.7 0.0 26.1 8.6 6.8<br />
Agricultural Dvt. <strong>Bank</strong> of China 892 133 902 135 912 137 927 140 16.5 4.1 1.1 1.1 14.3 3.9 1.7<br />
LCY = local currency, m-o-m = month on month, q-o-q = quarter on quarter, y-o-y = year on year.<br />
Notes:<br />
1.Calculated using data from national sources.<br />
2.Treasury <strong>bond</strong>s include savings <strong>bond</strong>s and local government <strong>bond</strong>s.<br />
3.Bloomberg LP end-of-period LCY–USD rate is used.<br />
4.Growth rates are calculated from LCY base and do not include currency effects.<br />
Source: ChinaBond and Bloomberg LP.<br />
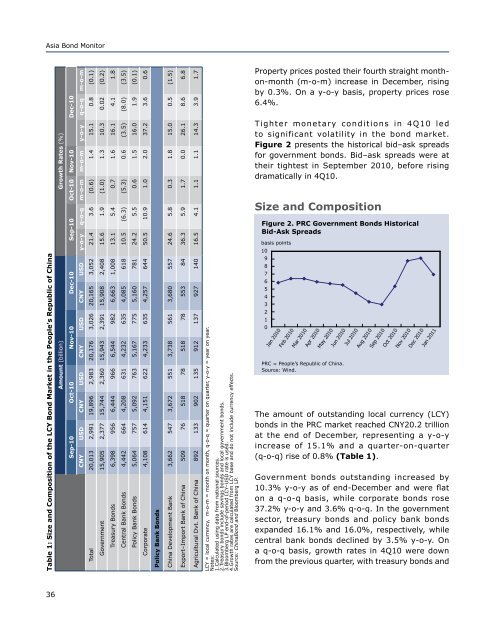
Property prices posted their fourth straight monthon-month<br />
(m-o-m) increase in December, rising<br />
by 0.3%. On a y-o-y basis, property prices rose<br />
6.4%.<br />
Tighter monetary conditions in 4Q10 led<br />
to significant volatility in the <strong>bond</strong> market.<br />
Figure 2 presents the historical bid–ask spreads<br />
for government <strong>bond</strong>s. Bid–ask spreads were at<br />
their tightest in September 2010, before rising<br />
dramatically in 4Q10.<br />
Size and Composition<br />
Figure 2. PRC Government Bonds Historical<br />
Bid-Ask Spreads<br />
basis points<br />
10<br />
9<br />
8<br />
7<br />
6<br />
5<br />
4<br />
3<br />
2<br />
1<br />
0<br />
Jan 2010<br />
Feb 2010<br />
Mar 2010<br />
Apr 2010<br />
May 2010<br />
Jun 2010<br />
PRC = People’s Republic of China.<br />
Source: Wind.<br />
Jul 2010<br />
Aug 2010<br />
Sep 2010<br />
Oct 2010<br />
Nov 2010<br />
Dec 2010<br />
Jan 2011<br />
The amount of outstanding local currency (LCY)<br />
<strong>bond</strong>s in the PRC market reached CNY20.2 trillion<br />
at the end of December, representing a y-o-y<br />
increase of 15.1% and a quarter-on-quarter<br />
(q-o-q) rise of 0.8% (Table 1).<br />
Government <strong>bond</strong>s outstanding increased by<br />
10.3% y-o-y as of end-December and were flat<br />
on a q-o-q basis, while corporate <strong>bond</strong>s rose<br />
37.2% y-o-y and 3.6% q-o-q. In the government<br />
sector, treasury <strong>bond</strong>s and policy bank <strong>bond</strong>s<br />
expanded 16.1% and 16.0%, respectively, while<br />
central bank <strong>bond</strong>s declined by 3.5% y-o-y. On<br />
a q-o-q basis, growth rates in 4Q10 were down<br />
from the previous quarter, with treasury <strong>bond</strong>s and<br />
36