Canadian Intelligent Super Corridor - Smart Inland Port Network
Canadian Intelligent Super Corridor - Smart Inland Port Network
Canadian Intelligent Super Corridor - Smart Inland Port Network

You also want an ePaper? Increase the reach of your titles
YUMPU automatically turns print PDFs into web optimized ePapers that Google loves.
January 2007<br />
<strong>Canadian</strong> <strong>Intelligent</strong> <strong>Super</strong> <strong>Corridor</strong> - <strong>Smart</strong> <strong>Inland</strong> <strong>Port</strong> <strong>Network</strong><br />
<strong>Canadian</strong> <strong>Intelligent</strong> <strong>Super</strong> <strong>Corridor</strong> (CISCOR)<br />
CISCOR <strong>Smart</strong> <strong>Inland</strong> <strong>Port</strong> <strong>Network</strong><br />
January 2007<br />
Business Case Report<br />
Copyright 2007: Saskatchewan Agrivision Corporation Inc.
January 2007<br />
<strong>Canadian</strong> <strong>Intelligent</strong> <strong>Super</strong> <strong>Corridor</strong> - <strong>Smart</strong> <strong>Inland</strong> <strong>Port</strong> <strong>Network</strong><br />
Acknowledgements<br />
Funding for this business case project was provided by Western Economic Diversification<br />
Canada, Saskatchewan Agriculture and Food, and the Saskatchewan Canola Development<br />
Commission.<br />
This project was administered by Saskatchewan Agrivision Corporation Inc. Guidance on this<br />
project was supplied by the Saskatchewan Trade and Export Partnership, Regina Regional<br />
Economic Development Authority, Moose Jaw Regional Economic Development Authority and<br />
the Saskatoon Regional Economic Development Authority.<br />
Special Thanks to:<br />
Ken Hoffman, Kansas City <strong>Smart</strong><strong>Port</strong><br />
This report was prepared by:<br />
John Vickerman, Principal<br />
Christopher Matson, Project Manager<br />
Shannon McLeod, Transportation Planner<br />
TranSystems Corporation Consultants<br />
150 Boush Street, Suite 1000,<br />
Norfolk, VA USA 23510<br />
Copyright 2007: Saskatchewan Agrivision Corporation Inc.
January 2007<br />
<strong>Canadian</strong> <strong>Intelligent</strong> <strong>Super</strong> <strong>Corridor</strong> - <strong>Smart</strong> <strong>Inland</strong> <strong>Port</strong> <strong>Network</strong><br />
Table of Contents<br />
Executive Summary - French....................................................................................................................E-1<br />
Executive Summary - English................................................................................................................. E-11<br />
Introduction .............................................................................................................................................IN-1<br />
Section 1: Global Industry Trends and Conditions................................................................................... 1-1<br />
Growth in Containerized Trade and Asian Market .................................................................. 1-1<br />
Increasing Vessel Size and Industry Consolidation ................................................................ 1-2<br />
Panama Canal Expansion ...................................................................................................... 1-3<br />
North American <strong>Port</strong> and Intermodal Congestion ................................................................... 1-3<br />
Driving Forces Behind <strong>Inland</strong> <strong>Port</strong> Development .................................................................... 1-5<br />
Section 2: <strong>Canadian</strong> Solution ................................................................................................................. 2-1<br />
<strong>Canadian</strong> Trade Partners and Statistics ................................................................................ 2-1<br />
<strong>Canadian</strong> <strong>Port</strong>s and Containerization Growth........................................................................ 2-2<br />
<strong>Canadian</strong> Railways and Intermodal Traffic ............................................................................ 2-7<br />
Canada’s Strategic Location................................................................................................ 2-10<br />
Pacific and Atlantic Gateway Strategies ............................................................................... 2-13<br />
Section 3: The Prairie Region – The Saskatchewan Advantage ............................................................. 3-1<br />
Benefits................................................................................................................................... 3-1<br />
Challenges.............................................................................................................................. 3-4<br />
Section 4: <strong>Canadian</strong> <strong>Intelligent</strong> <strong>Super</strong> <strong>Corridor</strong> <strong>Smart</strong> <strong>Port</strong> – Bringing It All Together ............................. 4-1<br />
Agile <strong>Port</strong> System ................................................................................................................... 4-2<br />
Logistic Management System................................................................................................. 4-2<br />
<strong>Inland</strong> <strong>Port</strong> Services................................................................................................................ 4-3<br />
Benefits to Carriers, <strong>Port</strong>s and Shippers................................................................................. 4-8<br />
Section 5: Case Studies .......................................................................................................................... 5-1<br />
Winnipeg, Manitoba................................................................................................................ 5-1<br />
CN Edmonton Grain Distribution Centre................................................................................. 5-3<br />
Kamloops Intermodal Container Facility ................................................................................. 5-4<br />
Northern Plains Commerce Centre......................................................................................... 5-5<br />
Minnesota North Star Rail Intermodal LLC ............................................................................. 5-6<br />
<strong>Inland</strong> International <strong>Port</strong> of Dallas........................................................................................... 5-8<br />
Section 6: Market Assessment ................................................................................................................ 6-1<br />
West Coast Trade Growth ...................................................................................................... 6-2<br />
<strong>Canadian</strong> Trans-Pacific Trade Flows...................................................................................... 6-3<br />
<strong>Smart</strong> <strong>Inland</strong> <strong>Port</strong> <strong>Network</strong> Potential Market and Prospective Throughput ............................. 6-5<br />
Section 7: Cost Analysis – A Business Case........................................................................................... 7-1<br />
Import Containerized Trade .................................................................................................... 7-1<br />
Containerization of Export Bulk Products ............................................................................... 7-2<br />
Conclusion, Recommendations and References................................................................................... CR-1<br />
Copyright 2007: Saskatchewan Agrivision Corporation Inc.
January 2007<br />
<strong>Canadian</strong> <strong>Intelligent</strong> <strong>Super</strong> <strong>Corridor</strong> - <strong>Smart</strong> <strong>Inland</strong> <strong>Port</strong> <strong>Network</strong><br />
Sommaire exécutif<br />
Les exportations et importations ont dépassé les 10 billions de dollars en 2005-06. La majorité des<br />
nouveaux navires porte-conteneurs sur les cinq prochaines années seront des navires post-Panamax<br />
prêts à transporter des marchandises de la Chine, du sud-est de l’Asie et de l’Inde vers des ports<br />
nord-américains déjà poussés à la limite de leur capacité. Le Canal panama approche son taux maximum<br />
d’opération et le réseau de transport américain se démène pour répondre à une augmentation annuelle<br />
prévue de 15% du trafic de contenants. En réponse à la croissance raide dans le commerce nordaméricain,<br />
les changements dans la chaîne d’approvisionnement mondiale de marchandises, et la<br />
congestion accrue dans les ports américains et le long du système multimodal, les expéditeurs redirigent<br />
maintenant de plus en plus de marchandises via les ports canadiens.<br />
La solution canadienne<br />
En tant que premier port d’escale nord-américain sur la route trans-Pacifique de l’Asie et la route trans-<br />
Atlantique de l’Europe, le Canada a l’occasion de développer un réseau sophistiqué de distribution<br />
multimodale pour desservir les zones de consommation croissantes dans le Midwest des États-Unis et au<br />
Canada. Le Canada peut servir de point de passage nord-américain au carrefour de trois réseaux de<br />
commerce puissants et itinérants : l’Accord de libre-échange nord-américain (ALENA) nord-sud, l’ALENA<br />
européen et la route trans-Pacifique hautement utilisée. Le résultat désiré est un corridor de transport de<br />
marchandises en direct qui transporte des marchandises des ports aux chemins de fer et autoroutes et<br />
vers un centre de logistique de port intérieur qui dessert tous les marchés nord-américains.<br />
Puisque les ports de Vancouver et de Prince Rupert sont situés sur la côte ouest du Canada, et que les<br />
ports de Halifax, du détroit de Canso et de Montréal sont sur la côté Est, il y a des avantages distincts en<br />
faveur d’une stratégie intégrée nationale multimodale pour le Canada en tant que nation. Ce pont terrestre<br />
transcontinental naissant et le port intérieur central judicieux pour desservir les marchés américains et<br />
canadiens des océans Atlantique et Pacifique seraient avantageux pour les ports impliqués, le chemin de<br />
fer et les lignes maritimes, les grands détaillants et la nation.<br />
Illustration SE-1. Réseau multimodal canadien<br />
Source: TranSystems, Association des chemins de fer du Canada<br />
Copyright 2007: Saskatchewan Agrivision Corporation Inc. E- 1
January 2007<br />
<strong>Canadian</strong> <strong>Intelligent</strong> <strong>Super</strong> <strong>Corridor</strong> - <strong>Smart</strong> <strong>Inland</strong> <strong>Port</strong> <strong>Network</strong><br />
La région des Prairies : les avantages de la Saskatchewan<br />
La Saskatchewan est le carrefour du transport de la partie nord du continent nord-américain, avec des liens<br />
dans toutes les directions. Son emplacement idéal et son accès central au réseau de logistique des<br />
marchandises font de la Saskatchewan un site idéal pour l’établissement d’un complexe portail intérieur<br />
prospère, loin des lieux de congestion.<br />
La proximité géographique de la province aux centres de population nord-américains, à moins de deux<br />
jours de route de 80 millions de personnes au Canada et aux États-Unis, est appuyée davantage par un<br />
commerce régional solide ainsi que des temps de transit et des frais d’expédition compétitifs. La province<br />
est branchée par une autoroute principale, un corridor multimodal qui encourage la croissance du<br />
commerce domestique et international. La Saskatchewan offre aussi l’accès à une main d’œuvre très<br />
productive et des entreprises du savoir avancées en génie du transport et dans les technologies de<br />
l’information (TI).<br />
Ces attributs, en plus de la disponibilité vaste de terrain et d’infrastructure à des prix modiques, ainsi qu’un<br />
climat d’investissement et d’affaires solide, font ensemble de la Saskatchewan un lieu de choix pour<br />
l’établissement d’un port intérieur le long d’un corridor intégré en Amérique du Nord.<br />
Autoroutes – La Saskatchewan est accessible par l’autoroute Yellowhead et l’autoroute transcanadienne<br />
n° 1, et se branche de façon centrale au corridor de transport CANAMEX et à l’autoroute de l’ALENA qui<br />
rejoint le Canada, les États-Unis et le Mexique.<br />
Chemin de fer – Les voies principales du Canadien National (CN) et du Chemin de fer Canadien Pacifique<br />
(CFPC) offrent un service de chemin de fer à deux niveaux, reliant ainsi la province à Vancouver, Toronto,<br />
Montréal, Chicago et à d’autres zones de consommation clé aux États-Unis. La Saskatchewan est le<br />
terminus canadien du chemin de fer CFPC/Soo Line, qui sert de corridor direct vers Chicago et la région du<br />
nord-est des États- Unis. De plus, la ligne ferroviaire sur courte distance de OmniTRAX offre un accès<br />
direct de la Saskatchewan au port de Churchill, et fournit un accès efficace à toutes les destinations nordaméricaines<br />
à travers le système de chemin de fer CN.<br />
Commerce – Le total de commerce mondial en Saskatchewan a augmenté de 102 pourcent au cours des<br />
dix dernières années. Depuis 2005, la Saskatchewan a fait l’expérience d’une augmentation de 13,8<br />
pourcent en exportation internationale et d’une augmentation de 8,2 pourcent en livraison manufacturière<br />
(Bureau des statistiques de la Saskatchewan).<br />
• La Saskatchewan est responsable actuellement pour près du tiers de l’énergie produite au Canada.<br />
• La Saskatchewan est le plus grand producteur de potasse au monde, et produit près la moitié de la<br />
demande sur le plan mondial.<br />
• La Saskatchewan produit 30 pourcent de la production totale d’uranium au monde, et est la seule<br />
région du Canada à produire de l’uranium.<br />
• Le Canada est le plus grand exportateur de lentilles au monde, et la Saskatchewan produit 95 pourcent<br />
de la production totale au Canada.<br />
Main d’oeuvre – La main d’œuvre de la province compte parmi les meilleures éduquées du pays ; environ<br />
60 pourcent de la province a suivi une formation post-secondaire. Les taux salariaux sont aussi plus<br />
concurrentiels que ceux de la Colombie-Britannique et de l’Alberta.<br />
Copyright 2007: Saskatchewan Agrivision Corporation Inc. E- 2
January 2007<br />
<strong>Canadian</strong> <strong>Intelligent</strong> <strong>Super</strong> <strong>Corridor</strong> - <strong>Smart</strong> <strong>Inland</strong> <strong>Port</strong> <strong>Network</strong><br />
Technologie – Au cours des dix dernières années, la Saskatchewan a établi des partenariats avec des<br />
experts de l’industrie et d’autres entreprises pour établir des centres de transfert des technologies<br />
innovatrices en vue d’appuyer la recherche et la commercialisation de nouvelles technologies. La province<br />
sert de centre des opérations et appuie les industries et initiatives technologiques suivantes :<br />
• Deux des entreprises du savoir avancées en génie du transport et dans les technologies de<br />
l’information, International Road Dynamics et la Massload Technologies Corporation.<br />
• Des entreprises de TI et des firmes de recherche et de logistique : Axon Development Corporation,<br />
Clevor Technologies, Integrated Designs, Numa Technologies, et la Technology Management<br />
Corporation, LMS Logistics, Ghost Transportation Services, et le centre des ports à conteneurs Yanke.<br />
• Innovation Place à Saskatoon – un des parcs de recherche les plus grands et les plus avancés de<br />
l’Amérique du Nord en pharmaceutique, bioressources et sur l’environnement.<br />
• Le parc de recherches provincial, Regina Research Park – l’un des parcs de recherche les plus récents<br />
au Canada, dont la spécialisation porte sur l’industrie pétrolière, les technologies de l’information et les<br />
sciences de l’environnement.<br />
• SR Net – un consortium de réseau et une largeur de bande de recherche à très haute puissance,<br />
branchée dans un réseau de distribution informatique fort.<br />
Investissement – En 2005, plus de 7,8 milliards de dollars en nouveaux investissements capitaux ont été<br />
investis dans des projets en Saskatchewan, une augmentation de 4,6 pourcent du total en 2004. Plus de<br />
75 pourcent de cet investissement provenait du secteur privé en vue d’agrandir, moderniser et construire<br />
de nouvelles installations dans la province.<br />
Taxes d’affaires – En avril 2006, le gouvernement de la Saskatchewan a donné son approbation pour les<br />
plus grandes coupures aux taxes d’affaires dans l’histoire de la province, rendant ainsi la Saskatchewan<br />
l’une des juridictions les plus concurrentielles au Canada.<br />
Avantage concurrentiel - En 2006, KPMG, une firme de consultation, a publié un rapport qui compare le<br />
coût de faire affaire dans 128 villes de neuf pays en fonction du coût des intrants pour la main d’œuvre, la<br />
taxation, les installations (terrain, construction, coûts de location). Parmi les villes canadiennes étudiées,<br />
les quatre villes de la Saskatchewan (Saskatoon, Regina, Prince Albert et Moose Jaw) se plaçaient audessus<br />
de l’indice canadien et en meilleure position que Calgary, Winnipeg et Kamloops. Saskatoon a<br />
aussi été classé comme juridiction la moins coûteuse parmi les 21 villes en question du Midwest de<br />
l’Amérique du Nord (KPMG 2005)<br />
La réalisation du projet<br />
Le développement et la promotion d’un réseau de port intérieur intelligent au centre de la Saskatchewan et<br />
un <strong>Super</strong> corridor intelligent du Canada (CISCOR), y compris des activités de chaîne d’approvisionnement<br />
basés à l’intérieur, loin des zones actuelles de congestion, assureront que le Canada ait l’infrastructure<br />
nécessaire en place pour améliorer la compétitivité et tirer avantage des opportunités croissantes du<br />
marché mondial.<br />
Copyright 2007: Saskatchewan Agrivision Corporation Inc. E- 3
January 2007<br />
<strong>Canadian</strong> <strong>Intelligent</strong> <strong>Super</strong> <strong>Corridor</strong> - <strong>Smart</strong> <strong>Inland</strong> <strong>Port</strong> <strong>Network</strong><br />
Le Réseau de port intérieur intelligent CISCOR en Saskatchewan servirait de plaque tournante de<br />
coordination centrale, joignant le corridor est-ouest canadien (CISCOR) avec le grand corridor nord-sud<br />
nord-américain (NASCO), le corridor entre le Canada et le Mexique (CANAMEX) et la River of Trade<br />
<strong>Corridor</strong> Coalition (ROTCC). Le port intérieur servirait de port intelligent, fournirait des services physiques<br />
de port intérieur et irait se joindre avec et fournirait de l’appui intelligent à des installations de chargement<br />
des conteneurs à travers le réseau nord-américain.<br />
Comme port intelligent, des services de gestion de chaînes d’approvisionnement à valeur ajoutée<br />
assureraient que les cargaisons soient acheminées efficacement, économiquement et à temps, en fonction<br />
de la stratégie de entre le Canada et les Etats-Unis serait atteint grâce à l’intégration de services<br />
d’informations et de sécurité à la fine pointe de la technologie pour l’échange de données de transport et<br />
d’échange.<br />
Il est recommandé que le Réseau de port intérieur intelligent CISCOR, qui offre et coordonne les services<br />
et installations suivants :<br />
• les zones de libre échange ;<br />
• les entrepôts de distribution ;<br />
• le dédouanement ;<br />
• les opérations de transbordement ;<br />
• la gestion de conteneurs vides ; et<br />
• un centre de logistique avancée qui emploie des systèmes d’informations d’échange à la fine pointe de<br />
la technologie.<br />
Avantages<br />
Ce complexe de port intérieur sera avantageux pour les transporteurs ferroviaires commerciaux et les<br />
lignes d’expédition, les ports nationaux et le personnel des ports privés, d’autres installations de<br />
chargement, les propriétaires des cargaisons (d’importation ou d’exportation), ainsi que tous les niveaux du<br />
gouvernement du Canada. Ces avantages dépendent de la création d’une plaque tournante de port<br />
intérieur intelligent qui répondrait aux besoins de tous les intervenants et développerait une base<br />
d’expédition suffisamment grande pour soutenir une masse critique d’opération. Le volume de cargaison<br />
est la clé de la viabilité d’un port intérieur, son élément d’attrait pour les intervenants et ses avantages<br />
potentiels en termes de coût, d’efficacité, d’accessibilité, de service et de fiabilité.<br />
Copyright 2007: Saskatchewan Agrivision Corporation Inc. E- 4
January 2007<br />
<strong>Canadian</strong> <strong>Intelligent</strong> <strong>Super</strong> <strong>Corridor</strong> - <strong>Smart</strong> <strong>Inland</strong> <strong>Port</strong> <strong>Network</strong><br />
Transporteurs ferroviaires<br />
• Attrait potentiel d’au moins 130 000 EVP par année de cargaisons importées de l’Asie qui recherchent<br />
des routes alternatives vers le cœur de l’Amérique du Nord, un chiffre qui augmentera avec le temps.<br />
• Attrait potentiel d’au moins 130 000 EVP par année de cargaisons d’exportation recherchant des<br />
routes surtout vers les marchés de l’Asie Pacifique, un chiffre qui augmentera avec le temps.<br />
• La capacité de remplir des contenants destinés à être expédiés vers l’Ouest et des wagons<br />
multimodaux destinés à être expédiés vers l’Ouest avec une cargaison à revenu qui ne serait pas<br />
autrement retournée, augmentant ainsi la capacité en raison d’une meilleure utilisation des actifs et<br />
d’un nombre réduit de déplacements non productifs.<br />
• Un service plus fréquent et à l’heure pour les clients à courte distance, les destinations à faible taux de<br />
volume, et les destinations américaines à l’ouest des plaques tournantes du chemin de fer américain,<br />
ainsi que des nouveaux services aux clients locaux, de l’ALENA et internationaux.<br />
Lignes d’expédition<br />
• Le dédouanement automatisé pour réduire les arrêts temporisés et permettre les passages spéciaux à<br />
haute vitesse à la frontière.<br />
• Des services consolidés de données à valeur ajoutée et un cadre de professionnels de gestion de<br />
données à l’intérieur d’une seule plaque tournante de logistique d’information pour servir le <strong>Super</strong><br />
corridor intelligent du Canada.<br />
• Attirer des cargaisons de cargaisons de retour à revenu, à l’aide d’une gestion intelligente du<br />
déploiement et du positionnement de conteneurs vides.<br />
<strong>Port</strong>s<br />
• Un service de livraison plus rapide pour les conteneurs, qui seront entreposés, classés ou transbordés<br />
en Saskatchewan. Cela aidera à augmenter de débit des installations de port de mer existantes.<br />
• Recouvrement de terrain de port de mer critique pour l’offre de fonctions de port essentielles et pour<br />
réduire le besoin d’infrastructure locale additionnelle.<br />
• Avantage compétitif envers les ports américains rivaux grâce à une gestion efficace du transport<br />
terrestre, contribuant ainsi à augmenter davantage la concentration de cargaisons.<br />
Expéditeurs<br />
• Une source abordable de chargement de produits d’exportation, contrairement à la conteneurisation au<br />
port.<br />
• Produits d’exportation nécessitant une « préservation de l’identité » qui peut être obtenue par<br />
l’emballage ou la mise en conteneur en Saskatchewan sans mélange de produits d’origine d’ailleurs.<br />
• De meilleures options de logistique augmentant l’efficacité et la productivité des actifs existants<br />
d’infrastructure de chemin de fer.<br />
Le gouvernement canadien et la Province de la Saskatchewan<br />
• La croissance et le développement d’occasions d’affaires sur le plan local, incités par la présence d’un<br />
centre de cargaisons à proximité, y compris l’entreposage et la distribution commerciales, les services<br />
de maintien des équipements, les services de transport et des services de logistique auxiliaires.<br />
• La diversification de l’économie vers d’autres secteurs industriels en vue d’éviter les baisses cycliques<br />
qui ont lieu dans la plupart des secteurs industriels menés par les produits de base.<br />
• Une augmentation des revenus d’impôts en raison de nouveaux reçus d’affaires et de paie.<br />
Copyright 2007: Saskatchewan Agrivision Corporation Inc. E- 5
January 2007<br />
<strong>Canadian</strong> <strong>Intelligent</strong> <strong>Super</strong> <strong>Corridor</strong> - <strong>Smart</strong> <strong>Inland</strong> <strong>Port</strong> <strong>Network</strong><br />
Évaluation du marché<br />
La viabilité des installations de port intérieur intelligent proposées pour la Saskatchewan dépend, en partie<br />
du volume de chargements qui y passeraient. La demande pour un système de port intérieur coordonné<br />
en Saskatchewan viendrait d’abord des marchés multimodaux du Canada et des Etats-Unis. Une des<br />
difficultés de l’estimation du trafic potentiel est que le montant de trafic dépend des taux et des niveaux de<br />
service, éléments inconnus chez de nouvelles installations. Pour identifier le flux de chargements vers et<br />
en provenance des provinces contenant des ports importants (Colombie-Britannique, Québec, etc.) Selon<br />
les statistiques d’échange, les connaissances de l’industrie et d’autres analyses quantitatives, il a été<br />
déterminé que l’analyse devrait se concentrer sur le marché trans-Pacifique et sur le marché de l’ALENA<br />
car celles-ci présenteraient les meilleures opportunités, à la fois de la perspective du volume et de la<br />
croissance future.<br />
Tableau SE-1 : Sommaire de la conteneurisation future de l’exportation de la Saskatchewan vers l’Asie (données de<br />
2004-2005)<br />
Tonnes Part EVP EVP<br />
Exportation de produits agricoles de base 4 865 369 29 % 69 373<br />
Exportation de produits agricoles traités 512 979 100 % 29 020<br />
Exportation de potasse 3 147 870 5 % 9 258<br />
Exportation de pâtes et papier 108 639 50 % 2 173<br />
Total des exportations dans l’analyse 8 634 856 25 % 109 824<br />
Tableau SE-2 : Sommaire de la conteneurisation future de l’exportation de la Saskatchewan vers l’ALENA (données de<br />
2004-2005)<br />
Tonnes Part EVP EVP<br />
Exportation de produits agricoles de base 1 325 724 18 % 11 877<br />
Exportation de produits agricoles traités 754 927 100 % 45 783<br />
Exportation de potasse 5 437 230 5 % 15 992<br />
Exportation de pâtes et papiers 286 411 25 % 2 864<br />
Exportation totale dans l’analyse 7 804 293 20 % 76 516<br />
Tableau SE-3: Marché potentiel du réseau de port intérieur intelligent CISCOR<br />
EVP EVP – 30 % EVP + 10 %<br />
Vers l’Asie 109 824 76 877 120 807<br />
De l’Asie 1 109 824 76 877 120 807<br />
Vers l’ALENA 76 516 53 561 84 168<br />
De l’ALENA 1 76 516 53 561 84 168<br />
Débit total 372 681 260 877 409 949<br />
(1) Tient pour acquis que les lignes d’expédition chercheront à maintenir un débit balancé, où chaque chargement d’exportation<br />
sera équilibré avec un chargement d’importation.<br />
Copyright 2007: Saskatchewan Agrivision Corporation Inc. E- 6
January 2007<br />
<strong>Canadian</strong> <strong>Intelligent</strong> <strong>Super</strong> <strong>Corridor</strong> - <strong>Smart</strong> <strong>Inland</strong> <strong>Port</strong> <strong>Network</strong><br />
Il est raisonnable d’assumer que les lignes d’expédition du port intérieur auraient au minimum un débit<br />
équilibré, c’est-à-dire qu’un conteneur arrêté au port intérieur doit arrimer un chargement d’exportation.<br />
Dans ce cas, la taille estimée du marché annuel vers l’intérieur se chiffrerait vers 130 000 à 205 000 EVP<br />
selon les estimés des exportations actuellement disponibles dont l’origine est la Saskatchewan. En se<br />
basant sur cette approche, le port intérieur aurait un débit total de 260 000 à 410 000 EVP par année, ce<br />
qui comprend des importations et exportations asiatiques et des importations et exportations nordaméricaines.<br />
Un facteur qui risque d’encourager les lignes d’expédition à arrêter les conteneurs destinées vers l’intérieur<br />
au port intérieur serait la capacité de retourner rapidement les conteneurs vides vers l’Asie pour des<br />
chargements d’importation à plus grand revenu. De plus, la capacité de transbordement des produits<br />
d’exportation de partout au Canada et du coin nord-est des États-Unis avec des capacités intelligentes<br />
pour le dédouanement est un avantage de plus. Ainsi, le potentiel total de débit pourrait dépasser 500 000<br />
EVP, en tenant pour acquis que le coût, le transport et les conditions de service soient en place pour faire<br />
du port intérieur intelligent une installation viable de distribution, de transbordement et de dédouanement<br />
pour les expéditeurs, les lignes de transport et les chemins de fer.<br />
Selon l’expérience du port intelligent de Kansas City, inclure une zone de libre échange près des<br />
installations de port intérieur pourrait créer un nouveau centre compétitif de fabrication, de distribution et<br />
d’échange, ce qui améliorera les produits composants destinés pour l’intérieur et les produits fabriqués<br />
destinés vers l’extérieur (exportés à nouveau).<br />
Analyse de coût<br />
Un des aspects importants dans la détermination de la faisabilité d’un système coordonné de port intérieur<br />
en Saskatchewan consiste à évaluer si le port serait compétitif avec les options existantes de transport.<br />
Une connexion multimodale vers le Midwest, surtout Chicago, représenterait l’une des meilleures<br />
opportunités pour un port intérieur CISCOR proposé. Cette analyse de coût examinerait les coûts actuels<br />
de transport par camion et par chemin de fer entre le <strong>Port</strong> de Vancouver et Chicago. Ces coûts sont<br />
comparés aux coûts estimés pour le transport de marchandises via le port intérieur en Saskatchewan.<br />
Le Tableau SE-4 démontre que l’utilisation d’un port intérieur impose un coût supplémentaire de 400 $ pour<br />
le transbordement pour chaque conteneur de 40 pieds. Cependant, ces estimés simplifiés ne considèrent<br />
pas le potentiel de recouvrir ces coûts à d’autres endroits dans la chaîne d’alimentation, tels que dans la<br />
réduction de déplacements sans revenu en chargeant les conteneurs vides avec des marchandises<br />
locales, une meilleure gestion de l’inventaire ou un prix compétitif pour l’envoi de nombres considérables<br />
de conteneurs à destination et en provenance du port intérieur.<br />
Copyright 2007: Saskatchewan Agrivision Corporation Inc. E- 7
January 2007<br />
<strong>Canadian</strong> <strong>Intelligent</strong> <strong>Super</strong> <strong>Corridor</strong> - <strong>Smart</strong> <strong>Inland</strong> <strong>Port</strong> <strong>Network</strong><br />
Tableau SE-4. Comparaison des coûts estimés d’un conteneur international en transbordement dans un port intelligent<br />
versus la livraison directe.<br />
Dollars canadiens Vancouver -<br />
Saskatchewan<br />
Vancouver -<br />
Saskatchewan<br />
Vancouver –<br />
Chicago<br />
- Chicago<br />
- Chicago<br />
Mode de transport Chemin de fer Chemin de fer et Chemin de fer<br />
camion<br />
Coût par conteneur de 40 pieds 1<br />
Chemin de fer multimodal 1 400 $ 1 400 $ 2 200 $<br />
Coûts de levage/charrette 50 $ 50 $<br />
Transbordement intérieur 350 $ 350 $<br />
Coûts de levage/charrette 50 $ -<br />
Chemin de fer multimodal 2 800 $ -<br />
Camion 3 - 1 000 $<br />
Charrette de destination 4 120 $ - 175 $<br />
Coût total par conteneur de 40 2 770 $ 2 800 $ 2 375 $<br />
pieds<br />
(1) Les taux ne comprennent pas le supplément carburant.<br />
(2) Tient pour acquis le transbordement de trois conteneurs de 40 pieds vers deux conteneurs domestiques ; le taux par<br />
conteneur domestique est de 1 200 $ chacun.<br />
(3) Tient pour acquis le transbordement de trois conteneurs de 40 pieds vers deux remorques domestiques ; le taux par<br />
remorque domestique est de 1 500 $ chacune.<br />
(4) Tient pour acquis le transbordement de trois conteneurs de 40 pieds vers deux conteneurs domestiques, et un taux de<br />
charrette sur place de 175 $.<br />
L’analyse tient aussi compte de l’épargne dans la conteneurisation des produits en vrac pour exportation<br />
au port intérieur. La tendance mondiale favorisant la conteneurisation des produits de base en vrac reflète<br />
l’établissement d’un équilibre entre les taux d’expédition en vrac et par conteneur, les temps plus courts<br />
pour la livraison multimodale, et un plus grand souci de la qualité du produit et de la sécurité de la<br />
cargaison. Le tableau SE-5 indique que le chargement à la source des conteneurs a un coût inférieur<br />
l’expédition de produits par wagon-trémie au port suivi du transbordement dans des conteneurs au port.<br />
Copyright 2007: Saskatchewan Agrivision Corporation Inc. E- 8
January 2007<br />
<strong>Canadian</strong> <strong>Intelligent</strong> <strong>Super</strong> <strong>Corridor</strong> - <strong>Smart</strong> <strong>Inland</strong> <strong>Port</strong> <strong>Network</strong><br />
Tableau SE-5 : Analyse des coûts de transport pour expéditeurs<br />
Source chargée aux<br />
points en Saskatchewan<br />
Chargé au port, origine<br />
en Saskatchewan<br />
Charrette d’origine 430 $ -<br />
Chemin de<br />
fer/wagontrémie<br />
- 3 550 $<br />
Chemin de<br />
fer/conteneur<br />
1 100 $* 890 $**<br />
Charrette de<br />
destination<br />
- 230 $<br />
Empotage - 545 $<br />
Total par<br />
contenant<br />
1 530 $ 1 665 $<br />
Différence - +9 %<br />
*Basé sur 90 MT par wagon-trémie, l’équivalent de quatre conteneurs de 20 pieds à 22,5 MT par conteneur.<br />
** Taux équivalent par contenant basé sur quatre chargements de conteneur par wagon-trémie.<br />
Source : « Container Measures Study: Issues and Discussion for Proposed Measures for the Grain<br />
Monitoring Program » Juin 2006, Gouvernement du Canada<br />
Conclusion<br />
L’étude a identifié une occasion viable de développer des installations de port intérieur intelligent en<br />
Saskatchewan, à condition que certaines conditions critiques soient présentées :<br />
• Une masse critique de cargaisons, à la fois des importations destinées vers l’intérieur pour la<br />
distribution, et des exportations destinées vers l’extérieur, doit être développée en Saskatchewan.<br />
Cela comprend le transbordement et la distribution de produits importés pour le marché nordaméricain,<br />
ainsi que le chargement des conteneurs vides avec des produits locaux et transbordés<br />
destinés à l’exportation.<br />
• Un volume suffisant de wagons de chemin de fer doit être présent au port intérieur intelligent pour<br />
justifier des trains spécialisés à destination et en provenance de la côte nord-ouest du Pacifique.<br />
• Le port intérieur doit offrir des services de logistiques attrayants, à valeur ajoutée pour motiver la<br />
communauté d’expédition et créer un avantage compétitif intelligent distinct en comparaison avec les<br />
modes conventionnels de distribution de cargaisons.<br />
• L’économie du port intérieur doit être attrayant pour les intérêts des opérateurs, des investisseurs et de<br />
l’expédition.<br />
Copyright 2007: Saskatchewan Agrivision Corporation Inc. E- 9
January 2007<br />
<strong>Canadian</strong> <strong>Intelligent</strong> <strong>Super</strong> <strong>Corridor</strong> - <strong>Smart</strong> <strong>Inland</strong> <strong>Port</strong> <strong>Network</strong><br />
Lorsqu’on aura répondu à ces critères, le port intérieur de la Saskatchewan deviendra une partie viable du<br />
réseau multimodal et engendrera des avantages compétitifs importants :<br />
• Développement d’un portail national viable et sécuritaire, compétitif et à la fine pointe de la technologie.<br />
• Amélioration et exécution du pont terrestre multimodal naissant au Canada (<strong>Super</strong> corridor intelligent<br />
canadien, ou CISCOR).<br />
• Intégration de services de technologies de l’information avant-gardiste pour les fournisseurs de<br />
transport en vue d’atteindre l’excellence en chaîne d’approvisionnement, et permettant un contrôle<br />
maximal des cargaisons de bout en bout.<br />
• Création de zones de libre-échange pour attirer les fabricants pour la réexportation.<br />
• Stimulation d’occasions d’importation et d’exportation asiatiques additionnelles pour le Canada et le<br />
nord-ouest des États-Unis.<br />
• Établissement d’échange par la consolidation et la conteneurisation de cargaisons d’importation et<br />
d’exportation à des centres d’entreposage et de logistique au port intérieur.<br />
• Établissement d’installations terminales incultes, « prêtes pour l’avenir », qui intègrent des<br />
équipements à la fine pointe de la technologie et les avances technologiques prêts à réagir aux défis<br />
de port et multimodaux d’aujourd’hui et de demain.<br />
Pour réaliser la promesse de l’initiative de développement d’un port intérieur en Saskatchewan servant de<br />
noyau au <strong>Super</strong> corridor intelligent du Canada, les étapes de faisabilité suivantes devraient être<br />
entreprises :<br />
• Commencer une réforme législative ;<br />
• Effectuer une analyse en détail du marché et une étude de développement ;<br />
• Vérifier les coûts de l’équipement et de la construction capitale ;<br />
• Quantifier les coûts d’opération et les retours prévus ;<br />
Copyright 2007: Saskatchewan Agrivision Corporation Inc. E- 10
Executive Summary<br />
January 2007<br />
<strong>Canadian</strong> <strong>Intelligent</strong> <strong>Super</strong> <strong>Corridor</strong> - <strong>Smart</strong> <strong>Inland</strong> <strong>Port</strong> <strong>Network</strong><br />
Global merchandise exports and imports exceeded the $10 trillion mark in 2005-06. A majority of the<br />
new containerships entering the world fleet in the next five years will be post-Panamax vessels<br />
ready to transport cargo from China, Southeast Asia and India to North American ports already<br />
strained by capacity limits. The Panama Canal is approaching operational capacity and the U.S.<br />
transportation network is struggling to meet the predicted 15 percent annual rise in Asian container traffic.<br />
In response to the rapid growth in North American trade, the shift in the global freight supply chain, and the<br />
increased congestion at U.S. ports and along the intermodal system, shippers are now routing a growing<br />
share of cargo via <strong>Canadian</strong> ports.<br />
<strong>Canadian</strong> Solution<br />
As the first North American port of call on the trans-Pacific route from Asia and the trans-Atlantic route from<br />
Europe, Canada has an opportunity to develop a sophisticated intermodal distribution network to serve the<br />
growing U.S. Midwest and <strong>Canadian</strong> consumption zones. Canada can serve as the North American<br />
gateway at the intersection of three powerful and shifting trade networks—the north-south North American<br />
Free Trade Agreement (NAFTA), the European-NAFTA, and the highly-utilized trans-Pacific route. The<br />
desired result is a fully-integrated, seamless cargo transport corridor moving cargo from the ports to rail and<br />
highways and to an inland port logistics centre that serves all North American markets.<br />
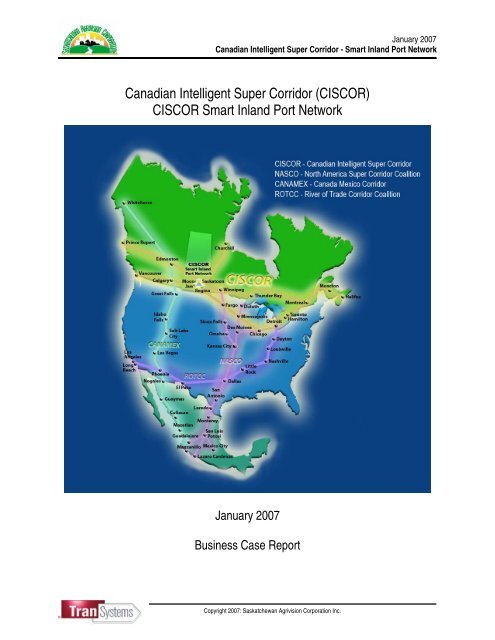
Since the Vancouver and Prince Rupert ports are located on the West Coast of Canada, and Halifax, Strait<br />
of Canso and Montreal ports are on the East Coast, there are distinct advantages in promoting the<br />
development of an integrated national intermodal strategy for Canada as a nation. This emerging<br />
transcontinental land bridge and a central smart inland port to serve <strong>Canadian</strong> and U.S. markets from<br />
Pacific to Atlantic oceans would benefit the ports involved, the rail and shipping lines, the large retailers and<br />
the nation.<br />
Figure ES-1. <strong>Canadian</strong> Intermodal <strong>Network</strong><br />
Source: TranSystems, Railway Association of Canada<br />
Copyright 2007: Saskatchewan Agrivision Corporation Inc. E- 11
January 2007<br />
<strong>Canadian</strong> <strong>Intelligent</strong> <strong>Super</strong> <strong>Corridor</strong> - <strong>Smart</strong> <strong>Inland</strong> <strong>Port</strong> <strong>Network</strong><br />
The Prairie Region – The Saskatchewan Advantage<br />
Saskatchewan is the transportation crossroads of the northern half of the North American continent with<br />
linkages to the four points of the compass. Its optimal location and central access to the freight logistics<br />
network makes Saskatchewan an ideal site for a thriving inland cargo gateway complex away from<br />
congestion points.<br />
The province’s geographic proximity to North American population centres, within two days travel from 80<br />
million people in Canada and the U.S., is further supported by strong regional trade and competitive transit<br />
times and shipping rates. The province is connected by a principal highway and intermodal corridor that<br />
supports growth in domestic and international trade. Saskatchewan also offers access to a highly<br />
productive labour market and advanced intelligent transportation engineering and information technology<br />
(IT) companies.<br />
These features, together with broad availability of land and infrastructure at advantageous cost, and a<br />
strong investment and business climate, combine to confirm that Saskatchewan is the location of choice for<br />
an inland port along an integrated North American corridor.<br />
Highways - Saskatchewan is accessed by the Yellowhead Highway and Trans-Canada Highway #1 and is<br />
centrally linked to the CANAMEX transportation corridor and NAFTA <strong>Super</strong>highway connecting Canada,<br />
the U.S. and Mexico.<br />
Rail - <strong>Canadian</strong> National (CN), <strong>Canadian</strong> Pacific Railroad (CPR) main lines run double-stack rail service<br />
through Saskatchewan, linking the province to Vancouver, Toronto, Montreal, Chicago and other key<br />
consumption zones in the U.S. Saskatchewan is the <strong>Canadian</strong> terminus of the CPR/Soo Line, which is a<br />
direct corridor to Chicago and the U.S. northeast. In addition, the OmniTRAX short line provides direct<br />
access to the <strong>Port</strong> of Churchill from Saskatchewan, and provides efficient access to all North American<br />
points through the CN railway system.<br />
Trade - Total world trade from Saskatchewan has risen by 102 percent over the last decade. In 2005,<br />
Saskatchewan experienced a 13.8 percent increase in international exports and an 8.2 percent increase in<br />
manufacturing shipments (Saskatchewan Bureau of Statistics).<br />
• Saskatchewan currently accounts for nearly one-third of the energy produced in Canada.<br />
• Saskatchewan is the largest producer of potash in the world, providing nearly one-half of the total<br />
global demand.<br />
• Saskatchewan supplies 30 percent of the world’s output of uranium and is the only jurisdiction that<br />
produces uranium in Canada.<br />
• Canada is the largest lentil exporter in the world, and Saskatchewan produces 95 percent of Canada’s<br />
total production.<br />
Labour force –The province’s workforce is one of the best educated in the country with approximately 60<br />
percent of employees having some post-secondary education. Wage rates are also more competitive than<br />
British Columbia and Alberta.<br />
Copyright 2007: Saskatchewan Agrivision Corporation Inc. E- 12
January 2007<br />
<strong>Canadian</strong> <strong>Intelligent</strong> <strong>Super</strong> <strong>Corridor</strong> - <strong>Smart</strong> <strong>Inland</strong> <strong>Port</strong> <strong>Network</strong><br />
Technology – In the past decade, Saskatchewan has partnered with industry experts and other<br />
enterprises to establish innovative technology transfer centres to assist in research and the<br />
commercialization of new technology. The province serves as the centre of operations and supports the<br />
following technological industries and initiatives:<br />
• Two of the most successful intelligent systems transportation engineering, IT and design companies in<br />
Canada - International Road Dynamics and Massload Technologies Corporation.<br />
• IT companies and research and logistics firms - Axon Development Corporation, Clevor Technologies,<br />
Integrated Designs, Numa Technologies, and Technology Management Corporation, LMS Logistics,<br />
Ghost Transportation Services, and Yanke Container <strong>Port</strong> Centre.<br />
• Innovation Place in Saskatoon - one of North America’s largest and most advanced research parks for<br />
pharmaceuticals, bio-resources, and the environment.<br />
• The Regina Research Park - one of Canada’s newest research parks specializing in petroleum,<br />
information technology and environmental sciences.<br />
• SR Net - an extremely high-powered research bandwidth and networking consortium, plugged into a<br />
powerful distributed grid computing network.<br />
Investment - In 2005, over $7.8 billion in new capital investment poured into Saskatchewan projects, up by<br />
4.6 percent from the level in 2004. More than 75 percent of that investment came from the private sector to<br />
expand, modernize and build new facilities in the province.<br />
Business taxes - In April 2006, the Government of Saskatchewan approved the largest business tax cuts<br />
in the province’s history, making Saskatchewan one of the most tax-competitive jurisdictions in Canada.<br />
Competitive advantage - In 2006, the international consulting firm KPMG released a report that compares<br />
the cost of doing business in 128 cities in nine countries based on input costs for labour, taxation, facilities<br />
(land, construction, leasing rates), transportation, utilities, depreciation, and financing (interest costs).<br />
Among the <strong>Canadian</strong> cities studied in the report, the four Saskatchewan cities (Saskatoon, Regina, Prince<br />
Albert and Moose Jaw) rated better than the <strong>Canadian</strong> index and ahead of Calgary, Winnipeg and<br />
Kamloops. Saskatoon was also ranked the lowest-cost jurisdiction among the 21 featured cities from the<br />
North American Midwest (KPMG 2005)<br />
Bringing It All Together<br />
The development and promotion of a <strong>Smart</strong> <strong>Inland</strong> <strong>Port</strong> <strong>Network</strong> in central Saskatchewan and associated<br />
<strong>Canadian</strong> <strong>Intelligent</strong> <strong>Super</strong> <strong>Corridor</strong> (CISCOR) - including a more efficient inland-based supply chain<br />
activity away from current congestion points - will ensure that Canada has the necessary infrastructure in<br />
place to improve competitiveness and take advantage of the growing opportunities in world trade.<br />
The CISCOR <strong>Smart</strong> <strong>Inland</strong> <strong>Port</strong> <strong>Network</strong> in Saskatchewan would serve as the central coordination hub,<br />
connecting the <strong>Canadian</strong> east-west corridor (CISCOR) with the major North American north-south corridor<br />
– the North America <strong>Super</strong><strong>Corridor</strong> (NASCO), the Canada Mexico <strong>Corridor</strong> (CANAMEX) and the River of<br />
Trade <strong>Corridor</strong> Coalition (ROTCC). The inland port would function as an intelligent “smart port”, provide<br />
physical inland port functions and connect with and provide intelligent support to container loading facilities<br />
throughout the North American network.<br />
Copyright 2007: Saskatchewan Agrivision Corporation Inc. E- 13
January 2007<br />
<strong>Canadian</strong> <strong>Intelligent</strong> <strong>Super</strong> <strong>Corridor</strong> - <strong>Smart</strong> <strong>Inland</strong> <strong>Port</strong> <strong>Network</strong><br />
As a “smart port”, value-added supply chain management services would ensure that shipments are<br />
executed efficiently, economically, on time, and according to each customer’s logistics strategy. The<br />
seamless and timely clearance of international shipments between Canada and the U.S. would be<br />
achieved through the integration of leading-edge information and security technology services for the<br />
exchange of transportation and trade data.<br />
It is recommended that the CISCOR <strong>Smart</strong> <strong>Inland</strong> <strong>Port</strong> <strong>Network</strong> offer and coordinate the following services<br />
and facilities:<br />
• free trade zones,<br />
• distribution warehouses,<br />
• customs clearance,<br />
• transload operations,<br />
• empty container management and<br />
• advanced logistics centre employing state-of-the-art trade information systems.<br />
Benefits<br />
This inland port complex will benefit the commercial rail carriers and shipping lines, the national ports and<br />
private port operators, other loading facilities across the CISCOR network, the cargo owners (both import<br />
and export) plus all levels of government within Canada. These benefits are contingent on creating a smart<br />
inland port hub that would fulfill the needs of all of the stakeholders and develop a large enough cargo base<br />
to sustain a critical mass of operation. Shipment volume is the key to the viability of an inland port, its<br />
attractiveness to the stakeholders and its potential benefits in cost, efficiency, accessibility, service and<br />
reliability.<br />
Rail carriers<br />
• Potential capture of at least 130,000 TEU per year of import cargo from Asia that are seeking<br />
alternative routes into the heartland of North America, which will increase over time.<br />
• Potential capture of at least 130,000 TEU per year of export cargo that is seeking routes primarily to<br />
the Asia Pacific markets, which will increase over time.<br />
• The ability to fill westbound containers and westbound intermodal cars with revenue cargo that would<br />
otherwise be returned empty, thereby increasing capacity due to better asset utilization and fewer nonproductive<br />
moves.<br />
• More frequent and timely service for short-haul customers, low-volume destinations and U.S.<br />
destinations west of the existing U.S. rail hubs, as well as new services to local, NAFTA and<br />
international customers.<br />
Shipping lines<br />
• Automated customs clearance to reduce cargo dwell and allow high-speed “blue lane” border<br />
crossings.<br />
• Consolidated value-added data services and a cadre of supply chain data management professionals<br />
into a single logistics information hub to serve the <strong>Canadian</strong> <strong>Intelligent</strong> <strong>Super</strong> <strong>Corridor</strong>.<br />
• Attract backhaul revenue cargo through the intelligent management of empty container deployment and<br />
positioning.<br />
Copyright 2007: Saskatchewan Agrivision Corporation Inc. E- 14
January 2007<br />
<strong>Canadian</strong> <strong>Intelligent</strong> <strong>Super</strong> <strong>Corridor</strong> - <strong>Smart</strong> <strong>Inland</strong> <strong>Port</strong> <strong>Network</strong><br />
<strong>Port</strong>s<br />
• Faster cargo velocity for containers, which will to be stored, sorted or transloaded in Saskatchewan.<br />
This will help increase the throughput of existing seaport facilities.<br />
• Recovery of vital seaport land areas to serve essential port functions and reduce the need for<br />
additional local infrastructure.<br />
• Competitive advantage over rival U.S. ports through effective landside-transportation management,<br />
further boosting cargo concentration.<br />
Shippers<br />
• Cost-effective source loading of export products as opposed to containerizing at the port.<br />
• Export products requiring “identity preservation” that is attained by packaging or containerizing in<br />
Saskatchewan without admixture of products originating elsewhere.<br />
• Enhanced logistics options that increase efficiency and productivity of existing rail infrastructure assets.<br />
<strong>Canadian</strong> Government and Province of Saskatchewan<br />
• Growth and development of local business opportunities brought on by the presence of a nearby cargo<br />
centre including commercial warehousing and distribution, equipment maintenance services, haulage<br />
services and ancillary logistics services.<br />
• Diversification of the economy into other industries in order to avoid the cyclic downturns that occur in<br />
most commodity driven industries.<br />
• Increased local tax revenues due to new payroll and business receipts.<br />
Copyright 2007: Saskatchewan Agrivision Corporation Inc. E- 15
January 2007<br />
<strong>Canadian</strong> <strong>Intelligent</strong> <strong>Super</strong> <strong>Corridor</strong> - <strong>Smart</strong> <strong>Inland</strong> <strong>Port</strong> <strong>Network</strong><br />
Market Assessment<br />
The viability of smart inland port facilities proposed for Saskatchewan is dependent, in part, on the volume<br />
of freight which it would attract. Demand for a coordinated inland port system in Saskatchewan would<br />
primarily originate from <strong>Canadian</strong> and U.S. intermodal markets. One difficulty in estimating potential traffic<br />
is that the amount of traffic depends on rates and service levels, and these are unknown for a new facility.<br />
In order to identify flows between the Saskatchewan region and other global partners, it was necessary to<br />
study freight flows to and from provinces that contain major ports (British Columbia, Quebec, etc.). Based<br />
on trade statistics, industry knowledge and other quantitative analyses, it was determined that the analysis<br />
should focus on the trans-Pacific and NAFTA market as these lanes present the greatest opportunity, from<br />
both a volume and future growth perspective.<br />
Table ES-1: Summary of Future Containerization of Saskatchewan Exports to Asia (2004-2005 Data)<br />
Tonnes TEU Share TEU<br />
Ag Commodity Exports 4,865,369 29% 69,373<br />
Ag Processed Exports 512,979 100% 29,020<br />
Potash Exports 3,147,870 5% 9,258<br />
Pulp Exports 108,639 50% 2,173<br />
Total Exports in Analysis 8,634,856 25% 109,824<br />
Table ES-2: Summary of Future Containerization of Saskatchewan Exports to NAFTA (2004-2005 Data)<br />
Tonnes TEU Share TEU<br />
Ag Commodity Exports 1,325,724 18% 11,877<br />
Ag Processed Exports 754,927 100% 45,783<br />
Potash Exports 5,437,230 5% 15,992<br />
Pulp Exports 286,411 25% 2,864<br />
Total Exports in Analysis 7,804,293 20% 76,516<br />
Table ES-3: Potential CISCOR <strong>Smart</strong> <strong>Inland</strong> <strong>Port</strong> <strong>Network</strong> Market<br />
TEU TEU - 30% TEU + 10%<br />
Asia Outbound 109,824 76,877 120,807<br />
Asia Inbound 1 109,824 76,877 120,807<br />
NAFTA Outbound 76,516 53,561 84,168<br />
NAFTA Inbound 1 76,516 53,561 84,168<br />
Total Throughput 372,681 260,877 409,949<br />
(1) Assumes shipping lines will seek to maintain a balanced flow with each export load offset by an import load.<br />
A reasonable floor for the potential throughput of the inland port is the assumption that the shipping lines<br />
would seek to have a balanced flow – that is, a container stopped at the inland port must secure an export<br />
load. In this case, the estimated annual inbound market size is around 130,000 to 205,000 TEUs based on<br />
estimates of currently available exports originating in Saskatchewan. Based on this approach the inland<br />
port would have a total throughput of 260,000 to 410,000 TEUs per year, comprising Asian imports and<br />
exports and North American imports and exports.<br />
Copyright 2007: Saskatchewan Agrivision Corporation Inc. E- 16
January 2007<br />
<strong>Canadian</strong> <strong>Intelligent</strong> <strong>Super</strong> <strong>Corridor</strong> - <strong>Smart</strong> <strong>Inland</strong> <strong>Port</strong> <strong>Network</strong><br />
A factor that may encourage shipping lines to stop inbound containers at the inland port would be the ability<br />
to rapidly return empty containers to Asia for high revenue import loads. A further benefit is the ability to<br />
transload export-oriented products from across Canada and the north-east U.S. with intelligent capabilities<br />
for customs clearance. Therefore, the total potential throughput could be over 500,000 TEUs assuming<br />
the cost, transit and service conditions are in place to make the smart inland port viable distribution,<br />
transloading facility and customs clearance for the shippers, shipping lines, and railroads.<br />
Based on the experience of Kansas City <strong>Smart</strong> <strong>Port</strong>, including a free trade zone near the inland port<br />
facilities may create a competitive new manufacturing, distribution and trading centre, which will enhance<br />
inbound component products and outbound (re-exported) manufactured goods.<br />
Cost Analysis<br />
An important aspect of determining the feasibility of a coordinated inland port system in Saskatchewan is<br />
evaluating whether the port would be competitive with existing transportation options. An intermodal<br />
connection to the Midwest, specifically Chicago, would represent one of the best opportunities for a<br />
proposed CISCOR inland port. This cost analysis examines the current trucking and rail costs between the<br />
<strong>Port</strong> of Vancouver and Chicago. These costs are compared with the estimated costs for transporting goods<br />
through the inland port in Saskatchewan.<br />
Table ES-4 reveals that an additional $400 associated with transload costs is incurred per 40-foot container<br />
by using an inland port. However, these simplified estimates do not account for the potential to recover<br />
costs elsewhere in the supply chain, such as reduced non-revenue moves by loading empty containers with<br />
local cargo, better management of inventory or competitive pricing for volume container shipments moving<br />
to and from the inland port.<br />
Table ES-4. Estimated Cost Comparison of an International Container Transloaded at <strong>Smart</strong> <strong>Port</strong> vs. Direct Shipment<br />
<strong>Canadian</strong> Dollars Vancouver -<br />
Saskatchewan<br />
Vancouver -<br />
Saskatchewan<br />
Vancouver –<br />
Chicago<br />
- Chicago<br />
- Chicago<br />
Transport Mode Rail Rail & Truck Rail<br />
Cost per 40-ft Container 1<br />
Intermodal Rail $1,400 $1,400 $2,200<br />
Lift / Dray Cost $50 $50<br />
<strong>Inland</strong> Transload $350 $350<br />
Lift / Dray Cost $50 -<br />
Intermodal Rail 2 $800 -<br />
Truck 3 - $1,000<br />
Destination Local Dray 4 $120 - $175<br />
Total Cost per 40-ft Container $2,770 $2,800 $2,375<br />
(5) Rates exclude fuel surcharges<br />
(6) Assumes three 40-ft containers transloaded to two domestic containers and rate per domestic container is $1,200.<br />
(7) Assumes three 40-ft containers transloaded to two domestic trailers and rate per domestic trailer is $1,500.<br />
(8) Assumes three 40-ft containers transloaded to two domestic containers and local dray rate is $175.<br />
Copyright 2007: Saskatchewan Agrivision Corporation Inc. E- 17
January 2007<br />
<strong>Canadian</strong> <strong>Intelligent</strong> <strong>Super</strong> <strong>Corridor</strong> - <strong>Smart</strong> <strong>Inland</strong> <strong>Port</strong> <strong>Network</strong><br />
The analysis also considered the cost savings in containerizing export bulk products at the inland port. The<br />
global trend towards containerization of bulk commodities reflects the balancing of bulk and container<br />
shipping rates, shorter intermodal delivery times, and increased concerns about product quality and<br />
shipment safety. Table ES-5 indicates that source loading of containers costs less than shipping product by<br />
rail hopper car to the port and then loading into containers at the port.<br />
Table ES-5: Shipper Transport Cost Analysis<br />
Source Loaded at Points<br />
in Saskatchewan<br />
<strong>Port</strong> Loaded, Origin<br />
Saskatchewan<br />
Origin Dray $430 -<br />
Rail / Hopper Car - $3,550<br />
Rail / Container $1,100* $890**<br />
Destination Dray - $230<br />
Stuffing - $545<br />
Total per Container $1,530 $1,665<br />
Difference - +9%<br />
*Based on 90 MT per hopper car, the equivalent of four 20-foot containers at 22.5 MT per container.<br />
** Equivalent rate per container based on four container loads per hopper car.<br />
Source: “Container Measures Study: Issues and Discussion for Proposed Measures for the Grain<br />
Monitoring Program” June 2006, Government of Canada<br />
Copyright 2007: Saskatchewan Agrivision Corporation Inc. E- 18
January 2007<br />
<strong>Canadian</strong> <strong>Intelligent</strong> <strong>Super</strong> <strong>Corridor</strong> - <strong>Smart</strong> <strong>Inland</strong> <strong>Port</strong> <strong>Network</strong><br />
Conclusion<br />
The study identified a viable opportunity to develop smart inland port facilities in Saskatchewan given that<br />
certain critical conditions are met:<br />
• A critical mass of cargo, both inbound imports for distribution and outbound exports, must be<br />
developed in Saskatchewan. This includes transload and distribution of imported products for the<br />
North American market, as well as loading empty containers with local and transloaded products for<br />
export.<br />
• Sufficient rail car volume must take place at the smart inland port to justify dedicated unit trains to and<br />
from the Pacific Northwest.<br />
• The inland port must offer compelling, value-added logistics services to engage the shipping<br />
community and create a distinct intelligent competitive advantage over “business as usual” cargo<br />
distribution modes.<br />
• The economics of the inland port must be attractive to operators, investors and shipping interests.<br />
When these conditions are met, the inland port in Saskatchewan will be a viable part of the <strong>Canadian</strong><br />
intermodal network and will result in significant competitive advantages and benefits:<br />
• Development of a state-of-the art, competitive, secure and sustainable national gateway.<br />
• Enhancement and fulfillment of Canada’s emerging national intermodal land bridge (<strong>Canadian</strong><br />
<strong>Intelligent</strong> <strong>Super</strong> <strong>Corridor</strong>).<br />
• Integration of leading-edge information technology services for transport providers to achieve supply<br />
chain excellence, allowing maximum control of end to-end shipments.<br />
• Creation of free-trade zones to attract manufacturing for re-export.<br />
• Stimulation of additional Asian import and export opportunities for Canada and Northwest U.S.<br />
• Establishment of trade through consolidation and containerization of import and export cargo at<br />
warehousing and logistics centres at the inland port.<br />
• Establishment of unique “greenfield” terminal facilities made “future ready”, integrating state-of-the-art<br />
equipment and technological advancement tailored to meet port and intermodal challenges of today<br />
and tomorrow.<br />
To realize the promise of the initiative to develop an inland port in Saskatchewan that serves as the nucleus<br />
to a <strong>Canadian</strong> <strong>Intelligent</strong> <strong>Super</strong> <strong>Corridor</strong>, the following feasibility steps should be undertaken:<br />
• initiate legislative reform,<br />
• perform detailed market assessment and development study,<br />
• verify the capital construction and equipment costs,<br />
• quantify the operational costs and projected returns, and<br />
• build a comprehensive financial model.<br />
Copyright 2007: Saskatchewan Agrivision Corporation Inc. E- 19
Introduction<br />
W value in 2005-06 and<br />
exceeded the USD $10 trillion mark.<br />
World and North American<br />
merchandise exports were nearly twice<br />
the gross domestic product (GDP) in<br />
2005 as shown in Figure I-1.<br />
January 2007<br />
<strong>Canadian</strong> <strong>Intelligent</strong> <strong>Super</strong> <strong>Corridor</strong> - <strong>Smart</strong> <strong>Inland</strong> <strong>Port</strong> <strong>Network</strong><br />
orld merchandise trade (exports and imports) grew by 6.5 percent during 2005, according to the<br />
World Trade Organization. Global merchandise exports, as well as imports, rose by 13 percent in<br />
Figure I-1. Growth in Volume of World and North American<br />
Merchandise Trade and GDP, 1995-2005 (annual percentage change)<br />
12<br />
10<br />
8<br />
6<br />
Maritime container traffic has grown to<br />
represent over 85 percent of<br />
4<br />
merchandise cargo shipped worldwide.<br />
2<br />
World container traffic is growing at a<br />
compound rate of over 6.7 percent per 0<br />
year and is expected to double in the<br />
1995 1996 1997 1998 1999 2000 2001 2002 2003 2004 2005<br />
-2<br />
next two decades. The majority of this<br />
increase will be in the trans-Pacific<br />
-4<br />
trade lanes where up to 15 percent<br />
-6 North America Merchandise Exports World Merchandise Exports<br />
compound annual growth is expected<br />
World GDP<br />
North America GDP<br />
through the year 2015. The Panama<br />
Source: World Trade Organization<br />
Canal is presently operating at 85<br />
percent capacity and even with a 2015 expansion will not absorb the predicted rise in Asian traffic.<br />
Therefore, shippers and beneficial cargo owners continue to seek stable and reliable supply chain routes.<br />
North America, Western Europe and Pacific Asia are the dominant global trading regions handling the<br />
majority of worldwide manufacturing and distribution trade. Cargo volumes continue to increase rapidly at<br />
ports in North America, adding more than four million TEUs 1 every year to the current annual volume of 48<br />
million TEUs. This increasing growth in world trade is changing the distribution landscape and putting<br />
pressure on existing North American ports. In the U.S., moving this volume of containers has strained the<br />
capacity at West Coast ports such as Los Angeles and Long Beach and congested the intermodal rail and<br />
road systems that connect these ports to inland destinations.<br />
As the first North American port of call on the trans-Pacific route from Asia, Canada has an opportunity to<br />
develop a sophisticated intermodal distribution network to serve the growing North American market,<br />
particularly the U.S. Midwest and <strong>Canadian</strong> consumption zones. The creation of an <strong>Intelligent</strong> <strong>Super</strong><br />
<strong>Corridor</strong> linked by a state-of-the-art inland logistics facility will answer the growing need for additional North<br />
American gateway capacity and strengthen Canada’s position in the competitive world of international<br />
commerce. An inland port in Saskatchewan offers a favourable site wherein a program of strategic<br />
investment can result in a thriving inland cargo gateway complex at the heart of the <strong>Canadian</strong><br />
transportation network.<br />
1<br />
A forty-foot container equals two twenty-foot equivalent units (TEUs).<br />
Copyright 2007: Saskatchewan Agrivision Corporation Inc.<br />
Page IN-1
January 2007<br />
<strong>Canadian</strong> <strong>Intelligent</strong> <strong>Super</strong> <strong>Corridor</strong> - <strong>Smart</strong> <strong>Inland</strong> <strong>Port</strong> <strong>Network</strong><br />
Project Goals and Objectives<br />
The overall purpose of the CISCOR <strong>Smart</strong> <strong>Inland</strong> <strong>Port</strong> <strong>Network</strong> business case paper is to articulate<br />
Saskatchewan’s competitive position as a centre for international trade processing and landside logistics<br />
operations. The paper provides a summary analysis of market, economic, transportation, and other<br />
business dynamics of Saskatchewan’s future development of an inland distribution and logistics service<br />
port. The stated goals of this report are:<br />
• Explore evolving global trade trends that necessitate a strategic North American inland port along a<br />
national transportation corridor.<br />
• Highlight the general benefits of locating an inland port at the convergence of the Pacific and Atlantic<br />
gateways in central Canada.<br />
• Define the strategic advantages that Saskatchewan will offer the region, North America and the global<br />
trade corridors through development of an inland port.<br />
• Demonstrate how the features of the inland port initiative will complement the parallel initiatives of<br />
<strong>Canadian</strong> carriers, shippers, coastal ports and government initiatives.<br />
• Examine functions performed by successful inland port facilities and identify the concept elements that<br />
will allow Saskatchewan to build on its strengths and allow the region to carry forward a feasible option.<br />
• Estimate existing and forecasted freight flows, and institutional and organizational advantages of<br />
Saskatchewan where such a facility would be located.<br />
• Recommend future strategies to advance the inland port concept that will ultimately stimulate growth in<br />
various provincial industries and benefit the national economy.<br />
Study Process<br />
The study team collected and reviewed background materials regarding <strong>Canadian</strong> industries, freight and<br />
transport systems and interviewed key stakeholders including various shippers, CN and CPR railways and<br />
the ports of Vancouver, Montreal and Prince Rupert. Information on relevant case studies was also<br />
collected to compare the Saskatchewan project with other initiatives. The market opportunities and<br />
economic aspects were subsequently analysed and interpreted.<br />
A number of study constraints should be noted:<br />
• The study was exploratory in nature, designed to identify issues and opportunities for a <strong>Canadian</strong><br />
inland freight transport centre.<br />
• Macro-level analyses and provisional conclusions were derived from a limited set of indicators in part<br />
due to corporate restrictions in disclosing commercially-sensitive information.<br />
• The indicators, together with other transport operating statistics and exclusive consultations with<br />
industry stakeholders, may be used in further analysis to assess the micro-economic benefits of the<br />
project.<br />
Copyright 2007: Saskatchewan Agrivision Corporation Inc.<br />
Page IN-2
January 2007<br />
<strong>Canadian</strong> <strong>Intelligent</strong> <strong>Super</strong> <strong>Corridor</strong> - <strong>Smart</strong> <strong>Inland</strong> <strong>Port</strong> <strong>Network</strong><br />
Global Industry Trends and Conditions<br />
Growth in Containerized Trade and Asian Market<br />
Containerized trade is the fastest growing marine sector today and, coupled with the expansion of global<br />
manufacturing into Asia, has led to explosive trade growth between North America and the Far East. In the<br />
past five years, container trade in<br />
North America has increased at a<br />
Figure 1-1. Global Growth in Containerized Trade<br />
compound annual growth rate of 6.85<br />
percent per year reaching 48 million<br />
TEU in 2005. The largest volume of<br />
700<br />
600<br />
that trade is along the trans-Pacific<br />
500<br />
eastbound route, which grew by 7.5<br />
400<br />
percent in 2003, 17 percent in 2004,<br />
and 14 percent in 2005.<br />
300<br />
Approximately 24 million TEUs of<br />
200<br />
North American trade moved through<br />
West Coast ports with Asian traffic<br />
100<br />
representing approximately 18 million<br />
TEUs. North American container trade<br />
2000 2002 2004 2006 2008 2010 2012 2014<br />
is predicted to soar by 50 percent to<br />
North America World<br />
72 million TEUs by 2015. As imports<br />
Source: TranSystems, Containerization International statistics<br />
to North America continue to increase,<br />
freight volumes are expected to double and even triple at the busiest ports by 2020.<br />
Million of TEUs<br />
Currently, more than 60 percent of all North American container trade is with Asia, predominantly from<br />
China and Hong Kong. Container traffic to and from Asia is expected to grow at a higher rate than the<br />
world average in the next decade. China is expected to see the majority of the expansion, as it has in the<br />
last five years, and solid growth is expected in South Asia. Overall, Asia's share of containerized exports is<br />
Figure 1-2. 2015 Global Distribution of Container Volumes<br />
Central/South America<br />
6%<br />
North America<br />
13%<br />
Europe<br />
17%<br />
Australia/New<br />
Zealand/Pacific<br />
2%<br />
Source: UNESCAP 2005<br />
Africa<br />
3%<br />
North Asia<br />
8%<br />
Middle East<br />
2%<br />
South/Southeast Asia<br />
16%<br />
East Asia<br />
33%<br />
expected to rise to 64 percent in 2015; the<br />
share of containerized imports is expected to<br />
rise to 53 percent (UNESCAP, 2005).<br />
The <strong>Port</strong> of Hong Kong, currently the world’s<br />
largest port, handled 23.2 million containers in<br />
2005. By 2010 Shanghai container throughput<br />
is expected to surpass Hong Kong. However,<br />
by 2020 Shanghai is expected to be overtaken<br />
by Shenzhen to become the world’s largest<br />
container port. Shanghai and Shenzhen are<br />
expected to be moving 56.2 million and 57.9<br />
million TEUs respectively by 2020 (UNESCAP,<br />
2006; Fairplay, 2005). In 2005, Shanghai<br />
moved 18 million TEUs and Shenzhen 16<br />
million TEUs.<br />
Copyright 2007: Saskatchewan Agrivision Corporation Inc. Page 1-1
January 2007<br />
<strong>Canadian</strong> <strong>Intelligent</strong> <strong>Super</strong> <strong>Corridor</strong> - <strong>Smart</strong> <strong>Inland</strong> <strong>Port</strong> <strong>Network</strong><br />
Increasing Vessel Size and Industry Consolidation<br />
In order to meet the estimated increase in shipping volumes, leading carriers have invested in mega-sized<br />
container ships. Larger containerships have been found to offer greater economies of scale, which will<br />
result in lower costs to shippers and higher profit margins for carriers. Scale increases in vessel size result<br />
Figure 1-3. Container Ship Orderbook by TEU<br />
(% share) as of July 2006<br />
6000-7999 TEU<br />
15%<br />
4000-5999 TEU<br />
25%<br />
>8000 TEU<br />
31%<br />
2000-3999 TEU<br />
16%<br />
Source: Institute of Shipping Economics and Logistics 2006<br />
January 2007<br />
<strong>Canadian</strong> <strong>Intelligent</strong> <strong>Super</strong> <strong>Corridor</strong> - <strong>Smart</strong> <strong>Inland</strong> <strong>Port</strong> <strong>Network</strong><br />
Panama Canal Expansion<br />
The Panama Canal is the gateway for over 140 Figure1-4. Maximum Sustainable Capacity of the Canal<br />
maritime routes that operate with vessels of<br />
various types and sizes. The larger the vessels,<br />
the smaller the number of transits the canal is<br />
able to handle. The canal has a finite capacity<br />
determined by the operational times and cycles<br />
of the existing locks. Consequently, with its<br />
present capacity, it will become harder for the<br />
canal to handle growing traffic volumes in terms<br />
of size as well as vessel numbers. For instance<br />
of the 73 percent of vessels that requested a<br />
reservation slot to transit the canal in 2005, only<br />
55 percent were able to get a reservation. With<br />
the completion of a few improvements, the<br />
Panama Canal will have a maximum sustainable Source: Panama Canal Authority<br />
capacity of approximately 13,800 and 14,000<br />
ocean-going vessel transits per year. This capacity will be reached between fiscal year 2009 and 2012,<br />
depending on the behaviour of the demand (Panama Canal Authority, 2006).<br />
The Panama Canal Authority’s Proposal for the Expansion of the Panama Canal report released in April<br />
2006 estimates that the final design for the Third Set of Locks Project will be completed in FY 2007 and<br />
operations will begin in FY 2015. The canal will reach its maximum sustainable capacity between the years<br />
2009 and 2012. Once it reaches this capacity, it will not be able to continue to handle demand growth until<br />
a third set of locks is built (Panama Canal Authority, 2006). This three- to six-year period where the canal<br />
will not be able to meet demand growth will result in a reduction in the competitiveness of the Panama<br />
maritime route.<br />
If the canal does not have the capacity to accommodate the Northeast Asia–U.S. route, the unexpanded<br />
Canal’s market share would go down from 38 percent in 2005 to 23 percent in 2025. Consequently, its<br />
competitors’ share would increase–the intermodal system would reach 65 percent and the Suez Canal 12<br />
percent (Panama Canal Authority 2006). It is unlikely that the canal would regain its lost market share once<br />
new competitor routes were established and transportation and trade patterns changed. This is because<br />
canal users will have to make decisions and investments to increase their use of existing and potential<br />
alternative routes in order to guarantee the continuous and uninterrupted flow of the trade that they serve.<br />
North American <strong>Port</strong> and Intermodal Congestion<br />
While shippers are taking advantage of the economies of scale by the combination of increasing ship sizes<br />
calling on fewer ports and with increasingly restricted access through the Panama Canal, dramatic<br />
demands are being placed on major container ports along the West Coast of North American. For example,<br />
when a super post-Panamax container ship holding 9,000 TEUs calls at the <strong>Port</strong> of Los Angeles, it requires<br />
five cranes working simultaneously 16 hours per day for at least three days to unload the vessel. Moving<br />
this vast quantity of containers puts an enormous strain on port resources and requires a large amount<br />
terminal storage space to support the transfer of containers.<br />
Copyright 2007: Saskatchewan Agrivision Corporation Inc. Page 1-3
January 2007<br />
<strong>Canadian</strong> <strong>Intelligent</strong> <strong>Super</strong> <strong>Corridor</strong> - <strong>Smart</strong> <strong>Inland</strong> <strong>Port</strong> <strong>Network</strong><br />
A recent U.S. Chamber of Commerce study of North American port and intermodal systems estimates that<br />
14 of the 16 major deep-water North American ports considered will experience at least a 50 percent<br />
increase in container traffic, while 12 of the 16 ports will need to add extensive new terminal and intermodal<br />
capacity by 2010 to meet the estimated growth. Adding to the capacity challenge, land constraints fuelled<br />
by population growth in coastal states, provinces and around ports will limit North American ports’ ability to<br />
resolve the congestion problems. The challenge of transferring cargo seamlessly from and to intermodal<br />
rail and truck landside access facilities requires significant logistic distribution capabilities.<br />
Case Study: Los Angeles/Long Beach Terminal Capacity<br />
The twin ports of Los Angeles and Long Beach (LA/LB) accounted for 30 percent of the continent’s total<br />
international container volumes in 2005. The ports are experiencing rapid growth with trade volume<br />
projected to triple over the next 20 to 30 years. This growth has created stress throughout the entire supply<br />
chain, including shipping lines, terminal operators, transportation infrastructure (trucks, railroads, and<br />
roads/freeways), and shipper distribution systems. In 2004, gridlock at the LA/LB ports forced more than<br />
100 ships with $4 billion in cargo to be diverted to other ports.<br />
Figure 1-5. <strong>Port</strong>s of LA/LB Containerized Trade Growth and Current Capacity<br />
Million TEUs<br />
40.0<br />
35.0<br />
30.0<br />
25.0<br />
Current Capacity<br />
20.0<br />
15.0<br />
10.0<br />
5.0<br />
0.0<br />
1980 1985 1990 1995 2000 2001 2002 2003 2004 2005 2010 2015 2020<br />
Long Beach<br />
Los Angeles<br />
Source: TranSystems, American Association of <strong>Port</strong> Authorities statistics<br />
In response to this growth, LA/LB<br />
has been involved in substantial<br />
“planning efforts, starting with the<br />
2020 plan, first devised in the late<br />
1980s and updated several times<br />
since. The plan involves two types<br />
of developments - consolidation<br />
and minor expansion of existing<br />
terminals to create a few ‘megaterminals’,<br />
and large-scale land<br />
reclamation and creation of large<br />
new terminals. The most notable<br />
future expansion is in Long Beach,<br />
including the 200-acre Pier S and<br />
the 400-acre plus Pier W. Los<br />
Angeles’ future expansion hinges<br />
on conversion of a coal terminal<br />
and completing Pier 400 and Pier<br />
300. Theoretically, there is still a<br />
vast area within the breakwater, in<br />
the Outer Harbour. However, due to environmental resistance and prohibitive cost, reclamation there<br />
should be mostly considered as unattainable. One especially difficult obstacle for land reclamation is the<br />
requirement to provide mitigation of a same-area wetland. Altogether, a rough, but realistic, long-term<br />
expectation would be for an addition of about 1,400 to 1,600 acres, or about 60 to 70 percent of existing<br />
acreage. This means that even assuming implementation of operational and technological improvements,<br />
these ports will have great difficulties in coping with future demand, as the combination of the two factors<br />
falls short of future demand” (Ashar 2004, 59-60).<br />
Copyright 2007: Saskatchewan Agrivision Corporation Inc. Page 1-4
January 2007<br />
<strong>Canadian</strong> <strong>Intelligent</strong> <strong>Super</strong> <strong>Corridor</strong> - <strong>Smart</strong> <strong>Inland</strong> <strong>Port</strong> <strong>Network</strong><br />
“An even more critical constraint for LA/LB is hinterland connectivity, especially the congestion created in<br />
the port area by trucking the non-local or intermodal cargo between marine terminals, distribution centres<br />
and intermodal rail yards. The rail movement of containers to/from the LA/LB port area is routed through<br />
the Alameda <strong>Corridor</strong>. The corridor is a dedicated 20-mile, grade-separated triple-tracked route, developed<br />
through a joint venture between the railroads, ports, local and federal government at cost of $2.4 billion.<br />
Just 35 trains per day pass through the corridor, far short of its capacity of 100 a day. The trains carry<br />
about 37 percent of the ports' cargo, about the same percentage as before the corridor opened and well<br />
short of the 50 percent that planners had envisioned. It now appears that the 20-mile railway corridor will<br />
not be able to meet its projection of carrying half the cargo generated by the ports without an investment of<br />
hundreds of millions more dollars and major changes in the way the shipping industry operates” (Ashar,<br />
2004, 59-60).<br />
Driving Forces Behind <strong>Inland</strong> <strong>Port</strong> Development<br />
As a majority of the new ships entering the world fleet in the next five years will be post-Panamax vessels<br />
ready to transport cargo from China, Southeast Asia and India to North America, leading carriers are<br />
poised to phase larger container ships with service at fewer hub ports to capture economies of scale. This<br />
shift in global trade trends will strain North American port capacity limits over the next 10 years while ports<br />
lacking space for infrastructure improvements will be confined. The growth will also present supply chain<br />
vulnerabilities due to road and rail congestion, and security considerations at North American ports.<br />
In response to the increasing container traffic and capacity constraints, North American seaports are<br />
turning to inland ports as means to process cargo while avoiding coastal congestion, making use of Free<br />
Trade Zones and adding value to the freight supply chain. “The concentration of container flows…generate<br />
a disproportionate increase in distribution requirements both from the perspective of individual carriers as<br />
well as the ports as a whole. The immense pressure on the collection and distribution networks…enhances<br />
the development of inland hubs” (Notteboom, 2002). In an effort to determine the rationale behind the<br />
movement toward increased development of inland terminals, Notteboom analyzed cost models of eight<br />
network configurations and concluded that the bundling of cargo in a hub port generates some economies<br />
of scale in inland transportation. The feasibility of such an inland network increases if the average distances<br />
between neighboring ports decline. This study substantiates the evolution of “scattered, poorly connected<br />
ports along the coastline into a main network consisting of corridors between gateway ports and major<br />
hinterland centres” (Notteboom and Rodrigue, 2005).<br />
Copyright 2007: Saskatchewan Agrivision Corporation Inc. Page 1-5
January 2007<br />
<strong>Canadian</strong> <strong>Intelligent</strong> <strong>Super</strong> <strong>Corridor</strong> - <strong>Smart</strong> <strong>Inland</strong> <strong>Port</strong> <strong>Network</strong><br />
Canada’s <strong>Inland</strong> Solution<br />
The rising Asian container trade, emerging shifts in vessel routes, and increasing consolidation favour a<br />
<strong>Canadian</strong> solution to the systemic port and intermodal congestion problems in the U.S. Canada serves as<br />
an ideal terminus for large container ships by providing deep water ports and excellent intermodal<br />
connections to inland destinations.<br />
<strong>Canadian</strong> Trade Partners and Statistics<br />
Canada’s solid trade performance in 2005, as well as in the past decade, is a result of the growth in the<br />
<strong>Canadian</strong> economy, trade liberalization through the NAFTA and the reduction of global trade barriers<br />
through the World Trade Organization (WTO), the emerging economies of China and India, and increased<br />
demand for natural resources including energy products. Canada exported a record $516 billion in goods<br />
and services in 2005, equivalent to 37.7 percent of <strong>Canadian</strong> gross domestic product. Imports also rose by<br />
5.8 percent to $463.1 billion. Canada’s largest trading partners are the United States, the European Union<br />
(EU), Japan, China, Germany and Mexico. Exports of goods and services to and imports of goods and<br />
services from all principal trading areas increased in 2005.<br />
Table 2-1: <strong>Canadian</strong> Trading Partners and Percent of Trade ($ billions)<br />
Exports by Country 2005 % Share % Change<br />
2005/2004<br />
U.S. 365.7 83.9 5.1<br />
EU-25 24.7 5.7* 8.2<br />
Japan 9.1 2.1 6.6<br />
UK 8.2 1.9 6.7<br />
China 7.1 1.6 6.1<br />
Mexico 3.3 0.8 8.7<br />
Germany 3.2 0.7 21.0<br />
Imports by Country 2005 % Share % Change<br />
2005/2004<br />
U.S. 215.1 56.5 2.9<br />
EU-25 45.6 12.0* 8.5<br />
China 29.5 7.8 22.4<br />
Japan 14.8 3.9 9.4<br />
Mexico 14.6 3.8 8.6<br />
UK 10.4 2.7 7.7<br />
Germany 10.3 2.7 9.0<br />
*Includes Germany, France, Belgium and Netherlands<br />
Source: 2006 Annual Report on Canada’s State of Trade adapted from Statistics Canada<br />
Canada’s top five exported goods in 2005 were mineral fuel and oil ($88 billion), motor vehicles and parts<br />
($78.2 billion), machinery ($33.7 billion), electrical machinery and equipment ($20.5 billion), and wood<br />
($20.3 billion). The top five imported goods were motor vehicles and parts ($65.7 billion), machinery ($62.2<br />
billion), electrical machinery and equipment ($37.6 billion), mineral fuel and oil ($35.6 billion), and plastics<br />
($13.7 billion).<br />
Copyright 2007: Saskatchewan Agrivision Corporation Inc. Page 2-1
January 2007<br />
<strong>Canadian</strong> <strong>Intelligent</strong> <strong>Super</strong> <strong>Corridor</strong> - <strong>Smart</strong> <strong>Inland</strong> <strong>Port</strong> <strong>Network</strong><br />
In trade between the United States and Canada in 2005, the primary mode of transport was by truck,<br />
representing approximately 60 percent of total exports and imports moved, while rail represented<br />
approximately 17 percent, marine at three percent, air at 5.6 percent and other modes, such as pipeline, at<br />
approximately 14 percent.<br />
Table 2-2: Canada and U.S. Export and Import Trade by Value and Percentage by Transport Mode<br />
Year Total exports<br />
and imports<br />
($ million)<br />
Transport<br />
(%) by road<br />
Transport<br />
(%) by rail<br />
Transport (%)<br />
by marine<br />
Transport<br />
(%) by air<br />
Transport (%)<br />
by other<br />
mode**<br />
2000 588,947 65 16 2.2 8.1 8.7<br />
2001 570,040 63.7 16.6 2.3 7.5 9.8<br />
2002 563,861 65.9 17.2 2.6 6.4 7.8<br />
2003 530,439 63.2 17.3 2.9 6.2 10.5<br />
2004 556,541 62.2 17.7 2.9 5.7 11.5<br />
2005* 579,806 60.3 16.9 3.4 5.6 13.9<br />
* Preliminary data for 2005 **Other largely pipeline<br />
Source: Transport Canada, adapted from Statistics Canada, International Trade database<br />
Canada has been successful in generating international trade volumes and growth over recent years.<br />
Future areas to explore include the identification and development of new export opportunities in China,<br />
India and Mexico.<br />
<strong>Canadian</strong> <strong>Port</strong>s and Containerization Growth<br />
From 1995 to 2005, container traffic through Canada increased by a compound annual growth rate of nine<br />
percent from 1.74 million to 4.2 million TEUs. Inbound container traffic volume has been growing at 12.5<br />
percent a year between 2000 and 2005 on a tonnage basis, while outbound container traffic has increased<br />
almost five percent per year since 2000 (WESTAC 2006).<br />
Canada’s major container ports<br />
– Vancouver, Halifax and<br />
Montreal – have been the<br />
principal beneficiaries of this<br />
increased growth in<br />
containerization. These former<br />
bulk coal and grain ports have<br />
become some of the most<br />
productive terminals in North<br />
America. Total container<br />
throughput for the three ports in<br />
2005 was over 3.6 million TEUs,<br />
compared to 2.7 million in 2000<br />
(AAPA Statistics), and forecasts<br />
indicate <strong>Canadian</strong> ports will<br />
need to handle nearly seven<br />
million TEUs by 2015 (Ircha, 2004).<br />
Millions of TEUs<br />
Figure 2-1. Growth of Containerized Traffic in <strong>Canadian</strong> <strong>Port</strong>s<br />
4.5<br />
4.0<br />
3.5<br />
3.0<br />
2.5<br />
2.0<br />
1.5<br />
1.0<br />
0.5<br />
0.0<br />
1995 1997 1999 2001 2003 2005<br />
Source: TranSystems, American Association of <strong>Port</strong> Authorities statistics<br />
Vancouver (BC)<br />
Fraser<br />
Montreal<br />
Halifax<br />
St. John's<br />
Toronto<br />
Saint John<br />
Copyright 2007: Saskatchewan Agrivision Corporation Inc. Page 2-2
January 2007<br />
<strong>Canadian</strong> <strong>Intelligent</strong> <strong>Super</strong> <strong>Corridor</strong> - <strong>Smart</strong> <strong>Inland</strong> <strong>Port</strong> <strong>Network</strong><br />
Pacific <strong>Port</strong>s<br />
Since the majority of the future growth in containerization is expected to be from China and other Asian<br />
regions, much of the cargo will be transported along the trans-Pacific route and focused on West Coast<br />
ports. This containership route is not limited by canal infrastructure and thus offers virtually no physical<br />
limitation on the size of container vessels. At present, the principal West Coast container ports in Canada<br />
are the Vancouver <strong>Port</strong> Authority and Fraser River <strong>Port</strong> Authority. Already, inland China and Hong Kong<br />
account for 64 percent of the inbound container traffic tonnage handled at Vancouver facilities. Imports<br />
from this area have grown 21.9 percent annually since 1998 and represent about 79 percent of the tonnage<br />
growth through the port during this period. Containerized exports to inland China and Hong Kong are also<br />
growing at 18.8 percent a year, and represent 38 percent of Vancouver's total exports (WESTAC, 2006).<br />
Vancouver <strong>Port</strong> Authority is Canada’s largest Pacific port and a major international trade port for <strong>Canadian</strong><br />
trade with Asia. The port also handles some trade between Asia and the U.S. Midwest. Over the past 10<br />
years, the <strong>Port</strong> of Vancouver has become the fastest growing container port in North America, registering<br />
an average annual growth rate of 13.5 percent. In 2005, the port handled 1.77 million TEUs, up 6.2 percent<br />
from 2004.<br />
The port includes three on-dock container terminals - Centerm and Vanterm, located in the <strong>Port</strong> of<br />
Vancouver’s Burrard Inlet Inner Harbour, and Deltaport, located on Roberts Bank around 20 miles from the<br />
Inner Harbour. These terminals can accommodate the largest post-Panamax container ships. The port is<br />
linked to CN, CPR and Burlington Northern Santa Fe (BNSF) rail networks.<br />
Although there is a significant local market in Vancouver for containerized goods, approximately 70 percent<br />
of Vancouver's import containers are destined for central and eastern Canada. Cargo shipments are<br />
relatively balanced, with the Vancouver <strong>Port</strong> Authority reporting inbound traffic of 884,324 TEUs and<br />
outbound traffic of 883,056 TEUs in 2005. Outbound containerized freight consists primarily of forest<br />
products, specialty grains and waste products. Approximately 25 percent of outbound containers are empty<br />
while only three percent of inbound containers are empty (VPA, 2005).<br />
Table 2-3: Vancouver Container Terminal Characteristics<br />
Location<br />
Berth Terminal<br />
Terminal<br />
Operator Length Area<br />
Name<br />
(Metres) (Hectares)<br />
Vancouver Centerm<br />
DP<br />
World<br />
650 29<br />
Vancouver Vanterm<br />
TSI<br />
(OOCL)<br />
619 31<br />
Roberts<br />
Bank<br />
Deltaport<br />
TSI<br />
(OOCL)<br />
Depth<br />
(Metres)<br />
12.2–<br />
15.5<br />
15.2–<br />
15.5<br />
# of<br />
Cranes<br />
2005<br />
Throughput<br />
(TEU)*<br />
Throughput<br />
per Hectare<br />
5 350,000 12,870<br />
7 400,000 13,818<br />
670 65 15.85 7 910,000 14,903<br />
Total 1,939 125 15.85 19 1,660,000 14,160<br />
*Individual terminal throughput estimated based on 2004 volumes and total 2005 throughput of the port.<br />
Source: TranSystems<br />
Copyright 2007: Saskatchewan Agrivision Corporation Inc. Page 2-3
January 2007<br />
<strong>Canadian</strong> <strong>Intelligent</strong> <strong>Super</strong> <strong>Corridor</strong> - <strong>Smart</strong> <strong>Inland</strong> <strong>Port</strong> <strong>Network</strong><br />
This growth has led to increasing congestion that is threatening the long-term viability of Vancouver as an<br />
international gateway for transport of goods to and from other countries. In order to meet its business and<br />
operational requirements, the port will need to react more quickly and efficiently to market needs and in<br />
handling forecasted traffic.<br />
The total container traffic forecast for West Coast ports in 2015 is 5.41 million TEUs, almost triple the 2005<br />
volume (WESTAC, 2006). However, according to the British Columbia’s Pacific Strategy Action Plan for<br />
2006 to 2020, British Columbia ports are aiming to become the “preferred gateway for Asia-Pacific trade”<br />
and increase their share of the market to 17 percent by 2020. This means that the ports would need to<br />
capture nine million TEUs of the projected 51.6 million TEUs destined to the American Pacific Coast by<br />
2020. <strong>Canadian</strong> West Coast ports are planning and developing facilities to try to meet the growing demand<br />
and targeted goal.<br />
The <strong>Port</strong> of Vancouver is upgrading and expanding its capacity through five separate container projects,<br />
including conversion of a forests products terminal to a container terminal, berth expansion, upgrading lift<br />
equipment and developing a new terminal (Ircha, 2006). The fourth terminal and other capacity expansion<br />
projects are expected to raise the port’s container capacity by another 3.1 million TEUs, to a total of 5.5<br />
million TEUs once completed. However, the <strong>Port</strong> of Vancouver is geographically constrained, so a majority<br />
of capacity growth in the future will depend on efficiency enhancements (B.C. Gateway Advisory<br />
Committee).<br />
The <strong>Port</strong> of Vancouver has indicated that although capacity is a major challenge, freight mobility is equally<br />
challenging. “Freight mobility refers to improving the movement of goods in and out of the port by<br />
increasing the efficiency of railways, truckers, port services and third party service providers using coproduction<br />
agreements and new practices and technologies such as reservation systems and mobile<br />
container screening equipment” 2 (DDC Consulting Services, Inc., 2006).<br />
The use of off-dock facilities for storage of empty containers, as well as container cleaning and repair in<br />
Vancouver has also increased as a response to short-term congestion problems. Off-dock container<br />
facilities report increases in daily gate transactions ranging from 20 to 400 percent over the last 18 months<br />
(Davies, 2006).<br />
Fraser River <strong>Port</strong> Authority, located on the main arm of the Fraser River south of Vancouver, handled<br />
372,844 TEUs in 2005, up 17 percent from 2004. The port’s single container terminal has experienced<br />
increased container traffic by a compound annual growth rate of 41 percent from 2000 to 2005. The<br />
container terminal, Fraser Surrey Docks, can receive deep-sea vessels up to Panamax size. Rail services<br />
are provided at the terminal by BNSF, CN, CPR and Southern Railway of British Columbia (Fraser River<br />
<strong>Port</strong> Authority).<br />
2<br />
Address to 12th Pan Pacific <strong>Port</strong>s Conference, Jim Cox, VP Infrastructure Development, Vancouver <strong>Port</strong><br />
Authority, May 11, 2004.<br />
Copyright 2007: Saskatchewan Agrivision Corporation Inc. Page 2-4
January 2007<br />
<strong>Canadian</strong> <strong>Intelligent</strong> <strong>Super</strong> <strong>Corridor</strong> - <strong>Smart</strong> <strong>Inland</strong> <strong>Port</strong> <strong>Network</strong><br />
After a recent completion of a terminal expansion in 2005, the annual capacity at Fraser Surrey Docks is<br />
415,000 TEUs per year, up from 250,000 TEUs. The port is considering a second phase of expansion,<br />
including upgrading equipment and adding more yard area for storage to further increase its capacity, if<br />
growth in container volumes is sustained. The port is also considering building a container terminal at its<br />
Fraser Richmond property on 120 acres (WorldCargo News, 2006).<br />
The <strong>Port</strong> of Prince Rupert is currently a multi-use port that is converting its Fairview terminal into a new<br />
container facility to be open in 2007. The new $120 million container port facility will initially be capable of<br />
handling 500,000 containers per year. A second phase of the expansion initiative would accommodate an<br />
additional annual capacity of 1.5 million TEUs to be completed in 2010. The port has been designed to<br />
efficiently handle the largest concentration of intermodal rail business. As such, the new container terminal<br />
will be North America's purest marine-to-rail intermodal transfer facility. CN will provide full double-stack<br />
clearance along the route and invest in additional rolling stock. The port expansion will be complemented<br />
by infrastructure upgrades of $150 million on highway improvements in northwest British Columbia and $15<br />
million in rail upgrades (<strong>Port</strong> of Prince Rupert).<br />
Table 2-4: Estimated Projected West Coast <strong>Canadian</strong> <strong>Port</strong> Capacity Levels<br />
<strong>Port</strong> 2006 2010 2015 2020<br />
Vancouver 2,280,000 2,680,000 3,480,000 5,480,000<br />
Centerm 780,000 780,000 780,000 780,000<br />
Vanterm 600,000 600,000 600,000 600,000<br />
Deltaport 900,000 1,300,000 1,300,000 1,300,000<br />
Lynnterm 0 0 800,000 800,000<br />
Roberts Bank 2 0 0 0 2,000,000<br />
Fraser River 415,000 415,000 415,000 415,000<br />
Prince Rupert 0 500,000 1,500,000 1,500,000<br />
Total 2,695,000 3,595,000 5,895,000 7,895,000<br />
Source: TranSystems<br />
Together, the ports of Vancouver, Fraser River and Prince Rupert will have the capacity to handle 7.9<br />
million containers by 2020. However, this does not meet the 2020 throughput goal of nine million TEUs per<br />
year (WorldCargo News, 2006). Additional container terminal capacity will be required as well as<br />
improvements to Canada’s road network. An additional 1,800 trains per year will be destined for Central<br />
and Eastern Canada, about five more trains per day. Tripling the current inbound container volumes will<br />
have significant implications for the transportation system - the rail and road networks, terminals, and other<br />
logistics service providers.<br />
Atlantic ports<br />
The growth of container traffic was not as significant at <strong>Canadian</strong> East Coast ports as West Coast ports.<br />
The two major container ports, <strong>Port</strong> of Halifax and <strong>Port</strong> of Montreal, grew 4.7 percent and 2.3 percent<br />
respectively in 2005 (AAPA, 2006). However, capacity constraints at U.S. West Coast ports have caused<br />
Asian shipping lines to redirect some of their trade through the Suez and Mediterranean to the East Coast.<br />
This shift provides opportunities for <strong>Canadian</strong> East Coast ports to capture some of the forecast growth in<br />
container trade. Canada’s Atlantic ports are natural gateways to capture growth of Asian economies like<br />
India and China.<br />
Copyright 2007: Saskatchewan Agrivision Corporation Inc. Page 2-5
January 2007<br />
<strong>Canadian</strong> <strong>Intelligent</strong> <strong>Super</strong> <strong>Corridor</strong> - <strong>Smart</strong> <strong>Inland</strong> <strong>Port</strong> <strong>Network</strong><br />
The <strong>Port</strong> of Halifax has two deep-water container terminals - Fairview Cove and South End - which handled<br />
550,000 TEUs in 2005. Forty-seven percent of containerized cargo leaving the port of Halifax is destined to<br />
Europe and 27 percent is bound for Asia. The port recently completed a dredging project that provided<br />
16.8-metre deep container berths, thereby making it the only port that can handle the world’s largest<br />
container vessels on the eastern seaboard of North America. The port received its first post-Panamax<br />
vessel carrying Asian exports via the Suez Canal in late 2005 (<strong>Port</strong> of Halifax). CN is the only rail carrier<br />
providing service to the port. Seventy percent of containers through Halifax travel by rail, yet the track<br />
capacity is only utilized at 30 percent (WorldCargo News, 2006).<br />
The <strong>Port</strong> of Halifax is operating at approximately 50 percent of its current capacity of 1.2 million TEUs per<br />
year. Improvements to the wharf could increase the capacity by 100,000 to 200,000 TEUs per year,<br />
however, there is not a pressing need for expansion. The port is planning a long-term project to develop an<br />
inland port that would increase the port’s capacity by 250,000 TEUs (WorldCargo News, 2006).<br />
Containerized cargo accounts for nearly half the<br />
<strong>Port</strong> of Montreal’s total traffic. Montreal serves a<br />
niche market, as it is the international port closest<br />
to North America’s industrial heartland, offering<br />
shortest over-land route to the main U.S. Midwest<br />
markets. The four container terminals at the <strong>Port</strong> of<br />
Montreal handled 1.25 million TEUs in 2005.<br />
Seven percent of total containers are exported<br />
empty while three percent of containers are<br />
imported empty. The port’s container berths have a<br />
depth of 13 metres. As a result, the largest vessel<br />
that <strong>Port</strong> of Montreal can currently accommodate is<br />
roughly 4,000 TEUs. Approximately 60 percent of<br />
the containerized traffic moving through the <strong>Port</strong> of<br />
Montreal is carried inland by rail, mostly to and from markets in Ontario and the U.S. Midwest. Both the CN<br />
and CPR networks are accessible from the port (<strong>Port</strong> of Montreal, 2005).<br />
The <strong>Port</strong> of Montreal estimates that its capacity is approximately 1.5 million TEUs, representing 92 percent<br />
of its current throughput (<strong>Port</strong> of Montreal). The port is currently converting areas between two container<br />
terminals from gypsum to container handling to provide additional short-term capacity. Additional capacity<br />
growth is expected over the next five years as the <strong>Port</strong> Authority plans to devote most of its $152 million<br />
capital expenditure budget to container facilities. Since the existing port faces geographic constraints, longterm<br />
efforts may include developing land off Montreal Island at Contrecouer into a container terminal or<br />
building a terminal inland to increase capacity (WorldCargo News, 2006).<br />
The challenge facing <strong>Canadian</strong> ports is in responding to the surging volumes of global trade without<br />
duplicating the problems of congestion and landside constraint found today on the U.S. West Coast.<br />
Although Vancouver, Montreal and Halifax are subject to capacity constraints, the ports’ recent<br />
achievements in higher port performance through operational enhancements and terminal expansions<br />
could be further augmented by developing a new inland port logistics park and intelligent transportation<br />
corridor that serve their local markets as well as entire regions.<br />
Copyright 2007: Saskatchewan Agrivision Corporation Inc. Page 2-6
January 2007<br />
<strong>Canadian</strong> <strong>Intelligent</strong> <strong>Super</strong> <strong>Corridor</strong> - <strong>Smart</strong> <strong>Inland</strong> <strong>Port</strong> <strong>Network</strong><br />
<strong>Canadian</strong> Railways and Intermodal Traffic<br />
<strong>Canadian</strong> railways experienced strong growth in freight cargo for the second consecutive year in 2005.<br />
The railways reported an increase of 6.5 percent and 3.7 percent in total rail traffic tonnage in 2004 and<br />
2005 respectively. Non-intermodal traffic, such as lumber, coal and iron ore, accounts for approximately 90<br />
percent of total railway freight. However, intermodal container traffic has become increasingly important to<br />
the <strong>Canadian</strong> freight market and represents the fastest growing market segment of the two major <strong>Canadian</strong><br />
railways. Only intermodal traffic has experienced consistent positive growth in the past three years. From<br />
2000 to 2005 intermodal rail traffic grew at an average annual rate of 4.9 percent. Containerized cargo<br />
consists mainly of finished manufactured goods from Asia and the U.S. The western provinces<br />
experienced the majority of growth in containerized cargo. Intermodal cargo tonnage in the west grew by<br />
11.6 percent between 2000 and 2005, compared to 3.2 percent growth east of Manitoba (Statistics<br />
Canada, 2006).<br />
Figure 2-2. Canada Class I Railways Intermodal (containers and trailers) Rail Traffic (units originated in thousands)<br />
2,500<br />
2,000<br />
1,500<br />
1,000<br />
500<br />
0<br />
1995 1996 1997 1998 1999 2000 2001 2002 2003 2004<br />
Source: Railway Association of Canada, Railway Trends.<br />
CN operates the largest rail network in Canada and the only transcontinental network in North America.<br />
The company offers coast-to coast service from the Atlantic and Pacific oceans to the Gulf of Mexico,<br />
serving the ports of Vancouver, Prince Rupert, Montreal, Halifax, New Orleans and Mobile, Alabama. CN<br />
has approximately 19,200 route-miles of track in Canada and the U.S., and 20 intermodal terminals in<br />
major industrial centres in Canada, New England, and the U.S. Midwest. <strong>Canadian</strong> CN intermodal<br />
terminals are located in the cities of Vancouver, Edmonton, Calgary, Saskatoon, Winnipeg, Brampton<br />
(Toronto), Montreal, Moncton and Halifax. In 2005, the company earned CDN $7.2 billion in revenue - 55<br />
percent of revenues came from U.S. domestic and cross-border traffic, 21 percent from international traffic<br />
and 24 percent from <strong>Canadian</strong> domestic traffic (<strong>Canadian</strong> National).<br />
CPR provides rail and intermodal transportation services over a network of approximately 13,600 miles,<br />
serving the principal business centres of Canada from Montreal to Vancouver, and the U.S. Northeast and<br />
Midwest regions. CPR’s trans-Pacific service offers the shortest route between the <strong>Port</strong> of Vancouver and<br />
Chicago. CPR operates 20 intermodal terminals and 13 major classification yards. CPR intermodal<br />
terminals are located in the cities of Vancouver, Edmonton, Calgary, Saskatoon, Regina, Winnipeg,<br />
Dryden, Thunder Bay, Toronto and Montreal.<br />
Copyright 2007: Saskatchewan Agrivision Corporation Inc. Page 2-7
January 2007<br />
<strong>Canadian</strong> <strong>Intelligent</strong> <strong>Super</strong> <strong>Corridor</strong> - <strong>Smart</strong> <strong>Inland</strong> <strong>Port</strong> <strong>Network</strong><br />
In 2005, the company earned CDN $4.4 billion in revenue with 35 percent from U.S. domestic and crossborder<br />
traffic, 43 percent from international traffic and 22 percent from <strong>Canadian</strong> domestic traffic. CPR’s<br />
international traffic is represented primarily by containerized traffic moving via the ports of Vancouver,<br />
Montreal, New York and Philadelphia to and from inland points across Canada and the U.S. Intermodal<br />
freight revenue accounted for 27 percent of CPR’s total revenue in 2005 (<strong>Canadian</strong> Pacific Railroad).<br />
Figure 2-3. <strong>Canadian</strong> Rail <strong>Network</strong> in North America<br />
Source: Railway Association of Canada, 2004<br />
Currently, much of Canada’s rail network is under-utilized, with over 90 percent of CN and CP tonnage<br />
carried on 40 percent of their tracks. Despite this overall excess capacity, the Western <strong>Corridor</strong> from the<br />
<strong>Port</strong> of Vancouver to Regina, Saskatchewan experiences the highest utilization and can occasionally<br />
become congested. Rail freight congestion in 2004 on this intermodal rail network at the <strong>Port</strong> of Vancouver<br />
has required the <strong>Canadian</strong> railroads to work together on joint capacity development. CPR, for example,<br />
plans to increase its train capacity on its Western <strong>Corridor</strong> by at least 10 percent, and perhaps as high as<br />
20 percent, depending on the level of economic growth (DDC Consulting Services, Inc., 2006). Similarly,<br />
CN spent $5 million for infrastructure improvements to the North line in British Columbia to accommodate<br />
doublestack container cars in 2005 (WorldCargo News, 2005).<br />
Copyright 2007: Saskatchewan Agrivision Corporation Inc. Page 2-8
January 2007<br />
<strong>Canadian</strong> <strong>Intelligent</strong> <strong>Super</strong> <strong>Corridor</strong> - <strong>Smart</strong> <strong>Inland</strong> <strong>Port</strong> <strong>Network</strong><br />
1200<br />
1000<br />
Figure 2-4. <strong>Canadian</strong> Class I Railway Additions to Property ($ millions)<br />
800<br />
600<br />
400<br />
200<br />
0<br />
2002 2003 2004<br />
Source: Railway Association of Canada, Railway Trends<br />
Other equipment<br />
Work equipment & roadway<br />
machines<br />
Intermodal equipment<br />
Rolling stock<br />
Terminals & fuel stations<br />
Signals, communications &<br />
power<br />
Buildings, related machinery &<br />
equipment<br />
Track & roadway<br />
CN and CPR have made major<br />
investments to improve traffic flow and<br />
increase access to key inland U.S.<br />
markets. This has included<br />
constructing more tracks, increasing<br />
the length of sidings, running longer<br />
and heavier trains, implementing a<br />
reservation system, and entering into<br />
‘co-production’ agreements. In 2005,<br />
CPR made substantial investments in<br />
upgrades spending $920 million, its<br />
largest investment program in two<br />
decades. $160 million was spent on a<br />
25 projects to extend sidings or add<br />
double track in the Western <strong>Corridor</strong><br />
that increased train capacity by four<br />
trains per day, or 12 percent. In 2006,<br />
the railway allocated another $825 million for new equipment and track improvements. In the past year, CN<br />
has invested in upgrades, expanded its trackage and increased equipment inventory enough to<br />
accommodate an additional 125,000 containers per year. The railway is targeted to spend $1.6 billion on<br />
capital programs in 2007. More than $1 billion will be spent on improving track integrity and safety and $60<br />
million will be dedicated to constructing new sidings in Western Canada to respond to the growth in trade<br />
with Asia (WorldCargo News, 2005).<br />
CN and CPR have entered into a number of co-production agreements, whereby they share trackage to<br />
speed rail movements in and out of Canada. The agreements jointly increase capacity on key sections of<br />
track in the Vancouver area to improve the mobility of rail operations over existing infrastructure. For<br />
example, an arrangement for “directional running” where westbound traffic going to Vancouver travels on<br />
CN track and eastbound traffic moves on the CPR system for a 250 kilometres stretch of track. Other joint<br />
network arrangements initiated by CN and CPR improve railway transit times and asset utilization in British<br />
Columbia, Alberta and Ontario including eliminating “handoffs”, whereby one railway halts its delivery at an<br />
interchange point and transfers the shipments to the railway that owns the line. In December 2005, CN and<br />
CPR’s car utilization increased by 1.1 percent and reported that inter-terminal movements jumped by an<br />
impressive 12 percent (WorldCargo News, 2005).<br />
CN has also entered into a border agreement with BNSF railroad where traffic from the <strong>Canadian</strong> prairies is<br />
consolidated in Minnesota for movement to the western U.S. and in Wisconsin for movement to the central<br />
U.S. and Texas. The agreement was established to speed interchange for international freight movement<br />
(WorldCargo News, 2005).<br />
Copyright 2007: Saskatchewan Agrivision Corporation Inc. Page 2-9
January 2007<br />
<strong>Canadian</strong> <strong>Intelligent</strong> <strong>Super</strong> <strong>Corridor</strong> - <strong>Smart</strong> <strong>Inland</strong> <strong>Port</strong> <strong>Network</strong><br />
These strategic <strong>Canadian</strong> agreements provide more efficient rail service, improve network and equipment<br />
utilization, and increase productivity on existing infrastructure. The result is a compelling competitive<br />
<strong>Canadian</strong> intermodal rail corridor solution that can bypass congested U.S. routes.<br />
Figure 2-5. <strong>Canadian</strong> Intermodal <strong>Network</strong><br />
Source: TranSystems, Railway Association of Canada<br />
Canada’s Strategic Location<br />
Canada can serve as the North American gateway at the intersection of three powerful and shifting trade<br />
networks—the north-south NAFTA, the European-NAFTA and the highly-utilized trans-Pacific route.<br />
Canada's road network of over 1.4 million kilometres includes the longest highway in the world, the Trans-<br />
Canada Highway (TCH). The TCH connects to Interstate-35, the “NAFTA <strong>Super</strong>highway”, linking all 10<br />
provinces to U.S. and Mexico markets. In 2005, approximately 13 million truck trips carrying a total of<br />
approximately $400 billion in goods crossed the <strong>Canadian</strong>/U.S. border. Canada's road network includes 18<br />
major trade gateways to the U.S. that accommodate nearly 90 percent of Canada's trade with its southern<br />
neighbour.<br />
In 2005, nearly 67 percent of Canada-U.S. trade carried by trucks was concentrated at six border crossing<br />
points: Windsor/Ambassador Bridge, Sarnia, Fort Erie, Niagara Falls/Lewiston Bridge in Ontario, Lacolle in<br />
Quebec, and Pacific Highway in British Columbia. Due to increased growth in cross-border trade, the<br />
government of Canada has allotted a sizeable amount of funds for road maintenance and infrastructure<br />
upgrades, often carried out through public-private partnerships (Transport Canada).<br />
To accommodate the growth in international trade and commerce, Canada and the United States have<br />
signed a “<strong>Smart</strong> Border” action plan. The pact outlines a 30-Point Action Plan, which provides for ongoing<br />
collaboration in identifying and addressing security risks, while efficiently expediting the flow of goods and<br />
people across the Canada-U.S. border.<br />
Copyright 2007: Saskatchewan Agrivision Corporation Inc. Page 2-10
January 2007<br />
<strong>Canadian</strong> <strong>Intelligent</strong> <strong>Super</strong> <strong>Corridor</strong> - <strong>Smart</strong> <strong>Inland</strong> <strong>Port</strong> <strong>Network</strong><br />
Highlights of the plan include:<br />
• Expedited movement for pre-approved, low-risk commercial traffic at the six high-volume border<br />
crossings.<br />
• Integrated border enforcement teams deployed in 14 areas along the border.<br />
• Joint customs and immigration inspection facilities located away from the border to improve security<br />
and relieve congestion. Both governments continue to explore approaches to the legal challenges that<br />
flow from border inspection services of one country operating in the other (U.S. White House, 2002).<br />
In order to stay competitive, many companies in the U.S. have taken full advantage of Canada's<br />
transportation infrastructure and geographic location, realizing that many <strong>Canadian</strong> production hubs are<br />
actually closer to U.S. target markets than American production sites. Specifically, major <strong>Canadian</strong><br />
industrial sites, such as Windsor, Toronto, and Montreal, are actually closer to such major U.S. markets as<br />
New York, Boston, and Chicago than are popular production hubs in the southern U.S. <strong>Canadian</strong> railways<br />
often offer the shortest and fastest routes to key NAFTA markets. Compared to the competition, routing by<br />
<strong>Canadian</strong> rail is 700 miles shorter to Toronto and Memphis, and 650 miles less to Chicago depending on<br />
port and intermodal yard pair. Additionally, Canada offers the shortest route from the Atlantic coast to the<br />
U.S. Midwest by rail.<br />
Canada also offers the closest North American ports, in terms of sailing times, to the trans-Pacific and<br />
European trade routes. Western <strong>Canadian</strong> ports are a natural entry and exit point for Asian trade with<br />
North America while Eastern <strong>Canadian</strong> ports offer an attractive gateway for imported goods from Europe<br />
destined for Canada and Central and Northeast U.S. <strong>Canadian</strong> West and East coast ports are an average<br />
of 1.5 days closer to Asia and Europe respectively. <strong>Canadian</strong> Pacific ports are 77 to 1,313 nautical miles<br />
closer to Asia than U.S. West Coast ports. As shown in Table 2-5, the distance from Vancouver to<br />
Shanghai is 4,887 nautical miles, which is a 750 nautical mile difference than from LA/LB. <strong>Canadian</strong><br />
Atlantic ports also have the advantage of an approximate 157 to 1,118 nautical mile geographic proximity to<br />
Europe and ports along the Suez Canal as compared to U.S. East Coast ports.<br />
Copyright 2007: Saskatchewan Agrivision Corporation Inc. Page 2-11
January 2007<br />
<strong>Canadian</strong> <strong>Intelligent</strong> <strong>Super</strong> <strong>Corridor</strong> - <strong>Smart</strong> <strong>Inland</strong> <strong>Port</strong> <strong>Network</strong><br />
Table 2-5. Distance in Nautical Miles to Major Trans-Pacific Destinations from North American West Coast <strong>Port</strong>s<br />
Location <strong>Port</strong> Kobe, Shanghai Hong Singapore Busan, Korea<br />
Japan<br />
Kong<br />
Canada Prince Rupert 3,917 4,489 5,153 6,537 7,111<br />
Vancouver 4,301 4,887 5,550 6,932 7,498<br />
U.S. Seattle 4,378 4,971 5,634 7,013 7,600<br />
Oakland 4,710 5,353 6,003 7,350 8,154<br />
LA/LB 4,989 5,637 6,285 7,625 8,424<br />
Shortest Difference 84 77 102 84 81<br />
Longest Difference 1,132 1,072 1,313 1,148 1,088<br />
Source: TranSystems<br />
Table 2-6. Distance in Nautical Miles to Major Trans-Atlantic Destinations from North American East Coast <strong>Port</strong>s<br />
Location <strong>Port</strong> Felixstowe Rotterdam Hamburg Marseille <strong>Port</strong> Said<br />
Canada Halifax 2,550 2,659 2,817 2,897 4,355<br />
Montreal 2,872 2,973 3,112 3,257 4,700<br />
U.S. New York 3,061 3,168 3,320 3,414 4,872<br />
Hampton Roads 3,289 3,398 3,555 3,626 5,088<br />
Savannah 3,667 3,777 3,935 3,994 5,458<br />
Shortest Difference 189 195 208 172 157<br />
Longest Difference 1,117 1,118 1,118 1,103 1,097<br />
Source: TranSystems<br />
The emergence of China as an economic superpower has forced industrialized nations to shift global<br />
supply chains and realign patterns of trade and investment. Canada has taken advantage of its strategic<br />
location and plans to continue to enhance its position by initializing Pacific and Atlantic Gateway Strategies.<br />
Copyright 2007: Saskatchewan Agrivision Corporation Inc. Page 2-12
January 2007<br />
<strong>Canadian</strong> <strong>Intelligent</strong> <strong>Super</strong> <strong>Corridor</strong> - <strong>Smart</strong> <strong>Inland</strong> <strong>Port</strong> <strong>Network</strong><br />
Pacific and Atlantic Gateway Strategies<br />
The <strong>Canadian</strong> and various provincial governments have now recognized transportation as a key driver of<br />
economic development. Governments have made funding available to improve transportation infrastructure<br />
as part of transportation, trade and economic development policies. Some time ago the federal government<br />
announced funding of $591 million for the Pacific Gateway as part of Canada’s Asian Trade strategy. This<br />
funding was dedicated largely to transportation infrastructure upgrades in British Columbia that will<br />
enhance the ports of Vancouver and Prince Rupert. Key components will focus on strategic infrastructure,<br />
private investment and innovation, security and border efficiency, 21st Century governance, and policy<br />
renewal. Recently, the concept of an Atlantic Gateway has emerged. The Atlantic Gateway is being<br />
vigorously pursued by the office of External Affairs Minister 3 who has additional responsibilities for the<br />
Federal Government’s Atlantic Canada Opportunities Agency. In a recent budget the federal government<br />
has allocated $2.5 billion to transportation infrastructure upgrades.<br />
Canada’s Pacific Gateway strategy with<br />
its development of the new gateway<br />
container transhipment terminal<br />
capabilities at the <strong>Port</strong> of Prince Rupert<br />
and the planned improvements<br />
envisioned for the British Columbia ports<br />
has led to the logical systemic focus on<br />
the emerging <strong>Canadian</strong> Atlantic<br />
Gateway strategy and developments in<br />
Nova Scotia. By integrating capable<br />
container terminals at the extreme<br />
Western and Eastern ends of Canada’s<br />
growing intermodal rail network, a new<br />
competitive national intermodal logistics<br />
system emerges. Developments in<br />
central Canada such as Saskatchewan’s<br />
desire to create an inland smart port<br />
further bolster the emergence of a new improved North American intermodal land bridge.<br />
Since the Vancouver and Prince Rupert ports are located on the West Coast of Canada, and Halifax, Strait<br />
of Canso and Montreal ports are on the East Coast, there are distinct advantages in promoting the<br />
development of an integrated national intermodal strategy for Canada as a nation. In addition, developing a<br />
central smart inland port to serve North American markets from Pacific to Atlantic oceans would stimulate<br />
economic development throughout the country. This emerging transcontinental landbridge would benefit<br />
the ports involved, the rail and shipping lines, the large retailers, and indeed, all of North America.<br />
The development and promotion of Canada’s Pacific and Atlantic Gateways and associated intermodal rail<br />
trade corridors - including consideration of more efficient inland based supply chain activity away from<br />
current congestion points - will ensure that Canada has the necessary infrastructure in place to improve<br />
competitiveness and take advantage of the growing opportunities in world trade.<br />
3<br />
External Affairs Minister at this writing is the Honourable Peter MacKay who is domiciled in the Province of Nova Scotia.<br />
Copyright 2007: Saskatchewan Agrivision Corporation Inc. Page 2-13
January 2007<br />
<strong>Canadian</strong> <strong>Intelligent</strong> <strong>Super</strong> <strong>Corridor</strong> - <strong>Smart</strong> <strong>Inland</strong> <strong>Port</strong> <strong>Network</strong><br />
The Prairie Region – The Saskatchewan Advantage<br />
Saskatchewan is the transportation crossroads<br />
of the northern half of the North American<br />
continent with linkages to the four points of<br />
the compass. In the heart of North<br />
America, Saskatchewan is bordered on the<br />
west by Alberta, on the east by Manitoba, on<br />
the north by the Northwest Territories and<br />
Nunavut, and on the south by Montana and North<br />
Dakota. Saskatchewan has an area of 651,900 square<br />
kilometres. Over one half the Province is covered by<br />
forest, one-third by farmland and one-eighth by fresh<br />
water. Most of the approximate one million population live<br />
in the southern part of the province. The capital city of<br />
Regina has a population of 200,854, neighbouring Moose<br />
Jaw has a population of 34,857, while the largest city,<br />
Saskatoon, has a population of about 237,017 (Statistics<br />
Canada).<br />
Saskatchewan is strategically located along an efficient<br />
inland-based supply chain away from current congestion<br />
points. Intermodal transport is considered most cost effective<br />
for trips 1,130 kilometres or longer. Saskatchewan is 1,742 kilometres<br />
from Vancouver, 2,012 kilometres from Chicago and 2,979 kilometres from Montreal.<br />
The province is also well-situated for a distribution centre; it is only a day away<br />
by land from markets totalling 10 million people, and within two days travel from 80 million people in<br />
Canada and the U.S. Due to Saskatchewan’s proximity to the geographic and population centres of<br />
Canada and the U.S., transit times and shipping rates are competitive with other markets. Rail generally will<br />
have a longer transit time than truck, but service is available and reliable.<br />
Benefits<br />
The province is connected by an integrated principal highway network and intermodal national supply chain<br />
that supports growth in domestic and international trade and offers access to a highly productive labour<br />
market and intelligent systems transportation engineering and information technology (IT) companies.<br />
Highways - Within the 26,163 kilometres system of Saskatchewan provincial highways, there are 7,000<br />
kilometres of primary paved highways. Saskatchewan is accessed by the Yellowhead Highway and Trans-<br />
Canada Highway #1 and directly connects to the U.S. border along numerous highways including #6, #9<br />
and #39 which run north to south. The province is also centrally linked to the CANAMEX transportation<br />
corridor and NAFTA <strong>Super</strong>highway connecting Canada, the U.S. and Mexico. These highways essentially<br />
provide for the inter-regional, inter-provincial and international movement of goods and people.<br />
Copyright 2007: Saskatchewan Agrivision Corporation Inc. Page 3-1
January 2007<br />
<strong>Canadian</strong> <strong>Intelligent</strong> <strong>Super</strong> <strong>Corridor</strong> - <strong>Smart</strong> <strong>Inland</strong> <strong>Port</strong> <strong>Network</strong><br />
Rail – CN and CPR main lines run double-stack rail service through Saskatchewan, linking the province to<br />
Vancouver, Toronto, Montreal, Chicago and other key consumption zones in the U.S. Saskatchewan is the<br />
<strong>Canadian</strong> terminus of the CPR/Soo Line, which is a direct corridor to Chicago and the U.S. northeast. In<br />
addition, the OmniTRAX short line provides direct access to the <strong>Port</strong> of Churchill from Saskatchewan, and<br />
provides efficient access to all North American points through the CN railway system. CPR’s high-speed<br />
refuelling facility is located in Moose Jaw, Saskatchewan. This is the largest main line fuel facility on CPR’s<br />
North American network and the only major refuelling centre between Vancouver and Chapleau, Ontario<br />
and Glennwood, Minnesota.<br />
Figure 3-1. Saskatchewan Transportation <strong>Network</strong><br />
Source: TranSystems, Railway Association of Canada<br />
Trade - Saskatchewan is a trade-dependent province with nearly 40 percent of its annual GDP ($42.5<br />
billion) attributed to trade activities. Total world trade from Saskatchewan has risen by 102 percent over the<br />
last decade. In 2005, Saskatchewan experienced a 13.8 percent increase in international exports and an<br />
8.2 percent increase in manufacturing shipments. Total exports were equal to 70 percent of the province’s<br />
GDP. The U.S. is Saskatchewan’s largest trading partner. $9.5 billion worth of goods were shipped to the<br />
U.S. in 2005, an increase of $1.5 billion over the previous year (Saskatchewan Bureau of Statistics).<br />
The largest product volumes that move through Saskatchewan are oil and natural gas, minerals, and<br />
forestry and agriculture products.<br />
• Saskatchewan currently accounts for nearly one-third of the energy produced in Canada.<br />
• Saskatchewan is the largest producer of potash in the world, providing nearly one-half of the total<br />
global demand. In 2005, the province supplied 17 million tonnes of potassium chloride (potash) for use<br />
as fertilizer, including 9.5 million tonnes as export product. The proportion of shipments directed west,<br />
Copyright 2007: Saskatchewan Agrivision Corporation Inc. Page 3-2
January 2007<br />
<strong>Canadian</strong> <strong>Intelligent</strong> <strong>Super</strong> <strong>Corridor</strong> - <strong>Smart</strong> <strong>Inland</strong> <strong>Port</strong> <strong>Network</strong><br />
south, and eastbound were 36, 56, and 8 percent of the total respectively. Potash export shipments<br />
are projected to increase an average of 2.1 percent annually to 21 million tonnes by 2015.<br />
• Saskatchewan supplies 30 percent of the world’s output of uranium and is the only jurisdiction that<br />
produces uranium in Canada.<br />
• Canada is the largest lentil exporter in the world, and Saskatchewan produces 95 percent of Canada’s<br />
total production.<br />
Labour force – In 2005, Saskatchewan had a total labour force of 509,400. Overall, average employment<br />
in manufacturing grew by 1,500 jobs in 2005 while employment in transportation and warehousing<br />
expanded in 2005 by 1,900 jobs. Saskatchewan had the third lowest unemployment rate in the country,<br />
averaging 5.1 percent for 2005. The province’s workforce is one of the best educated in the country with<br />
approximately 60 percent of employees having some post-secondary education. Wage rates are also more<br />
competitive than British Columbia and Alberta.<br />
Technology – In the past decade, Saskatchewan has partnered with industry and others to establish<br />
technology transfer centres to assist in research and the commercialization of new technology.<br />
• Saskatchewan is home to two of the most successful intelligent systems transportation engineering, IT<br />
and design companies in Canada - International Road Dynamics and Massload Technologies<br />
Corporation. These firms offer expertise on <strong>Smart</strong> Work Zones, transponder technology, RFID<br />
technologies applied to transportation logistics, and weigh-in-motion systems to clients worldwide.<br />
• Saskatchewan has several strong IT companies with software development focus and/or experience in<br />
logistics, transportation and supply chain management, and project management including Axon<br />
Development Corporation, Clevor Technologies, Integrated Designs, Numa Technologies, and<br />
Technology Management Corporation.<br />
• Brandt Industries Ltd. is headquartered in Regina. The company developed the globally unique<br />
RoadRailer® technology.<br />
• Radiation Safety Institute of Canada - with national expertise in radiation inspections, measurements<br />
and related radiation data storage - is located in Saskatoon.<br />
• SED Systems, a division of Calian Ltd., is located in Saskatoon. The firm has 35 years experience in<br />
satellite test and control systems and other integrated communications processes.<br />
• Saskatchewan has many research and logistics firms that emphasize supply chain management such<br />
as LMS Logistics, Ghost Transportation Services, and Yanke Container <strong>Port</strong> Centre.<br />
• Saskatoon’s Innovation Place is one of North America’s most advanced research parks for<br />
bioresources, pharmaceuticals and the environment.<br />
• The Regina Research Park is one of Canada’s newest research parks specializing in petroleum,<br />
information technology and environmental sciences.<br />
• Both Saskatoon and Regina are part of TR Labs, the largest IT and Telecomm Research Consortium of<br />
industry and government sponsors in Canada. TR Labs has research focus on micro devices, digital<br />
media, wireless and networks technology. The SaskTel Research lab is also an active member of this<br />
consortium.<br />
• Saskatchewan has SR Net, an extremely high-powered research bandwidth and networking<br />
consortium, and is plugged into a powerful distributed grid computing network.<br />
Copyright 2007: Saskatchewan Agrivision Corporation Inc. Page 3-3
January 2007<br />
<strong>Canadian</strong> <strong>Intelligent</strong> <strong>Super</strong> <strong>Corridor</strong> - <strong>Smart</strong> <strong>Inland</strong> <strong>Port</strong> <strong>Network</strong><br />
Investment - In 2005, over $7.8 billion in new capital investment poured into Saskatchewan projects, up by<br />
4.6 percent from the level in 2004. More than 75 percent of that investment came from the private sector to<br />
expand, modernize and build new facilities in the province. For 2006, new capital spending in<br />
Saskatchewan is expected to reach $8.3 billion (Saskatchewan Industry and Resources).<br />
Business taxes - In April 2006, the Government of Saskatchewan approved the largest business tax cuts<br />
in the province’s history – making Saskatchewan one of the most tax-competitive jurisdictions in Canada.<br />
Saskatchewan decreased its Corporate Income Tax rate from 17 percent to 14 percent as of July 2006 and<br />
will decrease it further to 12 percent by July 2008. The package will also eliminate corporate capital tax for<br />
new capital investment and reduce the corporate income tax rate to five percent by July 2008<br />
(Saskatchewan 2006 Budget).<br />
Competitive advantage - In 2006, the international consulting firm KPMG released the latest edition of<br />
Competitive Alternatives: A Guide to International Business Costs. This report compares the cost of doing<br />
business in 128 cities in nine countries (France, Germany, Italy, the Netherlands, the United Kingdom,<br />
Japan, Singapore, the United States and Canada). The survey included four Saskatchewan cities:<br />
Saskatoon, Regina, Prince Albert and Moose Jaw. In a comparison of 98 North American cities, Moose<br />
Jaw placed fifth, Prince Albert sixth, Saskatoon 21st, and Regina 28th based on input costs for labour,<br />
taxation, facilities (land, construction, leasing rates), transportation, utilities, depreciation, and financing<br />
(interest costs). Saskatoon was also ranked the lowest-cost jurisdiction among the 21 featured cities from<br />
the North American Midwest (KPMG, 2006).<br />
Challenges<br />
Cabotage restrictions – Existing cabotage regulations on containers in Canada restricts the movement of<br />
international containers loaded with domestic cargo to a single internal move without having to pay<br />
<strong>Canadian</strong> import duty and taxes on the container itself. This “one move” must be in the direction of or to the<br />
location where export cargo will be loaded into the container. “The one move requirement in Canada does<br />
not allow for triangular or quadrangular strategies that could reduce costs significantly. The inability to redivert<br />
containers in order to take advantage of market variations inhibits the ability of steamship companies<br />
to offer competitive rates. As a result, shippers in Canada, particularly rural or remotely located shippers,<br />
have difficulty accessing intermodal equipment and are thus limited in their flexibility to choose alternative<br />
modes and routes. Furthermore, empty repositioning costs are frequently passed on to shippers, reducing<br />
their competitiveness in export markets” (Vido et al., 2001).<br />
The Transport Institute at the University of Manitoba performed an assessment of the impact that container<br />
cabotage regulations have on <strong>Canadian</strong> operations and determined that the policy causes containers to<br />
accumulate in certain areas of the country, takes up rail capacity, burns fuel and increases costs to<br />
shippers when carriers charge for empty repositioning moves. “These policies may have been designed to<br />
reduce cabotage and protect domestic <strong>Canadian</strong> container carriers, but at considerable cost to the<br />
<strong>Canadian</strong> importer / exporter community” (Vido et al., 2001).<br />
Copyright 2007: Saskatchewan Agrivision Corporation Inc. Page 3-4
January 2007<br />
<strong>Canadian</strong> <strong>Intelligent</strong> <strong>Super</strong> <strong>Corridor</strong> - <strong>Smart</strong> <strong>Inland</strong> <strong>Port</strong> <strong>Network</strong><br />
Railway revenue cap - In 2000, the Government of Canada established the ceiling on maximum revenue<br />
to be derived from the movement of grain from Prairie origins to terminals at Vancouver, Prince Rupert,<br />
Thunder Bay and Churchill. According to Dr. Barry E. Prentice, Professor of Supply Chain Management at<br />
the University of Manitoba, containerized grain costs the railways more to move than bulk, consequently,<br />
every container of grain carried imposes a financial penalty on the railways.<br />
Stable rail rates - Intermodal rail rates are one of the largest components of the origin to destination<br />
transportation expenses. Consequently, moderate changes in rail rates can have a potentially significant<br />
effect on total logistics costs and Saskatchewan’s competitive positioning.<br />
Supporting infrastructure – There are concerns about the current state of the infrastructure system within<br />
the region. Saskatchewan’s future viability as a centre of international trade and its economic growth are<br />
dependent on an efficient rail and road system that connects to the key trade corridors. For fiscal year<br />
2007, Saskatchewan Department of Highways and Transportation allocated $400 million, the largest<br />
budget in the department's history by $90 million, in order to advance the province's long-term<br />
transportation strategy.<br />
Education and training - Education and training are critical to provide the necessary knowledge, skills<br />
and understanding of technologies to be competitive in international trade. The University of<br />
Saskatchewan, College of Engineering has strong expertise in <strong>Intelligent</strong> Transport Systems engineering,<br />
and has spun off other companies in scientific pavement design as well as intelligent systems. The<br />
University also has a Transportation Research Centre funded by Transport Canada, with recent emphasis<br />
on related IT applications. However, there may be a need to offer additional training in the areas of trade<br />
procedures to individuals in order to increase the number of qualified work force.<br />
Logistics - More and more companies are relying on outsourcing manufacturing, ordering raw materials<br />
from overseas locations and turning to freight forwarders or logistics firms to assist them in making their<br />
supply chains more efficient. Developing strategies to serve the current and future needs of companies that<br />
desire successful international endeavours will be essential for the province’s success.<br />
Copyright 2007: Saskatchewan Agrivision Corporation Inc. Page 3-5
January 2007<br />
<strong>Canadian</strong> <strong>Intelligent</strong> <strong>Super</strong> <strong>Corridor</strong> - <strong>Smart</strong> <strong>Inland</strong> <strong>Port</strong> <strong>Network</strong><br />
CISCOR <strong>Smart</strong> <strong>Inland</strong> <strong>Port</strong> <strong>Network</strong> – Bringing It All Together<br />
In determining if inland port facilities are viable in Saskatchewan, it is important to understand what an<br />
inland port is and what elements it encompasses. Leitner and Harrison define inland ports as “a site located<br />
away from traditional land, air and coastal borders containing a set of transportation assets (normally<br />
multimodal) and with the ability to allow international trade to be processed and altered by value-added<br />
services at the site as goods move through the supply chain.” This work further explains that inland ports<br />
can be sites where congested ports are relieved, a wide variety of services are provided at one location and<br />
trade processing occurs away from national borders (Leitner and Harrison, 2001).<br />
In a study of shipper preferences for North American inland port development, Walter and Poist defined an<br />
inland port as an “intermodal port that would facilitate international and domestic commerce; it would<br />
support export and import opportunities by consolidating at a single source all services related to trade,<br />
licensing, loading, storage, light assembly and bonding.” These definitions help set a framework to<br />
understand how the development of an inland port in Saskatchewan could change the distribution structure<br />
in the <strong>Canadian</strong> supply chain, increasing efficient trade flows and diversifying traditional port functions.<br />
Saskatchewan’s inland port is a proactive initiative to capture the growing trend of expedited cargo<br />
movement through marine terminals and onto rails. The predicted rise of trade by 300 to 400 percent in the<br />
next 20 years will be accompanied by restructured supply chains to integrate landside connections and<br />
transfer freight collection and distribution functions to inland terminals. <strong>Port</strong>s will strive to prevent additional<br />
congestion of limited seaport areas and lines will concentrate their non-local cargo onto express rail<br />
services at the closest ports to Asia and/or Europe. These ports will develop efficient direct-to-rail<br />
operations, shuttling the cargo to an inland port. The service is expected to generate faster door-to-door<br />
transits for shippers. The days removed from the supply chain would result in lower logistics costs and<br />
greater supply chain flexibility, including the ability to offset delays elsewhere. The additional efficiency in<br />
the door-to-door supply chain could translate into incremental savings in logistics costs (inventory carrying<br />
costs, fewer stock-outs, etc.) (Containerization International, 2004).<br />
The fundamental issue with shuttling containers to an inland terminal is the additional cost of handling.<br />
However, there are balancing cost benefits associated with inland development such as reduced inland<br />
location and labour costs, consolidated rail traffic, reused empty backhauls and value-added services. For<br />
instance, 20-foot and 40-foot standard marine containers can be loaded into 53-foot domestic boxes. The<br />
consolidation of cargo into fewer double-stack trains hauling domestic containers can decrease transport<br />
costs for shippers and reduce outbound traffic on rail lines by approximately 45 percent. Another<br />
alternative is to load cargo into RoadRailer ® trailers that can be pulled directly behind other freight<br />
equipment without the use of trailer flatcars. RoadRailer ® is a highway trailer, or semi-trailer, that is<br />
specially-equipped for use in railroad intermodal service.<br />
Back-haul empty international containers can be intercepted and loaded with international export cargo<br />
from the Saskatchewan region and hauled by rail to the port of export. Current CN and CPR operations<br />
involve hauling a train of hopper cars filled with bulk cargo often followed by hauling a train of empty<br />
containers on the main line. By consolidating bulk cargo into empty containers cars, the same commodities<br />
can be moved using fewer resources, thereby improving asset utilization. In addition, this would further<br />
increase the capacity of the rail lines, leaving additional track capacity for other railcars. Essentially, more<br />
Copyright 2007: Saskatchewan Agrivision Corporation Inc. Page 4-1
January 2007<br />
<strong>Canadian</strong> <strong>Intelligent</strong> <strong>Super</strong> <strong>Corridor</strong> - <strong>Smart</strong> <strong>Inland</strong> <strong>Port</strong> <strong>Network</strong><br />
containerization of bulk products would reduce the number of eastbound trains of empty hopper cars<br />
returning to the prairies and the number of westbound trains filled with empty containers.<br />
For each additional million tonnes of grain that is containerized, the capacity of the rail could be increased<br />
by 70 to 250 trains in each direction by eliminating empty container and empty hopper cars, according to<br />
Dr. Fung, Canada Foundation for Innovation member and chief executive officer of the ACDEG Group. A<br />
million tonnes of grain is the equivalent of approximately 50,000 TEUs on a 100-car double-stacked train.<br />
Dr. Fung believes the overall unit operational cost savings in grain handling and transportation would be<br />
between 30 and 50 percent. Currently, a large percent of bulk products that are being containerized are<br />
moved to port and then transloaded into containers at the port. This has resulted in virtually no<br />
improvement on overall hopper cycle times and velocity.<br />
Overall, Saskatchewan’s inland port concept serves a role in larger logistics system - “the physical design,<br />
business processes, and operational characteristics that increase the velocity of cargo moving through<br />
ports or terminals compared to current practices.” This has been defined by the U.S. Maritime<br />
Administration’s Office of Intermodal Development as an agile port system.<br />
Agile <strong>Port</strong> System<br />
The agile port system (APS) proposes the use of just-in-time fulfillment processes combined with the<br />
capabilities of an inland port to increase cargo velocity. There are numerous variations of the APS, but the<br />
general concept consists of marine terminals, inland intermodal facilities, and a dedicated freight corridor<br />
that connects the waterside with the inland facilities. The goal of the APS concept is to increase throughput<br />
capacities of marine terminals by moving the cargo storage and sorting components to an inland location<br />
where land development costs are less expensive and traffic congestion is reduced.<br />
The APS is a concept that can be expanded and applied to many different regional configurations. For<br />
example, in Southern California, North America’s largest cargo importer, marine terminals can be<br />
considered to be the aggregate of both the LA/LB complexes. Sorting, customs, and security activities<br />
could be transferred from waterside locations to “remote port sites” in regional high desert areas. As<br />
projected figures show increases of triple the current container volumes by the year 2020, this industry<br />
must look to innovative transportation systems like the APS. This will require the cooperative backing from<br />
industry and public participants including port operators, short and long haul railroads, truckers and regional<br />
government entities (TranSystems, 2003).<br />
Logistic Management System<br />
Integrated logistic centres have become another facet of inland port development. These hubs often serve<br />
as a collaborative effort between multiple players without geographical alignment. <strong>Intelligent</strong> information<br />
transfer between these parties has become the way to lessen overcapacities in ports and terminals by<br />
aligning agencies and logistics suppliers on a common platform. While there are various types of logistic<br />
centres, Kansas City’s <strong>Smart</strong><strong>Port</strong> has become the preferred model to follow for streamlining cargo<br />
processing through information assimilation.<br />
Copyright 2007: Saskatchewan Agrivision Corporation Inc. Page 4-2
January 2007<br />
<strong>Canadian</strong> <strong>Intelligent</strong> <strong>Super</strong> <strong>Corridor</strong> - <strong>Smart</strong> <strong>Inland</strong> <strong>Port</strong> <strong>Network</strong><br />
<strong>Smart</strong><strong>Port</strong> - A not-for-profit economic development organization created to increase international trade<br />
among Kansas City businesses by operating a trade processing centre that works in concert with traditional<br />
border ports of entry. Kansas City (KC) <strong>Smart</strong><strong>Port</strong> is a virtual inland port and area-wide business initiative<br />
that is working to increase trade within the region by promoting the entire international commerce<br />
infrastructure in the Greater Kansas City area (KC <strong>Smart</strong><strong>Port</strong>).<br />
<strong>Smart</strong><strong>Port</strong> has three goals in its mission:<br />
• To grow the area’s transportation industry by attracting businesses with significant transportation and<br />
logistics elements.<br />
• To make it cheaper, faster, more efficient, and secure for companies to move their goods.<br />
• To improve access to international markets for all businesses.<br />
The premise behind the <strong>Smart</strong><strong>Port</strong> program is to capitalize on all rail transport from ports in Mexico to the<br />
U.S. and from Canada to the U.S. and vice versa. U.S., Mexican and <strong>Canadian</strong> Customs are located in<br />
Kansas City to allow for expeditious cargo transport within all transport points. The <strong>Smart</strong><strong>Port</strong> concept<br />
relieves stress on major American ports responsible for a bulk of Asian imports by rerouting the vessels to<br />
different ports of entry.<br />
<strong>Inland</strong> <strong>Port</strong> Services<br />
Canada has the opportunity to offers shippers and carriers sophisticated landside logistics operations and<br />
facilities to efficiently transfer cargo to inland North American destinations. Traditional inland transportation<br />
services are being restructured to integrate landside connections and transfer freight collection and<br />
distribution functions to inland terminals. Value-added supply chain management services have become a<br />
significant dimension to inland port performance and competitiveness. <strong>Inland</strong> ports that operate as a<br />
logistics centre for the flow of cargo can ensure that shipments are executed efficiently, economically, on<br />
time, and according to each customer’s logistics strategy.<br />
The seamless and timely clearance of international shipments between Canada and the U.S. can be<br />
achieved through the integration of leading-edge information and security technology services for the<br />
exchange of transportation and trade data. It is recommended that the <strong>Canadian</strong> <strong>Intelligent</strong> <strong>Super</strong> <strong>Corridor</strong><br />
<strong>Smart</strong> <strong>Port</strong> offer the following supporting services and facilities: a free trade zone, distribution warehouses,<br />
customs clearance, transload operations, empty container management and advanced logistics centre<br />
employing state-of-the-art trade information systems.<br />
Foreign Trade Zones (FTZ) and Export Distribution Centres (EDC) - FTZs are customs-approved areas<br />
in which foreign goods can be stored, duty- and tax-free, prior to onward shipment to another economy.<br />
Until six years ago, Canada did not make provisions available for FTZ capabilities. The EDC program, part<br />
of Canada’s Budget Plan 2000, provided firms with the opportunity to operate EDC's in Canada and to<br />
provide a flexible tax- and duty-free environment to the U.S. and world markets.<br />
Firms operating within an EDC are able to purchase <strong>Canadian</strong> goods on a tax-free basis and import foreign<br />
goods on a tax- and duty-free basis if the goods are primarily intended for export/re-export. EDCs enhance<br />
cash flow by deferring Customs duties until the merchandise leaves the premises and enters <strong>Canadian</strong><br />
Customs territory. If the imported goods are re-exported from the EDC, the importer does not pay Customs<br />
duties. In the case of manufacturing or assembly in the zone, the importer may choose to pay duty on the<br />
Copyright 2007: Saskatchewan Agrivision Corporation Inc. Page 4-3
January 2007<br />
<strong>Canadian</strong> <strong>Intelligent</strong> <strong>Super</strong> <strong>Corridor</strong> - <strong>Smart</strong> <strong>Inland</strong> <strong>Port</strong> <strong>Network</strong><br />
components or the finished product. If the duty on the finished product is less than those of the<br />
components, the importer can lower costs by manufacturing in the zone. Another common EDC function is<br />
to store merchandise until an import quota has either expired or been renewed to allow additional entries.<br />
Value-added opportunities are provided for, as long as the goods are not manufactured or substantially<br />
changed in the EDC environment. For functional purposes, EDCs are typically warehouse operations, but<br />
may, in some instances, comprise entire manufacturing and assembly plants. While the most commonly<br />
associated zone function may be storage, merchandise in the zone may also be tested, sampled,<br />
repackaged, repaired, mixed, cleansed, manufactured, destroyed or processed. The EDC also offers the<br />
opportunity to physically display products, as well as to offer potential buyers the opportunity to test/sample<br />
products on the zone premises.<br />
Unlike U.S. FTZs, firms in Canada can choose where to locate their EDC operations and are not confined<br />
to a pre-defined and limited piece of land. EDCs allow exporters to avoid the U.S. inverted tariff and enjoy<br />
the benefits of U.S. FTZs without having to enter the high-cost U.S. environment. Up-front financing<br />
requirements are eliminated through lowered bonding requirements (from 100 percent of duties and taxes<br />
payable to 0 percent for low risk goods and 60 percent for high-risk goods).<br />
<strong>Canadian</strong> distributors primarily exporting to the U.S. and other foreign markets (firms deriving 90 percent or<br />
more of their revenues from exports) should consider establishing operations within an EDC.<br />
Likewise, an EDC program certificate would benefit firms that transport goods in bulk and then undertake<br />
repackaging, labelling, product customisation, pick and pack operations, or other value-added activities that<br />
fall short of manufacturing just prior to delivery to the customer. Essentially, any firm that is primarily<br />
involved in export distribution of goods would benefit from EDC operations.<br />
The FTZ functions of storage and further processing of materials could provide direct benefits to an inland<br />
port in Saskatchewan. While NAFTA has marginalized some of the benefits of FTZs for products<br />
originating in the U.S. and Mexico, the prolific presence of FTZs near both borders substantiates the<br />
continued benefits offered by these programs. Firms can take advantage of Canada's geographic location<br />
to access the U.S., Mexican and world markets.<br />
Distribution Hub – A distribution centre is a collection of warehouses, or other specialized or refrigerated<br />
buildings, stocked with products to be re-distributed to retailers or wholesalers. Some regions propose the<br />
purposeful development of distribution districts or “freight villages” or “gateways,” supported by design,<br />
management and zoning policies that provide for goods movement. Since Canada’s Customs and Revenue<br />
Agency Act (CCRA) previously allowed limited FTZ-like operations, Canada generally was not viewed as<br />
an attractive location for modern North American distribution centres - despite its geographic and operating<br />
cost advantages. With the establishment of the EDC program and various significant CCRA streamlining<br />
initiatives such as “single window” licensing and improved (i.e., reduced or eliminated) security<br />
requirements, distribution centres can be a viable component of an inland port in Canada. Since<br />
distribution centres require a lot of space, costs associated with real estate are an important aspect of the<br />
fixed costs of a distribution centre operation. In addition, incentives offered by central and local<br />
governments often play a key role in locating distribution centres.<br />
Copyright 2007: Saskatchewan Agrivision Corporation Inc. Page 4-4
January 2007<br />
<strong>Canadian</strong> <strong>Intelligent</strong> <strong>Super</strong> <strong>Corridor</strong> - <strong>Smart</strong> <strong>Inland</strong> <strong>Port</strong> <strong>Network</strong><br />
The location of distribution centres can be used to leverage other businesses to locate or serve the region.<br />
For example, the location of distribution centres has become a key factor in attracting steamship line<br />
service at the port cities in which the centres are served. With increased vessel service driven by the<br />
distribution centre location, other importers and exporters in the region will benefit with increased frequency<br />
of service. The Georgia <strong>Port</strong> Authority is a successful example of the advancement of the distribution<br />
centre model. The port aggressively marketed shippers, offering economic incentives for them to locate<br />
distribution centres in the less-congested areas near the port. Since 1997, 12 companies have built new<br />
facilities containing more than 9 million square feet of warehousing and 16 shipping lines call at the port<br />
from Asia every week - compared with four or five in 1990.<br />
The development of warehousing/distribution complexes and cargo processing facilities at the inland port in<br />
Saskatchewan can create a national distribution hub, where major retailers/importers route large portions of<br />
their cargoes. An educated work force and lower than average operating and living costs offered by the<br />
region should ultimately drive considerations for manufacturing by companies with distribution activities.<br />
Customs Clearance – One barrier to more efficient movement of containerized cargo destined for the U.S.<br />
is the need to clear customs at the U.S. port of entry. Potential delays add to the cost and uncertainty for<br />
shippers trying to serve customers in a highly competitive market. An inland port of pre-clearance would<br />
smooth the customs process, thus reducing the cost and time of shipments. The facility could serve as an<br />
international port of entry, arranging for imports to be transported “In-bond” from the coast for customs<br />
clearance upon arrival, or provide “in-bond” warehousing and storage until the goods are needed. “Inbond”<br />
freight is an import or export shipment that has not yet been cleared by <strong>Canadian</strong> customs officials,<br />
but has physically entered Canada with the approval of Canada Customs. Container shipments could be<br />
tracked using intelligent transportation systems, including global positioning systems or radio frequency<br />
identification systems, and monitored throughout the supply chain.<br />
If a pre-clearance system for transborder cargo could be put in place at a <strong>Canadian</strong> inland port, similar to<br />
those already operating in <strong>Canadian</strong> airports, it would be a key driver in making Saskatchewan the nation’s<br />
premier logistics and distribution centre. Through the development and implementation of such a facility, it<br />
will be possible to:<br />
• Coordinate with Mexican, <strong>Canadian</strong>, and U.S. Customs officials for pre-clearance for border crossings.<br />
• Pre-weigh and apply anticipated fees to avoid border delays and unnecessary fines.<br />
• Offer import inspections and export certification services.<br />
• Streamline shipments from Asia and cut the time and labour costs associated with shipping through<br />
congested U.S. ports on the West Coast.<br />
• Utilize current technological innovations to maximize the cost/benefit for interstate truck travel and<br />
intermodal rail movements.<br />
Transload and Consolidation – Shippers have increased their use of transload strategies due to the<br />
gains in supply chain efficiency. The initial motivation behind transloading was the cost savings from<br />
transferring cargo out of international containers into larger domestic containers. This basic transfer<br />
operation, for example, from five 40-foot international containers into three 53-foot domestic containers -<br />
generates savings in domestic and crossborder transport costs. In recent years, the basic transload<br />
operation has evolved into a more complex set of cargo manipulation strategies (mix-and-match, merge-intransit,<br />
etc.) that improve supply chain efficiency.<br />
Copyright 2007: Saskatchewan Agrivision Corporation Inc. Page 4-5
January 2007<br />
<strong>Canadian</strong> <strong>Intelligent</strong> <strong>Super</strong> <strong>Corridor</strong> - <strong>Smart</strong> <strong>Inland</strong> <strong>Port</strong> <strong>Network</strong><br />
The ability to manipulate the freight creates value to the shippers instead of the basic transload operation.<br />
On the export side, the basic transload operation is more typical due to the homogeneous nature and lower<br />
value of the commodities. Types of activities and benefits for shippers of imported cargo include:<br />
• Combining cargo from different origins at the inland port.<br />
• Mixing international cargo with domestic freight.<br />
• Creating specific loads for direct delivery to individual stores or customers, thus avoiding re-handling of<br />
cargo.<br />
• Delaying the inventory placement decision, allowing companies to respond to changes in customer<br />
demand at the store level, which lowers inventories and other logistics costs (stock outs, etc.).<br />
Shippers and their service providers seek out locations that already have transload capabilities or an<br />
environment suitable for new transload operations. Requirements include land, domestic equipment<br />
availability, rail connections, and labour. The total U.S. West Coast transload market amounts to as much<br />
as 15 percent of total eastbound trans-Pacific trade. Surveys of shippers show that continued growth in the<br />
use of transload operations is expected, and that shippers are interested in alternatives to the L.A. Basin to<br />
reduce the risk associated with relying on a single port of entry (TranSystems, 2003).<br />
Empty Container Management – Efficient management of empty containers is a global issue, influenced<br />
by international trade patterns and mostly dictated by ocean carriers’ interests. Typically, carriers want to<br />
minimize costs related to empty containers given that their primary concern is the transportation of loaded<br />
containers. The goal is to reduce empty movements in order to minimize total transport costs, while<br />
satisfying shipper’s demands for timely availability of empty containers.<br />
The two primary methods for rationalizing empty container flows are by using low-priority manifest trains to<br />
reposition empties inland to be loaded with export cargo or by filling backhaul empties with loads. The<br />
profitability of most container operations is highly dependant on using backhaul cargo to fill returning empty<br />
containers.<br />
Logistics and cargo consolidation provides an opportunity to effectively utilize the empty container capacity,<br />
to the extent that these containers could be organized at an inland port and tapped with <strong>Canadian</strong> exported<br />
products without the need for container repositioning. Empty container management at an inland port in<br />
Saskatchewan would reduce the total costs of moving cargo by rail between the prairies and the coastal<br />
ports, and improve container supply in Saskatchewan.<br />
Logistics Centre – Logistics is defined as “the process of planning, implementing and controlling the<br />
efficient, cost-effective flow and storage of raw materials, in-process inventory, finished goods, and related<br />
information from point of origin to point of consumption for the purpose of conforming to customers’<br />
requirements” by the American Council of Logistics Management. Logistics is essentially concerned with<br />
the flow of materials, information and services along the vertical and horizontal supply chain that seeks to<br />
coordinate the flows (Panayides, 2006).<br />
Copyright 2007: Saskatchewan Agrivision Corporation Inc. Page 4-6
January 2007<br />
<strong>Canadian</strong> <strong>Intelligent</strong> <strong>Super</strong> <strong>Corridor</strong> - <strong>Smart</strong> <strong>Inland</strong> <strong>Port</strong> <strong>Network</strong><br />
Industrial trends toward just-in-time manufacturing, time definite deliveries and door-to-door transportation<br />
has created a specialized need for “control agents”, who ensure that shipments from many suppliers are<br />
executed efficiently, economically, on-time, and according to each customer’s logistics strategy. The<br />
primary goal of an inland port is to provide seamless flows for cargo traded among the North American<br />
markets. Through physical distribution management and advanced electronic commerce technology, port<br />
staff can serve as logistics agents. Services could include:<br />
• Arranging for transport and handling services at a favourable cost for the shipper.<br />
• Processing in-bond cargo and customs documentation for expedited border clearance.<br />
• Inventory management by tracking shipments in real time and at any location along the supply chain.<br />
• Alerting shippers to specific conditions or requirements of the destination country.<br />
• Providing a centralized source of information on transportation for both shippers and transportation<br />
providers.<br />
The ability of <strong>Canadian</strong> firms and industries to adapt to evolving value-chains and to enhance global supply<br />
network activities through logistics management will be essential to their future competitiveness and longterm<br />
economic viability. The provision of these services at an inland port would support shippers and<br />
transport service providers’ goal to achieve supply chain excellence. Without the burden of existing<br />
infrastructure, an inland port in Saskatchewan can embed information technology into the design to achieve<br />
increased productivity and provide faster cargo turnaround. Older, more established inland port<br />
infrastructure cannot as readily take advantage of these technologies and productivity enhancements since<br />
they must invest in upgrades to existing infrastructure.<br />
<strong>Inland</strong> port facilities in Saskatchewan will also have the opportunity to offer services that are tailored to the<br />
products handled. The inland facility could provide additional value-added services directly related to<br />
container storage, food processing and cargo security.<br />
Container Depots: A container depot stores surplus containers, provides container maintenance and<br />
repair services, and serves as a supply point for empty containers.<br />
Food Processing: The techniques and methods used to convert raw agricultural ingredients into finished,<br />
consumer-ready products require the application of labour, machinery, energy, and management. The<br />
process employs handling, manufacturing, and packaging techniques to add economic value to raw<br />
commodities harvested from the farm or the sea. Given the flow of agricultural products transported through<br />
the Saskatchewan region, food processing is a likely prospect for industry growth around an inland port.<br />
Secure Trade Processing Centres: <strong>Inland</strong> ports provide essential trade processing services such as<br />
customs clearances that require security functions. Security procedures can be performed independently of<br />
conventional port containerized operations ensuring efficient processing and minimizing disruption to the<br />
flow of containers at the port of entry.<br />
Copyright 2007: Saskatchewan Agrivision Corporation Inc. Page 4-7
January 2007<br />
<strong>Canadian</strong> <strong>Intelligent</strong> <strong>Super</strong> <strong>Corridor</strong> - <strong>Smart</strong> <strong>Inland</strong> <strong>Port</strong> <strong>Network</strong><br />
Benefits to Carriers, <strong>Port</strong>s, Shippers and Government<br />
In order for the inland port to be successful, it must benefit a disparate group of stakeholders. This group<br />
includes the commercial rail carriers and shipping lines, the national ports and private port operators, the<br />
beneficial cargo owners, both import and export, plus the national government of Canada. In order to do<br />
so, it must have the following attributes:<br />
Financially Sustainable: Development and operation of the inland port must be financially sustainable for<br />
the investors, the operators and local service providers in order to ensure that a long-term commercial<br />
operation is maintained for the benefit of all of the stakeholders. Therefore, the inland port must first<br />
financially benefit its investors, owners and operators.<br />
Commercially Attractive: The inland port must be commercially attractive to the rail carriers by lowering<br />
their operating costs, providing higher rail car utilization and increasing their cargo volume. Without these<br />
benefits, the rail carriers will have little incentive to “stop a train” in Saskatchewan.<br />
Supply Chain Management: The inland port must function as a technology centre for shipping lines and<br />
other carriers to manage cargo movement from the ship to the market, as well as the return of empties and<br />
backhaul cargo. Shipping lines will expect information technology systems that will enhance in-transit<br />
visibility, reduce demurrage and delays, and increase backhaul revenue cargo.<br />
Seaport Extension: The inland port must be a service extension of the seaports so that north-western and<br />
north-eastern <strong>Canadian</strong> ports can offer extended service to the <strong>Canadian</strong> heartland and U.S. Midwestern<br />
states. It also must increase the market reach and profitability of the private terminal operators at those<br />
ports.<br />
Shipping Options: The inland port must offer new shipping options to the cargo owners, either by<br />
providing a cheap and convenient transloading centre for cargo arriving through Pacific Northwest<br />
gateways, or by offering a new service, such as containerized export of agricultural products.<br />
Economic Development: Finally development of the inland port must provide economic development<br />
benefits to the Province of Saskatchewan and the Nation of Canada as a whole. Local and national<br />
resources will be required to foster the inland port and some of the resulting benefits must accrue to the<br />
government stakeholders.<br />
Taken together, these goals define the benefits to be expected from the inland port. However, realization of<br />
these benefits is only possible if they are distributed equally among the stakeholders. For the developers<br />
and local business owners, a financially sustainable port will be expected to have benefits as follows:<br />
• A reasonable and secure return on investment. This return should be on the order of 18 to 25 percent<br />
for short-term equity and 12 to 18 percent for a long-term stake.<br />
• Management and operating fees amounting to six to eight percent of total revenues.<br />
• Creation of new business opportunities that are based on value added to cargoes transiting<br />
Saskatchewan. These opportunities could include branding and repackaging, freight and logistics<br />
services, and opening new export markets driven by the availability of intermodal service to the ports.<br />
Copyright 2007: Saskatchewan Agrivision Corporation Inc. Page 4-8
January 2007<br />
<strong>Canadian</strong> <strong>Intelligent</strong> <strong>Super</strong> <strong>Corridor</strong> - <strong>Smart</strong> <strong>Inland</strong> <strong>Port</strong> <strong>Network</strong><br />
The rail carriers will be looking for some specific benefits to either; terminate, dispatch, or otherwise stop a<br />
train in Saskatchewan. These benefits must be substantial in order to provide sufficient incentive to change<br />
what is currently a successful rail connection to the U.S. Some benefits to the railroads should include:<br />
• Potential capture of at least 130,000 TEU per year of import cargo from Asia that are seeking<br />
alternative routes into the heartland of North America, which will increase over time.<br />
• Potential capture of at least 130,000 TEU per year of export cargo that is seeking routes primarily to<br />
the Asia Pacific markets, which will increase over time.<br />
• The ability to fill westbound containers and westbound intermodal cars with revenue cargo that would<br />
otherwise be returned empty, thereby increasing capacity due to better asset utilization and fewer nonproductive<br />
moves.<br />
• More frequent service and timely service for short-haul customers, low-volume destinations and U.S.<br />
destinations that are west of the existing U.S. rail hubs.<br />
• “Truckaway” options from an eastern hub point to the U.S. as opposed to bringing trucks all the way to<br />
Vancouver.<br />
• New services to offer local, NAFTA and international customers.<br />
Shipping lines operate on a very close margin, and often the percentage of backhaul cargo determines the<br />
profitability of a liner service. At the same time, shippers have the choice of several competing trans-Pacific<br />
options and look for the best value in terms of cost, velocity and level of service. The CISCOR <strong>Smart</strong><br />
<strong>Inland</strong> <strong>Port</strong> <strong>Network</strong> will advantage the shipping lines in this regard with the following logistics benefits:<br />
• Automate customs clearance to reduce cargo dwell and allow “blue lane” border crossing.<br />
• Consolidate value-added data services and foster a cadre of supply chain data management<br />
professionals into a single logistics information hub to serve the <strong>Canadian</strong> <strong>Intelligent</strong> <strong>Super</strong> <strong>Corridor</strong>.<br />
• Enhance cargo velocity through the management of in-transit data communication.<br />
• Attract backhaul revenue cargo through the intelligent management of empty container deployment and<br />
positioning.<br />
If the CISCOR <strong>Smart</strong> <strong>Inland</strong> <strong>Port</strong> <strong>Network</strong> is to be a success, it must function as an adjunct and extension<br />
of the Pacific Northwest ports. <strong>Port</strong> and carrier involvement as a stakeholder can be expected to result in<br />
the following benefits:<br />
• Faster cargo velocity for containers, which will be stored, sorted or transloaded in Saskatchewan. This<br />
will help increase the throughput of existing seaport facilities.<br />
• Recovery of vital seaport land areas to serve essential port functions and reduce the need for<br />
additional local infrastructure.<br />
• Opportunity to provide additional shipping “products” to carriers and cargo owners.<br />
• Movement of various container handling and processing activities, such as container stuffing and<br />
stripping, empty storage, and customs inspection away from the congested port zones.<br />
• Competitive advantage over rival ports through effective landside transportation management. The<br />
effect of increased services and a reduction in transportation costs influences the price of the output<br />
and thus the attractiveness of a port, further boosting cargo concentration.<br />
• A more central role in the international logistics system through synchronization of the seaport-inland<br />
port system in the transport chain.<br />
Copyright 2007: Saskatchewan Agrivision Corporation Inc. Page 4-9
January 2007<br />
<strong>Canadian</strong> <strong>Intelligent</strong> <strong>Super</strong> <strong>Corridor</strong> - <strong>Smart</strong> <strong>Inland</strong> <strong>Port</strong> <strong>Network</strong><br />
Ultimately, the shipper will become the “customer” of the inland port and will look for specific economic and<br />
logistics benefits to be derived from either transloading imports or stuffing exports in Saskatchewan. These<br />
benefits will be directly due to favourable location, low cost labour and available land. The type of benefits<br />
that will attract shippers include:<br />
• Door-to-door transit time that is competitive with current practice and other inland destinations.<br />
• Favourable contract pricing agreements with the ports, the railroads and the inland terminal operator.<br />
• Transload efficiencies allowing the consolidation of three 40-foot international containers into two larger<br />
capacity domestic containers.<br />
• Added-value services such as labelling, packaging, or minor assembly prior to importing into the U.S.<br />
or overseas.<br />
• Cost-effective source loading of export products, as opposed to containerizing at the port.<br />
• Reduced loss due to bulk rail loading and handling at the port, either to load containers or for export in<br />
bulk carriers.<br />
• Export products requiring “identity preservation” that is attained by packaging or containerizing in<br />
Saskatchewan without admixture of products originating elsewhere.<br />
• Proximity to empty containers to be used for shipping outbound production intermodally.<br />
• Enhanced logistics options that increase efficiency and productivity of existing rail infrastructure assets.<br />
The <strong>Canadian</strong> Government and the Province of Saskatchewan are working to enhance economic growth of<br />
the region and to expand the types of jobs available to residents. Some of these enhancements would be<br />
driven by intercepting rail cargo locally and providing opportunity to add value to commodities that<br />
otherwise would be just passing through. The province would expect to see the following local benefit due<br />
to development of the inland port:<br />
• Growth and development of local business opportunities brought on by the presence of a nearby cargo<br />
centre. This could include commercial warehousing and distribution, equipment maintenance services,<br />
haulage services and ancillary logistics services such as freight brokerages and insurance. A local<br />
multiplier of 1.5 to 2.5 can be assumed for wages paid and spent on local goods and services.<br />
• Diversification of the economy into other industries than agriculture and mining in order to avoid the<br />
cyclic down-turns that occur in most commodity driven industries.<br />
• Increased local tax revenues due to new payroll and business receipts.<br />
• Improvements in air quality and noise alleviation through better utilization of road capacity and less<br />
damage to road infrastructure caused by a reduction in trucks and congestion delay.<br />
These benefits are contingent on creating a coordinated inland port system that will fulfill the needs of all of<br />
the stakeholders and develop a large enough cargo base to sustain a critical mass of operation. The<br />
concentration of cargo flows opens possibilities to economies of scale in inland transportation through<br />
increases in transportation services, reduced inventory costs and improved performance. Shipment volume<br />
is the key to the viability of an inland port, its attractiveness to the stakeholders and its potential benefits in<br />
cost, efficiency, accessibility, service and reliability.<br />
Copyright 2007: Saskatchewan Agrivision Corporation Inc. Page 4-10
January 2007<br />
<strong>Canadian</strong> <strong>Intelligent</strong> <strong>Super</strong> <strong>Corridor</strong> - <strong>Smart</strong> <strong>Inland</strong> <strong>Port</strong> <strong>Network</strong><br />
Case Studies<br />
In determining the feasibility of inland port facilities in the province of Saskatchewan, other terminals were<br />
researched to catalogue similarities to Saskatchewan in location, economics, relationship with railroad,<br />
facility design function and other representative factors. The identification of various sites in Canada and<br />
the U.S. gave planners a broad view of potential inland port models and the elements that create these<br />
sites. Several sources were used to gather information on inland port sites including internet resources,<br />
trade and academic journals, and electronic mail. The selected inland ports serve as connection<br />
opportunities to enhance the integration of the transportation system across the <strong>Canadian</strong> <strong>Intelligent</strong> <strong>Super</strong><br />
<strong>Corridor</strong>, as well as with the North America <strong>Super</strong> <strong>Corridor</strong> Coalition (NASCO). A central inland hub in<br />
Saskatchewan would compliment the existing facilities in the development of a representative North<br />
American transportation and trade network.<br />
Winnipeg, Manitoba<br />
Winnipeg is a city in western Canada centrally located on the main line of CN and CPR. It has three rail<br />
links to the U.S. Both railway companies maintain extensive and modern rail yards that handle more than<br />
5,000 cars per day and intermodal facilities that process more than 85,000 containers per year - CP<br />
35,000, CN 50,000. Roughly three million tons of commodities are shipped southbound from Manitoba into<br />
the U.S. by rail, representing a value of some $1.2 billion. Rail accounted for 17 percent of the total value of<br />
Manitoba exports to the U.S. in 2003. All of CN’s traffic going both east-west and north-south passes<br />
through Winnipeg. BNSF has terminal facilities in Winnipeg with direct connections to three-quarters of the<br />
U.S. service into Mexico. CN and its U.S. rail division, the Grand Trunk Corporation, have some 29,000<br />
miles of track, stretching coast to coast in Canada and the U.S. As a result of the alliance, services have<br />
linked Manitoba and other points in Canada with U.S. Midwest markets (Detroit, Chicago, Kansas City and<br />
St. Louis) as well as Southern markets in Texas. The alliance has also created rail connectivity and given<br />
access to both Mexican and <strong>Canadian</strong> shippers via Mexico’s largest rail system, Grupo TFM. 4<br />
Winnipeg’s Role in NASCO<br />
The NASCO and its sub-committee, North American <strong>Inland</strong> <strong>Port</strong> <strong>Network</strong> (NAIPN), advocate the interest of<br />
inland ports along the International Mid-Continent Trade and Transportation <strong>Corridor</strong> (IMCTTC). NASCO<br />
has been tasked with developing an active inland port network along the corridor to specifically alleviate<br />
congestion at maritime ports and the nation’s borders. The NAIPN envisions an integrated, efficient and<br />
secure network of inland ports specializing in the transportation of containerized cargo in North America.<br />
The main guiding principal of the NAIPN is to develop logistics systems that enhance global security, but at<br />
the same time do not impede the cost-effective and efficient flow of goods. NASCO has received $2.25<br />
million in Congressional earmarks to be administered by the United States Department of Transportation<br />
(USDOT) for the development of technology integration and tracking project. The project will have a team<br />
approach, using members of NASCO as the primary participants in the project, to the extent possible.<br />
NASCO believes the deployment of a modern information system will reduce the cost, improve the<br />
efficiency, reduce trade-related congestion, and enhance security of cross-border and corridor information,<br />
trade and traffic. 5 Winnipeg is the northernmost tip of this transportation corridor and serves as a cargo<br />
transfer point for the region. 6<br />
4<br />
http://www.nascocorridor.com/naipn/pages/win_facilities.html#rail<br />
5<br />
http://www.nascocorridor.com/pages/about/about.htm<br />
6<br />
SCAG <strong>Inland</strong> <strong>Port</strong> Case Studies Appendix.<br />
Copyright 2007: Saskatchewan Agrivision Corporation Inc. Page 5-1
January 2007<br />
<strong>Canadian</strong> <strong>Intelligent</strong> <strong>Super</strong> <strong>Corridor</strong> - <strong>Smart</strong> <strong>Inland</strong> <strong>Port</strong> <strong>Network</strong><br />
Figure 5-1: North America <strong>Super</strong> <strong>Corridor</strong> Coalition<br />
Source: North America <strong>Super</strong> <strong>Corridor</strong> Coalition website, www.nascocorridor.com<br />
Figure 5-1 illustrates the relationship between the U.S., Mexico and Canada via inland intermodal<br />
terminals. Along the corridor, Winnipeg, Kansas City and San Antonio are three of the most important hubs<br />
for NAFTA and bulk cargos.<br />
Manitoba’s container traffic has expanded considerably since the 1980s, when it grew at an average rate of<br />
four to five percent per year. Average annual marine container import and export volumes increased by<br />
more than 10 percent per annum in recent years. This trend is expected to continue during the next<br />
decade. Vancouver accounts for 60 percent of the province’s marine container traffic (in terms of total<br />
volumes shipped). The eastern ports of Montreal and Halifax represent 33 percent of container traffic.<br />
Southern container traffic remains negligible at less than two percent. 7<br />
Challenges<br />
Manitoba shippers of containerized goods face several logistical disadvantages that impede their ability to<br />
penetrate overseas export markets. Currently, they must request a container from a steamship line (or<br />
freight forwarder), a process that often takes up to three days. This delay frustrates shippers because<br />
empty containers from eastern Canada regularly pass through Manitoba en route to the west at the same<br />
time as shippers pay to reposition containers back to the Prairies. These time and cost penalties render<br />
many shippers uncompetitive in certain markets, especially at times when buyers are extremely price<br />
sensitive.<br />
7<br />
http://umanitoba.ca/faculties/management/ti/media/mioss_Nov2.pdf<br />
Copyright 2007: Saskatchewan Agrivision Corporation Inc. Page 5-2
January 2007<br />
<strong>Canadian</strong> <strong>Intelligent</strong> <strong>Super</strong> <strong>Corridor</strong> - <strong>Smart</strong> <strong>Inland</strong> <strong>Port</strong> <strong>Network</strong><br />
The Manitoba market is fragmented comprised of smaller shippers using a variety of service providers and<br />
operating from several locations, making it difficult for marine carriers to keep track of their containers.<br />
Ocean carriers face high charges for storing containers at rail terminals, reducing the railways to mere<br />
drayage operators. Similarly, the railways are focused on economies of size and bottom-line issues and are<br />
concerned about their ability to control the system (Prentice et al., 1998).<br />
CN Edmonton Grain Distribution Centre<br />
In November 2006, CN opened a new grain stuffing and distribution centre in Edmonton, Alberta. The<br />
facility is designed to give specialty crop growers on the western prairies easier and more cost effective<br />
access to ship their high-value grains and oilseeds in containers to overseas customers. CN invested $4<br />
million in the facility, which is expected to handle 20,000 containers per year. The facility is located in CN’s<br />
Dunvegan Yard in northwest Edmonton, just north of the Yellowhead Highway, providing truck access and<br />
connections to CN's local handling and intermodal yards (CN).<br />
Figure 5-2: CN Grain Facilities and Areas of Production<br />
Source: CN website, www.cn.ca, revised by TranSystems<br />
Previously, western prairie farmers had to first load their high-value crops into covered hopper cars and<br />
send the cars to Vancouver, where they are emptied and the grain transferred into containers. The stuffed<br />
containers are then trucked to dockside, for loading onto ships. Now, these grains, grain products and<br />
oilseeds can be transferred from the farm truck directly into containers at the new Edmonton facility,<br />
removing a step in the logistics chain for many shippers. Farmers from outside the Edmonton region will<br />
have the option to move their products by railcar to Edmonton and transfer the grain at the new facility.<br />
"This will make the prairie supply chain more competitive in world markets," said Peter Marshall, CN Senior<br />
Vice-President, Western Region. "Eliminating an initial hopper car movement will lower many shippers'<br />
costs. But even if the product comes into Edmonton by rail, farmers will benefit by stuffing the containers in<br />
Copyright 2007: Saskatchewan Agrivision Corporation Inc. Page 5-3
January 2007<br />
<strong>Canadian</strong> <strong>Intelligent</strong> <strong>Super</strong> <strong>Corridor</strong> - <strong>Smart</strong> <strong>Inland</strong> <strong>Port</strong> <strong>Network</strong><br />
Edmonton instead of Vancouver. There are better rail connections and less congestion here, in addition to<br />
eliminating the need to truck product through Vancouver."<br />
Most western <strong>Canadian</strong> grain moves from the prairies in bulk hopper cars. Increasing percentages of<br />
higher-value, human consumption specialty crops, such as lentils, beans and peas, as well as processed<br />
grain products such as malt and alfalfa pellets, are now moving overseas in containers. Grain shippers<br />
prefer using the containers for their higher-value products because this allows them to segregate their<br />
product from lower-value bulk grains, thereby ensuring they receive higher prices. Shippers are also able to<br />
meet customer requirements for strict product identification, which is especially important for human foods,<br />
and helps to capture higher prices.<br />
"While the vast majority of grain shipments will continue to be in bulk hopper cars, this new facility gives the<br />
industry more shipping choices and competitive options for certain crops and grain products. Shippers will<br />
also be able to use our CN WorldWide freight forwarding services to obtain one single rate quote to cover<br />
the entire move, from the home farm to the final market in Asia. All this will allow prairie farmers to capture<br />
new and higher-return markets,” said James Foote, CN Executive Vice-President, Sales and Marketing.<br />
CN manages the flow of grain and grain products from railcar or truck to containers, then moves them by<br />
rail directly to West coast ports. Daily rail service from Edmonton to the <strong>Port</strong> of Vancouver is available, and<br />
will be available to the <strong>Port</strong> of Prince Rupert in 2007. Features of the facility include:<br />
• Transloading from railcars or trucks.<br />
• Ten railcar spots.<br />
• <strong>Inland</strong> grain stuffing for identity preservation.<br />
• Ability to load specialized commodities in fully-lined containers (container staging).<br />
• Container cleaning and liner insertion services.<br />
• Enclosed load transfer system, ensuring production integrity.<br />
• On-site container lift to minimize carrier delays.<br />
• Two tilt tables with integrated scales to facilitate loading 20-foot and 40-foot containers.<br />
• Dual loading platform capable of accommodating 20-foot and 40-foot containers.<br />
• Computerized loading system to achieve desired shipping weights.<br />
• On-site sampling, testing and grading services provided by Surveilliance Generale <strong>Super</strong>intendente<br />
(SGS) India Ltd.<br />
• Fully computerized inventory management system.<br />
Kamloops Intermodal Container Facility<br />
Kamloops offers an opportunity for an intermodal facility because of its central location to British Columbia’s<br />
saw mills, pulp mills and other value added wood products, and because it is proximal to the fruit producers<br />
in the Okanagan. CN and CPR main rail lines and the Trans-Canada Highway all run through Kamloops.<br />
Kamloops’ highway and rail network currently provides access and intermodal linkages for the<br />
transportation of lumber, pulp, and finished goods to both domestic and international markets. This mixeduse<br />
facility would include lumber reload from truck-to-rail car for North American markets, and put lumber<br />
into containers for export markets through the ports of Vancouver and Prince Rupert.<br />
Copyright 2007: Saskatchewan Agrivision Corporation Inc. Page 5-4
January 2007<br />
<strong>Canadian</strong> <strong>Intelligent</strong> <strong>Super</strong> <strong>Corridor</strong> - <strong>Smart</strong> <strong>Inland</strong> <strong>Port</strong> <strong>Network</strong><br />
An intermodal container facility in Kamloops would:<br />
• Reduce the numbers of heavy transport trucks on the Trans-Canada Highway traveling between the<br />
Rockies and the Lower Mainland, resulting in significant savings in highway maintenance and<br />
rehabilitation costs.<br />
• Provide another option for shippers to transport export products to port.<br />
• Increase capacity and efficiency of the Vancouver <strong>Port</strong>.<br />
• Reduce shipping costs for local manufacturing companies for both commodity and export products.<br />
• Be a unique selling point for attracting manufacturing companies to Kamloops.<br />
• Create jobs in the region as a result of expanding the freight, intermodal and distribution industries in<br />
Kamloops.<br />
• Attract investment in the transportation infrastructure of Kamloops from railways, private industry and<br />
senior levels of government.<br />
Challenges<br />
While there are definite advantages, there are also a number of challenges in establishing an intermodal<br />
container facility in Kamloops. The potential challenges are:<br />
• Rail Cooperation and Buy-in: To encourage intermodal trains to stop in Kamloops to pick up containers<br />
cars and drop off empty containers, Kamloops must present a business case to the railways proving<br />
that the extra time and costs of providing this switching service will be recovered through increased<br />
business.<br />
• Access to Empty Containers: Container owners will have to be matched with container customers so<br />
the facility can access the right containers from the right shipping lines.<br />
• Logistic Challenges: Virtually all lumber mills in British Columbia send their products destined for export<br />
by truck to Vancouver because:<br />
o Trucks have quick response times.<br />
o Truck rates are more competitive than rail rates because of backhaul opportunity.<br />
o The large warehousing infrastructure associated with container stuffing facilities in the Lower<br />
Mainland allows for plenty of storage for all product lines and the ability to consolidate customer<br />
orders to their specifications.<br />
• Local Industry Stakeholders: To get enough volume for the intermodal container facility in Kamloops to<br />
meet the business case requirements of the railways, the facility will most likely have to be multi-use<br />
and serve lumber, pulp, and other value-added commodities. The facility should provide a number of<br />
customer specific services including container stuffing, reloading, cross-docking, warehousing, storage<br />
of empties and consolidation.<br />
It is important to garner and retain support for this facility from all local industry and manufacturers, as well<br />
as key customers, such as Weyerhaeuser, Tolko, Mercer, and Arrow (Satwinder and Nova, 2006).<br />
Copyright 2007: Saskatchewan Agrivision Corporation Inc. Page 5-5
January 2007<br />
<strong>Canadian</strong> <strong>Intelligent</strong> <strong>Super</strong> <strong>Corridor</strong> - <strong>Smart</strong> <strong>Inland</strong> <strong>Port</strong> <strong>Network</strong><br />
Northern Plains Commerce Centre<br />
The Northern Plains Commerce Centre (NPCC) is being built on the Northern Plains in Bismarck, North<br />
Dakota. Highway, rail, ocean and air shippers will use the 243-acre NPCC as their gateway to the world.<br />
The NPCC, located adjacent to airport property, will have airfreight, rail and highway service, warehousing<br />
and transloading facilities. Highway shipments have easy access to the facilities from Interstate 94<br />
(Fahrenwald, 2006).<br />
Figure 5-3: Northern Plains Commerce Centre Conceptual Drawing<br />
Dakota, Missouri Valley & Western Railroad (DMVW), an independent shortline with more than 500 miles in<br />
connections from central North Dakota to the southeastern half of the state, will provide switching<br />
operations for NPCC. DMVW has rails connecting it to BNSF, CP and North Dakota's eastern shortline, and<br />
Red River Valley & Western (RRVW). Rail service will be provided by long-haul carrier BNSF via a direct<br />
connection with DMVW.<br />
Client Potential<br />
Clients are beginning to show interest in the potential of the NPCC. Bobcat (an Ingersoll-Rand-owned<br />
company) one of the prime initial clients is building a $9.5 million, 100,000-square-foot manufacturing<br />
support centre on the NPCC property. Plans are to connect Bobcat's NPCC facility directly with its Gwinner<br />
manufacturing plant using DMVW and RRVW. By combining with BNSF, Bobcat can reliably deliver its<br />
products to the West Coast in a four-day time period, giving the company access to the Pacific Rim and its<br />
largest consumer base. DMVW will handle an estimated 3,000 freight cars a year for Bobcat (Weixel,<br />
2005). United Pulse Canada, a leader in the pulse industry, has contracted with NPCC to construct a<br />
90,000-square-foot facility. The facility will process lentils, peas and durum wheat at a rate of 150,000<br />
metric tons annually (Fahrenwald, 2006).<br />
Copyright 2007: Saskatchewan Agrivision Corporation Inc. Page 5-6
January 2007<br />
<strong>Canadian</strong> <strong>Intelligent</strong> <strong>Super</strong> <strong>Corridor</strong> - <strong>Smart</strong> <strong>Inland</strong> <strong>Port</strong> <strong>Network</strong><br />
Minnesota North Star Rail Intermodal LLC<br />
The U.S. bulk grain export system works efficiently for commoditized products, but does not service<br />
international customers who demand shipments of quality-controlled, market-specific food or feed grain<br />
products or unitized shipments of smaller quantities meeting just-in-time inventory requirements.<br />
Minnesota farmers, processors and ethanol producers must truck their products to the Minneapolis/St. Paul<br />
intermodal hub, where it must be transloaded into containers and shipped to international markets. This<br />
high-cost, inefficient process reduces farmers’ ability to realize the higher margins typically provided by<br />
these markets. Rising fuel costs, driver shortages and inadequate container supply also exclude highway<br />
container transportation as an effective transportation mode. Given these challenges, the Minnesota<br />
legislature assigned the state’s commissioner of agriculture, in consultation with the commissioner of<br />
transportation, the task of conducting “an economic impact study of a rail container load-out facility located<br />
in the west-central area of Minnesota in 2005.”<br />
The results of the study led to the recommendation and development of North Star Rail Intermodal. The<br />
project essentially provides container-based intermodal grain transportation services from western<br />
Minnesota and eastern regions of North and South Dakota to international ports in Asia, Europe and Latin<br />
America. The company utilizes RailRunner intermodal technology to offer competitive, regularly<br />
scheduled shipping services to ethanol producers, to growers and processors of identity preserved foodgrade<br />
soybeans and wheat products, and to other value-added soybean feed and specialized grains.<br />
The RailRunner intermodal (truck and train) system allows farmers, processors and ethanol producers to<br />
plug into the international container shipping system right at the farm, the elevator or the ethanol plant.<br />
Product can be loaded into containers at the North Star terminal from either hopper trucks or railcars, or<br />
can directly be loaded into containers at the elevator or processing plant. Once loaded, using RailRunner's<br />
Terminal Anywhere technology, containers are shifted to rail without the need for lengthy highway<br />
transport, keeping the products in the original containers until they reach their ultimate destination.<br />
The North Star Rail Intermodal Solution<br />
The North Star service, available in early 2007, will offer regularly-scheduled, reliable intermodal service to<br />
Upper Great Plains farmers, growers and processors at per-ton prices competitive with bulk grain shipping.<br />
The new system will enable producers to lower their shipping costs, while preserving the increased value of<br />
specialized agricultural products because they are sealed into containers, rather than being mixed together<br />
in bulk with lower-value products. The service will enable shippers to:<br />
• Move large amounts of Distiller’s Dried Grains with Solubles (DDGS) in containers, rather than in<br />
traditional hopper cars. Containers carrying this byproduct of ethanol production – a feed for cattle,<br />
hogs and poultry – are much easier to unload and clean, dramatically reducing the transport cost.<br />
• Sell identity-preserved (IP) grains and grain products. By moving from the farm or elevator in<br />
containers and not being aggregated with other products, these grains and grain products can retain<br />
their unique pedigree – of type, nutritional or chemical characteristics, and growing methods – and their<br />
higher market values.<br />
• Sell other value-added agriproducts. High-quality produce of various sorts can be sold at higher prices<br />
if it is not mixed in with other, lesser grades in transport, but rather is shipped in containers.<br />
Copyright 2007: Saskatchewan Agrivision Corporation Inc. Page 5-7
January 2007<br />
<strong>Canadian</strong> <strong>Intelligent</strong> <strong>Super</strong> <strong>Corridor</strong> - <strong>Smart</strong> <strong>Inland</strong> <strong>Port</strong> <strong>Network</strong><br />
The system will link to the <strong>Canadian</strong> Pacific Railway in Minneapolis and, thereby, to international markets<br />
through Vancouver, BC, and Montreal, QC. North Star has partnered with Hapag-Lloyd Container Lines to<br />
manage the delivery of the containers to their ultimate destinations (North Star Intermodal).<br />
<strong>Inland</strong> International <strong>Port</strong> of Dallas (IIPOD)<br />
The Dallas area is located at a crossroads of international trade - the NAFTA highway that connects<br />
Canada, the U.S., and Mexico runs directly through the southern sector of Dallas County. Since the<br />
implementation of the NAFTA in 1994, trade with Canada and Mexico has significantly increased. In<br />
addition, the Dallas area receives a significant amount of east-west trade that originates in Asia, and<br />
specifically China, which is the third largest trading partner of the U.S. The Asian trade primarily arrives to<br />
Dallas via rail shipments from the LA/LB ports on the West Coast through Arizona, New Mexico, and Texas<br />
to inland destinations.<br />
Figure 5-4: River of Trade <strong>Corridor</strong><br />
The Dallas region is home to foreign<br />
trade zone acreage, intermodal facilities<br />
and two reliever airports with future<br />
expansion capabilities. Dallas is also an<br />
inland distribution centre for Asian trade<br />
that travels through the Panama Canal<br />
and the <strong>Port</strong> of Houston. The <strong>Port</strong> of<br />
Houston is the sixth largest port in the<br />
world, ranks first in the U.S. in foreign<br />
tonnage and second in total tonnage.<br />
The movement of international trade to<br />
and from the port is facilitated by the<br />
five interstates. The area is also served<br />
by BNSF, Kansas City Southern (KCS),<br />
and Union Pacific (UP) rail lines. The<br />
port authority is expecting tremendous<br />
Source: Dean International Inc.<br />
annual increases for the foreseeable<br />
future in the number of containers handled by the port and is concerned about increasing congestion on rail<br />
and surface transportation systems serving the port.<br />
The City of Dallas and the <strong>Port</strong> of Houston want to preserve and enhance existing infrastructure in the area<br />
that serves as a crossroads for trade. In the fall of 2004, the City of Dallas embraced a strategic plan to<br />
further develop and enhance international trade flows through the southern sector of Dallas County. This<br />
plan, the Dallas NAFTA Trade <strong>Corridor</strong> project, consists of several public policy initiatives specifically<br />
designed to foster economic growth and create jobs in the southern Dallas area. The Dallas NAFTA Trade<br />
<strong>Corridor</strong> consists of an Agile <strong>Port</strong> System, a Linear/Foreign/Free Trade Zone, an <strong>Inland</strong> <strong>Port</strong> of Pre-<br />
Clearance and a Cargo Airport and by expanding the River of Trade <strong>Corridor</strong> Coalition.<br />
The Agile <strong>Port</strong> system is strongly supported by the U.S. Maritime Administration as a means of quickly and<br />
efficiently moving trade cargo from a seaport to an inland port. In April 2005, the U.S. Maritime<br />
Administration, City of Dallas, and <strong>Port</strong> of Houston Authority signed an historic Memorandum of<br />
Understanding agreeing to partner for the development and the implementation of the Dallas Agile <strong>Port</strong><br />
Copyright 2007: Saskatchewan Agrivision Corporation Inc. Page 5-8
January 2007<br />
<strong>Canadian</strong> <strong>Intelligent</strong> <strong>Super</strong> <strong>Corridor</strong> - <strong>Smart</strong> <strong>Inland</strong> <strong>Port</strong> <strong>Network</strong><br />
System. The City of Dallas has also signed agreements with four Mexican ports (Guaymas, Lázaro-<br />
Cárdenas, Manzanillo and Topolobampo) and the Panama Canal to explore and utilize Dallas as an inland<br />
port.<br />
The inland port would be a distribution center for shipping containers coming from or going to foreign<br />
countries. The containers would be moved using state of the art technology so that they could easily be<br />
processed to meet on-demand shipping requirements. It would be served by trucking, high-speed rail and<br />
possibly a new cargo airport similar to Alliance Airport in north Fort Worth. The inland port would also ease<br />
congestion at the <strong>Port</strong> of Houston.<br />
The purpose of the linear/foreign trade zone is to create a comprehensive and competitive tax treaty of<br />
incentives for domestic and global business relocation to the Dallas NAFTA Trade <strong>Corridor</strong> Impact Zone.<br />
Additional goals would include:<br />
• Facilitating a coordinated, linear/foreign tax package for pre-qualified businesses.<br />
• Identifying and expediting the relocation process and eliminating the “red tape” associated with typical<br />
business relocation.<br />
• Maximizing Dallas NAFTA Trade <strong>Corridor</strong> assets and offering businesses low-cost trade opportunities.<br />
• Establishing a uniquely simplified tax package and set a national precedent for Dallas area commerce.<br />
• Harmonization of ad valorem taxes. This component will facilitate the cooperation of the Southern<br />
Sector municipalities and Dallas County in attracting business and jobs to the area.<br />
When completed, the project will include the inland port facility to process goods arriving via truck or train<br />
from deep-water ports of Mexico, RFID and other technology to facilitate information exchange between<br />
modes of transportation, customs facilities for Mexico and Canada to eliminate border clearance wait-times,<br />
FTZ and Linear Trade Zones for beneficial tax and customs treatment and a cargo airport (Dallas NAFTA<br />
Trade <strong>Corridor</strong>).<br />
Copyright 2007: Saskatchewan Agrivision Corporation Inc. Page 5-9
Market Assessment<br />
January 2007<br />
<strong>Canadian</strong> <strong>Intelligent</strong> <strong>Super</strong> <strong>Corridor</strong> - <strong>Smart</strong> <strong>Inland</strong> <strong>Port</strong> <strong>Network</strong><br />
The viability of a smart inland port system proposed for Saskatchewan is dependent, in part, on the volume<br />
of freight which it would attract. The amount of potential traffic for a facility provides: (1) a measure of the<br />
benefit of such a facility - a larger amount of potential traffic means larger total savings in logistics costs for<br />
regional manufacturers and specialty agricultural producers, and (2) an indicator of whether a new facility<br />
would generate enough business to become a profitable and viable venture, and (3) an indicator of the<br />
quality of service and level of rates that might be charged for such a facility, as railroads are able to<br />
produce higher quality intermodal services at lower costs with larger shipment volumes. Since fixed capital<br />
costs associated with development can be spread more thinly, resultant costs to users will be lower.<br />
Demand for inland port structures in Saskatchewan would primarily originate from <strong>Canadian</strong> and U.S.<br />
intermodal markets. One difficulty in estimating potential traffic is that the amount of traffic depends on<br />
rates and service levels, and these are unknown for a new facility. In order to identify flows between the<br />
Saskatchewan region and other global partners, it was necessary to look at freight flows to and from<br />
provinces that contain major ports (British Columbia, Quebec, etc.). Shipper preferences, trade lanes and<br />
inland region combinations were assessed to determine the focused target market base. Based on trade<br />
statistics, industry knowledge and other quantitative analyses, it was determined that the analysis should<br />
focus on the trans-Pacific and NAFTA market as these lanes present the greatest opportunity, from both a<br />
volume and future growth perspective.<br />
The international container market moving through the West Coast of Canada, both historically and<br />
forecast, provide the boundaries for the sizing of the potential inland port in Saskatchewan. This<br />
opportunity would require the cooperation of carriers and the railroads, as they control the assets moving<br />
east–west through Canada. The carriers are typically responsible, usually contractually, for moving the<br />
containers back to the origin rail ramp, reducing the necessity for the railroad to move rail cars empty. This<br />
generates large “empty repositioning” costs for the ocean carriers, and they are continuously looking for<br />
opportunities to defray these expenses with export cargoes or domestic cargoes moving back to the same<br />
origin point. In general, shippers are interested in cost and transit time; offering an alternative transport<br />
option that generates cost savings to shippers would elicit their attention.<br />
This section details forecasts of containerized cargo over 10 years to estimate potential import intermodal<br />
freight traffic that may be captured by the proposed inland port. In addition to the actual estimated volumes<br />
of containerized freight, the potential containerization of bulk products is forecasted as export traffic. This<br />
data combines international and domestic freight and therefore certain assumptions had to be made about<br />
the share of traffic that is international trade. The results of the analysis are based on an aggressive<br />
approach that does not take into account any competition the proposed North American inland port in<br />
Saskatchewan may have from other inland ports.<br />
The findings of the market assessment indicate that there is a viable market for an inland port in<br />
Saskatchewan. However, the proposed port’s success will be depend on its ability to provide an efficient<br />
and cost competitive option to shippers moving freight into the target North American regions.<br />
Copyright 2007: Saskatchewan Agrivision Corporation Inc. Page 6-1
January 2007<br />
<strong>Canadian</strong> <strong>Intelligent</strong> <strong>Super</strong> <strong>Corridor</strong> - <strong>Smart</strong> <strong>Inland</strong> <strong>Port</strong> <strong>Network</strong><br />
West Coast Trade Growth<br />
Growth in the West Coast Canada container trade has been very strong, as shown in Table 6-1, which<br />
presents annual loaded container volumes, expressed in TEUs, from 1995 through 2005. The principal<br />
driver of this growth has been the extraordinary increase in North America demand for imports and rapid<br />
migration of import sourcing to Asia, particularly China. This strong trend in North America demand for<br />
imports has two distinct phases:<br />
• From 1995 to 2000, real GDP growth in North America was well above average and this was amplified<br />
by an equities-driven wealth effect. These led to a dramatic increase in the demand for consumer<br />
goods along with a rapid increase in penetration of imports into domestic consumption.<br />
• After a brief recession in 2001, a sharp reduction of interest rates engineered by the monetary<br />
authorities led to a housing boom and demand for housing-related good, which are increasingly<br />
imported from Asia. In addition, a housing-driven wealth effect further drove up demand for a broad<br />
range of importer consumer products.<br />
The import boom in North America contributed to accelerating growth in the Asia economies, particularly<br />
China, which in turn led to growth in North America exports to Asia.<br />
For export loaded containers, the compound average growth rate (CAGR) from 1995–2005 is 12.4 percent.<br />
Year-to-year growth of exports has been volatile, however, ranging from negative growth (2000–2001;<br />
2004–2005) to over 30 percent growth (1998–1999). Import growth has been higher (CAGR = 20.4<br />
percent) and steadier, although it has been somewhat slower since 2002.<br />
Table 6-1: West Coast Canada Loaded Container Trade (TEU) ¹<br />
Year Export TEU Import TEU<br />
1995 A 262,860 163,977<br />
1996 A 319,589 204,450<br />
1997 A 366,627 258,639<br />
1998 A 403,249 329,690<br />
1999 A 530,955 398,281<br />
2000 A 584,015 493,089<br />
2001 A 563,396 518,766<br />
2002 A 644,693 734,632<br />
2003 A 739,079 836,897<br />
2004 A 848,331 938,944<br />
2005 A 842,374 1,050,386<br />
10 Year CAGR 12.4% 20.4%<br />
¹ Fraser River volumes are unavailable before 1996, although volumes are negligible<br />
Source: <strong>Port</strong> websites, TranSystems’ estimates<br />
The forecast of container volume for the inbound and outbound international trade for the West Coast of<br />
Canada was generated through an econometric model, utilizing 10 years of historical trade moving through<br />
Vancouver and Fraser River. This model takes into consideration the past trends that potentially favour the<br />
<strong>Canadian</strong> gateways for cargo destined for the US as well.<br />
Copyright 2007: Saskatchewan Agrivision Corporation Inc. Page 6-2
January 2007<br />
<strong>Canadian</strong> <strong>Intelligent</strong> <strong>Super</strong> <strong>Corridor</strong> - <strong>Smart</strong> <strong>Inland</strong> <strong>Port</strong> <strong>Network</strong><br />
Projected container volumes traveling through the West Coast ports of Canada display healthy growth rates<br />
as shown in Table 6-2, although slower than those experienced in the past ten years. As noted earlier, for<br />
both exports and imports, growth has already slowed down in recent years. In the case of exports, world<br />
demand remains strong, but export growth is expected to continue to slow down due to gradual<br />
strengthening of the <strong>Canadian</strong> dollar. In the case of imports, the projected slowdown in growth is due to<br />
reduced scope for import penetration from Asia into North America.<br />
Table 6-2: West Coast Canada Loaded Container Trade Forecast (TEU)<br />
Year Export TEU Import TEU<br />
2005 A 842,374 1,050,386<br />
2006 F 910,929 1,172,639<br />
2007 F 976,537 1,298,020<br />
2008 F 1,041,991 1,427,724<br />
2009 F 1,108,725 1,562,694<br />
2010 F 1,174,611 1,701,724<br />
2011 F 1,239,260 1,846,245<br />
2012 F 1,302902 1,995,855<br />
2013 F 1,365,861 2,148,004<br />
2014 F 1,428,795 2,300,797<br />
2015 F 1,491,832 2,454,093<br />
10 Year CAGR 5.9% 8.9%<br />
Source: TranSystems<br />
<strong>Canadian</strong> Trans-Pacific Trade Flows<br />
The inbound cargo traveling through the Vancouver gateway, approximately 95 percent from Asia, is<br />
primarily destined for Eastern Canada, Figure 6-1, approximately 60 percent or almost 500,000 TEUs.<br />
Currently, only 130,000 TEUs of cargo return to the <strong>Port</strong> of Vancouver from Eastern Canada, Figure 6-2.<br />
This imbalance very clearly reflects the current environment on the trans-Pacific trade with many containers<br />
moving back to Asia empty. These empties are likely moving via intermodal rail from Eastern Canada to<br />
Vancouver for transport back to Asia, at the expense of the shipping line.<br />
Figure 6-1: Vancouver Imports<br />
Destination of Vancouver Import TEU:<br />
YTD Sept 06 - 833,442<br />
Figure 6-2: Vancouver Exports<br />
Origin of Vancouver Export TEU:<br />
YTD Sept 06 - 565,455<br />
United States<br />
6%<br />
Prairies<br />
7%<br />
British<br />
Columbia<br />
28%<br />
Canada Other<br />
0%<br />
Eastern<br />
Canada<br />
59%<br />
Eastern<br />
Canada<br />
23%<br />
Canada Other<br />
0%<br />
Prairies<br />
13%<br />
United States<br />
3%<br />
British<br />
Columbia<br />
61%<br />
Source: <strong>Port</strong> of Vancouver<br />
Source: <strong>Port</strong> of Vancouver<br />
Copyright 2007: Saskatchewan Agrivision Corporation Inc. Page 6-3
January 2007<br />
<strong>Canadian</strong> <strong>Intelligent</strong> <strong>Super</strong> <strong>Corridor</strong> - <strong>Smart</strong> <strong>Inland</strong> <strong>Port</strong> <strong>Network</strong><br />
The great majority of the intermodal traffi c is traveling from east to west, although given that there are only<br />
two regions for Canada as defined by IANA, as shown in Figure 6-3, it is difficult to ascertain what may be<br />
shorter-haul movements. The specific container volumes moving are displayed in Table 6-3.<br />
Figure 6-3: Canada as Defined by IANA<br />
YUKON<br />
Whitehorse<br />
Whitehorse<br />
NORTHWEST<br />
TERRITORY<br />
Great Slave<br />
Lake<br />
Great Bear<br />
Lake<br />
Yellowknife<br />
NUNAVUT<br />
Lake<br />
Athabasca<br />
Hudson<br />
Bay<br />
NEWFOUNDLAND<br />
NEWFOUNDLAND<br />
St. John's<br />
BRITISH<br />
COLUMBIA<br />
ALBERTA<br />
Edmonton<br />
Edmonton<br />
MANITOBA<br />
SASKATCHEWAN<br />
SASKATCHEWAN<br />
Lake<br />
Winnipegosis<br />
Regina<br />
Regina<br />
Winnipeg<br />
Winnipeg<br />
Lake<br />
Winnipeg<br />
Lake<br />
Nipigon<br />
ONTARIO<br />
QUEBEC<br />
Quebec<br />
Gulf of<br />
St. Lawrence<br />
NEW<br />
BRUNSWICK<br />
NOVA<br />
Fredericton<br />
SCOTIA<br />
Halifax<br />
Western Canada<br />
Eastern Canada<br />
Lake<br />
<strong>Super</strong>ior<br />
Lake<br />
Michigan<br />
Lake<br />
Huron<br />
Toronto<br />
Lake<br />
Erie<br />
Ottawa<br />
Lake<br />
Ontario<br />
Table 6-3: 2005 Canada Intermodal Container Volumes<br />
Intermodal Origin Region<br />
Intermodal Destination Region WC Canada EC Canada<br />
WC Canada 197,486 525,179<br />
EC Canada 558,583 NA<br />
Other 73,441 NA<br />
Total 829,510 NA<br />
Source: IANA<br />
The container volumes moving from Eastern Canada to Western Canada most likely include some empty<br />
containers that carriers are paying the railroads to reposition back to the port for shipping back to Asia. 1<br />
1<br />
Volumes reported by IANA include all units that are “revenue-producing” for the railroad, whether empty or full.<br />
Copyright 2007: Saskatchewan Agrivision Corporation Inc. Page 6-4
January 2007<br />
<strong>Canadian</strong> <strong>Intelligent</strong> <strong>Super</strong> <strong>Corridor</strong> - <strong>Smart</strong> <strong>Inland</strong> <strong>Port</strong> <strong>Network</strong><br />
<strong>Smart</strong> <strong>Inland</strong> <strong>Port</strong> <strong>Network</strong> Potential Market and Prospective Throughput<br />
The following discussion looks at market size for an inland port and a review of transit and cost challenges<br />
facing an inland port. The numbers on volume and cost should be viewed as providing guidance with the<br />
need for further detailed analysis on the cargo diversion, cost and service viability of an inland port. The<br />
focus of discussion here are the two primary market components, which would likely drive the viability of an<br />
inland port:<br />
• Inbound traffic from Asia moving through Vancouver and the future container terminal at Prince Rupert<br />
destined for markets in Eastern Canada and the U.S. Midwest (Chicago, etc.).<br />
• Outbound traffic from Saskatchewan that is today shipped by bulk rail to ports and containerized at the<br />
ports.<br />
Import market<br />
There is currently an estimated 720,000 TEUs moving to eastern regions of Canada and the U.S. Midwest<br />
through the <strong>Port</strong> of Vancouver. This estimate is derived from the earlier analysis of traffic through the <strong>Port</strong><br />
of Vancouver, which showed that Eastern Canada and the U.S. Midwest accounted for 65 percent of<br />
Vancouver’s inbound container traffic.<br />
The incentive to stop some of this cargo at an inland port in Saskatchewan would be driven by:<br />
• The benefits of more rapid rail loading of containers at the <strong>Port</strong> of Vancouver. Containers would no<br />
longer have to be sorted by final destination in Vancouver (that is, building destination specific trains)<br />
and instead shipments are allocated to their final destination at the inland port. This would improve the<br />
throughput productivity of the marine terminals and rail yards in Vancouver.<br />
• The provision of transloading and added-value services that provide supply chain benefits to shippers.<br />
The basic transload operation involves transferring roughly three 40-foot international containers into<br />
two larger capacity domestic containers or trailers thus providing lower onward transport costs for the<br />
shipper. In addition, added-value ser vices such as labelling, packaging, and mix and match, would<br />
provide ad ditional value to the shipper.<br />
• The container shipping lines achieving lower re-positioning costs (the cost of returning the container to<br />
Asia) through reduced cycle times and the greater opportunities to capture an export shipment back to<br />
Asia.<br />
• Domestic truckers/intermodal service providers securing eastb ound shipments Eastern Canada and<br />
the U.S. Midwest, which enhances utilization of domestic trailers and intermodal containers.<br />
A number of important requirements are needed to ensure benefits are realized. These include:<br />
• The availability of low cost labour and land to support the transload and added-value activities provided<br />
at the inland port,<br />
• Sufficient domestic equipment to support the transload operation,<br />
• Information systems that ensure tracking of containers and shipments,<br />
• Proximity to the intermodal rail yard to minimize dray costs between the terminal and transload facility,<br />
and<br />
• Sufficient cargo volumes to support full train service to/from the inland port.<br />
Copyright 2007: Saskatchewan Agrivision Corporation Inc. Page 6-5
January 2007<br />
<strong>Canadian</strong> <strong>Intelligent</strong> <strong>Super</strong> <strong>Corridor</strong> - <strong>Smart</strong> <strong>Inland</strong> <strong>Port</strong> <strong>Network</strong><br />
Export Market<br />
The availability of balanced export oriented cargo will be an important incentive for container shipping lines<br />
to consider use of an inland port. Natural resource and agricultural products currently dominate<br />
Saskatchewan exports.<br />
Saskatchewan in 2004, in terms of the value of exports, was a leading global exporter of:<br />
• potash (49% of global exports, 9,998,000 tonnes)<br />
• durum (25% of global exports, 1,751,180 tonnes)<br />
• canola (17% of global exports, 1,011,320 tonnes)<br />
• peas (24% of global exports, 801,310 tonnes)<br />
• oats (15% of global exports, 417,580 tonnes)<br />
• crude canola oil (13% of global exports, 680,381 tonnes)<br />
• lentils (26% of global exports, 219,360 tonnes)<br />
• flax (42% of global exports, 174,110 tonnes)<br />
• mustard (29% of global exports, 139,800 tonnes)<br />
• canary seed (55% of global exports, 121,200 tonnes)<br />
• cured pork bellies (15%, 32,381 tonnes)<br />
(Source: Western Economic Development Canada)<br />
Although the vast majority of Saskatchewan’s resource and agricultural commodity exports are currently<br />
shipped by bulk methods, there is a rapid trend to containerize these products upon the global stage. Due<br />
to the volume of exports from agriculture, forestry, potash, and a growing manufacturing sector, even a<br />
sma ll percentage of conversion to containerization would dramatically increase the backhaul opportunities<br />
for shippers.<br />
Export Analysis: Example - Pulse Crops<br />
Spearheading the containerization trend of agriculture exports are high-value specialty crops, such as<br />
pulses - dry peas, dry beans, lentils and chickpeas. At this point the container stuffing is mostly performed<br />
at the port of loading rather than at an inland point. The growing customer concerns of traceability and<br />
identity preservation of most products will drive increased demand of containerized shipments.<br />
Canada is the world’s largest<br />
producer and exporter of dry peas<br />
and close to two-thirds of Canada’s<br />
annual production is exported, and<br />
Saskatchewan is the principal<br />
growing region. The world’s three<br />
largest import markets are Spain,<br />
India and China. <strong>Canadian</strong> exports<br />
grew steadily until 2002 when<br />
severe drought sharply reduced<br />
production and exports. Since then,<br />
exports have steadily recovered<br />
and, at 2.5 million tonnes in 2005,<br />
0 MT<br />
00<br />
Figure 6-4: Pulses Exported Through <strong>Port</strong> of Vancouver<br />
2,000<br />
1,800<br />
1,600<br />
1,400<br />
1,200<br />
1,000<br />
800<br />
600<br />
400<br />
200<br />
0<br />
1995 1996 1997 1998 1999 2000 2001 2002 2003 2004 2005<br />
Dry Peas Dry Beans (Incl. Chick Peas) Lentils Total<br />
Source: <strong>Port</strong> of Vancouver<br />
Copyright 2007: Saskatchewan Agrivision Corporation Inc. Page 6-6
January 2007<br />
<strong>Canadian</strong> <strong>Intelligent</strong> <strong>Super</strong> <strong>Corridor</strong> - <strong>Smart</strong> <strong>Inland</strong> <strong>Port</strong> <strong>Network</strong><br />
established a new record. The long-term trend of export growth has been supported by increased world<br />
demand, notably from India, and recently from China. Exports to Asia are primarily for food consumption<br />
while shipments to Europe are nearly all for animal feed.<br />
Vancouver is the principal export gateway for pulses (dry peas, dry beans, chick peas and lentils) grown in<br />
Western Canada (the provinces of British Colombia, Alberta, Saskatchewan and Manitoba). The <strong>Port</strong> of<br />
Vancouver has handled 50 to 55 percent of <strong>Canadian</strong> exports of pulses over the past few years.<br />
Penetration is greatest in dry peas, where the largest and fastest growing export markets are in Asia and<br />
favour the use of Vancouver. Vancouver handled 1.73 million tonnes of pulses (dry peas, dry beans, chick<br />
peas and lentils) in 2005. Vancouver’s exports of pulses grew nearly fourfold between 1995 and 2005<br />
driv en by the expansion of Canada’s production and exports, notably shipments to markets in Asia. Annual<br />
export volume is volatile as it reflects the underlying annual crop sizes and yields. Export traffic through<br />
Vancouver reached a record 1.81 million tonnes in 2001 then fell back to under one million tonnes in 2003<br />
du e to poor crops, recovering to 1.73 million tonnes in 2005. Dry peas are the dominant commodity in the<br />
pulses group and accounted for 92 percent of Vancouver’s pulses throughput in 2005.<br />
The share of pulses exported in containers has fluctuated between 20 and 45 percent over the past decade<br />
(Figure 6-5). The volatility reflects factors such as relative pricing of the different transport modes, container<br />
equipment availability, foreign market characteristics, cargo lot sizes, and commodity characteristics.<br />
Exports of dry peas are mostly in bulk and exports of dry beans and lentils are primarily containerized.<br />
Figure 6-5: Transport Mode of Pulses Exported Through <strong>Port</strong> of Vancouver<br />
rts<br />
Expo<br />
Share of<br />
90%<br />
80%<br />
70%<br />
60%<br />
50%<br />
40%<br />
30%<br />
20%<br />
10%<br />
0%<br />
95 96 97 98 99 00 01 02 03 04 05<br />
Bulk Share<br />
Containerized Share<br />
Source: <strong>Port</strong> of Vancouver<br />
Pulses, the largest specialty crop group handled by the <strong>Port</strong> of Vancouver provides an example of the<br />
potential cargo that could be handled by an inland port. Representative container volumes are determined<br />
by:<br />
• Estimating Saskatchewan’s share of <strong>Canadian</strong> production of pulses and applying that share to<br />
throughput of containerized pulses at the <strong>Port</strong> of Vancouver.<br />
• The base potential market is determined by looking at container share of traffic in 2005.<br />
• A high potential market is determined by looking at the historical peak in container share.<br />
Copyright 2007: Saskatchewan Agrivision Corporation Inc. Page 6-7
January 2007<br />
<strong>Canadian</strong> <strong>Intelligent</strong> <strong>Super</strong> <strong>Corridor</strong> - <strong>Smart</strong> <strong>Inland</strong> <strong>Port</strong> <strong>Network</strong><br />
The use of containers in any year is heavily influenced by the relative cost of container shipping versus bulk<br />
carrier shipping. In years, when container shipping is cheap relative to bulk carrier shipping, then the<br />
container share tends to increase. Overall, there has been an increase in the penetration of containers due<br />
to the increased availability of empty containers for backhaul cargo to Asia, improved port infrastructure for<br />
containers in major importing markets, and increased shipments in smaller lots.<br />
Table 6-4: Existing Containerization of Saskatchewan Pulses for Potential Market at <strong>Inland</strong> <strong>Port</strong><br />
Pulses Shipped Through <strong>Port</strong> of Vancouver in 2005<br />
Dry Peas Dry Beans/ Chick Peas Lentils Total<br />
Total MT 1,640,588 40,052 47,875 1,728,515<br />
Containerized MT 439,816 40,052 37,312 517,180<br />
Container Share 27% 100% 78% 30%<br />
Historical Peak Container Share 39% 100% 78%<br />
Potential Annual Market for CISCOR inland port (Based on 2005 Volumes)<br />
Dry Peas Dry Beans/ Chick Peas Lentils Total<br />
Estimated Saskatchewan Share of<br />
Production<br />
78% 30% 80%<br />
Base Containerized MT 343,056 12,016 29,850 384,922<br />
High Containerized MT if Peak Share 499,067 12,016 29,874 540,956<br />
Base TEU 1 17,153 601 1,492 19,246<br />
High TEU if Peak Share<br />
1<br />
24,953 601 133 25,687<br />
(1) MT converted to TEU assuming 20 MT per twenty-foot container. Due to their high density, the preference is to ship pulses<br />
in 20-foot containers. Access to a high-stress 20-foot container would allow around 25 MT to be loaded; the assumption<br />
here is a lower 20 MT so that the net weight does not exceed 22.7 MT (50,000 lbs), above which a railroad will apply a<br />
surcharge (based on policy of CN railroad). Other considerations are the local highway weight limitations, which can have<br />
an impact on MT loaded per container.<br />
Source: <strong>Port</strong> of Vancouver<br />
Copyright 2007: Saskatchewan Agrivision Corporation Inc. Page 6-8
January 2007<br />
<strong>Canadian</strong> <strong>Intelligent</strong> <strong>Super</strong> <strong>Corridor</strong> - <strong>Smart</strong> <strong>Inland</strong> <strong>Port</strong> <strong>Network</strong><br />
Prospective Throughput<br />
A reasonable floor for the potential throughput of the inland port is the assumption that the shipping lines<br />
would seek to have a balanced flow – that is, a container stopped at the inland port must secure an export<br />
load. Prospective volumes are determined by conducting an analysis of current major exports from<br />
Saskatchewan and applied assumptions of containerized traffic conversion if suitable inland port facilities<br />
existed.<br />
Saskatchewan is a leading exporter of a broad range of agricultural and other commodities that are suitable<br />
to be containerized to some extent. By con verting bulk cargo to containers and source loading commodities<br />
at an inland port, excess empty container ca rs can be removed from the rail lines. This reduces the<br />
growing imbalance of trade and improves the efficiency of the cargo supply chain in North A merica.<br />
The following tables provide export statistics on a portion of Saskatchewan exports: major agricultural<br />
products, potash, and wood pulp.<br />
Table 6-5: Future Containerization of Saskatchewan Agricultural Commodity Exports to Asia in MT (2004-2005 Data)<br />
Wheat Durum Oats Barley Flax Canola Pulses Total<br />
SK Global Exports 1 3,595,020 1,751, 180 417 ,580 1,513,180 174,110 1,011,320 1,031,610 7,276,960<br />
Asian Market Share (%) 2 70% 20% 5 % 80% 5% 75% 85%<br />
67%<br />
Asian Exports 2,516,514 350,236 20,879 1,210,544 8,706 758,490 876, 869 4,865,369<br />
Container Share (%)<br />
3<br />
15% 15% 15% 15% 15% 15% 75% 29%<br />
TEU 4 18,874 2,627 157 9,079 65 5,689 32,883 69,373<br />
(1) Canada Grain Commission – Grain Delivered to Prairie Points<br />
(2) Canada Grain Commission – <strong>Canadian</strong> Grain Exports<br />
(3) Container share percentage derived from interviews with Saskatchewan shippers<br />
(4) MT converted to TEU assuming 20 MT per 20-foot container, assumes all commodities shipped in 20-foot containers..<br />
Table 6-6: Future Containerization of Saskatchewan Agricultural Commodity Exports to NAFTA in MT (2004-2005 Data)<br />
Wheat Durum Oats Barley Flax Canola Pulses Total<br />
SK Global Exports 1 3,595,020 1,751,180 417,580 1,513,180 174,110 1,011,320 1,031,610 7,276,960<br />
NAFTA Market Share (%) 2 8% 15% 81% 15% 22% 17% 5% 18%<br />
NAFTA Exports 287,602 262,677 338,240 226,977 38,304 171,924 51,581 1,325,724<br />
Container Share (%) 3 15% 15% 15% 15% 15% 15% 75% 18%<br />
TEU 4 2,157 1,970 2,537 1,702 287 1,289 1,934 11,877<br />
(1) Canada Grain Commission – Grain Delivered to Prairie Points<br />
(2) Canada Grain Commission – <strong>Canadian</strong> Grain Exports<br />
(3) Container share percentage derived from interviews with Saskatchewan shippers<br />
(4) MT converted to TEU assuming 20 MT per 20-foot container; assumes all commodities shipped in 20-foot containers.<br />
Copyright 2007: Saskatchewan Agrivision Corporation Inc. Page 6-9
January 2007<br />
<strong>Canadian</strong> <strong>Intelligent</strong> <strong>Super</strong> <strong>Corridor</strong> - <strong>Smart</strong> <strong>Inland</strong> <strong>Port</strong> <strong>Network</strong><br />
Table 6-7: Future Containerization of Saskatchewan Processed Agricultural Exports to Asia and Others in MT (2004-<br />
2005 Data)<br />
Wheat Flour Canola Meal Canola Oil Pork Total<br />
Saskatchewan Global Exports 1 113,840 447,784 680,381 32,381 1,274,386<br />
Asia Market Share (%) 1 13% 38% 3% 42% 17%<br />
Others Market Share (%) 1 27% 19% 26% 4% 23%<br />
Asia and Others Exports 45,536 255,237 197,310 14,895 512,979<br />
Container Share (%) 2 100% 100% 100% 100% 100%<br />
TEU 3 2,277 12,762 13,154 828 45,598<br />
(1) Canada Grain Commission – <strong>Canadian</strong> Grain Exports<br />
(2) Container share percentage derived from interviews with Saskatchewan shippers<br />
(3) MT converted to TEU assuming 20MT per 20-foot container for wheat flour and canola meal; 15 MT per 20-foot for<br />
canola oil; and 18 MT per 40-foot container for pork.<br />
Table 6-8: Future Containerization of Saskatchewan Processed Agricultural Exports to NAFTA in MT (2004-2005 Data)<br />
Wheat Flour Canola Meal Canola Oil Pork Total<br />
Saskatchewan Global Exports 1 113,840 447,784 680,381 32,381 1,274,386<br />
NAFTA Market Share (%) 2 60% 43% 70% 55% 59%<br />
NAFTA Exports 68,304 192,547 476,267 17,810 754,927<br />
Container Share (%) 3 100% 100 % 100 % 100% 100%<br />
TEU 4 3 ,415 9,627 31,751 989 67,105<br />
(1) Canada Grain Commission – Grain De livered to Prairie Points<br />
(2) Canada Grain Commission – <strong>Canadian</strong> Grain Exports<br />
(3) Container share percentage derived from interviews with Saskatchewan shippers<br />
(4) MT converted to TEU assuming 20MT per 20-foot container for wheat flour and canola meal; 15 MT per 20-foot for<br />
canola oil; and 18 MT per 40-foot container for pork.<br />
Table 6-9: Future Containerization of Saskatchewan Potash Exports to Asia and Others in MT (2004-2005 Data)<br />
2001 2002 2003 2004 2005<br />
Saskatchewan Global Exports<br />
1<br />
7,785,000 8,145,000 8,791,000 9,998,000 9,539,000<br />
Asia Potash Market Share (%) 2 37% 37% 30% 33% 33%<br />
Others Potash Market Share (%) 14 % 15% 12%<br />
14% 10%<br />
Asia and Others Exports 2,880,450 3,013,650 2,637, 300 3,299,340 3,147,870<br />
Container Share (%) 3 5%<br />
5% 5% 5% 5%<br />
TEU 4 8, 472 8,864 7,757<br />
9,704 9,258<br />
(1) Saskatchewan Bureau of Statistics<br />
(2) Industry Canada – Strategis Statistics<br />
(3) Container share percentage derived from interviews with Saskatchewan shippers<br />
(4) MT converted to TEU assuming 17MT per 20-foot container.<br />
Table 6-10: Future Containerization of Saskatchewan Potash Exports to NAFTA in MT (2004-2005 Data)<br />
2001 2002 2003 2004 2005<br />
Saskatchewan Global Exports 1 7,785,000 8,145,000 8,791,000 9,998,000 9,539,000<br />
NAFTA Potash Market Share (%) 2 49% 48% 58% 54% 57%<br />
NAFTA Potash Exports 3,814,650 3,909,600 5,098,780 5,398,920 5,437,230<br />
Container Share (%) 3 5% 5% 5% 5% 5%<br />
TEU 4 11,220 11,499 14,996 15,879 15,992<br />
(1) Saskatchewan Bureau of Statistics<br />
(2) Industry Canada – Strategis Statistics<br />
(3) Container share percentage derived from interviews with Saskatchewan shippers<br />
(4) MT converted to TEU assuming 17MT per 20-foot container.<br />
Copyright 2007: Saskatchewan Agrivision Corporation Inc. Page 6-10
January 2007<br />
<strong>Canadian</strong> <strong>Intelligent</strong> <strong>Super</strong> <strong>Corridor</strong> - <strong>Smart</strong> <strong>Inland</strong> <strong>Port</strong> <strong>Network</strong><br />
Table 6-11: Future Containerization of Saskatchewan Pulp Exports to Asia in MT (2004-2005 Data)<br />
2001 2002 2003 2004 2005<br />
Saskatchewan Global Exports 1 $ 427,326,479 $366,878,474 $ 401 ,011,390 $403,3 70,817 $402,531,577<br />
NAFTA Market Share (%) 1 70% 50% 54% 55% 58%<br />
NAFTA Exports $299,128,535 $183,439,237 $216,54 6,151 $221,8 53,949 $233,468,315<br />
$CDN per tonne ($CDN/MT) 2 $689 $7 73 $752 $806 $815<br />
NAFTA Exports (MT) 434,464 237,425 287,930 275,117 286,411<br />
Container Share (%) 3 25% 25% 25% 25% 25%<br />
TEU 4 4,345 2,374 2, 879 2,751 2,864<br />
(1) Industry Canada – Strategis Statistics<br />
(2) Bank of Montreal Commodity Price Report – Years 2001 to 2005<br />
(3) Container share percentage derived from interviews with Saskatchewan shippers<br />
(4) MT converted to TEU assuming 25 MT per 40-foot container.<br />
Table 6-12: Future Containerization of Saskatchewan Pulp Exports to NAFTA in MT (2004-2005 Data)<br />
2001 2002 2003 2004 2005<br />
Saskatchewan Global Exports 1 $42 7,326,479 $366 ,878,474 $401 ,011,390 $403 ,370,817 $4 02,531,577<br />
Asia Market Share (%) 1 18% 28% 23% 23% 22%<br />
Asia Exports 1 $76,918,766 $1 02 ,725,973 $92 ,232,620 $92 ,775,288 $88,556,947<br />
$CDN per tonne ($CDN/MT) 2 $689 $ 773 $ 752 $ 806 $815<br />
Asia Exports (MT) 111,719 132,958 122,637 115,049 108,639<br />
Container Share (%) 3 50% 50% 50% 50% 50%<br />
TEU<br />
4<br />
2,234 2,659 2,453 2,301 2,173<br />
(1) Industry Canada – Strategis Statistics<br />
(2) Bank of Montreal Commodity Price Report – Years 2001 to 2005<br />
(3) Container share percentage derived from interviews with Saskatchewan shippers<br />
(4) MT converted to TEU assuming 25 MT per 40-foot container.<br />
Table 6-13: Summary of Future Containerization<br />
of Saskatc hewan Exports to Asia (2004-2005 Data)<br />
Tonnes TEU Share TEU<br />
Ag Commodity Exports 4,865,369 29% 69,373<br />
Ag Processed Exports 512,979 100% 29, 020<br />
Potash Exports 3,147,870 5% 9,258<br />
Pulp Exports 108,639 50% 2,173<br />
Total Exports in Analysis 8,634,856 25% 109,824<br />
Table 6-14: Summary of Future Containerization of Saskatchewan Exports to NAFTA (2004-2005 Data)<br />
Tonnes TEU Share TEU<br />
Ag Commodity Exports 1,325,724 18% 11,877<br />
Ag Processed Exports 754,927 100% 45,783<br />
Potash Exports 5,437,230 5% 15,992<br />
Pulp Exports 286,411 25% 2,864<br />
Total Exports in Analysis 7,804,293 20% 76,516<br />
Copyright 2007: Saskatchewan Agrivision Corporation Inc. Page 6-11
January 2007<br />
<strong>Canadian</strong> <strong>Intelligent</strong> <strong>Super</strong> <strong>Corridor</strong> - <strong>Smart</strong> <strong>Inland</strong> <strong>Port</strong> <strong>Network</strong><br />
Table 6-15: Potential CISCOR <strong>Smart</strong> <strong>Inland</strong> <strong>Port</strong> Market<br />
TEU TEU - 30% TEU + 10%<br />
Asia Outbound 109,824 76,877 120,<br />
807<br />
Asia Inbound 1 109,824 76,877 120,807<br />
NAFTA Outbound 76,516 53,561 84,168<br />
NAFTA Inbound 1 76,516 53, 561 84,168<br />
Total Throughput 372,681 260,877<br />
409,949<br />
(1) Assumes shipping lines will seek to maintain a balanced flow with each exp ort load offset by an import load.<br />
The above analysis of major export commodities indicates a market potential of approximately 260,000 to<br />
410,000 TEUs for the inland port. There is considerable potential to capture more TEU per year<br />
(tran<br />
sloaded) of agricultural, forestry, prepared foods, potash, machinery products by other routes into the<br />
continental U.S, that are not considered within the analysis. The analysis also excludes additional<br />
commodity types, such as other livestock, that may be suitable for handling by the inland port. Additional<br />
volumes may be available originating through e ast coast ports but this is likely to be a very small market,<br />
one insufficient to support an inland port.<br />
A factor that may encourage shippin g lines to stop inbound containers at the inland port would be the ability<br />
to rapidly return empty containers to Asia for high revenue import loads. A f urther benefit is the ability to<br />
transload export-oriented products from across Canada and the north-east U.S. with intelligent capabilities<br />
for cus toms clearance. Therefore, the total potential throughput could be over 500,000 TEUs assuming<br />
the cost, transit and service conditions are in place to make the smart inland port a viable distribution,<br />
customs clearance, and transload facility.<br />
Success in capturing the above cargo flows will be determined by the efficiency and cost savings that<br />
shippers, shipping lines, railroads and others involved in the international trade process would secure by<br />
using an inland port.<br />
Copyright 2007: Saskatchewan Agrivision Corporation Inc. Page 6-12
January 2007<br />
<strong>Canadian</strong> <strong>Intelligent</strong> <strong>Super</strong> <strong>Corridor</strong> - <strong>Smart</strong> <strong>Inland</strong> <strong>Port</strong> <strong>Network</strong><br />
. Cost Analysis – A Business Case<br />
An important aspect of determining the feasibility of an inland port system in Saskatchewan is evaluating<br />
whether the port will be competitive with existing transportation options. An intermodal connection to the<br />
Midwest, specifically Chicago, would represent one of the best opportunities for a proposed CISCOR <strong>Smart</strong><br />
<strong>Inland</strong> <strong>Port</strong> <strong>Network</strong>. In 2005, the Midwest region accou nted for 3.14 million container moves. Of those<br />
container moves, 67 percent originat ed in Asia. This cost analysis examines the current trucking and rail<br />
costs between the <strong>Port</strong> of Vancouver and Chicago. These costs are compared with the estimated costs for<br />
transporting goods through the inland port in Saskatchewan.<br />
Import Containerized Trade<br />
The cost estimates for both transportation options and future transport through Saskatchewan were<br />
developed using a few important assumptions. Intermodal rail and trucking costs to Chicago are<br />
determined using price quotes provided by both transportation companies and also firms that have goods<br />
transported through the port. All trucking costs are based on kilometres between pick-up and drop-off<br />
locations. A simplified analysis is presented below for freight moving from Vancouver to Chicago:<br />
Table 7-1. Estimated Cost Comparison of an International Container Transloaded at <strong>Inland</strong> <strong>Port</strong> vs. Direct Shipment<br />
<strong>Canadian</strong> Dollars Vancouver -<br />
Saskatchewan -<br />
Vancouver -<br />
Saskatchewan -<br />
Vancouver –<br />
Chicago<br />
Chicago<br />
Chicago<br />
Transport Mode Rail Rail & Truck Rail<br />
Cost per 40-ft Container 1<br />
Intermodal Rail $1,400 $1,400 $2,200<br />
Lift / Dray Cost $50 $50<br />
<strong>Inland</strong> Transload $350 $350<br />
Lift / Dray Cost $50 -<br />
Intermodal Rail 2 $800 -<br />
Truck 3 - $1,000<br />
Destination Local Dray 4 $120 - $175<br />
Total Cost per 40-ft Container $2,770 $2,800 $2,375<br />
(1) Rates exclude fuel surcharges<br />
(2) Assumes three 40-ft containers transloaded to two domestic containers and rate per domestic container is $1,200.<br />
(3) Assumes three 40-ft containers transloaded to two domestic trailers and rate per domestic trailer is $1,500.<br />
(4) Assumes three 40-ft containers transloaded to two domestic containers and local dray rate is $175.<br />
Shippers are increasingly selecting transportation services based on time-definite service and reliability,<br />
rather than mode or route. In order to become a viable alternative to door-to-door truck service or<br />
intermodal door-to-door truck-rail service, an inland port must integrate full service, time-definite freight<br />
transport. The inland port must also offer a package that ensures the shipper’s door-to-door transit time is<br />
competitive with current practice.<br />
Copyright 2007: Saskatchewan Agrivision Corporation Inc. Page 7-1
January 2007<br />
<strong>Canadian</strong> <strong>Intelligent</strong> <strong>Super</strong> <strong>Corridor</strong> - <strong>Smart</strong> <strong>Inland</strong> <strong>Port</strong> <strong>Network</strong><br />
Today, intermodal rail transit time from Vancouver to Chicago is five days and to Toronto is four days 1 . The<br />
shipper using the inland port would incur additional time, stopping the container and perform transloading<br />
(say one to three days). This time would have to be recovered elsewhere in the supply chain, for example<br />
through the ability to create direct delivery shipments from the inland port.<br />
The shipper would seek to recover the additional costs of transloading elsewhere in the supply chain, such<br />
as through the lower cost of moving goods in domestic equipment (approximately three 40-foot containers<br />
can be transloaded into two domestic container or trailers), reduce non-revenue moves by loading empty<br />
containers with local cargo and better management of inventory. There are a large number of variables<br />
that will drive cost competitiveness – labour cost, equipment availability, etc. One significant variable is the<br />
role of contract pricing in intermodal rail service. The major container shipping lines moving containers from<br />
Vancouver through to the Eastern markets likely do so under contracts with the railroads that have<br />
competitive prices determined by volume commitments. Such competitive pricing may or may not be<br />
available for volume container shipments moving to and from the inland port.<br />
Containerization of Export Bulk Products<br />
The global trend towards containerization of bulk commodities reflects the balancing of bulk and container<br />
shipping rates, shorter intermodal delivery times, and increased concerns about product quality and<br />
shipment safety. The ability of an inland port to source load containers will be determined by the cost of<br />
container processing at an inland point versus the cost of doing so at the <strong>Port</strong> of Vancouver, which occurs<br />
approximately 50 percent of the time. The decision on where to containerize bulk products is driven by cost<br />
and equipment availability issues. The basic analysis of transport costs indicates that source loading of<br />
containers is less than shipping product by rail hopper car to the port and then loading into containers at the<br />
port.<br />
Table 7-2: Shipper Transport Cost Analysis (Based on 20-foot Containers)<br />
Source Loaded at Points in <strong>Port</strong> Loaded, Origin<br />
Saskatchewan Saskatchewan<br />
Origin Dray $430 -<br />
Rail / Hopper Car - $3,550<br />
Rail / Container $1,100* $890**<br />
Destination Dray - $230<br />
Stuffing - $545<br />
Total per Container $1,530 $1,665<br />
Difference - +9%<br />
*Based on 90 MT per hopper car, the equivalent of four 20-foot containers at 22.5 MT per container.<br />
** Equivalent rate per container based on four container loads per hopper car.<br />
Source: “Container Measures Study: Issues and Discussion for Proposed Measures for the Grain<br />
Monitoring Program” June 2006, Government of Canada<br />
1<br />
CN’s domestic intermodal ramp-to-ramp service schedule on www.cn.ca.<br />
Copyright 2007: Saskatchewan Agrivision Corporation Inc. Page 7-2
January 2007<br />
<strong>Canadian</strong> <strong>Intelligent</strong> <strong>Super</strong> <strong>Corridor</strong> - <strong>Smart</strong> <strong>Inland</strong> <strong>Port</strong> <strong>Network</strong><br />
One challenge for the shipper who wants to source-load a container is the availability of equipment.<br />
Container shipping lines are often more interested in returning an empty container rapidly to Asia to pick up<br />
a higher revenue-paying import load than in securing a lower revenue export load. However, the operation<br />
of a central inland port, located at or near an intermodal rail facility may encourage increased availability of<br />
empty containers for export loads.<br />
The proposed terminal’s competitive position will be determined by its ability to offer comparable or superior<br />
facilities, services and costs relative to other North American inland ports. The economic analysis indicates<br />
that the proposed terminal may have cost (transport, terminal handling) and productivity advantages<br />
relative to existing inland gateways.<br />
The development of a new inland port can be made “future ready”, integrating state-of-the-art equipment<br />
and technological advancement that increases productivity. Older, more established port infrastructure<br />
cannot as readily take advantage of new port technologies and productivity enhancements since they must<br />
invest in upgrades to older facilities. In combination with competitive pricing and service from the CN and<br />
CPR, this should enable the proposed terminal to compete in the targeted markets for both incremental<br />
growth and the potential diversion of traffic from other <strong>Canadian</strong> inland centres.<br />
Copyright 2007: Saskatchewan Agrivision Corporation Inc. Page 7-3
Business Case Conclusion and Recommendations<br />
As demonstrated in this paper, recent global trade trends and empirical evidence underline a new phase of<br />
port development that incorporates inland port integration. Shipping companies are increasing ship sizes<br />
and transporting more goods to global market consumption centres as a means to achieve economies of<br />
scale. The larger vessels which exceed the dimensions of the Panama Canal require ever-increasing<br />
marine terminal capacity and seamless landside access connectivity. In the highly competitive and<br />
evolving environment of transportation logistics, strategies to link seaports more closely to inland<br />
operations and invest in landside network improvements may become imperative if ports want to retain or<br />
increase their market share in the future. The shipping community will only then fully benefit from the<br />
synergies of a total transport and logistics chain.<br />
The continuing significant growth in global containerized trade, particularly in the Asian trades and the<br />
concentration of intermodal Asian cargoes on express rail transfer services, will give <strong>Canadian</strong> ports and<br />
their associated rail land-bridge services a substantial advantage in transit time and cost over other<br />
competing North American ports and services. This study has identified a viable opportunity to develop a<br />
smart inland port in Saskatchewan given that certain critical conditions can be met:<br />
• A critical mass of cargo, both inbound imports for distribution and outbound exports must be developed<br />
in Saskatchewan. This includes transload and distribution of imported products for the North American<br />
market, as well as loading empty containers with local and transloaded products for export..<br />
• Sufficient rail car volume must be take place at the smart inland port to justify dedicated unit trains to<br />
and from the Pacific Northwest.<br />
• The inland port must offer compelling value-added logistics services to engage the shipping community<br />
and create a distinct intelligent competitive advantage over “business as usual” cargo distribution<br />
modes.<br />
• The economics of the inland port must be attractive to operators, investors and shipping interests.<br />
When these conditions are met, the CISCOR <strong>Smart</strong> <strong>Inland</strong> <strong>Port</strong> <strong>Network</strong> in Saskatchewan will be a viable<br />
part of the <strong>Canadian</strong> intermodal network and will result in significant competitive advantages and benefits:<br />
• Development of a state-of-the art, competitive, secure and sustainable national gateway.<br />
• Enhancement and fulfillment of Canada’s emerging national intermodal land bridge (CISCOR).<br />
• Integration of leading-edge information technology services for transport providers to achieve supply<br />
chain excellence, allowing maximum control of end to-end shipments.<br />
• Creation of a free-trade zone to attract manufacturing for re-export.<br />
• Stimulation of additional Asian import and export opportunities for Canada and North and Midwest U.S.<br />
• Establishment of trade through consolidation and containerization of import and export cargo at<br />
warehousing and logistics centres at the inland port.<br />
• Establishment of unique Greenfield facilities made “future ready”, integrating state-of-the-art equipment<br />
and technological advancement tailored to meet port and intermodal challenges of today and tomorrow.
January 2007<br />
<strong>Canadian</strong> <strong>Intelligent</strong> <strong>Super</strong> <strong>Corridor</strong> - <strong>Smart</strong> <strong>Inland</strong> <strong>Port</strong> <strong>Network</strong><br />
To realize the promise of the initiative to develop a <strong>Smart</strong> <strong>Inland</strong> <strong>Port</strong> <strong>Network</strong> in Saskatchewan that serves<br />
as the nucleus to the <strong>Canadian</strong> <strong>Intelligent</strong> <strong>Super</strong> <strong>Corridor</strong>, the following feasibility steps outlined below<br />
should be undertaken:<br />
Initiate legislative reform – Regulatory reform of cabotage restrictions and the Railway Revenue Cap<br />
under the Canada Transportation Act (CTA) has the potential to reduce freight rates, improve shipper<br />
performance, increase rail capacity and reduce empty mile ratios for carriers. A detailed and independent<br />
study of potential benefits and risks of cabotage liberalization and CTA revisions should be performed prior<br />
to the development of a legislative reform proposal.<br />
Perform detailed market assessment and development study – As with any development project, the<br />
financial viability will hinge on physical and market factors. These include carrier preferences, CN and CPR<br />
train operations, and penetration of inland markets at competitive rates.<br />
Verify the capital construction and equipment costs – A challenge to be faced in any port/intermodal<br />
development is the initial capital construction and equipment costs and the time lag between initiation of<br />
construction and inception of operations and generation of revenue from the project. Therefore, a crucial<br />
next step will be to complete a detailed terminal conceptual plan and recommended equipment layout in<br />
order to provide a defensible, flexible yet expandable terminal plan with a realistic capital cost estimate and<br />
a time dependent budget draw down schedule for initiation of the terminal operations.<br />
Quantify the operational costs and projected returns – To build an inland port in Saskatchewan on a<br />
sound economic basis, the gross operating revenues and operating costs must be quantified. These<br />
revenues and costs, as applied to the projected cargo demand will define the expected return on the project<br />
capital invested.<br />
Build a comprehensive financial model – Given a solid, time-dependent schedule of costs and projected<br />
reve<br />
nues, an evaluation of the base case financial model for this project will quantify the internal rate of<br />
return for the capital investment, the ability of the project to carry debt, as well as the total present value for<br />
each phase of construction.<br />
The compelling factors outlined in this study show significant promise for the development of a state-of-the-<br />
network. The advancement of the inland port concept that builds on Canada’s strengths and leverages its<br />
art inland port facilities in Saskatchewan to serve as the centre of the expanding North American trade<br />
investment in roadway, rail, and intermodal infrastructure will ultimately stimulate growth in various<br />
provincial industries and benefit the national economy.<br />
Copyright 2007: Saskatchewan Agrivision Corporation Inc.<br />
Page CR-2
January 2007<br />
<strong>Canadian</strong> <strong>Intelligent</strong> <strong>Super</strong> <strong>Corridor</strong> - <strong>Smart</strong> <strong>Inland</strong> <strong>Port</strong> <strong>Network</strong><br />
References<br />
Agriculture and Agri-Food Canada - Office of Trade Evaluation (2006). Saskatchewan: Exports of Pork Products to<br />
All Countries 2005. Data obtained from Statistics Canada courtesy SaskPork. ). Retrieved January 22, 2007 from<br />
http://www.saskpork.com/content/exclusive_content/ind_stats.cfm<br />
American Association of <strong>Port</strong> Authorities. (June 13, 2006). U.S./Canada Container Traffic in TEUs (1980 -<br />
2005). Retrieved August 25, 2006 from http://www.aapa-<br />
ports.org/files/Statistics/CONTAINER%5FTRAFFIC%5FMEXICO.xls<br />
American Association of <strong>Port</strong> Authorities. (June 13, 2006). U.S./Canada Container Traffic in TEUs (1980 –<br />
2005). Retrieved August 25, 2006 from http://www.aapa-ports.org/files/Statistics/<br />
2005%5FNORTH%5FAMERICAN%5FCONTAINER%5FTRAFFIC.pdf.<br />
Asia Pacific Foundation of Canada (APFC). (2006). Asia’s Massive Container <strong>Port</strong> Development Pressures<br />
Canada to Respond. Asia Pacific Bulletin #263. Retrieved November 4, 2006 from<br />
http://www.asiapacificbusiness.ca/apbn/pdfs/bulletin263.pdf.<br />
Ashar, A. (2004). Reversals of fortune, Containerisation International, 1, 58-61.<br />
Bank of Montreal - Economic Research and Analysis Group (2007). BMO Financial Group Commodity – Forest<br />
Product Index. Retrieved January 29, 2007 from http://www.bmo.com/economic/archdata.html<br />
<strong>Canadian</strong> Grain Commission (2005). Grain Deliveries at Prairie Points, Crop Year 2004/2005. Retrieved January 18,<br />
2007 from http://www.grainscanada.gc.ca/Pubs/GrainDeliveries/annual/gdpp_04-05.pdf<br />
<strong>Canadian</strong> Grain Commission (2005). <strong>Canadian</strong> Grain Exports, Crop Year 2004/2005. Retrieved January 18, 2007<br />
from http://www.grainscanada.gc.ca/Pubs/ExportsYearly/annual/exports-2005-e.pdf<br />
<strong>Canadian</strong> National Railway Company. (November 16, 2006). CN opens $4 million grain container facility in<br />
Edmonton. Retrieved December 27, 2006 from http://www.cn.ca/about/media/news_releases/2006/<br />
4th_quarter/en_News20061116.shtml.<br />
<strong>Canadian</strong> ports at the gate. (September 2006). WorldCargo News, 25-27.<br />
Davies, P. (October 26, 2005). Off-Dock Storage of Empty Containers in the Lower Mainland of British<br />
Columbia: Industry Impacts and Institutional Issues, Transport Canada Final Report of the Task Force.<br />
Retrieved September 6, 2006 from http://www.metrans.org/nuf/documents/Davies.pdf.<br />
DDC Consulting Services Inc. (2006). Strategies to Improve Railway and Trade Logistics, prepared for<br />
Regina Regional Economic Development Authority and Saskatchewan Agrivision Corporation Inc.<br />
Retrieved September 6, 2006 from http://www.agrivision.ca/pdf/other/SAC-Final-Report_Transportation.pdf.<br />
Copyright 2007: Saskatchewan Agrivision Corporation Inc.<br />
Page CR-3
January 2007<br />
<strong>Canadian</strong> <strong>Intelligent</strong> <strong>Super</strong> <strong>Corridor</strong> - <strong>Smart</strong> <strong>Inland</strong> <strong>Port</strong> <strong>Network</strong><br />
Fahrenwald, B. (August 28, 2006) Northern Plains Commerce Centre Announces Agreement with United<br />
Pulse Trading at Golden Spike Ceremony, Mallory International Logistics News. Retrieved November 1,<br />
2006 from http://www.npccbismarck.com/documents/August28_000.doc.<br />
Foreign Affairs and International Trade Canada. (2006). Canada’s State of Trade, Seventh Annual Trade<br />
Update, The Office of the Chief Economist, Catalogue no. IT1-3/2006E-PDF. Retrieved November 4, 2006<br />
from http://www.international.gc.ca/eet/trade/state-of-trade-en.asp.<br />
Industry Canada (2007). Saskatchewan Trade by Country, by Industry – Filters used: NAICS 212396 - Potash<br />
Mining, Last Five Years. Data obtained from Statistics Canada and the U.S. Census Bureau (U.S. Department of<br />
Commerce). Retrieved January 22, 2007 from http://strategis.ic.gc.ca/sc_mrkti/tdst/tdo/tdo.php#tag<br />
Industry Canada (2007). Saskatchewan Trade by Country, by Industry – Filters used: NAICS 3221 - Pulp, Paper and<br />
Paperboard Mills, Last Five Years. Data obtained from Statistics Canada and the U.S. Census Bureau (U.S.<br />
Department of Commerce). Retrieved January 22, 2007 from http://strategis.ic. gc.ca/sc_mrkti/tdst/tdo/tdo.php#tag<br />
Ircha, M.C. (2001). Characteristics of Tomorrow's Successful <strong>Port</strong>, Atlantic Institute for Market Studies,<br />
Atlantica Papers #4. Retrieved September 28, 2006 from http://www.aims.ca/library/ircha.pdf.<br />
KPMG (2006). Competitive Alternatives: A Guide to International Business Costs. Retrieved November 1,<br />
2006 from http://www.competitivealternatives.com/download/default.asp.<br />
Leitner, S. and R.H. Harrison. (2001). The Identification and Classification of <strong>Inland</strong> <strong>Port</strong>s, Center for<br />
Transportation Research, The University of Texas at Austin. Research Report 0-4083-1, Texas Department<br />
of Transportation. Retrieved September 28, 2006 from http://www.utexas.edu/research/ctr/pdf_reports/.<br />
National Chamber Foundation. (2003). Trade and Transportation: A Study of North American <strong>Port</strong> and<br />
Intermodal Systems. Washington, D.C. U.S. Chamber of Commerce.<br />
North American rails tackle congestion. (November 2005). World Cargo News, 29-30.<br />
Notteboom, T. (2002). The interdependence between liner shipping networks and intermodal networks,<br />
Paper for IAME Panama 2002, Maritime Economics: Setting the foundations for port and shipping policies,<br />
Panama City, Panama, November 13-15, 2002. Retrieved August 25, 2006 from www.eclac.cl/transporte/<br />
perfil/iame_papers/proceedings/Notteboom.doc.<br />
Notteboom, T. and Rodrigue, JP. (2005). <strong>Port</strong> regionalization: towards a new phase in port development,<br />
Maritime Policy and Management, 32, 3, 297–313.<br />
Pacific Gateway Strategy Industry Advisory Group. (April 30, 2006) Pacific Strategy Action Plan: 2006-<br />
2020. Retrieved November 1, 2006 from http://www.th.gov.bc.ca/PacificGateway/documents/<br />
PGS_Action_Plan_043006.pdf.<br />
Padova, A. (January 30, 2006). Trends in containerization and capacity at <strong>Canadian</strong> ports, Staff of the<br />
Parliamentary Information and Research Service (PIRS) of the Library of Parliament, Economics Division.<br />
Retrieved November 4, 2006 from http://www.parl.gc.ca/information/library/PRBpubs/prb0575-e.htm.<br />
Copyright 2007: Saskatchewan Agrivision Corporation Inc.<br />
Page CR-4
January 2007<br />
<strong>Canadian</strong> <strong>Intelligent</strong> <strong>Super</strong> <strong>Corridor</strong> - <strong>Smart</strong> <strong>Inland</strong> <strong>Port</strong> <strong>Network</strong><br />
Panama Canal Authority (April 24, 2006). Proposal for the Expansion of the Panama Canal. Retrieved<br />
August 25, 2006 from http://www.pancanal.com/eng/plan/documentos/propuesta/acp-expansionproposal.pdf.<br />
Panayides, P.M. (2006). Maritime Logistics and Global Supply Chains: Towards a Research Agenda,<br />
Maritime Economics & Logistics, 8, 1, 3–18.<br />
Prentice, B., Kosior, J., Butt, M. (1998). Manitoba International Container Study, Transport Institute,<br />
University of Manitoba. Retrieved September 28, 2006 from<br />
http://umanitoba.ca/faculties/management/ti/media/mioss_Nov2.pdf.<br />
Prozzi, J.; Henk, R.; McCray, J. and Harrison, R. (2002). <strong>Inland</strong> ports: planning successful developments,<br />
Center for Transportation Research, The University of Texas at Austin. Research Report 4083-2.<br />
Retrieved November 4, 2006 from http://www.utexas.edu/research/ctr/pdf_reports/.<br />
Saskatchewan Bureau of Statistics (2005). Economic Review 2005. . Retrieved January 18, 2007 from<br />
http://www.stats.gov.sk.ca/ec_rvw/2005Review.pdf<br />
Satwinder, P. and Nova, W. (September 2006). Opportunity Assessment for <strong>Inland</strong> Intermodal Container<br />
Facility in Kamloops; Venture Kamloops. Retrieved November 4, 2006 from<br />
http://www.venturekamloops.com/SiteCM/U/D/E9CEAA21FC019AF9.pdf .<br />
Statistics Canada. (2006). An Analysis of the Transportation Industry in 2005, Catalogue no. 11-621-<br />
MIE2006044. Retrieved September 28, 2006 from http://www.statcan.ca/english/research/11-621-<br />
MIE/2006044/issue.htm.<br />
The United Nations Economic and Social Commission for Asia and the Pacific (UNESCAP). (2006). Free<br />
Trade Zone and <strong>Port</strong> Hinterland Development. Retrieved September 28, 2006 from<br />
http://www.unescap.org/ttdw/ Publications/TFS_pubs/pub_2377.<br />
The United Nations Economic and Social Commission for Asia and the Pacific (UNESCAP). (November,<br />
2005). Managing Globalization Regional Shipping and <strong>Port</strong> Development Strategies. Economic and Social<br />
Commission for Asia and the Pacific Monograph Series. Retrieved September 28, 2006 from http://<br />
www.unescap.org /ttdw/publications/tfs_pubs/pub_2398/pub_2398_ch3.pdf.<br />
The White House, Office of the Press Secretary. (January 25, 2002). <strong>Smart</strong> Borders for the 21st Century<br />
U.S. - Canada <strong>Smart</strong> Border/30 Point Action Plan Update. Retrieved November 15, 2006 from<br />
http://www.whitehouse.gov/news/releases/2002/12/20021206-1.html.<br />
TranSystems Corporation. (1998). Mid-Continent Tradeway Study, prepared for Mid-America Regional<br />
Council, Greater Kansas City Chamber of Commerce and U.S. Treasury Department, available at<br />
http://www.marc.org/transportation/tradeway.htm.<br />
Copyright 2007: Saskatchewan Agrivision Corporation Inc.<br />
Page CR-5
January 2007<br />
<strong>Canadian</strong> <strong>Intelligent</strong> <strong>Super</strong> <strong>Corridor</strong> - <strong>Smart</strong> <strong>Inland</strong> <strong>Port</strong> <strong>Network</strong><br />
TranSystems Corporation. (2003). Pacific Northwest Agile <strong>Port</strong> System Demonstration Plan, prepared for<br />
Center for the Commercial Deployment of Transportation Technologies, available at<br />
http://www.ccdott.org/proj_results/agile_ports_termsys.htm.<br />
Vancouver <strong>Port</strong> Authority (VPA). (2005). Statistical overview.<br />
Vido, E.; Prentice, B. and Kosior, J. (2001). An Assessment of North American Container Cabotage<br />
Regulations: The Impact on <strong>Canadian</strong> Operations – Final Report, Prepared for Manitoba Transportation<br />
and Government Services. Retrieved November 4, 2006 from http://umanitoba.ca/faculties/management/ti/<br />
media/Assessment_NAmerican_Container_Cabotage_2001.pdf.<br />
Walter, C.K. and Poist, R. F. (2004). North American inland port development: international vs. domestic<br />
shipper preferences, International Journal of Physical Distribution & Logistics Management, 34, 7/8, 579-<br />
597.<br />
Wang, TF. and Cullinane, K. (2006). The efficiency of European container terminals and implications for<br />
supply chain management, Maritime Economics & Logistics, 8, 82-99.<br />
Weixel, G. (January 13, 2005). Project Could Open Doors, The Bismarck Tribune. Retrieved November 1,<br />
2006 from http://www.accessmylibrary.com/coms2/summary_0286-8223549_ITM.<br />
Western Economic Development Canada (2005). Saskatchewan's State of Trade April 2005 - International Trade by<br />
Product. Retrieved January 18, 2007 from http://www.wd.gc.ca/rpts/research/sk_sot/sk_sot_e.pdf<br />
Western Transportation Advisory Council (WESTAC). (March 2006). Preparing for Success: Forecasting<br />
surface freight demand. Retrieved November 15, 2006 from http://www.westac.com/forecast/forecast.html.<br />
Copyright 2007: Saskatchewan Agrivision Corporation Inc.<br />
Page CR-6
January 2007<br />
<strong>Canadian</strong> <strong>Intelligent</strong> <strong>Super</strong> <strong>Corridor</strong> - <strong>Smart</strong> <strong>Inland</strong> <strong>Port</strong> <strong>Network</strong><br />
Notes<br />
Copyright 2007: Saskatchewan Agrivision Corporation Inc.<br />
Page CR-7