Pakistan satellite crop monitoring bulletin - Agricultural Market ...
Pakistan satellite crop monitoring bulletin - Agricultural Market ...
Pakistan satellite crop monitoring bulletin - Agricultural Market ...

Create successful ePaper yourself
Turn your PDF publications into a flip-book with our unique Google optimized e-Paper software.
Government of <strong>Pakistan</strong><br />
Prelude:<br />
SUPARCO, the National Space<br />
Agency, is inter-alia involved in<br />
<strong>monitoring</strong> of <strong>crop</strong>s through use of<br />
<strong>satellite</strong> remote sensing and GIS<br />
technologies. This work is being<br />
carried out in collaboration with<br />
<strong>Pakistan</strong> Meteorological Department,<br />
Provincial Crop Reporting Services,<br />
National Fertilizer Development<br />
Center (NFDC) and Indus River<br />
System Authority (IRSA).<br />
SUPARCO has developed techniques<br />
and procedures for fast track delivery<br />
of reliable and reproducible<br />
information.<br />
Inside this issue:<br />
Crop Situation December<br />
2011<br />
Recession of rainwater<br />
in Sindh<br />
Normalized Difference<br />
Vegetation Index<br />
(NDVI): Growth Profile<br />
at Divisional level<br />
Normalized Difference<br />
Vegetation Index<br />
(NDVI): Growth Profile<br />
at Provincial level<br />
Kharif Crop Seasonal<br />
Growth Profile 2011-12<br />
Vegetation Difference,<br />
31 st December, 2011<br />
Temporal Vegetation<br />
changes<br />
1-4<br />
5<br />
6-7<br />
8<br />
9-11<br />
12<br />
Agro-met Conditions 16<br />
13-15<br />
Maximum Temperature:<br />
December, 2011<br />
17<br />
Irrigation Water Supply<br />
Situation<br />
Daily Hydrological<br />
Status at Indus Basin:<br />
December, 2011<br />
18<br />
19<br />
Fertilizer Situation 20<br />
Field view of <strong>crop</strong>s:<br />
December, 2011<br />
21-22<br />
Crop Statistics: 2011-12 23<br />
PAK-SCMS BULLETIN<br />
PAKISTAN SATELLITE BASED CROP MONITORING SYSTEM<br />
Volume II, Issue 1<br />
Crop Situation : December, 2011<br />
Summary<br />
The sowing of Rabi <strong>crop</strong>s in <strong>Pakistan</strong><br />
stretches from mid September to end<br />
December. During the Rabi season<br />
2011-12, large areas were sown under<br />
rapeseed, vegetables chickpeas,<br />
fodders, wheat and other <strong>crop</strong>s.<br />
In barani areas (rainfed) the sowing of<br />
Rabi <strong>crop</strong>s was affected due to long<br />
dry spell. The <strong>crop</strong>s in these areas<br />
have been under moisture stress and<br />
there is a dire need of rainfall in<br />
barani areas (rainfed) during early<br />
part of January.<br />
In irrigated areas, the major activity<br />
during December was mainly focused<br />
on sowing of wheat <strong>crop</strong> after harvest<br />
of cotton, rice and after sugarcane<br />
<strong>crop</strong>s to some extent.<br />
Government of <strong>Pakistan</strong> took two<br />
fold policy decision to increase productivity<br />
of wheat <strong>crop</strong>. These include<br />
(a) Reduction in the price of<br />
urea by about Rs. 200 per bag to Rs.<br />
1600-1700 through a farm support<br />
policy (b) Increase in the support<br />
price of wheat to Rs. 1050 from Rs.<br />
950 per 40 kg. The reduction in price<br />
of fertilizer proved short-lived as the<br />
urea prices reverted back to the level<br />
of Rs. 1900 per bag at the end of<br />
December 2011 against Rs. 853 per<br />
bag during October 2010. The DAP<br />
prices were around Rs. 4200-4400<br />
per bag.<br />
The cotton prices remained dull at<br />
international and national levels. The<br />
Liverpool Cot Look A index price of<br />
cotton on 23 rd Dec, 2011 was 92.9<br />
cents per lb compared to 181.25<br />
cents per lb on the same date last<br />
year. The New York cotton future<br />
contract price for March 2012 on this<br />
day was 87.24 cents per lb, compared<br />
to 148.12 cents per lb on the same<br />
date last year. The lackluster in trade<br />
activity at Christmas almost around<br />
1-Jan-2012<br />
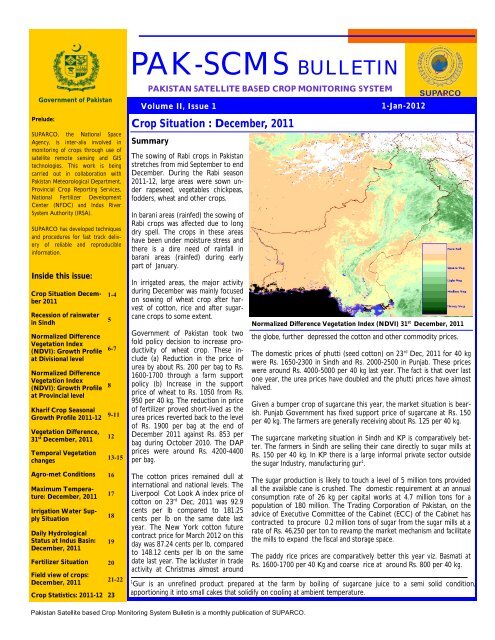
Normalized Difference Vegetation Index (NDVI) 31 st December, 2011<br />
the globe, further depressed the cotton and other commodity prices.<br />
The domestic prices of phutti (seed cotton) on 23 rd Dec, 2011 for 40 kg<br />
were Rs. 1650-2300 in Sindh and Rs. 2000-2500 in Punjab. These prices<br />
were around Rs. 4000-5000 per 40 kg last year. The fact is that over last<br />
one year, the urea prices have doubled and the phutti prices have almost<br />
halved.<br />
Given a bumper <strong>crop</strong> of sugarcane this year, the market situation is bearish.<br />
Punjab Government has fixed support price of sugarcane at Rs. 150<br />
per 40 kg. The farmers are generally receiving about Rs. 125 per 40 kg.<br />
The sugarcane marketing situation in Sindh and KP is comparatively better.<br />
The farmers in Sindh are selling their cane directly to sugar mills at<br />
Rs. 150 per 40 kg. In KP there is a large informal private sector outside<br />
the sugar Industry, manufacturing gur 1 .<br />
The sugar production is likely to touch a level of 5 million tons provided<br />
all the available cane is crushed. The domestic requirement at an annual<br />
consumption rate of 26 kg per capital works at 4.7 million tons for a<br />
population of 180 million. The Trading Corporation of <strong>Pakistan</strong>, on the<br />
advice of Executive Committee of the Cabinet (ECC) of the Cabinet has<br />
contracted to procure 0.2 million tons of sugar from the sugar mills at a<br />
rate of Rs. 46,250 per ton to revamp the market mechanism and facilitate<br />
the mills to expand the fiscal and storage space.<br />
The paddy rice prices are comparatively better this year viz. Basmati at<br />
Rs. 1600-1700 per 40 Kg and coarse rice at around Rs. 800 per 40 kg.<br />
1<br />
Gur is an unrefined product prepared at the farm by boiling of sugarcane juice to a semi solid condition,<br />
apportioning it into small cakes that solidify on cooling at ambient temperature.<br />
<strong>Pakistan</strong> Satellite based Crop Monitoring System Bulletin is a monthly publication of SUPARCO.
Page 2<br />
PAK-SCMS BULLETIN<br />
During Rabi, the water supply situation generally remained lower than last year in Punjab (-7.5 %) and Sindh (-38.7 %). The deficit was more<br />
pronounced during. October–November and the situation improved a bit in December. The situation in KP and Balochistan improved this year<br />
as water supply channels in these provinces were repaired in the aftermath of last year’s floods. The water level in reservoirs on 30 th December,<br />
2011 was slightly higher this year than last year. Tarbella was at 1472.5 ft amsl higher by 1 ft than last year and Mangla was at 1147.3 ft<br />
amsl, higher by 15.8 ft than last year. The size of area still inundated in Sindh by floods at the end of December was about 200 thousand ha.<br />
This included an agricultural area of about 90 thousand ha.<br />
Crops Situation<br />
Kharif Crops<br />
The perspective of major Kharif <strong>crop</strong>s already harvested / being harvested is as follows:<br />
Cotton Crop<br />
The size of cotton <strong>crop</strong> was assessed by SUPARCO at 12.23 million bales 2 on 7 th October, 2011. The Cotton Crop Assessment Committee<br />
(CCAC) of the Ministry of Textile on 21 st December, 2011 has come up with a size of <strong>crop</strong> at 12.598 million bales. The arrivals of cotton reported<br />
by <strong>Pakistan</strong> Cotton Ginning Association on 1 st January, 2012 are 12.032 million bales, up by 1.792 million bales over the corresponding<br />
period of last year. In Punjab, the arrivals were higher by 42.6 % and in Sindh were lower by 31.1 % mainly because of rain related damages.<br />
The statistics of cotton arrivals are as follows.<br />
The cotton prices remained low at international and national levels. The Liverpool Cot Look A index price of cotton on 23-Dec-2011 was 92.9<br />
cents per lb compared to 181.25 cents per lb on the same date last year. The New York cotton future contract price for March 2012 on this<br />
day was 87.24 cents per lb, compared to 148.12 cents per lb on the same date, last year. The future contracts on 23-Dec-2011 for May 2012<br />
delivery were at 86.99 cents per lb against 134.67 cents per lb on this date lin the preceding year.<br />
The domestic prices of cotton on 23 rd December, 2011 for 40 kg were Mirpur Khas Rs. 1650, Hyderabad Rs. 2000, Khairpur Rs. 1750 and<br />
Sukkur Rs. 2300. In rain affected areas of Sindh where cotton <strong>crop</strong> was damaged, the desperate farmers resorted to sell their commodity at<br />
one half to one third of the market price. The prices in Punjab were generally better than Sindh. The prices were Rs. 2500 in Rahim Yar Khan,<br />
Rs. 2350 in Multan, Rs. 2200 in Sahiwal and Rs. 2500 in Burewala. In overall, the cotton prices were Rs. 1650-2300 in Sindh and Rs.2000-2500<br />
in Punjab.<br />
The current trading activity in the cotton market is murky. After a stand off with spinners, <strong>Pakistan</strong> Cotton Ginners Association is trying to<br />
persuade the Government to direct the Trading Corporation of <strong>Pakistan</strong> as a second buyer for the procurement of 1 million bales of cotton. If<br />
this endeavor materializes, it will bring a bullish sentiment to the market.<br />
Rice Crop<br />
The harvesting of rice both coarse and basmati was completed in November 2011. Most of the commodity has been procured by the traders/<br />
industry for processing and export. The market prices are slightly better than last year.<br />
Sugarcane Crop<br />
1 st January Punjab Sindh Total<br />
2012 9.627 2.405 12.032<br />
2011 6.751 3.489 10.240<br />
% Change 42.6 -31.1 17.5<br />
The sugarcane production during 2011-12 has been estimated at 69.9 million 3 tons by SUPARCO. The cane has multiple uses as (i) crushing by<br />
sugar mills (ii) gur making widely prevalent in Punjab and more so in KP (iii) fodder under emergent situations, generally when formal fodder<br />
sources fail (iv) seed/wastage. There are reservations on the gur statistics as these data are not formally collected. The sugar production this<br />
year may be around 5 million tons depending upon the extent, the cane is diverted for crushing or gur making. The statistics on farm and industrial<br />
aspects of the <strong>crop</strong> are as overleaf.<br />
2<br />
SUPRACO based its estimates on standard weight of 170 kg a bale. The bank loans are linked to number of bales and not to the weight of<br />
cotton ginned. Therefore these bales are generally undersized. The <strong>crop</strong> production estimate reported by SUPARCO would equal to 13 million<br />
bales assuming a bale weight of 160 kg.<br />
3<br />
The sugarcane estimate and sugar forecast have been revised.<br />
Cotton Arrivals (million bales)-Source: PCGA
Volume II, Issue 1<br />
Page 3<br />
Sugarcane Crop Estimate and Sugar Forecast 2011-12—SUPARCO<br />
Province Area ( 000 ha ) Yield (tons per ha) Production<br />
( million tons)<br />
Percent Crushing<br />
Crushing<br />
(million tons)<br />
% Recovery Sugar production<br />
(million tons)<br />
Punjab 873.4 55.4 48.4 74.0 35.8 9.24 3.3<br />
Sindh 294.2 56.0 16.5 85.0 14.0 9.42 1.3<br />
KP 111.1 45.0 5.0 75.0 3.8 8.64 0.3<br />
<strong>Pakistan</strong> 1278.7 54.6 69.9 76.7 53.6 9.25 5.0<br />
Source: Crop Statistics by SUPARCO and the information on industrial aspects is from <strong>Pakistan</strong> Sugar Mills Association-PSMA<br />
Given a bumper <strong>crop</strong> of about 70 million tons, the market situation is generally bearish for the cane. Punjab Government has fixed support of<br />
sugarcane at Rs. 150 per 40 kg. This sector is mainly beleaguered by unscrupulous middlemen in Punjab who siphon off large profits by purchasing<br />
cane from farmers at a rate of Rs. 125 per 40 kg. In addition, discounted payments are being made to farmers, growing high weight,<br />
low sugar recovery, banned varieties. The sugarcane marketing situation in Sindh is moderately better as the province is generally free from<br />
middlemen and the farmers are selling their cane direct to sugar mills at Rs. 150 per 40 kg. Farmers generally incur a cost of Rs. 25 per 40 kg<br />
on an average, for harvesting and delivery at weigh stations. The effective procurement price is therefore lesser by the same amount and this<br />
expenditure is almost similar in all provinces. There is a large trend in KP to divert cane for gur making. The farmers are generally better off in<br />
this province to sell their commodity.<br />
Given the crushing and recovery levels of last year, the sugar production is forecast at 5 million tons. The per capita consumption of sugar is<br />
26 kg per head per year. At this rate, the consumption requirements of sugar would be 4.7 million tons. The Trading Corporation of <strong>Pakistan</strong>,<br />
on the advice of Executive Committee of the Cabinet (ECC), has contracted to procure a quantity of 0.2 million tons of sugar from the sugar<br />
mills at a rate of Rs. 46250 per ton to gear up market mechanism and to enable the mills to expand the fiscal and storage capacity. The prices<br />
of sugar have fallen down from Rs. 70-75 during October to Rs. 50 per kg in December 2011.<br />
Rabi Crops<br />
The sowing situation of Rabi <strong>crop</strong>s is as follows:<br />
Wheat Crop<br />
The sowing of rabi <strong>crop</strong>s has been completed. During the month of December, the sowing of wheat <strong>crop</strong> continued in the aftermath of harvests<br />
of cotton, rice and sugarcane <strong>crop</strong>s. There have been very scanty rains in barani areas. The situation of urea supply up to end November<br />
was not very satisfying. The urea off take was 973.2 thousand tons during October-November compared to 1306.7 thousand tons for these<br />
months during 2010. The irrigation water supply is also lower than last year, especially in Sindh to a large extent (-38.7 %) and in Punjab, at<br />
small level (-7.5%). The loss in wheat production from the inundated areas of Sindh, on account of flooding during summer, is estimated at 0.2<br />
million tons.<br />
Potato Crop<br />
Three <strong>crop</strong>s of potato are sown in <strong>Pakistan</strong> viz. autumn (80%) spring (12%) and hill <strong>crop</strong> (8%). Autumn <strong>crop</strong> is grown mainly in Punjab and to<br />
some extent in Khyber Pakhtunkhwa. In Punjab, the <strong>crop</strong> is mainly sown in Okara, Sahiwal, Pakpattan, Kasur, Chiniot, Jhelum, Lahore and<br />
Sialkot districts. The <strong>crop</strong>ping patterns of potato usually involve maize-maize-potato or rice-potato-maize rotation. The high temperature at<br />
sowing are damaging for seed tubers. The potatoes are therefore sown when soil temperatures cool down in late October. The harvesting of<br />
the <strong>crop</strong> starts in late December. At this stage of <strong>crop</strong> growth, the tuber size is by and large small and the yields are around 15- 20 tons per<br />
ha. The farmers compromise on low yield in December as commodity prices are usually high at this juncture of time. The driving forces for<br />
this rise in price are (a) low supplies of potatoes in the market as availability from cold storages normally trims off and (b) the demand for<br />
stored /sweetened potatoes shrinks as consumers prefer to buy vitamin-rich fresh produce. The harvest continues up to end February or<br />
slightly beyond depending upon ambient temperatures. This increase in <strong>crop</strong> growth period results in an increase in <strong>crop</strong> yield to around 25-<br />
30 tons per ha.<br />
SUPARCO started <strong>monitoring</strong> potato <strong>crop</strong> from the current autumn season. Multi spectral <strong>satellite</strong> imagery of medium and high resolutions<br />
from SPOT VGT, MODIS sensors on Terra, Aqua and SPOT 5 <strong>satellite</strong>s were used in this investigation. These data were used to study the<br />
phenological behavior of potato <strong>crop</strong> at various stages of growth viz. sowing, peak photosynthetic activity and at maturity. A stratified system<br />
was designed to draw random samples in the main growing districts. These sampled sites were used to collect spectral signatures during<br />
ground truthing by a team of experts in late December 2011. Vegetation analyses were carried out for vegetation index (NDVI), leaf area<br />
index and other parameters. The digital image processing and classification was carried out to estimate area sown under potato <strong>crop</strong>. The<br />
district wise statistics of potato districts visited by SUPARCO team is as overleaf.
Page 4<br />
PAK-SCMS BULLETIN<br />
The production of autumn potato <strong>crop</strong> 2011-12 is forecast at about 6 million tons.<br />
Autumn Potato Crop: 2011-12<br />
District<br />
Area<br />
(estimate)<br />
000 ha<br />
Yield<br />
(forecast )<br />
tons/ha<br />
Production<br />
(forecast )<br />
million tons<br />
Jhelum 4.46 19.3 0.086<br />
Chiniot 30.95 22.3 0.690<br />
Kasur 37.24 22.4 0.834<br />
Okara 64.57 26.8 1.730<br />
Sahiwal 32.90 22.7 0.747<br />
Pakpattan 42.97 25.8 1.109<br />
Others 31.39 24.5 0.769<br />
Punjab 244.48 24.4 5.965
Volume II, Issue 1<br />
Page 5<br />
Recession of rainwater in Sindh, December 2011<br />
The peak inundation of geographic area during the season was about 1.3 million ha. Most of inundated area receded at the end of December.<br />
On 31 st December, 2011 about 0.2 million ha area was still submerged. The production loss to wheat from the submerged area is forecast at<br />
0.15 million tons. The statistics are as follows.<br />
Inundation of Geographic Area (000ha)<br />
Districts 22 Sept 1 Oct 18 Oct 30 Oct 15 Nov 30 Nov 31 Dec<br />
Badin 358.1 347.8 193.1 159.2 121.3 97.2 48.5<br />
Dadu 78.3 62.9 22.1 16.7 12.8 11.0 3.6<br />
Hyderabad 3.9 3.6 2.2 2.0 1.6 1.6 0.8<br />
Jacobabad 72.4 68.9 11.4 9.5 7.4 6.8 2.8<br />
Jamshoro 43.4 31.1 11.6 10.0 8.5 6.9 4.6<br />
Khairpur 3.2 3.1 1.7 1.4 1.3 1.3 0.6<br />
Matiari 17.5 17.0 7.5 5.7 4.1 3.6 2.1<br />
Mirpurkhas 179.6 177.5 86.7 67.0 52.6 40.0 18.9<br />
Nausheroferoz 15.1 14.7 5.0 3.7 3.3 3.2 2.0<br />
Sanghar 247.0 236.9 154.3 125.4 109.0 93.9 61.2<br />
Shaheed<br />
Benazirabad<br />
63.6 60.3 25.6 16.3 13.1 11.9 8.2<br />
Tando Allahyar 32.3 31.3 22.3 20.1 18.9 18.1 11.4<br />
Tando Muhammad<br />
Khan<br />
29.4 28.6 9.6 8.1 6.5 6.0 2.5<br />
Tharparkar 20.7 21.2 15.7 12.0 10.2 8.1 1.9<br />
Thatta 64.5 63.0 21.4 13.6 9.9 8.6 5.0<br />
Umerkot 75.9 78.9 56.6 49.1 46.1 42.0 29.2<br />
Total 1304.9 1246.9 646.8 520.1 426.6 360.1 203.4
Page 6<br />
PAK-SCMS BULLETIN<br />
Normalized Difference Vegetation Index (NDVI): Crop Growth Profile at Divisional Level<br />
SUPARCO is continuously acquiring MODIS 250 m resolution data on daily basis and SPOT VGT data on 10 daily basis to assess <strong>crop</strong><br />
growth. SPOT-5 high resolution data are being acquired during each <strong>crop</strong>ping season to assess land surface changes in image classification.<br />
The graphs depicting temporal changes for various regions are as follows:
Volume II, Issue 1<br />
Page 7<br />
Normalized Difference Vegetation Index (NDVI): Crop Growth Profile at Divisional Level
Page 8<br />
PAK-SCMS BULLETIN<br />
Normalized Difference Vegetation Index (NDVI): Crop Growth Profile at Provincial level
Volume II, Issue 1<br />
Page 9<br />
Kharif Crop Seasonal Growth Profile 2011-12 at Divisional Level
Page 10<br />
PAK-SCMS BULLETIN<br />
Kharif Crop Seasonal Growth Profile 2011-12 at Divisional Level
Volume II, Issue 1<br />
Page 11<br />
Kharif Crop Seasonal Growth Profile 2011-12 at Provincial level
Page 12<br />
Vegetation Indices Changes in December, 2011.<br />
PAK-SCMS BULLETIN<br />
Vegetation Indices Changes in 2011 vs. 2010 during December.<br />
Satellite Imagery: SPOT VGT 1000m
Volume II, Issue 1<br />
Temporal change: Rice in Kallar Tract, Punjab<br />
Page 13<br />
Potato<br />
Potato<br />
Temporal change: Potato in Sahiwal Division, Punjab<br />
Potato<br />
Potato<br />
Potato<br />
Potato<br />
Sowing/Land preparation<br />
Active Growth<br />
Maturity<br />
Harvesting<br />
Satellite Imagery: MODIS 250m
Page 14<br />
Temporal change: Rice 2010 and 2011 in Larkana Division, Sindh<br />
PAK-SCMS BULLETIN<br />
Temporal change: Rice in the Indus delta, Sindh<br />
Inundation<br />
Inundation<br />
Temporal change: Cotton in Punjab<br />
Sowing/Land preparation<br />
Active Growth<br />
Maturity<br />
Harvesting<br />
Satellite Imagery: MODIS 250m
Volume II, Issue 1<br />
Temporal change: Cotton in Sindh<br />
Page 15<br />
Wheat<br />
Rain water<br />
recession<br />
Rain water<br />
recession<br />
Temporal Change: Sugarcane in Peshawar Valley, Khyber Pakhtunkhwa<br />
Temporal change: Rice in Pat Feeder Area of Balochistan<br />
Sowing/Land preparation<br />
Active Growth<br />
Maturity<br />
Harvesting<br />
Satellite Imagery: MODIS 250m
Page 16 Page 16<br />
Agro-Met Conditions:<br />
The agro met conditions which prevailed during the month of November are as under:<br />
a) Rainfall<br />
There was very scanty rainfall till Dec 31,2011. Minor rainfall took place in November. The rainfall statics are as follows:<br />
PAK-SCMS BULLETIN<br />
Date<br />
Rainfall<br />
06-07 Oct<br />
Islamabad 23 mm, D G Khan 17 mm, Kamra 13 mm, Muzafarabad 25 mm, Hunza 16 mm, Bannu 29 mm, Kohat 46<br />
mm, Malam Jaba 23 mm, Parachinar 61mm<br />
Bhakkar 23 mm, Chakwal 11 mm, Jhelum 11.7 mm, Mianwali 40 mm, Kamra 28 mm, Murree 40 mm, Gar Dopata 79<br />
23-24 Oct mm, Pattan 45 mm, Muzafarabad 27 mm, Bannu 10 mm, Kohat 24 mm, Malam Jaba 52 mm, DIR 76 mm, Parachinar<br />
72 mm<br />
01-05 Nov<br />
Chakwal 3.4 mm, Kamra 5 mm, Murree 12 mm, Muzafar abad 28 mm, Pattan 68 mm, Dir 51 mm, Kalam 48 mm,<br />
Parachinar 78 mm, Peshawar 13 mm, Gawadar 25 mm, Jawani 36 mm, Pasni 16 mm, Ormara 9 mm,<br />
Bhakkar 5 mm, Chakwal 2 mm, Islamabad 8 mm, Mianwali 10 mm, Murree 9 mm, Muzafar abad 11 mm, Pattan 10<br />
08-11 Nov mm, Sakardu 11 mm, Dir 11 mm, Kalam 15 mm, Malam Jaba 22 mm, Parachinar 49 mm, Peshawar 14 mm, Kalat 10<br />
mm, Ormara 8 mm, Smungli 18 mm, Quetta 21 mm<br />
09- Dec Rawalkot 10 mm, Chilas 6 mm, Gari Dopatta 6 mm<br />
21- Dec Pattan 19 mm, Malam Jabba 12 mm, Balakot 13 mm<br />
b) Temperature<br />
The average maximum temperatures during December 2011 were higher by 1-2 degree centigrade than December 2010.<br />
Monthly Cumulative Precipitation:<br />
December 2011<br />
December 2010<br />
Monthly Temperature: December, 2011<br />
Maximum Temperature<br />
Minimum Temperature
Volume II, Issue 1<br />
Page 17<br />
Maximum Temperature: December, 2011<br />
The ranges of maximum temperatures during December 2011 were as follows:
Page 18 Volume II, Issue 1<br />
Irrigation Water Supply Situation :<br />
In Rabi season, the sowing of <strong>crop</strong>s is mainly carried out during October-Dec period. The water supplies in Punjab and Sindh were generally<br />
lower than last year. IRSA has explained that low supplies are based on the indents given by the provinces. It appears that these plans are to<br />
conserve water for the stressful period of Rabi <strong>crop</strong> viz. of Jan-Feb in Sindh and Feb-Mar in Punjab.<br />
Rabi 2011-12<br />
Month<br />
Oct<br />
Nov<br />
Dec<br />
Total<br />
Year<br />
Jhelum-<br />
Chenab<br />
Punjab<br />
Indus<br />
Total<br />
Sindh KP Balochistan Total<br />
Million Acre Feet<br />
2011 2.476 2.135 4.612 1.916 0.150 0.164 6.842<br />
2010 2.624 2.430 5.054 3.833 0.021 0.094 9.001<br />
% change -5.62 -12.12 -8.75 -50.01 618.10 74.89 -23.99<br />
2011 2.035 1.549 3.584 1.636 0.097 0.208 5.526<br />
2010 2.049 1.732 3.781 2.803 0.123 0.149 6.855<br />
% change -0.68 -10.54 -5.19 -41.61 -20.97 40.00 -19.39<br />
2011 1.802 1.370 3.171 2.128 0.105 0.224 5.629<br />
2010 1.742 1.300 3.043 2.628 0.129 0.183 5.983<br />
% change 3.40 5.34 4.23 -19.02 -18.18 22.40 -5.91<br />
2011 6.313 5.054 11.367 5.681 0.352 0.597 17.997<br />
2010 6.415 5.462 11.877 9.263 0.273 0.426 21.839<br />
% change -1.59 -7.46 -4.29 -38.68 29.18 40.13 -17.59
Volume II, Issue 1<br />
Daily Hydrological Status at Indus Basin: December, 2011<br />
The inflows at RIM stations at Indus and other rivers are as follows:<br />
DECEMBER 2011: Daily River Water Inflow (000 cusecs)<br />
Indus at Indus at Indus at Jhelum at Chenab at<br />
Day Tarbela Chashma Taunsa Mangla Marala<br />
Kabul at<br />
Nowshera<br />
1 25.9 65.2 62.4 10.2 5.9 7.3<br />
2 25.3 60.2 61.3 7.8 5.9 7.4<br />
3 24.2 57.1 61.3 7.8 5.9 7.6<br />
7 24.2 54.3 53.4 9.9 5.9 6.7<br />
8 19.0 52.3 53.4 5.9 6.4 6.7<br />
9 23.2 65.5 50.8 8.1 6.4 7.0<br />
10 22.7 45.5 50.5 8.1 7.4 7.0<br />
12 23.0 50.6 48.0 10.3 6.6 7.3<br />
13 20.9 53.2 48.0 7.0 6.1 6.5<br />
14 19.5 48.6 47.7 8.2 5.9 6.1<br />
15 20.4 45.8 47.2 9.0 6.6 5.7<br />
16 19.6 44.3 47.0 9.0 5.9 5.5<br />
17 20.9 49.5 45.4 9.0 5.9 6.5<br />
19 20.0 42.9 40.1 7.0 6.2 5.7<br />
20 18.9 33.8 40.1 7.0 6.2 5.4<br />
21 19.6 33.4 39.9 7.0 5.9 6.2<br />
22 19.6 34.8 38.9 7.0 5.9 6.6<br />
23 19.7 35.6 37.4 10.0 5.9 6.0<br />
24 20.0 34.4 36.9 9.6 5.9 5.6<br />
26 18.7 33.6 34.0 9.4 6.1 6.4<br />
27 17.2 21.0 31.6 6.5 6.7 5.6<br />
28 17.6 22.5 29.7 6.5 5.7 27.4<br />
29 17.8 22.8 27.1 7.3 5.7 23.7<br />
30 18.3 21.3 23.9 6.4 5.7 21.8<br />
31 18.6 21.3 35.2 6.45 5.4 5.2<br />
Condition No Flood No Flood No Flood No Flood No Flood No Flood<br />
Page 19<br />
The water level in Tarbela at the end of December was 1472.5 feet above mean sea level (amsl) and Mangla was at 1147.3 feet (amsl).<br />
Reservoir<br />
Reservoir Level (feet) above mean sea Level on the date of<br />
Full Reservoir<br />
1-Dec 13-Dec 21-Dec 30-Dec<br />
Level<br />
2011 2010 2011 2010 2011 2010 2011 2010<br />
Tarbela 1502.8 1499.1 1483.6 1288.2 1475.3 1477.0 1472.5 1471.5 1550.0<br />
Mangla 1173.0 1159.3 1160.5 1149.6 1151.8 1137.8 1147.3 1131.5 1210.0<br />
Source: Punjab Irrigation Department, Lahore
Page 20<br />
PAK-SCMS BULLETIN<br />
Fertilizer Situation:<br />
The statistics released by National fertilizer Development Center of Planning Commission indicate an opening inventory of urea for Rabi at 163<br />
thousand tons. The imports are estimated at 823 thousand tons. The domestic production is 2316 thousand tons. The total availability of urea<br />
during Rabi 2011-12 is likely to be 3302 thousand tons. There is a high probability of additional imports of 200 thousand tons of urea under<br />
SABIC (Saudi Arabian Basic Industries Corporation ) funding mechanism. The prices of urea eased somewhat to Rs. 1600 per bag during early<br />
December due to Government’s farm support policy. However the effort to bring a resilience to urea prices did not work well and the commodity<br />
prices increased to Rs. 1900 per bag towards the end of December 2011. The urea prices were Rs. 853 per bag in October 2010.<br />
The Opening inventory of DAP for Rabi 2011-12 was 224 thousand tons. The total availability of DAP would be 829 thousand tons, which interalia<br />
comprises 296 thousand tons of imports and 309 thousand tons of domestic production. The demand of DAP for Rabi season 2011-12<br />
is 723 thousand tons. The price of DAP were at Rs. 4200 to 4400 per bag during December 2011.<br />
The fertilizer off take during rabi 2011-12 showed a dismal look. The fertilizer situation off take during initial months of rabi season viz. October<br />
and November 2011 was 742 .0 thousand tons compared to 1066.3 thousand tons last year, a decrease of 30.4 %. The decrease in off take<br />
of nitrogen (N) was 27.3 %, phosphate 37.6 % and potash 48.8 %. The reasons for these short falls include (a) a quantum jump in price of urea<br />
(b) levying of GST on fertilize (c ) Lower domestic production during owing to gas load shedding to fertilizer manufacturing plants (d) Low<br />
farm liquidity owing to depressed phutti prices and problem in payments of cane dues by sugar mills.<br />
Month<br />
Source: National Fertilizer Development Center<br />
*P= Provisional assumed at the level of last year<br />
2011-12 2010-11 % Change<br />
Nitrogen Phosphate Potash Total Nitrogen Phosphate Potash Total<br />
(000 tons)<br />
Nitrogen Phosphate Potash Total<br />
October 287.3 106.7 2.8 396.8 286.5 205 5.6 497.1 0.3 -48.0 -50.0 -20.2<br />
November 258.9 84.7 1.5 345.1 464.7 101.6 2.9 569.2 -44.3 -16.6 -48.3 -39.4<br />
December(P) 364 65.3 1.2 430.5 333.5 58.4 3.3 395.2 9.1 11.8 -63.6 8.9<br />
Total 910.2 256.7 5.5 1172.4 1084.7 365 11.8 1461.5 -16.1 -29.7 -53.4 -19.8
Volume II, Issue 1<br />
Page 21<br />
Field view of <strong>crop</strong>s: December, 2011<br />
Sugarcane <strong>crop</strong> standing at Chiniot<br />
Wheat at Chiniot<br />
Potato field at Chiniot<br />
Barseem growing as fodder <strong>crop</strong><br />
Wilting Potato field at Chiniot<br />
Wilting in Potato plant<br />
Potato harvesting at Chiniot<br />
Potato harvesting at Chiniot<br />
Guava field at Chiniot<br />
Guava Packing and <strong>Market</strong>ing<br />
Sweet peas at Chiniot<br />
Sweet peas at fruiting
Page 22<br />
PAK-SCMS BULLETIN<br />
Field view of <strong>crop</strong>s: December, 2011<br />
Newly Emerging Potato <strong>crop</strong> at Sahiwal<br />
Healthy Potato field at Sahiwal<br />
Harvested Sugarcane waiting for crushing at<br />
ITFAQ Sugar mill at Sahiwal<br />
Off season cultivation of Cucurbits<br />
Standing Cotton <strong>crop</strong> at Sahiwal<br />
Sugarcane harvesting at Pakpattan<br />
Hybrid of Apple Gourd at Pakpattan<br />
Hybrid of Apple Gourd at Pakpattan<br />
Wheat emergence at Pind Dadan Khan<br />
Canola at flowering Pind Dadan Khan<br />
Onion filed at Pind Dadan Khan<br />
Potato harvested at Pind Dadan Khan
Page 23<br />
PAK-SCMS BULLETIN<br />
Crop Statistics: 2011-12<br />
NEWS/UPCOMING<br />
EVENTS:<br />
The area estimate and forecast for potato yield and production worked by SUPARCO are as follows:<br />
Province<br />
Potato: Autumn Crop ,2011-12<br />
Area<br />
(estimate)<br />
000 ha<br />
Yield<br />
(forecast )<br />
tons/ha<br />
Punjab 244.48 24.4 5.965<br />
Khyber<br />
Pakhtunkhwa<br />
Production<br />
(forecast)<br />
million tons<br />
8.95 14.0 0.126<br />
Total 253.43 24.0 6.091<br />
Agriculture News<br />
TCP to buy 0.2 million tons of sugar<br />
TCP has finalized a deal to buy 0.2 million tons of sugar. Two bidders Hussain Sugar<br />
mill and Sheiko Sugar mills, quoted the lowest bid of Rs 46,250 per ton. TCP has<br />
offered other bidders to match the lowest .The ECC of the Cabinet has asked the<br />
TCP to assess the reasonability of sugar price offered by the sugar mills in response<br />
to tender opened on 23 rd Dec, 2011.<br />
Saudi Arabia signs 2 accords worth USD 172m<br />
Saudi Arabia will provide two soft loans worth USD 172 million for construction of<br />
infrastructure for Malakand, region and import of urea fertilizer. This was announced<br />
during a signing ceremony of the two agreements worth USD 172 million<br />
on 29 th Dec, 2011.<br />
The first agreement is a soft loan worth USD 72 million allocated for improving<br />
infrastructure in Malakand, North / South Waziristan and Bajaur and to increase the<br />
agricultural productivity. The amount will also be used to develop the educational<br />
standards in these areas while the health sector would also be promoted.<br />
The second loan agreement is worth USD 100 million for import of urea to be<br />
used during Rabi season that will benefit the agriculture sector. It will assist to produce<br />
additional <strong>crop</strong>s including food and others.<br />
<strong>Pakistan</strong> Space & Upper Atmosphere Research Commission<br />
SPARCENT, Islamabad, Main Islamabad Highway 44000, Islamabad, <strong>Pakistan</strong><br />
Tel.: (+92) 51 4611792<br />
Fax: (+92) 51 4611796<br />
E-mail: sgs@ suparco.net.pk<br />
http://www.suparco.gov.pk