Flux Analysis Uncovers Key Role of Functional Redundancy in ...
Flux Analysis Uncovers Key Role of Functional Redundancy in ...
Flux Analysis Uncovers Key Role of Functional Redundancy in ...

Create successful ePaper yourself
Turn your PDF publications into a flip-book with our unique Google optimized e-Paper software.
<strong>Flux</strong> <strong>Analysis</strong> <strong>of</strong> Redundant Modules<br />
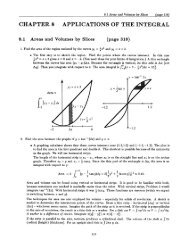
Figure 3. Change <strong>in</strong> Ratio <strong>of</strong> <strong>Flux</strong> through Long Versus Direct Methylene-H 4 F Formation Routes dur<strong>in</strong>g Growth Transitions<br />
(A) Experimental data as determ<strong>in</strong>ed by GC–MS analysis <strong>of</strong> ser<strong>in</strong>e isotopomers. The bars for each transition represent a time series from cells<br />
harvested 1 h prior to the transition, and four time po<strong>in</strong>ts follow<strong>in</strong>g the transition (succ<strong>in</strong>ate to methanol: 1, 5, 7.5, and 10 h; methanol to<br />
succ<strong>in</strong>ate: 1, 3, 5, and 7 h).<br />
(B) Predictions based on k<strong>in</strong>etic model simulations. The bars <strong>in</strong>dicate the succ<strong>in</strong>ate to methanol transition (same time po<strong>in</strong>ts as for the<br />
experimental data) and the methanol steady-state prediction.<br />
DOI: 10.1371/journal.pbio.0030016.g003<br />
methanol, the majority <strong>of</strong> methylene-H 4 F assimilated via the<br />
ser<strong>in</strong>e cycle is generated via the proposed long route. In<br />
contrast, CD 3 OD label<strong>in</strong>g <strong>of</strong> mid-exponential-phase methanol-grown<br />
cells <strong>in</strong>dicated that the direct route dom<strong>in</strong>ated by<br />
up to 15-fold (measured ratio <strong>of</strong> [þ1]/[þ2] <strong>of</strong> 0.065 6 0.006).<br />
Therefore, although both methylene-H 4 F production routes<br />
operated under both physiological conditions, a significant<br />
shift <strong>in</strong> the ratio <strong>of</strong> the two routes occurred, up to 100-fold.<br />
Relative Contributions <strong>of</strong> the Long and Direct Routes <strong>of</strong><br />
Methylene-H 4 F Formation dur<strong>in</strong>g Transitions to and from<br />
Methylotrophic Growth<br />
In order to understand the dynamics <strong>of</strong> the contribution <strong>of</strong><br />
the long and direct routes for direct<strong>in</strong>g C 1 units <strong>in</strong>to<br />
assimilatory metabolism dur<strong>in</strong>g transitions to and from<br />
methylotrophic growth, metabolic shift experiments were<br />
performed. One hour after samples were removed from<br />
succ<strong>in</strong>ate- and methanol-grown cultures for the label<strong>in</strong>g<br />
experiments described above, the rema<strong>in</strong><strong>in</strong>g portions <strong>of</strong> the<br />
two cultures were harvested, washed, and resuspended <strong>in</strong>to<br />
medium conta<strong>in</strong><strong>in</strong>g the other substrate (methanol or succ<strong>in</strong>ate,<br />
respectively). At four <strong>in</strong>tervals dur<strong>in</strong>g the transition to<br />
each <strong>of</strong> the new growth substrates (Figure 3) samples were<br />
harvested and analyzed via CD 3 OD label<strong>in</strong>g to determ<strong>in</strong>e the<br />
ratio <strong>of</strong> flux capacity through the two methylene-H 4 F<br />
formation routes. The ratio <strong>of</strong> the contribution <strong>of</strong> the long<br />
route for methylene-H 4 F formation to the direct route varied<br />
<strong>in</strong> a cont<strong>in</strong>uous fashion dur<strong>in</strong>g the transition from succ<strong>in</strong>ate<br />
Table 1. Calculated C 1 <strong>Flux</strong>es dur<strong>in</strong>g Transitions between Succ<strong>in</strong>ate and Methanol at the Time (h) Relative to the Transition<br />
Transition Branch <strong>Flux</strong><br />
1 1 5/3 a 7.5/5 a 10/7 a<br />
Succ<strong>in</strong>ate to methanol A 1.9 6 0.1 3.7 6 0.1 13.2 6 1.0 14.5 6 1.0 19.2 6 0.2<br />
B 1.9 6 0.1 3.6 6 0.1 11.4 6 0.8 11.8 6 0.9 15.3 6 0.2<br />
C 1.6 6 0.1 3.3 6 0.1 9.7 6 1.2 10.3 6 1.0 14.2 6 0.2<br />
D 1.6 6 0.1 3.1 6 0.1 8.6 6 1.2 8.9 6 1.0 12.6 6 0.2<br />
E 0.2 6 ,0.1 0.4 6 ,0.1 1.7 6 0.4 1.5 6 0.2 1.1 6 0.1<br />
F ,0.1 6 ,0.1 0.1 6 ,0.1 1.7 6 0.2 2.7 6 0.2 3.9 6 0.2<br />
G 0.2 6 ,0.1 0.5 6 ,0.1 3.5 6 0.2 4.3 6 ,0.1 5.0 6 0.1<br />
H 0.1 6 ,0.1 0.2 6 ,0.1 1.1 6 ,0.1 1.3 6 ,0.1 1.6 6 ,0.1<br />
I ,0.1 6 ,0.1 0.1 6 ,0.1 0.6 6 ,0.1 0.8 6 ,0.1 0.9 6 ,0.1<br />
J 0.3 6 ,0.1 0.7 6 ,0.1 5.2 6 0.2 6.4 6 ,0.1 7.5 6 0.2<br />
Methanol to succ<strong>in</strong>ate A 20.6 6 1.0 10.2 6 1.3 9.1 6 0.6 7.5 6 0.4 4.8 6 0.3<br />
B 13.9 6 0.9 6.4 6 0.7 6.4 6 0.8 5.8 6 0.6 4.3 6 0.3<br />
C 13.5 6 0.9 5.6 6 0.6 5.5 6 0.5 4.4 6 0.5 3.5 6 0.3<br />
D 11.3 6 0.9 4.2 6 0.4 4.3 6 0.5 3.5 6 0.5 3.1 6 0.3<br />
E 0.4 6 ,0.1 0.7 6 0.1 1.0 6 0.3 1.4 6 0.2 0.8 6 ,0.1<br />
F 6.6 6 0.1 3.9 6 0.7 2.7 6 0.3 1.7 6 0.2 0.5 6 ,0.1<br />
G 7.0 6 0.1 4.6 6 0.7 3.7 6 0.1 3.0 6 0.1 1.3 6 0.1<br />
H 2.2 6 ,0.1 1.5 6 0.2 1.2 6 ,0.1 1.0 6 ,0.1 0.4 6 ,0.1<br />
I 1.3 6 ,0.1 0.8 6 0.1 0.7 6 ,0.1 0.6 6 ,0.1 0.2 6 ,0.1<br />
J 10.6 6 0.2 6.9 6 1.1 5.5 6 0.1 4.6 6 0.1 1.9 6 0.1<br />
All values are reported <strong>in</strong> nmol, m<strong>in</strong> 1 ,mL 1 , and OD 1 600 .<br />
a<br />
First number represents flux for succ<strong>in</strong>ate to methanol; second number represents flux for methanol to succ<strong>in</strong>ate.<br />
DOI: 10.1371/journal.pbio.0030016.t001<br />
PLoS Biology | www.plosbiology.org 0247 February 2005 | Volume 3 | Issue 2 | e16