2005 Proceedings - ElasticityConference.org
2005 Proceedings - ElasticityConference.org
2005 Proceedings - ElasticityConference.org

You also want an ePaper? Increase the reach of your titles
YUMPU automatically turns print PDFs into web optimized ePapers that Google loves.
©<br />
PROCEEDINGS<br />
of the<br />
Fourth International Conference<br />
on the Ultrasonic Measurement and Imaging<br />
of Tissue Elasticity ©<br />
Lake Travis, Austin, Texas, USA<br />
October 16 – 19, <strong>2005</strong>
PROCEEDINGS<br />
of the<br />
Fourth International Conference<br />
on the Ultrasonic Measurement and Imaging<br />
of Tissue Elasticity ©<br />
Lake Travis, Austin, Texas, USA<br />
October 16–19, <strong>2005</strong><br />
Table of Contents<br />
Foreword.........................................................................3<br />
Program ..........................................................................4<br />
Conference-At-A-Glance ..............................................4<br />
Program by Date and Time ..........................................5<br />
Author Index.................................................................21<br />
Abstracts ......................................................................23<br />
Guest Lecture ...........................................................23<br />
Session TUT..............................................................24<br />
Session POS..............................................................26<br />
Session MIP-1 ...........................................................55<br />
Session FIP-1 ............................................................62<br />
Session CVE .............................................................67<br />
Session MMA ............................................................74<br />
Session SIP-1 ............................................................78<br />
Session CAA-1 ..........................................................83<br />
Session BTM .............................................................88<br />
Session MMT ............................................................91<br />
Session MIP-2 ...........................................................97<br />
Session PTO............................................................ 105<br />
Session INS............................................................. 108<br />
Session SIP-2 .......................................................... 111<br />
Session FIP-2 .......................................................... 115<br />
Session CAA-2 ........................................................ 120<br />
Session MPT ........................................................... 126<br />
Session MIP-3 ......................................................... 133<br />
Lakeway Inn Floor Plan ............................................... 140<br />
Conference Evaluation and Questionnaire ................... 141<br />
QUESTIONS OR COMMENTS ARE WELCOME AT ANY TIME AT <br />
Copyright © <strong>2005</strong> International Conference on the Ultrasonic Measurement and Imaging of Tissue Elasticity© All Rights Reserved<br />
Some abstracts may have been edited by the reviewers for clarity of presentation.
©<br />
Fifth International Conference<br />
on the Ultrasonic Measurement and Imaging<br />
of Tissue Elasticity ©<br />
Snowbird, Utah, USA<br />
October 8 – 11, 2006<br />
2
FOREWORD<br />
Dear Conference Delegate:<br />
Welcome to the Fourth International Conference on the Ultrasonic Measurement and Imaging of<br />
Tissue Elasticity © .<br />
The international participation in this Conference is reflected by delegates from some 20 countries.<br />
This year we are continuing to experience a phenomenal growth in the number of abstracts<br />
submitted to the Conference as compared to last year; over the last three years since the first<br />
Conference, the number of accepted abstracts has increased by some 65%, bringing the total<br />
number of abstracts this year to 118. While we were gratified at this continually increasing level of<br />
participation, it has created some necessary compromises in the Conference program. We are also<br />
seeing a steady increase in the number of clinical papers presented at the Conference, as well as the<br />
participation of more research groups from related disciplines and from Industry. We are especially<br />
gratified to see an ever-increasing number of students who are participating in the Conference.<br />
Last year’s Conference feedback was unanimous in the desire for continuation of the tutorial series.<br />
We are pleased that Drs. Joyce McLaughlin (US) and Paul Barbone (US) have jointly agreed to<br />
present this year’s exciting tutorial on Inverse Methods for Shear Stiffness Imaging on Sunday<br />
afternoon. This year we have changed the format of the opening of the Poster Session, where each<br />
presenter will have the opportunity to give a brief oral summary of his/her poster, and we thank Dr.<br />
Jeff Bamber (UK) for his enthusiastic <strong>org</strong>anization of this event.<br />
We welcome Dr. Youseph Yazdi (US), Corporate Director of Science and Technology in the Johnson<br />
& Johnson Corporate Office of Science and Technology (COSAT), who has graciously agreed to<br />
deliver our dinner lecture on Monday night. He will share with us his experience and insights<br />
through his lecture “Lessons from the World of Medical Device Commercialization”, which will surely<br />
be of great of interest to all those who are working to create new technologies. Dr. Yazdi looks for<br />
new scientific breakthroughs that will lead to the medical devices of tomorrow. His technology<br />
focuses on MEMS, nanotech, neurotech, energy-based therapeutics and imaging.<br />
We would like to thank all the delegates, the reviewers and the session chairs for their continuing<br />
support of the Conference. Special thanks are in order to our enthusiastic support staff that has<br />
worked above and beyond in the face of adversity brought upon by Hurricane Rita last September.<br />
Ms Manette Price (US) of the Conference Secretariat’s office has spent much time and effort handling<br />
most of the Conference <strong>org</strong>anizational duties, correspondence and budgets; Ms Karen Ophir (US)<br />
volunteered to design and create all the Conference artwork and publications including the<br />
Conference <strong>Proceedings</strong>; Ms Betsy Christiansen (US) has updated and greatly improved the<br />
Conference website. Mr. Dario Sosa Cabrera from University of Las Palmas de Gran Canaria, in the<br />
Canary Islands, Spain, has kindly agreed to contribute his musical talents for your enjoyment<br />
during the Conference Dinner.<br />
This Conference is conducted under the joint auspices of the University of Rochester Center for<br />
Biomedical Ultrasound and the Ultrasonics Laboratory in the Department of Diagnostic and<br />
Interventional Imaging at the University of Texas Medical School at Houston. However, all funding<br />
for the Conference is derived from registration fees alone. With your continued support in abstract<br />
submissions and attendance, we hope to continue to improve and expand the Conference in the<br />
years to come.<br />
We believe that you will enjoy this year’s scientific program as well as the city and countryside of<br />
Austin and Lake Travis. We will be looking forward to seeing you again at next year’s Fifth<br />
Anniversary Conference at the Snowbird Ski and Summer Resort in the Wasatch Mountains of Utah<br />
(www.snowbird.com)!<br />
J. Ophir and K.J. Parker<br />
Conference Organizers<br />
October 16, <strong>2005</strong><br />
3
4<br />
CONFERENCE–AT–A–GLANCE<br />
Fourth International Conference on the Ultrasonic Measurement and Imaging of Tissue Elasticity ©<br />
Lakeway Inn Conference Resort – Lake Travis, Austin, Texas, USA<br />
October 16–19, <strong>2005</strong><br />
Sunday, October 16 10:00A – 7:30P<br />
10:00A – 7:30P Registration Desk & Conference Office Open Rio Grande Foyer<br />
12:00P – 7:30P Session EEX: Equipment Exhibit (during breaks) Rio Grande II<br />
1:00P – 3:00P Session TUT: Tutorial: Inverse Methods for Shear Stiffness Imaging Rio Grande II<br />
3:00P – 3:30P Coffee Break Rio Grande Foyer<br />
3:30P – 5:30P Session POS: Poster Session – Live Oral Presentations Rio Grande I<br />
5:30P – 7:30P Opening Reception (<strong>Proceedings</strong> Book Signing) Rio Grande I & II<br />
Monday, October 17 7:00A – 10:30P<br />
7:00A – 8:00A Group Continental Breakfast Rio Grande Foyer<br />
7:00A – 5:30P Registration Desk & Conference Office Open Rio Grande Foyer<br />
8:00A – 5:30P Session POS: Posters Rio Grande II<br />
8:00A – 5:30P Session EEX: Equipment Exhibit Rio Grande II<br />
7:45A – 8:00A Opening Remarks Rio Grande I<br />
8:00A – 9:45A Session MIP-1: Methods for Imaging Elastic Tissue Properties – I Rio Grande I<br />
9:45A – 10:15A Coffee Break Rio Grande Foyer<br />
10:15A – 11:30A Session FIP-1: Forward and Inverse Problems – I Rio Grande I<br />
11:30A – 1:00P Group Lunch Travis Restaurant<br />
1:00P – 2:45P Session CVE: Cardiovascular Elasticity Rio Grande I<br />
2:45P – 3:15P Coffee Break Rio Grande Foyer<br />
3:15P – 4:15P Session MMA: 3D, Multi-Modality & Alternative Applications Rio Grande I<br />
4:15P – 5:30P Session SIP-1: Signal and Image Processing – I Rio Grande I<br />
5:30P – 7:30P No Conference Activities<br />
7:30P – 10:30P Conference Dinner, Guest Speaker – Youseph Yazdi Rio Grande I<br />
(<strong>Proceedings</strong> Book Signing)<br />
Tuesday, October 18 7:00A – 5:30P<br />
7:00A – 8:00A Group Continental Breakfast Rio Grande Foyer<br />
7:00A – 5:30P Registration Desk & Conference Office Open Rio Grande Foyer<br />
8:00A – 5:30P Session POS: Posters Rio Grande II<br />
8:00A – 5:30P Session EEX: Equipment Exhibit Rio Grande II<br />
8:00A – 9:15A Session CAA-1: Clinical and Animal Applications – I Rio Grande I<br />
9:15A – 10:00A Session BTM: Biomechanical Tissue Modeling Rio Grande I<br />
10:00A – 10:30A Coffee Break Rio Grande Foyer<br />
10:30A – 12:00P Session MMT: Mechanical Measurement Techniques for Tissues Rio Grande I<br />
12:00P – 1:30P Group Lunch Travis Restaurant<br />
1:30P – 3:30P Session MIP-2: Methods for Imaging Elastic Tissue Properties – II Rio Grande I<br />
3:30P – 4:00P Coffee Break Rio Grande Foyer<br />
4:00P – 4:45P Session PTO: Phantoms and Test Objects Rio Grande I<br />
4:45P – 5:30P Session INS: Instrumentation Rio Grande I<br />
Wednesday, October 19 7:00A – 9:30P<br />
7:00A – 8:00A Group Continental Breakfast Rio Grande Foyer<br />
7:00A – 4:00P Registration Desk & Conference Office Open Rio Grande Foyer<br />
8:00A – 4:00P Session POS: Posters Rio Grande II<br />
8:00A – 4:00P Session EEX: Equipment Exhibit Rio Grande II<br />
8:00A – 9:00A Session SIP-2: Signal and Image Processing – II Rio Grande I<br />
9:00A – 10:15A Session FIP-2: Forward and Inverse Problems – II Rio Grande I<br />
10:15A – 10:45A Coffee Break Rio Grande Foyer<br />
10:45A – 12:15P Session CAA-2: Clinical and Animal Applications – II Rio Grande I<br />
12:15P – 1:45P Group Lunch Travis Restaurant<br />
1:45P – 3:30P Session MPT: Mechanical Properties of Tissues Rio Grande I<br />
3:30P – 4:00P Coffee Break Rio Grande Foyer<br />
4:00P – 5:30P Session MIP-3: Methods for Imaging Elastic Tissue Properties – III Rio Grande I<br />
5:30P – 6:30P No Conference Activities<br />
6:30P – 9:30P Open House to be announced
PROGRAM<br />
Fourth International Conference<br />
on the Ultrasonic Measurement and Imaging<br />
of Tissue Elasticity ©<br />
Lake Travis, Austin, Texas, USA<br />
October 16–19, <strong>2005</strong><br />
Sunday, October 16 10:00A – 7:30P<br />
10:00A – 7:30P<br />
Registration Desk & Conference Office Open<br />
12:00P – 1:00P 3:00P – 3:30P 5:30P – 7:30P<br />
Session EEX: Equipment Exhibit<br />
Rio Grande Foyer<br />
Rio Grande II<br />
Sunday 1:00P – 3:00P<br />
Session TUT: Tutorial: Inverse Methods for Shear Stiffness Imaging<br />
Chair: JB Weaver, USA Co-Chair: MM Doyley, USA Rio Grande II<br />
1:00P – 1:45P<br />
117 IMAGING SHEAR STIFFNESS TISSUE PROPERTIES USING INVERSE METHODS WHEN<br />
MEASUREMENTS ARE TIME DEPENDENT.<br />
JR McLaughlin 1 .<br />
1 Rensselaer Polytechnic Institute, Troy, NY, USA.<br />
1:45P – 2:00P Discussion<br />
2:00P – 2:45P<br />
116 INFERRING BIOMECHANICAL PROPERTIES FROM QUASISTATIC DEFORMATIONS: AN<br />
INTRODUCTION TO ASSOCIATED INVERSE PROBLEMS.<br />
PE Barbone 1 .<br />
1 Boston University, Boston, MA 02215, USA.<br />
2:45P – 3:00P Discussion<br />
3:00P – 3:30P<br />
COFFEE BREAK<br />
Rio Grande Foyer<br />
Sunday 3:30P – 5:30P<br />
(Posters will be open for viewing and Coffee Break Discussion through Wednesday, October 19, 4:00P)<br />
Session POS: Poster Session – Live Oral Presentations<br />
Chair: J Bamber, UK Co-Chair: TA Krouskop, USA Rio Grande I<br />
3:30P – 3:32P<br />
006 3D SIMULATION MODELS FOR ULTRASOUND ELASTOGRAPHY.<br />
AV Patil 1,2 , TA Krouskop 3 , J Ophir 1,2 , S Srinivasan 2,4 .<br />
1 University of Houston, Houston, TX, USA; 2 University of Texas Medical School, Houston, TX, USA;<br />
3 Baylor College of Medicine, Houston, TX, USA; 4 Siemens Acuson Ultrasound, Mountain View, CA, USA.<br />
(Session POS continues on next page)<br />
<br />
indicates Presenter<br />
5
3:32P – 3:34P<br />
012 PRELIMINARY RESULTS OF ELASTICITY IMAGING TO AORTIC PLAQUE.<br />
T Osaka 1 , T Matsumura 1 , T Mitake 1 , S Nakatani 2 , T Shiina 3 .<br />
1 Hitachi Medical Corporation, Chiba, JAPAN; 2 National Cardiovascular Center, Osaka, JAPAN;<br />
3 University of Tsukuba, Ibaraki, JAPAN.<br />
3:34P – 3:36P<br />
016 TWO-STEP CROSS-CORRELATION METHOD TO IMPROVE IMAGE QUALITY IN ELASTOGRAPHY.<br />
H Chen 1 , H Shi 2 , T Varghese 2,3 .<br />
1,2,3 University of Wisconsin-Madison, Madison, WI, USA.<br />
3:36P – 3:38P<br />
021 REGULARIZATION ISSUES IN YOUNG’S MODULUS RECONSTRUCTION.<br />
J Jiang 1 , T J Hall 1 .<br />
1 University of Wisconsin-Madison, Madison, WI, USA.<br />
3:38P – 3:40P<br />
022 SIGNIFICANT CLINICAL RESULTS IN THE DIAGNOSIS OF BREAST LESION BY MEANS OF<br />
REAL-TIME ELASTOGRAPHY.<br />
A Thomas 1 , S Kümmel 1 , H Frey 3 , G Kristiansen 1 , T Fischer 1 .<br />
1 Charité – CCM, University Berlin, Berlin, GERMANY; 2 Hitachi Medical Systems, Wiesbaden, GERMANY.<br />
3:40P – 3:42P<br />
028 SONOELASTOGRAPHY OF THE TESTICLES: PRELIMINARY RESULTS IN THE DIAGNOSIS OF<br />
DIFFERENT PATHOLOGICAL PROCESSES.<br />
L Pallwein 1 , E Pallwein 1 , M Schurich 1 , V Fischbach 1 , H Steiner 2 , F Frauscher 1 .<br />
1,2 Medical University, Innsbruck, AUSTRIA.<br />
3:42P – 3:44P<br />
040 SIMULATION STUDY OF RECONSTRUCTION OF SHEAR MODULUS, DENSITY, POISSON’S RATIO<br />
DISTRIBUTIONS – 2 nd REPORT.<br />
C Sumi 1 .<br />
1 Sophia University, Tokyo, JAPAN.<br />
3:44P – 3:46P<br />
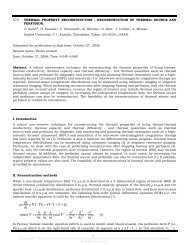
042 THERMAL PROPERTIES RECONSTRUCTION BASED ON TEMPERATURE MEASUREMENT – 2 nd REPORT.<br />
C Sumi 1 .<br />
1 Sophia University, Tokyo, JAPAN.<br />
3:46P – 3:48P<br />
044 REAL-TIME ELASTOGRAPHY FOR PROSTATE CANCER DETECTION: PRELIMINARY EXPERIENCE.<br />
E Pallwein 1 , L Pallwein 1 , M Schurich 1 , W Horninger 2 , F Frauscher 1 .<br />
1,2 Medical University, Innsbruck, AUSTRIA.<br />
3:48P – 3:50P<br />
055 AN APPLICATION OF THE LAGRANGIAN SPECKLE MODEL ESTIMATOR TO NON-INVASIVELY<br />
CHARACTERIZE THE CAROTID ARTERY: SIMULATION INVESTIGATIONS.<br />
E Mercure 1 , RL Maurice 1 , G Soulez 2 , G Cloutier 1 .<br />
1,2 University of Montréal Hospital, Montréal, Quebec, CANADA.<br />
3:50P – 3:52P<br />
058 NON-RIGID SOFT TISSUE TRACKING WITH THREE-DIMENSIONAL ULTRASOUND.<br />
P Jordan 1,3 , T Zickler 1 , S Socrate 2 , RD Howe 1,3 .<br />
1 Harvard University, Cambridge, MA, USA; 2 Massachusetts Institute of Technology, Cambridge, MA,<br />
USA; 3 Harvard-MIT Division of Health Sciences and Technology, Cambridge, MA, USA.<br />
<br />
indicates Presenter<br />
6<br />
(Session POS continues on next page)
3:52P – 3:54P<br />
060 DETECTION OF NON-DEFORMABLE OBJECTS IN THE BODY USING ULTRASOUND ELASTICITY IMAGING.<br />
U Bae 1 , Y Kim 1 .<br />
1 University of Washington, Seattle, WA USA.<br />
3:54P – 3:56P<br />
064 ABSOLUTE ELASTICITY ESTIMATION WITH A NEW ULTRASONIC-MECHANICAL DEVICE.<br />
T Sato 1 , Y Fukuyama 1 , Y Watanabe 1 , S Goka 1 , H Sekimoto 1 .<br />
1 Tokyo Metropolitan University, Tokyo, JAPAN.<br />
3:56P – 3:58P<br />
066 THE FEASIBILITY OF USING ELASTOGRAPHIC TECHNIQUES FOR ASSESSING MEAT QUALITY<br />
ATTRIBUTES.<br />
R Righetti 1 , J Ophir 1 , RK Miller 2 , TA Krouskop 1,3 .<br />
1 The University of Texas Health Science Center at Houston, Houston, TX, USA; 2 Texas A&M<br />
University, College Station, TX, USA; 3 Baylor College of Medicine, Houston, TX, USA.<br />
3:58P – 4:00P<br />
067 NOVEL STRAIN ELASTOGRAPHIC TECHNIQUES.<br />
R Righetti 1 , A Thitai Kumar 1,2 , S Srinivasan 1,3 , J Ophir 1,2 , TA Krouskop 1,4 .<br />
1 The University of Texas Health Science Center at Houston, Houston, TX, USA; 2 University of<br />
Houston, Houston, TX, USA; 3 Siemens Acuson Ultrasound, Mountain View, CA, USA; 4 Baylor<br />
College of Medicine, Houston, TX, USA.<br />
4:00P – 4:02P<br />
070 VISCOELASTIC CHARACTERIZATION OF THERMAL LESIONS IN LIVER.<br />
MZ Kiss 1 , T Varghese 1,2 .<br />
1,2 University of Wisconsin-Madison, Madison, WI, USA.<br />
4:02P – 4:04P<br />
076 NOISE REDUCTION IN ELASTOGRAPHIC STRAIN ESTIMATED FROM DISPLACEMENT.<br />
L Xu 1 , JC Bamber 1 .<br />
1 Institute of Cancer Research and Royal Marsden NHS Trust, Sutton, Surrey, England UK.<br />
4:04P – 4:06P<br />
078 VIRTUAL ENDOSCOPIC ELASTOGRAPHY – AN INITIAL EXPERIENCE IN VIVO.<br />
PF Zhang 1 , X Yi 2 , HJ Su 3 , M Zhang 1 , WQ Chen 1 , Y Zhang 1 .<br />
1 Shandong University Qilu Hospital, Jinan, Shandong Province, CHINA; 2 Chinese Ministry of<br />
Education Key Laboratory of Cardiovascular Remodeling and Function Research, Jinan, Shandong<br />
Province, CHINA; 3 Shandong University, Jinan, Shandong Province, CHINA.<br />
4:06P – 4:08P<br />
079 PLAQUE VOLUME COMPRESSION RATIO – A NEW INDEX IN EVALUATING PLAQUE ELASTICITY<br />
PROPERTIES.<br />
PF Zhang 1 , GH Yao 1 , M Zhang 1 , H Jiang 2 , Y Zhang 1 .<br />
1 Shandong University Qilu Hospital, Jinan, Shandong Province, CHINA; 2 Chinese Ministry of Education Key<br />
Laboratory of Cardiovascular Remodeling and Function Research, Jinan, Shandong Province, CHINA.<br />
4:08P – 4:10P<br />
082 PHANTOM EXPERIMENTS AND COMPUTER SIMULATION FOR BREAST CANCER ELASTOGRAPY<br />
BY WATER BAG PRESSING.<br />
Y Hayakawa 1 , K Ishida 1 , K Tsuji 1 , M Kaitoo 1 , M Nakamura 2 .<br />
1 Toin University of Yokohama, Yokohama, Kanagawa-ken, JAPAN; 2 Yokohama General Hospital,<br />
Yokohama, Kanagawa-ken, JAPAN.<br />
(Session POS continues on next page)<br />
<br />
indicates Presenter<br />
7
4:10P – 4:12P<br />
088 PRELIMINARY CLINICAL STUDY OF SEMI-QUANTITATIVE FREEHAND ELASTOGRAPHY FOR THE<br />
ASSESSMENT OF RADIATION INDUCED BREAST FIBROSIS.<br />
NL Bush 1 , JC Bamber 1 , PE Barbone 3 , JR Yarnold 2 .<br />
1,2 Institute of Cancer Research and Royal Marsden NHS Trust, Sutton, Surrey, England, UK;<br />
3 Boston University, Boston, MA, USA.<br />
4:12P – 4:14P<br />
090 PROGRESS IN QUANTITATIVE BIOMECHANICAL IMAGING.<br />
NH Gokhale 1 , MS Richards 2 , C Rivas Aroni 1 , R Leiderman 1 , AA Oberai 1 , PE Barbone 1 .<br />
1,2 Boston University, Boston, MA, USA.<br />
4:14P – 4:16P<br />
099 TISSUE MOTION AND ELASTICITY IMAGING EVALUATED BY ULTRASOUND IN A<br />
TISSUE-MIMICKING PHANTOM.<br />
AAO Carneiro 1 , H Chen 2 , T Varghese 2 , TJ Hall 2 , JA Zagzebski 2 .<br />
1 Universidade de São Paulo, Ribeirão Preto, São Paulo, BRAZIL; 2 University of Wisconsin-Madison,<br />
Madison, WI, USA.<br />
4:16P – 4:18P<br />
101 COMPARISON BETWEEN AXIAL ELASTOGRAMS OF A CONNECTED AND DISCONNECTED<br />
INCLUSION IN HOMOGENEOUS BACKGROUND: A SIMULATION STUDY.<br />
A Thitai Kumar 1,2 , J Ophir 1,2 , TA Krouskop 1,3 .<br />
1 The University of Texas Medical School, Houston, TX, USA; 2 University of Houston, Houston, TX,<br />
USA; 3 Baylor College of Medicine, Houston, TX, USA.<br />
4:18P – 4:20P<br />
106 THEORETICAL AND SIMULATION STUDY OF WAVE GENERATION AND ITS EFFECT ON LESION<br />
DETECTION IN SONOELASTOGRAPHY.<br />
JM Park 1 , SJ Kwon 1 , MK Jeong 1 , MH Bae 2 .<br />
1 Daejin University, Pocheon, Kyeonggi, KOREA; 2 Hallym University, Chuncheon, Kangwon, KOREA.<br />
4:20P – 4:22P<br />
109 ULTRASOUND CHARACTERIZATION OF MECHANICAL PROPERTIES OF SILICONE TUBE WALLS.<br />
E Haeggstrom 1 , A Wallin 1 , M Leppänen 3 .<br />
1 Helsinki University, Helsinki, FINLAND.<br />
4:22P – 4:24P<br />
114 ELASTICITY AND PATHOLOGY IMAGING CORRELATION OF BREAST TUMOURS.<br />
WE Svensson 1 , A Usupbaeva 1 , S Shousha 2 , S McLaggan 1 , A Al-Kufaishi 3 , PTR Thiruchelvam 3 ,<br />
JSK Lewis 3 , HD Sinnett 3 , J Malin 5 , C Lowery 4 .<br />
1,2,3 Charing Cross Hospital, London, England, UK; 4 Siemens Medical Solutions Ultrasound Group,<br />
Issaquah, WA, USA.<br />
4:24P – 4:26P<br />
118 EFFECTS OF VISCOELASTICITY IN SHEAR WAVE SPEED RECONSTRUCTION.<br />
J Klein 1 , JR McLaughlin 1 .<br />
1 Rensselaer Polytechnic Institute, Troy, NY, USA.<br />
4:26P – 4:28P<br />
119 VISCOELASTIC CHARACTERIZATION OF SOFT MATERIALS THROUGH CREEP TEST EXPERIMENTS.<br />
JJ Ammann 1,2 , R Rivera 1 , J Ophir 3 .<br />
1 Universidad de Santiago de Chile, Santiago, CHILE; 2 CIMAT, Santiago, CHILE; 3 The University of<br />
Texas Health Science Center at Houston, Houston, TX, USA.<br />
4:28P – 5:30P Discussion<br />
<br />
indicates Presenter<br />
8
Sunday 5:30P – 7:30P<br />
Opening Reception <strong>Proceedings</strong> Book Signing<br />
Rio Grande I & II<br />
Monday, October 17 7:00A – 10:30P<br />
7:00A – 8:00A<br />
GROUP CONTINENTAL BREAKFAST<br />
Rio Grande Foyer<br />
7:00A – 5:30P<br />
Registration Desk & Conference Office Open<br />
Rio Grande Foyer<br />
8:00A – 5:30P Session POS: Posters Rio Grande II<br />
Session EEX: Equipment Exhibit<br />
Rio Grande II<br />
Monday 7:45A – 8:00A<br />
OPENING REMARKS<br />
KJ Parker, J Ophir<br />
Rio Grande I<br />
Monday 8:00A – 9:45A<br />
Session MIP-1: Methods for Imaging Elastic Tissue Properties – I<br />
Chair: A Sarvazyan, USA Co-Chair: R Rohling, Canada Rio Grande I<br />
8:00A – 8:15A<br />
003 FROM STATIC TO DYNAMIC ELASTOGRAPHY: THE UNIFIED RANGE OF ELASTIC RESPONSE.<br />
KJ Parker 1 , LS Taylor 1 , SM Gracewski 2 , DJ Rubens 3 .<br />
1,2,3 University of Rochester, Rochester, NY USA.<br />
8:15A – 8:30A<br />
009 ULTRASONIC TRACKING OF ACOUSTIC RADIATION FORCE-INDUCED DISPLACEMENT IN<br />
HOMOGENEOUS MEDIA.<br />
ML Palmeri 1 , SA McAleavey 2 , GE Trahey 1 , KR Nightingale 1 .<br />
1 Duke University, Durham, NC, USA; 2 University of Rochester, Rochester, NY, USA.<br />
8:30A – 8:45A<br />
013 THE IMPACT OF PHYSIOLOGICAL MOTION ON ABDOMINAL ACOUSTIC RADIATION FORCE<br />
IMPULSE IMAGING.<br />
BJ Fahey 1 , ML Palmeri 1 , GE Trahey 1 .<br />
1 Duke University, Durham, NC, USA.<br />
8:45A – 9:00A<br />
017 RADIOFREQUENCY ABLATION ELECTRODE DISPLACEMENT ELASTOGRAPHY – A PHANTOM STUDY.<br />
S Bharat 1,2 , EL Madsen 1 , JA Zagzebski 1 , T Varghese 1,3 .<br />
1,2,3 University of Wisconsin – Madison, Madison, WI, USA.<br />
9:00A – 9:15A<br />
053 IN-VITRO DEMONSTRATION OF REAL TIME MONITORING OF REGIONAL TISSUE ELASTICITY<br />
DURING FOCUSED ULTRASOUND THERAPY USING HARMONIC MOTION IMAGING.<br />
C Maleke 1 , M Pernot 1 , EE Konofagou 1 .<br />
1 Columbia University, New York, NY, USA.<br />
9:15A – 9:30A<br />
019 NORMAL AND SHEAR STRAIN ESTIMATION AND ANGULAR COMPOUNDING USING BEAM<br />
STEERING ON LINEAR ARRAY TRANSDUCERS.<br />
M Rao 1 , Q Chen 1 , H Shi 1 , EL Madsen 1 , JA Zagzebski 1 , T Varghese 1 .<br />
1 University of Wisconsin-Madison, Madison, WI, USA.<br />
(Session MIP-1 continues on next page)<br />
<br />
indicates Presenter<br />
9
9:30A – 9:45A<br />
071 DESIGN OF A HAND-HELD PROBE FOR IMAGING TISSUE ELASTICITY.<br />
H Rivaz 1 , R Rohling 1 .<br />
1 University of British Columbia, Vancouver, BC, CANADA.<br />
9:45A – 10:15A<br />
COFFEE BREAK<br />
Rio Grande Foyer<br />
Monday 10:15A – 11:30A<br />
Session FIP-1: Forward and Inverse Problems – I<br />
Chair: T Varghese, USA Co-Chair: T Mitake, Japan Rio Grande I<br />
10:15A – 10:30A<br />
049 SHEAR MODULUS RECONSTRUCTION USING DIRECT FINITE ELEMENT INVERSION ALGORITHM<br />
IN TRANSIENT ELASTOGRAPHY.<br />
E Park 1 , AM Maniatty 1 .<br />
1 Rensselaer Polytechnic Institute, Troy, NY, USA.<br />
10:30A – 10:45A<br />
023 FINITE ELEMENT ANALYSIS AND YOUNG’S MODULUS RECONSTRUCTION FOR ELASTICITY<br />
IMAGING WITH DEFORMATION BY A RADIOFREQUENCY ABLATION ELECTRODE.<br />
J Jiang 1 , T Varghese 1 , TJ Hall 1 , Q Chen 1 , JA Zagzebski 1 .<br />
1 University of Wisconsin-Madison, Madison, WI, USA.<br />
10:45A – 11:00A<br />
086 THREE DIMENSIONAL ULTRASOUND IMAGE REGISTRATION AND SHEAR ELASTIC MODULUS<br />
RECONSTRUCTION.<br />
MS Richards 1 , NH Gokhale 2 , AA Oberai 2 , PE Barbone 2 .<br />
1,2 Boston University, Boston, MA, USA.<br />
11:00A – 11:15A<br />
089 ZERO MEMORY GAUSS-NEWTON METHOD FOR THE DETECTION OF SMALL INCLUSIONS.<br />
J Fehrenbach 1 , M Masmoudi 1 , R Souchon 2 , P Trompette 2 .<br />
1 Laboratoire MIP, Toulouse, FRANCE; 2 INSERM UMR 556, Lyon, FRANCE.<br />
11:15A – 11:30A<br />
092 THE INFLUENCE OF CAUSALITY ON THE RECONSTRUCTION OF SHEAR MODULUS FOR<br />
DYNAMIC ELASTOGRAPHY.<br />
B Robert 1 , R Sinkus 1 , J Bercoff 1 , M Tanter 1 , M Fink 1 .<br />
1 Laboratoire Ondes et Acoustique, ESPCI, Paris, FRANCE.<br />
11:30P – 1:00P<br />
GROUP LUNCH<br />
Travis Restaurant<br />
Monday 1:00P – 2:45P<br />
Session CVE: Cardiovascular Elasticity<br />
Chair: SY Emelianov, USA Co-Chair: HM Langevin, USA Rio Grande I<br />
1:00P – 1:15P<br />
007 MOTION COMPENSATION FOR INTRAVASCULAR ULTRASOUND PALPOGRAPHY FOR IN VIVO<br />
VULNERABLE PLAQUE DETECTION.<br />
KYE Leung 1 , RA Baldewsing 1 , F Mastik 1 , MG Danilouchkine 1 , JA Schaar 1 , A Gisolf 2 , AFW van der Steen 1,3 .<br />
1 Erasmus MC, Rotterdam, The NETHERLANDS; 2 Delft University of Technology, The NETHERLANDS;<br />
3 Interuniversity Cardiology Institute of the Netherlands, Utrecht, The NETHERLANDS.<br />
<br />
indicates Presenter<br />
10
1:15P – 1:30P<br />
005 A COMPOUNDING METHOD FOR RECONSTRUCTING THE HETEROGENEOUS YOUNG’S<br />
MODULUS DISTRIBUTION OF ATHEROSCLEROTIC PLAQUES FROM THEIR RADIAL STRAIN.<br />
RA Baldewsing 1 , F Mastik 1 , JA Schaar 1 , AFW van der Steen 1,2 .<br />
1 Erasmus MC, Rotterdam, The NETHERLANDS; 2 Interuniversity Cardiology Institute of the<br />
Netherlands, Utrecht, The NETHERLANDS.<br />
1:30P – 1:45P<br />
025 AN INTEGRATED ULTRASOUND-BASED INTRAVASCULAR IMAGING OF ATHEROSCLEROSIS.<br />
S Sethuraman 1 , SR Aglyamov 1 , JH Amirian 2 , RW Smalling 2 , SY Emelianov 1 .<br />
1 The University of Texas at Austin, Austin, TX, USA; 2 University of Texas Health Science Center<br />
Houston, Houston, TX, USA.<br />
1:45P – 2:00P<br />
054 ELECTROMECHANICAL MAPPING OF THE NORMAL AND ISCHEMIC MYOCARDIUM.<br />
M Pernot 1 , SD Fung-Kee-Fung 1 , EE Konofagou 1 .<br />
1 Columbia University, New York, NY, USA.<br />
2:00P – 2:15P<br />
056 ANGLE INDEPENDENT STRAIN ESTIMATION IN MYOCARDIAL ELASTOGRAPHY.<br />
SD Fung-Kee-Fung 1 , EE Konofagou 1 .<br />
1 Columbia University, New York, NY, USA.<br />
2:15P – 2:30P<br />
063 NON-INVASIVE VASCULAR ELASTOGRAPHY FOR CAROTID ARTERY PLAQUE<br />
CHARACTERIZATION: IN VIVO FEASIBILITY STUDY.<br />
RL Maurice 1 , G Cloutier 1 , M-F Giroux 2 , S Lanthier 3 , G Soulez 2 .<br />
1,2,3 University of Montréal Hospital, Montréal, CANADA.<br />
2:30P – 2:45P<br />
068 A 3D SIMULATION MODEL FOR PERFORMANCE ASSESSMENT OF 2D MYOCARDIAL<br />
ELASTOGRAPHY.<br />
WN Lee 1 , CP Ingrassia 1 , EE Konofagou 1 .<br />
1 Columbia University, New York, NY, USA.<br />
2:45P – 3:15P<br />
COFFEE BREAK<br />
Rio Grande Foyer<br />
Monday 3:15P – 4:15P<br />
Session MMA: 3D, Multi-Modality & Alternative Applications<br />
Chair: KJ Parker, USA Co-Chair: JC Bamber, UK Rio Grande I<br />
3:15P – 3:30P<br />
008 FRAME FILTERING FOR IMPROVED FREEHAND 3D ULTRASOUND ELASTOGRAPHY.<br />
JE Lindop 1 , GM Treece 1 , AH Gee 1 , RW Prager 1 .<br />
1 University of Cambridge, Cambridge, England, UK.<br />
3:30P – 3:45P<br />
057 AN INVERSE DEFORMATION METHOD FOR THE VISUALIZATION OF REAL-TIME 3D LUNG DYNAMICS.<br />
AP Santhanam 1 , JP Rolland 2 .<br />
1,2 University of Central Florida, Orlando FL, USA.<br />
3:45P – 4:00P<br />
091 COMPARISON OF THREE NON-AXIAL STRAIN ESTIMATION TECHNIQUES FOR 3D STRAIN<br />
ESTIMATION IN ELASTIC MATERIALS AND TISSUES.<br />
RGP Lopata 1 , MM Nillesen 1 , IH Gerrits 1 , JM Thijssen 1 , L Kapusta 2 , CL de Korte 1 .<br />
1,2 Radboud University Medical Center, Nijmegen, The NETHERLANDS.<br />
(Session MMA continues on next page)<br />
<br />
indicates Presenter<br />
11
4:00P – 4:15P<br />
102 STEADY-STATE HARMONIC ELASTOGRAPHY: VISUALIZING THE VISCOELASTIC PROPERTIES<br />
WITHIN SOFT TISSUES.<br />
MM Doyley 1, 2 , Q Feng 2 , JB Weaver 1,2 , FE Kennedy 2 , KD Paulsen 2 .<br />
1 Dartmouth Medical School, Hanover, NH, USA; 2 Dartmouth College, Hanover, NH, USA.<br />
Monday 4:15P – 5:30P<br />
Session SIP-1: Signal and Image Processing – I<br />
Chair: TJ Hall, USA Co-Chair: T Shiina, Japan Rio Grande I<br />
4:15P – 4:30P<br />
059 ANGULAR STRAIN METHOD FOR STRAIN ESTIMATION IN ULTRASOUND ELASTICITY IMAGING.<br />
U Bae 1 , Y Kim 1 .<br />
1 University of Washington, Seattle, WA, USA.<br />
4:30P – 4:45P<br />
037 MULTIDIMENSIONAL AUTOCORRELATION AND DOPPLER METHODS VERSUS<br />
CROSS-SPECTRUM PHASE GRADIENT METHOD.<br />
C Sumi 1 .<br />
1 Sophia University, Tokyo, JAPAN.<br />
4:45P – 5:00P<br />
087 HIGH RESOLUTION TIME OF FLIGHT MEASUREMENTS WITH THE PULSED PHASE LOCKED LOOP.<br />
T Lynch 1 , JS Heyman 1 , D Blaker 2 .<br />
1 Luna Innovations Inc., Hampton, VA, USA; 2 Luna Innovations Inc., Blacksburg, VA, USA.<br />
5:00P – 5:15P<br />
093 EFFECTS OF PHYSIOLOGICAL TISSUE MOTION STATISTICS ON PREDICTED ELASTOGRAPHIC<br />
IMAGE QUALITY IN VIVO.<br />
R Chandrasekhar 1,2 , J Ophir 1,2 , T Krouskop 3 , K Ophir 4 .<br />
1 The University of Texas Medical School, Houston, TX, USA; 2 University of Houston, Houston, TX,<br />
USA; 3 Baylor College of Medicine, Houston, TX, USA.; 4 Austin, TX, USA.<br />
5:15P – 5:30P<br />
052 ELASTICITY IMAGING USING ULTRAFAST VS. CONVENTIONAL ULTRASOUND IMAGING.<br />
S Park 1 , SR Aglyamov 1 , J Shah 1 , WG Scott 2 , SY Emelianov 1 .<br />
1 University of Texas at Austin, Austin, TX, USA; 2 Winprobe Corporation, North Palm Beach, FL, USA.<br />
5:30P – 7:30P No Conference Activities<br />
Monday 7:30P – 10:30P<br />
Conference Dinner <strong>Proceedings</strong> Book Signing<br />
Rio Grande I<br />
7:30P – 10:30P<br />
Chair: J Ophir, USA<br />
000 LESSONS FROM THE WORLD OF MEDICAL DEVICE COMMERCIALIZATION.<br />
Y Yazdi 1 .<br />
1 Corporate Office of Science and Technology, Johnson & Johnson, New Brunswick, NJ, USA.<br />
Violin selections performed by Dario Sosa Cabrera, Canary Islands, SPAIN.<br />
<br />
indicates Presenter<br />
12
Tuesday, October 18 7:00A – 5:30P<br />
7:00A – 8:00A<br />
GROUP CONTINENTAL BREAKFAST<br />
Rio Grande Foyer<br />
7:00A – 5:30P<br />
Registration Desk & Conference Office Open<br />
Rio Grande Foyer<br />
8:00A – 5:30P Session POS: Posters Rio Grande II<br />
Session EEX: Equipment Exhibit<br />
Rio Grande II<br />
Tuesday 8:00A – 9:15A<br />
Session CAA-1: Clinical and Animal Applications – I<br />
Chair: JM Rubin, USA Co-Chair: BS Garra, USA Rio Grande I<br />
8:00A – 8:15A<br />
104 ARTERIAL ELASTIC MODULUS RECONSTRUCTION FROM IN-VIVO STRAIN IMAGING AND PWV.<br />
WF Weitzel 1 , K Kim 2 , H Xie 2 , JM Rubin 3 , C Jia 2 , M O’Donnell 2 .<br />
1,2,3 University of Michigan, Ann Arbor, MI, USA.<br />
8:15A – 8:30A<br />
074 COMPUTER AIDED DIAGNOSIS OF BREAST CANCER BASED ON ELASTICITY IMAGES.<br />
T Shiina 1 , M Yamakawa 1 , A Itoh 2 , E Tohno 2 , E Ueno 2 , T Matsumura 3 , T Mitake 3 .<br />
1,2 University of Tsukuba, Tsukuba, JAPAN; 3 Hitachi Medical Corporation, Kashiwa, JAPAN.<br />
8:30A – 8:45A<br />
033 DIAGNOSIS OF LIVER FIBROSIS IN CHILDREN USING FIBROSCAN ® .<br />
L Sandrin 1 , V Miette 1 , C Fournier 1 , T Lamireau 2 , V de Lédinghen 3 .<br />
1 Echosens, Paris, FRANCE; 2 Hôpital Pellegrin, Bordeaux, FRANCE; 2 Hôpital Haut Lévêque, Pessac, FRANCE.<br />
8:45A – 9:00A<br />
112 CLINICAL EVALUATION OF THYROID TUMOR WITH REAL-TIME TISSUE ELASTOGRAPHY.<br />
K Tanaka 1 , N Fukunari 2 , H Akasu 1 , W Kitagawa 1 , K Shimizu 2 , K Ito 2 , T Mitake 3 .<br />
l Nippon Medical School, Tokyo, JAPAN; 2 Ito Hospital, Tokyo, JAPAN; 3 Hitachi Medical Corporation,<br />
Tokyo, JAPAN.<br />
9:00A – 9:15A<br />
115 ELASTICITY IMAGING OF 67 CANCERS AND 167 BENIGN BREAST LESIONS SHOWS THAT IT<br />
COULD HALVE BIOPSY RATES OF BENIGN LESIONS.<br />
WE Svensson 1 , D Amiras 3 , S Shousha 2 , A Rattansingh 1 , D Chopra 1 , HD Sinnett 3 , TJ Hall 4 , Y Zhu 5 ,<br />
J Malin 6 , C Lowery 6 .<br />
1,2,3 Charing Cross Hospital, London, England, UK; 4 University of Wisconsin-Madison, Madison, WI,<br />
USA; 5 University of Kansas Medical Center, Kansas City, KS, USA; 6 Siemens Medical Solutions<br />
Ultrasound Group, Issaquah, WA, USA.<br />
Tuesday 9:15A – 10:00A<br />
Session BTM: Biomechanical Tissue Modeling<br />
Chair: WF Weitzel, USA Co-Chair: E Mazza, Switzerland Rio Grande I<br />
9:15A – 9:30A<br />
031 THE ROLE OF ANISOTROPIC ELASTICITY AND VISCOSITY IN SKELETAL MUSCLE IMAGING.<br />
SF Levinson 1 , S Catheline 2 , M Fink 2 , RL Ehman 3 .<br />
1 Wayne State University, Detroit, MI, USA; 2 Laboratoire Onde et Acoustique, ESPCI, Paris, FRANCE;<br />
3 Mayo Clinic Department of Radiology, Rochester, MN, USA.<br />
(Session BTM continues on next page)<br />
<br />
indicates Presenter<br />
13
9:30A – 9:45A<br />
094 MICROMECHANICAL ANALYSIS OF DENTIN ELASTIC ANISOTROPY.<br />
A Misra 1 , P Spencer 2 , O Marangos 1 , Y Wang 2 , M Walker 2 , JL Katz 1,2 .<br />
1,2 University of Missouri-Kansas-City, Kansas City, MO, USA.<br />
9:45A – 10:00A<br />
095 CALIBRATING SCANNING ACOUSTIC MICROSCOPY FOR MICROMECHANICAL PROPERTY<br />
QUANTIFICATION.<br />
O Marangos 1 , A Misra 1 , JL Katz 1,2 , Y Wang 2 , P Spencer 2 .<br />
1,2 University of Missouri-Kansas City, Kansas City, MO, USA.<br />
10:00A – 10:30A<br />
COFFEE BREAK<br />
Rio Grande Foyer<br />
Tuesday 10:30A – 12:00P<br />
Session MMT: Mechanical Measurement Techniques for Tissues<br />
Chair: GE Trahey, USA Co-Chair: L Sandrin, France Rio Grande I<br />
10:30A – 10:45A<br />
001 AVERAGE “GRAIN-SIZE” ESTIMATION IN LIQUID OR SOLID CHANNELS.<br />
D Hazony 1 ,Y Hazony 2 , JL Katz 1,3 .<br />
1 Case Western Reserve University, Cleveland, OH, USA; 2 Boston University, Boston, MA, USA;<br />
3 University of Missouri-Kansas City, Kansas City, MO, USA.<br />
10:45A – 11:00A<br />
002 STUDY OF THE EFFECT OF BOUNDARY CONDITIONS AND INCLUSION’S POSITION ON THE<br />
CONTRAST TRANSFER EFFICIENCY IN ELASTOGRAPHY.<br />
D Sosa Cabrera 1,2 , J Ophir 1,3 , T Krouskop 4 , A Thitai Kumar 1,3 , J Ruiz-Alzola 2 .<br />
1 The University of Texas Medical School, Houston, TX, USA; 2 University of Las Palmas de Gran<br />
Canaria, Las Palmas de Gran Canaria, Canary Islands, SPAIN; 3 University of Houston, Houston, TX,<br />
USA; 4 Baylor College of Medicine, Houston, TX, USA.<br />
11:00A – 11:15A<br />
026 IN VIVO MECHANICAL BEHAVIOR OF HUMAN LIVER.<br />
E Mazza 1 , A Nava 1 , D Hahnloser 2 , W Jochum 3 , M Bajka 4 .<br />
1 Swiss Federal Institute of Technology, Zurich, SWITZERLAND; 2,3,4 University Hospital, Zurich,<br />
SWITZERLAND.<br />
11:15A – 11:30A<br />
027 MECHANICAL CHARACTERIZATION OF SOFT TISSUE: COMPARISON OF DIFFERENT<br />
EXPERIMENTAL TECHNIQUES ON SYNTHETIC MATERIALS.<br />
D Valtorta 1 , M Hollenstein 1 , A Nava 1 , V Luboz 2 , MH Lu 3 , A Choi 3 , E Mazza 1 , YP Zheng 3 , SM Cotin 2 .<br />
1 Swiss Federal Institute of Technology, Zürich, SWITZERLAND; 2 Massachusetts General Hospital,<br />
Boston, MA, USA; 3 The Hong Kong Polytechnic University, Hong Kong, CHINA.<br />
11:30A – 11:45A<br />
039 SHEAR MODULUS RECONSTRUCTION USING ULTRASONICALLY MEASURED STRAIN RATIO.<br />
C Sumi 1 .<br />
1 Sophia University, Tokyo, JAPAN.<br />
11:45A – 12:00P<br />
081 NONINVASIVE INTRAMUSCULAR PRESSURE MEASUREMENTS THROUGH HARMONIC ANALYSIS<br />
OF ARTERIAL PULSATIONS.<br />
T Lynch 1 , T Ueno 2 , AD Cutuk 2 , JM Wiemann 2 , BR Macias 2 , AR Hargens 2 .<br />
1 Luna Innovations Inc., Hampton, VA, USA; 2 University of California San Diego, San Diego, CA, USA.<br />
<br />
indicates Presenter<br />
14
12:00P – 1:30P<br />
GROUP LUNCH<br />
Travis Restaurant<br />
Tuesday 1:30P – 3:30P<br />
Session MIP-2: Methods for Imaging Elastic Tissue Properties – II<br />
Chair: R Sinkus, France Co-Chair: JL Katz, USA Rio Grande I<br />
1:30P – 1:45P<br />
061 THE SPATIO-TEMPORAL VARIATION OF THE STRAIN FIELD INSIDE COMPRESSED<br />
POROELASTIC MATERIALS.<br />
GP Berry 1 , JC Bamber 1 , NL Bush 1 , NR Miller 1 .<br />
1 Institute of Cancer Research, Sutton, Surrey, England, UK.<br />
1:45P – 2:00P<br />
065 A NEW COMPRESSION METHOD FOR GENERATING POROELASTOGRAMS IN INHERENTLY NOISY<br />
APPLICATIONS.<br />
R Righetti 1 , J Ophir 1 , BS Garra 2 , TA Krouskop 1,3 .<br />
1 The University of Texas Health Science Center at Houston, Houston, TX, USA; 2 The University of<br />
Vermont College of Medicine, Burlington, VT, USA; 3 Baylor College of Medicine, Houston, TX, USA.<br />
2:00P – 2:15P<br />
018 MAXIMUM STRAIN ACCUMULATION FOR IN VIVO TISSUE.<br />
AM Sommer 1 , TJ Hall 1 , J Jiang 1 .<br />
1 University of Wisconsin – Madison, Madison, WI, USA.<br />
2:15P – 2:30P<br />
032 DOPPLER MYOGRAPHY—DETECTING AND IMAGING INTRINSIC MUSCLE SOUNDS.<br />
SF Levinson 1 , H Kanai 2 , H Hasegawa 2 .<br />
1 Wayne State University, Detroit, MI, USA; 2 Tohoku University, Sendai, JAPAN.<br />
2:30P – 2:45P<br />
029 TRANSIENT ULTRASOUND ELASTOGRAPHY USING IMPULSIVE ULTRASOUND RADIATION FORCE.<br />
D Melodelima 1 , JC Bamber 1 , F Duck 2 , S Shipley 2 .<br />
1 Royal Marsden NHS Trust and Institute of Cancer Research, Sutton, Surrey, England, UK; 2 Royal<br />
United Hospital NHS Trust, Bath, England, UK.<br />
2:45P – 3:00P<br />
080 AN IN VIVO COMPARATIVE ASSESSMENT OF ADAPTIVE ELASTOGRAPHIC TECHNIQUES.<br />
K Hoyt 1,2 , F Forsberg 2 , CRB Merritt 2 , JB Liu 2 , J Ophir 3 .<br />
1 Drexel University, Philadelphia, PA, USA; 2 Thomas Jefferson University, Philadelphia, PA, USA;<br />
3 University of Texas Medical School, Houston, TX, USA.<br />
3:00P – 3:15P<br />
043 DISPLACEMENT OF A SOLID SPHERE IN A VISCOELASTIC MEDIUM IN RESPONSE TO AN<br />
ACOUSTIC RADIATION FORCE: THEORETICAL ANALYSIS AND EXPERIMENTAL VERIFICATION.<br />
SR Aglyamov 1 , AB Karpiouk 1 , YA Ilinskii 2 , EA Zabolotskaya 2 , SY Emelianov 1 .<br />
1,2 The University of Texas at Austin, Austin, TX, USA.<br />
3:15P – 3:30P<br />
050 ELASTOGRAPIC IMAGING OF UTERINE TISSUE.<br />
MA Hobson 1 , MZ Kiss 1 , H Shi 1 , T Varghese 1,2 , MA Kliewer 3 , JA Zagzebski 1 , TJ Hall 1 , J Harter 4 ,<br />
EM Hartenbach 5 , EL Madsen 1 .<br />
1,2,3,4,5 University of Wisconsin-Madison, Madison, WI, USA.<br />
3:30P – 4:00P<br />
COFFEE BREAK<br />
Rio Grande Foyer<br />
<br />
indicates Presenter<br />
15
Tuesday 4:00P – 4:45P<br />
Session PTO: Phantoms and Test Objects<br />
Chair: AFW van der Steen, The Netherlands Co-Chair: TA Krouskop, USA Rio Grande I<br />
4:00P – 4:15P<br />
045 PVA PROSTATE PHANTOM FOR ULTRASOUND AND MR ELASTOGRAPHY.<br />
W Khaled 1 , T Neumann 1 , J Stapf 1 , H Ermert 1 .<br />
1 Institute of High Frequency Engineering, Ruhr-University, Bochum, GERMANY.<br />
4:15P – 4:30P<br />
046 A NOVEL 3D HAPTIC SENSOR SYSTEM BASED ON ULTRASOUND ELASTOGRAPHY.<br />
W Khaled 1 , S Reichling 2 , OT Bruhns 2 , A Lorenz 3 , A Pesavento 3 , H Ermert 1 .<br />
1,2 Ruhr-University, Bochum, GERMANY; 3 LP-IT Innovative Technologies GmbH, Bochum, GERMANY.<br />
4:30P – 4:45P<br />
048 TISSUE MIMICKING MATERIALS AND PHANTOMS FOR ELASTICITY IMAGING.<br />
J Beck 1 , S Sethuraman 1 , S Mallidi 1 , AB Karpiouk 1 , SR Aglyamov 1 , SY Emelianov 1 .<br />
1 The University of Texas at Austin, Austin, TX, USA.<br />
Tuesday 4:45P – 5:30P<br />
Session INS: Instrumentation<br />
Chair: GJ Streekstra, The Netherlands Co-Chair: AM Maniatty, USA Rio Grande I<br />
4:45P – 5:00P<br />
035 DEVELOPMENT OF AN IN VIVO TISSUE INDENTATION SYSTEM USING AN ELECTROMAGNETIC<br />
SPATIAL LOCATING SENSOR.<br />
YP Zheng 1 , MH Lu 1 , QH Huang 1 , W Yu 1 , GHY Lo 1 .<br />
1 The Hong Kong Polytechnic University, Hong Kong, CHINA.<br />
5:00P – 5:15P<br />
036 DEVELOPMENT OF A SOFTWARE PLATFORM FOR ULTRASOUND MEASUREMENT OF MOTION<br />
AND ELASTICITY (UMME).<br />
YP Zheng 1 , J Shi 1 , QH Huang 1 , X Chen 1 .<br />
1 The Hong Kong Polytechnic University, Hong Kong, CHINA.<br />
5:15P – 5:30P<br />
084 MEASURING STIFFNESS OF BREAST TISSUE EX-VIVO.<br />
A Iqbal 1 , T Frank 1 , D McLean 1 , A Thompson 1 , A Cuschieri 1 .<br />
1 Ninewells Hospital and Medical School, University of Dundee, Dundee, Scotland, UK.<br />
Wednesday, October 19 7:00A – 9:30P<br />
7:00A – 8:00A<br />
GROUP CONTINENTAL BREAKFAST<br />
Rio Grande Foyer<br />
7:00A – 4:00P<br />
Registration Desk & Conference Office Open<br />
Rio Grande Foyer<br />
8:00A – 4:00P Session POS: Posters Rio Grande II<br />
Session EEX: Equipment Exhibit<br />
Rio Grande II<br />
<br />
indicates Presenter<br />
16
Wednesday 8:00A – 9:00A<br />
Session SIP-2: Signal and Image Processing – II<br />
Chair: F Forsberg, USA Co-Chair: EE Konofagou, USA Rio Grande I<br />
8:00A – 8:15A<br />
098 2D STRAIN ESTIMATION BASED ON A NEWTON CONSTRAINED MINIMIZATION STRATEGY:<br />
APPLICATION TO EXPERIMENTAL DATA.<br />
E Brusseau 1 , JF Déprez 1 , G Said 1 , O Basset 1 .<br />
1 CREATIS UMR CNRS 5515 INSERM U630, Lyon, FRANCE.<br />
8:15A – 8:30A<br />
083 STRAIN ESTIMATION WITH PULSE SHAPING.<br />
R Souchon 1 , S Vassant 1 , J-C Béra 1 , J-Y Chapelon 1 .<br />
1 INSERM UMR 556, Lyon, FRANCE.<br />
8:30A – 8:45A<br />
100 SIGNAL-TO-NOISE RATIO UPPER-BOUND IN SHEAR STRAIN ELASTOGRAMS.<br />
A Thitai Kumar 1,2 , J Ophir 1,2 and TA Krouskop 1,3 .<br />
1 The University of Texas Medical School, Houston, TX, USA; 2 University of Houston, Houston, TX,<br />
USA; 3 Baylor College of Medicine, Houston, TX, USA.<br />
8:45A – 9:00A<br />
041 REGULARIZATION FOR STRAIN MEASUREMENT AND SHEAR MODULUS RECONSTRUCTION.<br />
C Sumi 1 .<br />
1 Sophia University, Tokyo, JAPAN.<br />
Wednesday 9:00A – 10:15A<br />
Session FIP-2: Forward and Inverse Problems – II<br />
Chair: JR McLaughlin, USA Co-Chair: R Souchon, France Rio Grande I<br />
9:00A – 9:15A<br />
107 2D AND 3D ELASTICITY AND VISCOSITY IMAGING USING NEW RECONSTRUCTION STRATEGIES<br />
IN DYNAMIC ELASTOGRAPHY.<br />
J Bercoff 1 , R Sinkus 1 , M Tanter 1 , M Fink 1 .<br />
1 Laboratoire Ondes et Acoustique, ESPCI, Paris, FRANCE.<br />
9:15A – 9:30A<br />
097 AN ANALYTICAL MODEL FOR 3D LONGITUDINAL WAVE PROPAGATION IN A VISCOELASTIC<br />
CYLINDER: APPLICATIONS TO MR ELASTOGRAPHY.<br />
GJ Streekstra 1 , P van Horssen 1 , DMJ van den Berg 1 , JGG Dobbe 2 , J Strackee 1 .<br />
1,2 Academic Medical Center, Amsterdam, The NETHERLANDS.<br />
9:30A – 9:45A<br />
103 A BAYESIAN IMAGE RECONSTRUCTION APPROACH FOR MODEL-BASED ELASTOGRAPHY.<br />
MM Doyley 1,3 , S Srinivasan 2 , E Dimidenko 1 , N Soni 3 , J Ophir 2 .<br />
1 Dartmouth Medical School, Hanover, NH, USA; 2 University of Texas Medical School, Houston, TX,<br />
USA; 3 Dartmouth College, Hanover, NH, USA.<br />
9:45A – 10:00A<br />
077 IMAGING ANISOTROPIC ELASTICITY USING SUPERSONIC RADIATION FORCE EXCITATION.<br />
JR Yoon 1 , D Renzi 2 , JR McLaughlin 2 .<br />
1 Clemson University, Clemson, SC, USA; 2 Rensselaer Polytechnic Institute, Troy, NY, USA.<br />
10:00A – 10:15A<br />
113 FAST INVERSION TECHNIQUES FOR 3D ELASTICITY IMAGING.<br />
BB Guzina 1 , AI Madyarov 1 , I Chikichev 1 .<br />
1 Univiersity of Minnesota, Minneapolis, MN, USA.<br />
<br />
indicates Presenter<br />
17
10:15A – 10:45A<br />
COFFEE BREAK<br />
Rio Grande Foyer<br />
Wednesday 10:45A – 12:15P<br />
Session CAA-2: Clinical and Animal Applications – II<br />
Chair: WE Svensson, UK Co-Chair: RL Maurice, Canada Rio Grande I<br />
10:45A – 11:00A<br />
004 ULTRASOUND ELASTICITY IMAGING FOR AGING DEEP VENOUS THROMBOSIS IN HUMANS.<br />
JM Rubin 1 , H Xie 1 , K Kim 1 , WF Weitzel 1 , SY Emelianov 2 , S Aglyammov 2 , TW Wakefield 1 ,<br />
M O’Donnell 1 .<br />
1 University of Michigan, Ann Arbor, MI, USA; 2 University of Texas at Austin, Austin, TX, USA.<br />
11:00A – 11:15A<br />
030 A NOVEL PERFORMANCE DESCRIPTOR FOR ULTRASONIC STRAIN IMAGING: A PRELIMINARY STUDY.<br />
J Jiang 1 , TJ Hall 1 , AM Sommer 1 .<br />
1 University of Wisconsin-Madison, Madison, WI, USA.<br />
11:15A – 11:30A<br />
111 A COMPARISON OF REAL-TIME AND POST-PROCESSED ELASTOGRAPHY WITH SURGICAL<br />
FINDINGS FOR INTRA-OPERATIVE DETECTION OF BRAIN TUMOURS.<br />
A Chakraborty 1 , JC Bamber 2 , NL Dorward 1 .<br />
1 Royal Free Hospital, London, England, UK; 2 Institute of Cancer Research and Royal Marsden NHS<br />
Trust, Sutton, Surrey, England, UK.<br />
11:30A – 11:45A<br />
051 SOFT TISSUE BIOMECHANCIAL BEHAVIOR DURING ROBOTIC ACUPUNCTURE IN LOW BACK<br />
PAIN USING ULTRASOUND ELASTICITY IMAGING.<br />
HM Langevin 1 , EE Konofagou 2 , J Wu 3 , JR Fox 4 and JC Iatridis 5 .<br />
1,3,4,5 University of Vermont, Burlington, VT, USA; 2 Columbia University, New York, NY, USA.<br />
11:45A – 12:00P<br />
110 REALTIME SONOELASTOGRAPHY OF 156 BREAST LESIONS IN A PROSPECTIVE CLINICAL SETTING.<br />
S Weber 1 , S Wojcinski 1 , K Ertan 1 , K Remberger 2 , U Stein 2 , R Ohlinger ³, A Thomas 4 , W Schmidt 1 .<br />
1,2 University of Saarland, Homburg, Saar, GERMANY; 3 Ernst-Moritz-Arndt University, Greifswald,<br />
GERMANY; 4 Charité – CCM, University Berlin, Berlin, GERMANY.<br />
12:00P – 12:15P<br />
075 ULTRASOUND ELASTOGRAPHY OF SKIN UNDER SURFACE EXTENSIVE LOADING.<br />
L Coutts 1 , JC Bamber 1 , NR Miller 1 .<br />
1 Institute of Cancer Research, Sutton, Surrey, England, UK.<br />
12:15P – 1:45P<br />
GROUP LUNCH<br />
Travis Restaurant<br />
Wednesday 1:45P – 3:30P<br />
Session MPT: Mechanical Properties of Tissues<br />
Chair: SF Levinson, USA Co-Chair: C Sumi, Japan Rio Grande I<br />
1:45P – 2:00P<br />
047 DIFFERENTIATING MECHANICAL PROPERTIES OF CORNEAL PHANTOMS USING AN<br />
ULTRASOUND METHOD.<br />
J Liu 1 , CJ Roberts 1 , X He 1 .<br />
1 The Ohio State University, Columbus, OH, USA.<br />
<br />
indicates Presenter<br />
18
2:00P – 2:15P<br />
010 ACOUSTOELASTICTY TO BIOLOGICAL TISSUES: MEASUREMENT OF REFLECTION COEFFICIENT<br />
CHANGE IN TENDONS UNDER DIFFERENT TENSILE STRAINS.<br />
H Kobayashi 1 , A Oza 1 , R Vanderby 1 .<br />
1 University of Wisconsin-Madison, Madison, WI, USA.<br />
2:15P – 2:30P<br />
011 ACOUSTOELASTICTY IN BIOLOGICAL TISSUES: ULTRASOUND WAVE VELOCITY CHANGE IN<br />
COMPRESSED TISSUES.<br />
H Kobayashi 1 , A Oza 1 , MS Cooper 2 , R Vanderby 1 .<br />
1 University of Wisconsin-Madison, Madison, WI, USA; 2 Portage Veterinary Clinic, Portage, WI, USA.<br />
2:30P – 2:45P<br />
034 NONCONTACT ULTRASOUND INDENTATION SYSTEM FOR ASSESSING BONE-TENDON<br />
JUNCTION TISSUES: PRELIMINARY RESULTS.<br />
MH Lu 1 , YP Zheng 1 , HB Lu 2 , QH Huang 1 , L Qin 2 .<br />
1 The Hong Kong Polytechnic University, Hong Kong, CHINA; 2 Chinese University of Hong Kong,<br />
Hong Kong, CHINA.<br />
2:45P – 3:00P<br />
062 MECHANICAL MEASUREMENT OF ELASTIC PROPERTIES OF BOVINE LIVER AND HUMAN<br />
PROSTATE UNDER COMPRESSION.<br />
M Zhang 1 , ZC Wu 1 , DJ Rubens 2 , KJ Parker 1 .<br />
1,2 University of Rochester, Rochester, NY, USA.<br />
3:00P – 3:15P<br />
069 VISCOELASTIC AND ULTRASONIC PROPERTIES OF THE UTERUS.<br />
MZ Kiss 1 , T Varghese 1,2 , MA Hobson 1 , MA Kliewer 3 , J Harter 4 , EM Hartenbach 5 .<br />
1,2,3,4,5 University of Wisconsin-Madison, Madison, WI, USA.<br />
3:15P – 3:30P<br />
105 EVALUATION OF ANISOTROPY IN THE NORMAL PLANTAR SOFT TISSUES: SHEAR MODULUS FOR<br />
SHEARING DEFORMATION AND COMPRESSIVE DEFORMATION.<br />
JB Weaver 1 , TB Miller 2 , MM Doyley 1 , PR Perrinez 2 , H Wang 2 , YY Cheung 1 , JS Wrobel 3,4 , FE Kennedy 2 ,<br />
KD Paulsen 2 .<br />
1 Dartmouth-Hitchcock Medical Center, Lebanon, NH, USA; 2 Dartmouth College, Hanover, NH, USA;<br />
3 VA Medical Center, WRJ, VT, USA; 4 Dartmouth Medical School, Hanover, NH, USA.<br />
3:30P – 4:00P<br />
COFFEE BREAK<br />
Rio Grande Foyer<br />
Wednesday 4:00P – 5:30P<br />
Session MIP-3: Methods for Imaging Elastic Tissue Properties – III<br />
Chair: YP Zheng, China Co-Chair: J Liu, USA Rio Grande I<br />
4:00P – 4:15P<br />
085 DIRECT INVERSION METHOD FOR SHEAR WAVE SPEED RECONSTRUCTION IN ELASTOGRAPHY.<br />
K Lin 1 , JR McLaughlin 1 .<br />
1 Rensselaer Polytechnic Institute, Troy, NY, USA.<br />
4:15P – 4:30P<br />
015 ISSUES IN REAL-TIME ACOUSTIC RADIATION FORCE IMPULSE IMAGING.<br />
GE Trahey 1 , GF Pinton 1 , ML Palmeri 1 , RR Bouchard 1 , JJ Dahl 1 .<br />
1 Duke University, Durham, NC, USA.<br />
(Session MIP-3 continues on next page)<br />
<br />
indicates Presenter<br />
19
4:30P – 4:45P<br />
073 IN VITRO MEASUREMENT AND IMAGING OF THE STRAIN AT THE BOVINE ACL-BONE INSERTION.<br />
EE Konofagou 1 , JP Spalazzi 1 , SD Fung-kee-Fung 1 , HL Lu 1 .<br />
1 Columbia University, New York, NY 10027, USA.<br />
4:45P – 5:00P<br />
096 FFT ANALYSIS OF THE PERIODIC STRUCTURES IN HAVERSIAN BONE BASED ON SCANNING<br />
ACOUSTIC MICROSCOPY (SAM).<br />
JL Katz 1,2 , A Misra 2 , O Marangos 2 , Y Wang 1 , P Spencer 1 .<br />
1,2 University of Missouri-Kansas City, Kansas City, MO, USA.<br />
5:00P – 5:15P<br />
108 SHEAR STIFFNESS IDENTIFICATION USING MOVING INTERFERENCE PATTERNS IN<br />
SONOELASTOGRAPHY.<br />
JR McLaughlin 1 , D Renzi 2 .<br />
1,2 Rensselaer Polytechnic Institute, Troy, NY, USA.<br />
5:15P – 5:30P<br />
014 ASSESSMENT OF MECHANICAL PROPERTIES OF PVA-C WITH FOUR DIFFERENT<br />
ELASTOGRAPHIC METHODS.<br />
JL Gennisson 1 , J Fromageau 1 , C Schmitt 1 , RL Maurice 1 , R Mongrain 2 , G Cloutier 1 .<br />
1 University of Montréal Hospital, Montréal, Québec, CANADA; 2 McGill University, Montréal, Québec, CANADA.<br />
Session EEX:<br />
Equipment Exhibit<br />
Rio Grande II<br />
Hitachi Medical Corporation.<br />
Kashiwa, JAPAN.<br />
Siemens Medical Solutions Ultrasound Group.<br />
Issaquah, WA, USA.<br />
Ultrasonix Medical Corporation<br />
Burnaby, BC, CANADA.<br />
5:30P – 6:30P No Conference Activities<br />
Wednesday 6:30P – 9:30P<br />
Open House<br />
<strong>Proceedings</strong> Book Signing<br />
<br />
indicates Presenter<br />
20
AUTHOR INDEX<br />
AUTHOR PAGE AUTHOR PAGE AUTHOR PAGE<br />
Aglyamov, SR 69, 82, 103, 107, 120 Garra, BS 98 Lindop, JE 74<br />
Akasu, H 86 Gee, AH 74 Liu, J 126<br />
Al-Kufaishi, A 52 Gennisson, JL 138 Liu, JB 102<br />
Amiras, D 87 Gerrits, IH 76 Lo, GHY 108<br />
Amirian, JH 69 Giroux, MF 72 Lopata, RGP 76<br />
Ammann, JJ 54 Gisolf, A 67 Lorenz, A 106<br />
Bae, MH 50 Goka, S 38 Lowery, C 52, 87<br />
Bae, U 37, 78 Gokhale, NH 47, 64 Lu, HB 129<br />
Bajka, M 93 Gracewski, SM 55 Lu, HL 135<br />
Baldewsing, RA 67,68 Guzina, BB 119 Lu, MH 94, 108, 129<br />
Bamber, J 42, 46, 97, 101, 122, 125 Haeggstrom, E 51 Luboz, V 94<br />
Barbone, PE 25, 46, 47, 64 Hahnloser, D 93 Lynch, T 80, 96<br />
Basset, O 111 Hall, TJ 29, 48, 63, 87, 99, Macias, BR 96<br />
Beck, J 107 104, 121 Madsen, EL 58, 60, 104<br />
Béra, JC 112 Hargens, AR 96 Madyarov, AI 119<br />
Bercoff, J 66, 115 Hartenbach, EM 104, 131 Maleke, C 59<br />
Berry, G 97 Harter, J 104, 131 Malin, J 52, 87<br />
Bharat, S 58 Hasegawa, H 100 Mallidi, S 107<br />
Blaker, D 80 Hayakawa,Y 45 Maniatty, AM 62<br />
Bouchard, RR 134 Hazony, D 91 Marangos, O 89, 90, 136<br />
Bruhns, OT 106 Hazony, Y 91 Masmoudi, M 65<br />
Brusseau, E 111 He, X 126 Mastik, F 67, 68<br />
Bush, N 46, 97 Heyman, JS 80 Matsumura, T 27, 84<br />
Carneiro, AAO 48 Hobson, MA 104, 131 Maurice, R 35, 72, 138<br />
Catheline, S 88 Hollenstein, M 94 Mazza, E 93, 94<br />
Chakraborty, A 122 Horninger, W 34 McAleavey, SA 56<br />
Chandrasekhar, R 81 Howe, RD 36 McLaggan, S 52<br />
Chapelon, JY 112 Hoyt, K 102 McLaughlin, J 24, 53, 118, 133, 137<br />
Chen, H 28, 48 Huang, QH 108, 109, 129 McLean, D 110<br />
Chen, Q 60, 63 Iatridis, JC 123 Melodelima, D 101<br />
Chen, WQ 43 Ilinskii, YA 103 Mercure, E 35<br />
Chen, X 109 Ingrassia, CP 73 Merritt, CRB 102<br />
Cheung, YY 132 Iqbal, A 110 Miette, V 85<br />
Chikichev, I 119 Ishida, K 45 Miller, NR 97, 125<br />
Choi, A 94 Ito, K 86 Miller, RK 39<br />
Chopra, D 87 Itoh, A 84 Miller, TB 132<br />
Cloutier, G 35, 72, 138 Jeong, MK 50 Misra, A 89, 90, 136<br />
Cooper, MS 128 Jia, C 83 Mitake, T 27, 84, 86<br />
Cotin, SM 94 Jiang, H 44 Mongrain, R 138<br />
Coutts, L 125 Jiang, J 29, 63, 99, 121 Nava, A 93, 94<br />
Cuschieri, A 110 Jochum, W 93 Neumann, T 105<br />
Cutuk, AD 96 Jordan, P 36 Nightingale, KR 56<br />
Dahl, JJ 134 Kaitoo, M 45 Nillesen, MM 76<br />
Danilouchkine,MG 67 Kanai, H 100 O’Donnell, M 83, 120<br />
de Korte, CL 76 Kapusta, L 76 Oberai, AA 47, 64<br />
de Lédinghen, V 85 Karpiouk, AB 103, 107 Ohlinger, R 124<br />
Déprez, JF 111 Katz, JL 89, 90, 91, 136 Ophir, J 26,39,40,49,54,81,92,<br />
Dimidenko, E 117 Kennedy, FE 77, 132 98,102,113,117<br />
Dobbe, JGG 116 Khaled, W 105, 106 Ophir, K 81<br />
Dorward, NL 122 Kim, K 83, 120 Osaka, T 27<br />
Doyley, MM 77, 117, 132 Kim, Y 37, 78 Oza, A 127, 128<br />
Duck, F 101 Kiss, MZ 41, 104, 131 Qin, L 129<br />
Ehman, RL 88 Kitagawa, W 86 Pallwein, E 31, 34<br />
Emelianov, S 69, 82, 103, 107, 120 Klein, J 53 Pallwein, L 31, 34<br />
Ermert, H 105, 106 Kliewer, MA 104, 131 Palmeri, ML 56, 57, 134<br />
Ertan, K 124 Kobayashi, H 127, 128 Park, E 62<br />
Fahey, BJ 57 Konofagou, EE 59, 70, 71, 73, 123, 135 Park, JM 50<br />
Fehrenbach, J 65 Kristiansen, G 30 Park, S 82<br />
Feng, Q 77 Krouskop, TA 26, 39, 40, 49, 81, 92, Parker, KJ 55, 130<br />
Fink, M 66, 88, 115 98, 113 Patil, AV 26<br />
Fischbach, V 31 Kümmel, S 30 Paulsen, KD 77, 132<br />
Fischer, T 30 Kwon, SJ 50 Pernot, M 59, 70<br />
Forsberg, F 102 Lamireau, T 85 Perrinez, PR 132<br />
Fournier, C 85 Langevin, HM 123 Pesavento, A 106<br />
Fox, JR 123 Lanthier, S 72 Pinton, GF 134<br />
Frank, T 110 Lee, WN 73 Prager, RW 74<br />
Frauscher, F 31, 34 Leiderman, R 47 Rao, M 60<br />
Frey, H 30 Leppänen, M 51 Rattansingh, A 87<br />
Fromageau, J 138 Leung, KYE 67 Reichling, S 106<br />
Fukunari, N 86 Levinson, S 88, 100 Remberger, K 124<br />
Fukuyama, Y 38 Lewis, JSK 52 Renzi, D 118, 137<br />
Fung-Kee-Fung, SD 70, 71, 135 Lin, K 133 Richards, MS 47, 64<br />
21
AUTHOR INDEX<br />
AUTHOR PAGE AUTHOR PAGE AUTHOR PAGE<br />
Righetti, R 39, 40, 98 Varghese, T 28, 41, 48, 58, 60, 63, 104,<br />
Rivas Aroni, C 47 131<br />
Rivaz, H 61 Vassant, S 112<br />
Rivera, R 54 Wakefield, TW 120<br />
Robert, B 66 Walker, M 89<br />
Roberts, CJ 126 Wallin, A 51<br />
Rohling, R 61 Wang, H 132<br />
Rolland, JP 75 Wang, Y 89, 90, 136<br />
Rubens, DJ 55, 130 Watanabe, Y 38<br />
Rubin, JM 83, 120 Weaver, J 77, 132<br />
Ruiz-Alzola, J 92 Weber, S 124<br />
Said, G 111 Weitzel, WF 83, 120<br />
Sandrin, L 85 Wiemann, JM 96<br />
Santhanam,AP 75 Wojcinski, S 124<br />
Sato, T 38 Wrobel, JS 132<br />
Schaar, JA 67, 68 Wu, J 123<br />
Schmidt, W 124 Wu, ZC 130<br />
Schmitt, C 138 Xie, H 83, 120<br />
Schurich, M 31, 34 Xu, L 42<br />
Scott, WG 82 Yamakawa, M 84<br />
Sekimoto, H 38 Yao, GH 44<br />
Sethuraman,S 69, 107 Yarnold, JR 46<br />
Shah, J 82 Yazdi, Y 23<br />
Shi, H 28, 60, 104 Yi, X 43<br />
Shi, J 109 Yoon, JR 118<br />
Shiina, T 27, 84 Yu, W 108<br />
Shimizu, K 86 Zabolotskaya,EA 103<br />
Shipley, S 101 Zagzebski, JA 48, 58, 60, 63, 104<br />
Shousha, S 52, 87 Zhang, Man 130<br />
Sinkus, R 66, 115 Zhang, Mei 43, 44<br />
Sinnett, HD 52, 87 Zhang, PF 43, 44<br />
Smalling, RW 69 Zhang, Y 43, 44<br />
Socrate, S 36 Zheng, YP 94, 108, 109, 129<br />
Sommer, AM 99, 121 Zhu, Y 87<br />
Soni, N 117 Zickler, T 36<br />
SosaCabrera,D 92<br />
Souchon, R 65, 112<br />
Soulez, G 35, 72<br />
Spalazzi, JP 135<br />
Spencer, P 89, 90, 136<br />
Srinivasan, S 26, 40, 117<br />
Stapf, J 105<br />
Stein, U 124<br />
Steiner, H 31<br />
Strackee, J 116<br />
Streekstra, GJ 116<br />
Su, HJ 43<br />
Sumi, C 32, 33, 79, 95, 114<br />
Svensson, WE 52, 87<br />
Tanaka, K 86<br />
Tanter, M 66, 115<br />
Taylor, LS 55<br />
Thijssen, JM 76<br />
Thiruchelvam,PTR 52<br />
ThitaiKumar,A 40, 49, 92, 113<br />
Thomas, A 30, 124<br />
Thompson, A 110<br />
Tohno, E 84<br />
Trahey, GE 56, 57, 134<br />
Treece, GM 74<br />
Trompette, P 65<br />
Tsuji, K 45<br />
Ueno, E 84<br />
Ueno, T 96<br />
Usupbaeva, A 52<br />
Valtorta, D 94<br />
vandenBerg, DMJ 116<br />
Vanderby, R 127, 128<br />
vanderSteen, AFW 67, 68<br />
van Horssen, P 116<br />
22
ABSTRACTS<br />
Fourth International Conference<br />
on the Ultrasonic Measurement and Imaging<br />
of Tissue Elasticity ©<br />
Lake Travis, Austin, Texas, USA<br />
October 16–19, <strong>2005</strong><br />
Guest Lecture<br />
000 LESSONS FROM THE WORLD OF MEDICAL DEVICE COMMERCIALIZATION.<br />
Youseph Yazdi 1 .<br />
1 Corporate Office of Science & Technology, Johnson & Johnson, 410 Ge<strong>org</strong>e Street,<br />
New Brunswick, NJ 08901, USA.<br />
Considerable time and money have been spent on healthcare-related research funded by public and<br />
private sources. We live in a time that is rich with new scientific discoveries and technological advances,<br />
but the translation of these developments into clinically useful therapies is arguably lagging.<br />
This presentation will focus on the trials and tribulations of moving great ideas from a glimmer in the<br />
mind of the inventor to the hands of the physicians. Along the way, some lessons learned for those eager<br />
to see their ideas put to practical use will be described.<br />
Youseph Yazdi, Ph.D., is currently Director, Science & Technology, in the Johnson & Johnson Corporate Office of Science & Technology<br />
(COSAT). Dr. Yazdi looks for new scientific and technological breakthroughs that will lead to the medical devices of tomorrow. His<br />
technology focuses are on MEMS, nanotech, neurotech, energy-based therapeutics and imaging. He is also a member of the Tech<br />
Transfer & Academic Relations team working to improve Johnson & Johnson's outreach to academic/clinician scientists and inventors.<br />
Other duties include promoting scientific excellence and collaboration within the corporation and identifying new growth areas for J&J.<br />
Prior to joining COSAT, Dr. Yazdi held positions in R&D and Business Development at Johnson & Johnson's Ethicon Endo-Surgery<br />
division. Dr. Yazdi graduated from Rice University with the B.S. in Electrical and Computer Engineering and earned his M.S. and Ph.D.<br />
degrees from The University of Texas at Austin. His academic research interests were mainly in Optical and Ultrasonic Tissue<br />
Characterization.<br />
<br />
indicates Presenter<br />
23
Session TUT: Tutorial: Inverse Methods for Shear Stiffness Imaging<br />
Sunday, October 16 1:00P – 3:00P<br />
117 IMAGING SHEAR STIFFNESS TISSUE PROPERTIES USING INVERSE METHODS WHEN<br />
MEASUREMENTS ARE TIME DEPENDENT.<br />
Joyce R. McLaughlin 1 .<br />
1 Rensselaer Polytechnic Institute, 110 8 th Street, Troy, NY 12180, USA.<br />
The goal of this tutorial is to present an overview of inverse methods that can be used to image soft tissue<br />
shear stiffness from time dependent tissue displacements. The targeted experiments include supersonic<br />
imaging, transient elastography, ‘crawling’ and ‘holographic’ waves in sonoelasticity, and single frequency<br />
wave motion measured with ultrasound or MR. In all of these experiments, images of the amplitude of the<br />
wave can be made; this imaging technique does not utilize inverse methods and can provide a reasonable<br />
image when the change in biomechanical properties or the region over which the change occurs is large.<br />
The use of inverse methods enables us to take shear stiffness imaging ‘to the next level’ targeting specific<br />
stiffness properties as well as small, either in amplitude or size, biomechanical changes; the methods can<br />
be applied to phantom, in vitro and in vivo data sets.<br />
There are a number of distinct parts of an inverse method:<br />
(1) the first is that a mathematical model or equation is formulated so that the measured data can<br />
reasonably be predicted as the solution of the equation;<br />
(2) some of the functions in the model, such as the elastic Laḿé parameters, Young’s modulus, or the<br />
shear wave speed are unknown; at least one of these quantities is targeted to be imaged;<br />
(3) after determining that the data set, or sometimes even a subset of the data set, is rich enough to<br />
determine all the targeted quantities, then algorithms are developed that most effectively utilize the<br />
data (sub)set and that are stable when noise is present in the data.<br />
This is a major challenge. For the time-dependent data sets targeted in this tutorial we review:<br />
(a) Methods that utilize the propagating front of a wave or the phase to determine shear wave or phase<br />
wave speed. We include the mathematical model and descriptions of how correlation and<br />
optimization methods can be used to find the front positions, or lines of constant phase: we also<br />
describe direct methods and the arrival time algorithm to determine the wave speed in each case.<br />
(b) Methods that utilize the time Fourier Transform of the data. This procedure divides the data set by<br />
its frequency content where sometimes multiple frequency contents are significant enough to be used<br />
in an inverse algorithm. A broad set of algorithms have been implemented here including direct<br />
methods, methods based on finite element formulations and methods that utilize statistical methods.<br />
In all cases, derivatives of data must be taken, and we include discussion about stable methods for<br />
these calculations.<br />
Acknowledgments: McLaughlin directs IPRPI, the Inverse Problems Center at RPI. She and her<br />
collaborators and working group members are funded by NIH, ONR and NSF.<br />
<br />
indicates Presenter<br />
24
116 INFERRING BIOMECHANICAL PROPERTIES FROM QUASISTATIC DEFORMATIONS: AN<br />
INTRODUCTION TO ASSOCIATED INVERSE PROBLEMS.<br />
Paul E. Barbone 1 .<br />
1 Boston University, Boston, MA 02215, USA.<br />
We consider the problem of quantifying biomechanical properties of soft tissues from ultrasound<br />
measurements of quasistatic deformation. Techniques developed in the context of elastography allow the<br />
measurement in vivo of tissue deformations. Given these measured deformations, then, an inverse<br />
problem to determine the biomechanical properties of the tissue can be formulated.<br />
This tutorial addresses the "What, when, how and who" of this inverse problem in the context of<br />
quasistatic deformation.<br />
What is the problem to be solved? The inverse problem depends on the mathematical model used to<br />
predict the deformation of tissue being observed. For example, one researcher might use a<br />
one-dimensional nonlinear uniaxial stress model; another might use a linear plane-stress model. In the<br />
first part of this tutorial, we discuss which basic physical assumptions underlie each mathematical<br />
model. This knowledge makes clear which physical phenomena are captured and ignored by the various<br />
models considered.<br />
When can the problem be solved? Depending upon the complexity of the mathematical model chosen to<br />
represent the tissue behavior, there may not be enough information in the measured deformation field to<br />
determine all the parameters in the model (i.e. the answer is nonunique). On the other hand, it may be<br />
the case that the measured deformation field has too much inconsistent information, so that no set of<br />
material properties explains all the observations (i.e. no answer exists). The second part of this tutorial<br />
discusses the conditions under which different inverse problems resulting from different mathematical<br />
models can give reliable solutions.<br />
How can the problem be solved? The third part of the tutorial discusses algorithms and methods to<br />
solve the inverse problem. The typical iterative approach requires three steps:<br />
(1) computing a predicted displacement,<br />
(2) checking similarity between measured and predicted displacements,<br />
(3) updating the material properties, and then iterating.<br />
All three of these steps deserve careful attention in practice, and we discuss the considerations in each<br />
case.<br />
Who has solved the inverse problem so far? In the fourth part of the tutorial, we shall review<br />
approaches taken by several researchers in the field and attempt to draw lessons from their collected<br />
experience.<br />
Acknowledgments: It is a pleasure to acknowledge the tutelage and collaboration of Dr. Jeffrey C<br />
Bamber, Professor Assad Oberai, and the BU Biomechanical Imaging Team: Michael Richards, Nachiket<br />
Gokhale, Ricardo Leiderman and Carlos Rivas. This work has been supported in part by CenSSIS (The<br />
Center for Subsurface Sensing and Imaging Systems) under the Engineering Research Centers Program<br />
of the National Science Foundation (Award No. EEC-9986821) and the Department of Defense Breast<br />
Cancer Research Program (Award No. W81XWh-04-1-0763).<br />
<br />
indicates Presenter<br />
25
Session POS: Posters<br />
Sunday, October 16 3:30P – 5:30P<br />
(For Viewing and Discussion through Wednesday, October 19, 4:00P)<br />
006 3D SIMULATION MODELS FOR ULTRASOUND ELASTOGRAPHY.<br />
A. V. Patil 1,2 , T. A. Krouskop 3 , J. Ophir 1,2 , S. Srinivasan 2,4 .<br />
1 University of Houston, Electrical Engineering Department, Houston, TX, USA; 2 University of<br />
Texas Medical School, Diagnostic and Interventional Imaging Department, Houston, TX, USA;<br />
3 Baylor College of Medicine, Houston, TX, USA; 4 Siemens Acuson, Mountain View, CA, USA.<br />
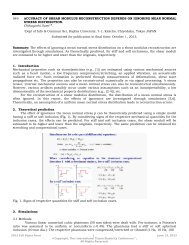
Aim: Previously reported work evaluated the performance of ultrasound elastography using 1D and 2D<br />
simulation models. However, elastography is inherently a 3D problem. This implies that the nature of the<br />
ultrasound pulse used to image the tissue and the tissue motion, which results from the application of<br />
the external compression, is three-dimensional. This work evaluates the elastographic image quality<br />
using realistic 3D geometry and 3D motion conditions.<br />
Background: 2D simulation models lead to over optimistic estimation of elastographic image quality<br />
(signal-to-noise ratio (SNR e ), contrast-to-noise ratio (CNR e ), and spatial resolution). The 2D models<br />
(elevationally narrow ultrasound beam and cylindrical inclusions) and assumptions like plane strain<br />
conditions are inadequate to model the realistic 3D conditions. For homogeneous, isotropic, and<br />
incompressible tissue, the elevational motion due to the external compression results in approximately<br />
one fourth of the axial motion. Coupled with the factor of an unknown elevational beam width this<br />
elevational motion results in a subsequent degradation of the axial elastographic image quality. The<br />
elevational motion increases as one traverses away from the scan plane symmetry, which leads to a<br />
further degradation in the image quality. This means that the strain filter and consequently the CNR e<br />
filter are non-stationary in the elevational direction as they are in the lateral and the axial directions.<br />
However, the non-stationarity is expected to be more pronounced in the elevational direction than the in<br />
axial and the lateral directions due to the sampling limitations in the elevational direction.<br />
Methods: Simulations were performed using 2D and 3D acoustical and mechanical models. A sphere was<br />
used to model the inclusion in 3D, whereas a 2D inclusion was modeled as a cross-section of a cylinder.<br />
The enclosing matrix in 2D was a rectangle (40x40 mm 2 ), whereas in 3D it was a cube (40x40x40 mm 3 ).<br />
The inclusions, in both the 2D and 3D cases, had a cross-sectional radius of 2.5 mm. The simulations<br />
were performed at a 5 MHz center frequency and sampling frequency of 48 MHz. The RF data were<br />
modeled as a 3D convolution of the impulse response of the tissue scatterer function (TSF) and the<br />
system point spread function (PSF). The TSF was modeled as a random normal distribution of the point<br />
scatterers. The PSF was modeled as a Gaussian modulated cosine pulse with 50% fractional bandwidth.<br />
A two-stage hybrid (adaptive displacement + staggered strain) estimator was used to generate<br />
elastograms. The elastograms obtained from the 2D and 3D models were compared using established<br />
image quality factors such as, SNR e , CNR e and spatial resolution.<br />
Results: The elastograms obtained from the 3D models had poorer image quality than the elastograms<br />
obtained from the 2D models, for an applied strain range of 0.7- 8%. The CNR e and the SNR e curves<br />
obtained from the 3D models were statistically lower than those obtained from the 2D models for an<br />
applied strain range of 0.7-8%. Also, the difference between the CNR e curves of the 2D and 3D models<br />
increased as the modulus contrast ratio between the inclusion and the background decreased from 10-<br />
1.5. The elastographic image quality degraded as the scan plane shifted away from the axes of the<br />
elevational symmetry. The degradation in image quality with increasing elevational shift was nonlinear.<br />
The detectability of the inclusion was poorer in the 3D model elastograms than in the 2D model<br />
elastograms. On an average (50 realizations), the inclusions of same size looked smaller in 3D than 2D<br />
model elastograms. The effect can be attributed to the averaging effect of the elevational beamwidth,<br />
which is not incorporated in 2D simulations. The estimated axial and the lateral resolutions of the 2D<br />
and the 3D model elastograms were statistically similar. However, at larger beam-ratios (elevational to the<br />
lateral beamwidth), the estimated axial and the lateral resolutions of the 3D model elastograms were<br />
significantly worse than those of the 2D model elastograms.<br />
Conclusions: 2D simulations make overoptimistic estimation of the elastographic image quality and,<br />
hence, it may not be appropriate to use 2D simulation models to evaluate the performance of ultrasound<br />
elastography for interesting cases of small (< 1.5 mm) and low contrast targets (modulus contrast < 2).<br />
Acknowledgement: Supported by NIH Program Project Grant PO1-CA64597-12 to the University of Texas.<br />
<br />
indicates Presenter<br />
26
012 PRELIMINARY RESULTS OF ELASTICITY IMAGING TO AORTIC PLAQUE.<br />
Takashi Osaka 1 , Takeshi Matsumura 1 , Tsuyoshi Mitake 1 , Satoshi Nakatani 2 , Tsuyoshi Shiina 3 .<br />
1 Research and Development Center, Hitachi Medical Corporation, Chiba, JAPAN; 2 Cardiology<br />
Division, National Cardiovascular Center, Osaka, JAPAN; 3 Graduate School of Systems and<br />
Information Engineering, University of Tsukuba, Ibaraki, JAPAN.<br />
Background and Aims: In general, it is well known that cancer tissue becomes harder compared with<br />
other normal tissues. Our group has developed a real-time tissue elastography imaging system and<br />
continued to evaluate its clinical usefulness for application to <strong>org</strong>ans such as the mammary gland, the<br />
prostate, the thyroid and other areas. In this paper, we report preliminary clinical results for aortic plaque.<br />
Methods: RF image frames are transferred from the ultrasound scanner to an external PC, and these<br />
data frames are reconstructed into elasticity (strain) images with about 12 fps throughput on the PC.<br />
Additional signal and image processing is also accomplished in the PC in off-line mode. Strain images are<br />
obtained by differentiating displacements between neighboring frames. A special feature of the<br />
reconstruction algorithm that we use is based upon the “Combined Autocorrelation Method”, that is,<br />
inter-frame displacements greater than a wavelength are estimated by envelope correlation in addition to<br />
the usual precise autocorrelation method to detect change of phase [1].<br />
For application to the aorta, a transesophageal echocardiography probe (TEE) is used to get RF image<br />
frames via the esophagus, and the variation of aortic blood pressure is used as the compression force<br />
without the need for any external compression devices.<br />
The color-coded elasticity (strain) images are overlaid on the usual B-mode images in a translucent style. Here,<br />
harder areas are depicted in blue and softer areas in red, with intermediate hardness displayed in green.<br />
System details:<br />
Ultrasound Scanner System: Hitachi EUB-8500<br />
External PC: Dell PowerEdge SC1420(3.2GHz Xeon Dual CPU Type)<br />
Probe: EUP-ES52M (Central Frequency 5.0MHz)<br />
Preliminary Results: The patient was a 71 year old male. The plaque is about 2-3mm thick and is<br />
confined in the arrowed region in the transverse-axis B-mode TEE image. The corresponding tissue strain<br />
image obtained using our elastography system shows blue color in the arrowed region. This result<br />
suggests that the plaque might be a hard plaque and doesn’t have potential for abrupt separation. This<br />
result encourages us to apply our system to more clinical study and also extend its application to other<br />
arterial diseases, e.g., arterial sclerosis.<br />
Figure1: Strain Imaging of Aortic Plaque<br />
Reference:<br />
[1] T. Shiina, M.M. Doyley, J.C. Bamber, “Strain Imaging Using Combined RF and Envelope<br />
Autocorrelation Processing”, Proc. of 1996 IEEE Ultrasonics Symp. 1331-1336, 1997.<br />
<br />
indicates Presenter<br />
27
016 TWO-STEP CROSS-CORRELATION METHOD TO IMPROVE IMAGE QUALITY IN ELASTOGRAPHY.<br />
Hao Chen 1 , Hairong Shi 2 , Tomy Varghese 2,3 .<br />
1 Electrical and Computer Engineering, 2 Medical Physics, 3 Biomedical Engineering Departments,<br />
University of Wisconsin-Madison, 1300 University Avenue, 1530 MSC, Madison, WI 53706, USA.<br />
Aims: We propose a new approach that enables the use of window lengths on the order of<br />
1-2 wavelengths that provide strain estimates with similar noise properties as to those obtained with a<br />
10-wavelength window using a two-step technique.<br />
Background: Traditional cross-correlation based strain estimation methods require a window length of at<br />
least 10 wavelengths to obtain reliable strain estimates. Shorter window lengths generally incur more<br />
signal decorrelation with the subsequent strain estimates more contaminated with noise artifacts.<br />
Methods: The first processing step utilizes a window length on the order of 10-20 wavelengths to obtain<br />
coarse displacement estimates between the pre- and post- compression radio frequency data frames. This<br />
coarse displacement is then interpolated and utilized as the initial guess-estimate for the second<br />
processing step in the strain estimation. During the second step of the cross-correlation estimation, the<br />
post- compression window segment length on the order of 1-2 wavelengths is shifted to the initial coarse<br />
displacement position, and a final displacement estimate obtained.<br />
Results: Our results demonstrate that we can easily reduce the window length during the second step of<br />
the processing down to 1~2 wavelengths (about 0.2~0.4 mm for 7.5 MHz transducer), without incurring<br />
significant errors in the strain estimates. Signal-to-noise and contrast-to-noise ratio estimates are also<br />
significantly improved at the smaller window lengths with the two-step processing when compared to the<br />
use of a similar sized window in the traditional method. The selection of first step window length also<br />
does not have a major impact on the results.<br />
Conclusions: The new processing method provides a significant improvement in the axial resolution of<br />
the strain estimates in the elastograms due to the small window lengths utilized and the potential of<br />
obtaining closely spaced strain estimates.<br />
Acknowledgements: This work was supported by NIH grant R21 EB003853.<br />
<br />
indicates Presenter<br />
28
021 REGULARIZATION ISSUES IN YOUNG’S MODULUS RECONSTRUCTION.<br />
J Jiang 1 , T J Hall 1 .<br />
1 Medical Physics Department, University of Wisconsin-Madison, Madison, WI, USA.<br />
Aims: This investigation compares three well-known regularization approaches, namely total variation<br />
regularization [1], Laplacian smoothing regularization [2] and Tikhonov regularization [3], in the<br />
framework of inverse elasticity problems. The mathematical nature of regularization, bias and variance of<br />
results, and computational efficiency were also analyzed.<br />
Background: Tissue modulus imaging reveals intrinsic tissue properties that are otherwise unavailable<br />
thereby aiding analysis of tissue during the pathological evolution of disease and treatment.<br />
Unfortunately, Young’s (or shear) modulus reconstruction is a nonlinear inverse problem that may be<br />
ill-posed. The goal of regularization is to use constraints on the computational problem to obtain a<br />
physically meaningful solution for ill-posed problems.<br />
Methods: Three regularization methods were implemented in conjunction with an iterative modulus<br />
reconstruction approach. In this study, a direct inversion method based on the finite element method<br />
(FEM) [4] was used as an extreme case to demonstrate the effect of no regularization. Experiments with a<br />
computer-simulation phantom are reported to demonstrate the importance of regularization and selection<br />
of the regularization parameters. Specifically, we utilized simulated displacement data from a<br />
two-dimensional finite element model, where a cluster of four circular inclusions (6mm in diameter) were<br />
embedded into a uniform background (40mm square), with an additive displacement noise. The elasticity<br />
contrast between the inclusions and background was 3:1.<br />
Results: Preliminary results demonstrate that the appropriate regularization is important to obtain good<br />
quality modulus estimates. For instance, Zhu et al.’s approach [4] appears to be more efficient and<br />
accurate when the displacement estimates have very high signal-to-noise ratio (SNR, e.g. >50dB).<br />
However, iterative regularized modulus reconstruction methods are necessary to obtain good results with<br />
lower SNR (e.g. 3:1).<br />
Acknowledgements: We are grateful for the support from the USAMRMC (DAMD17-00-1-0596), the NIH<br />
(CA100373), and the University of Wisconsin.<br />
References:<br />
[1] C. R. Vogel and M. E. Oman, "Fast, robust total variation-based reconstruction of noisy, blurred<br />
images," IEEE Transactions on Image Processing, vol. 7, pp. 813-824, 1998.<br />
[2] A. A. Oberai, N. H. Gokhale, and G. R. Feijoo, "Solution of inverse problems in elasticity imaging<br />
using the adjoint method," Inverse Problems, vol. 19, pp. 297-313, 2003.<br />
[3] F. Kallel and M. Bertrand, "Tissue elasticity reconstruction using linear perturbation method," IEEE<br />
Transactions on Medical Imaging, vol. 15, pp. 299-313, 1996.<br />
[4] Y. Zhu, T. J. Hall, and J. Jiang, "A finite-element approach for Young's modulus reconstruction,"<br />
IEEE Transactions on Medical Imaging, vol. 22, pp. 890-901, 2003.<br />
<br />
indicates Presenter<br />
29
022 SIGNIFICANT CLINICAL RESULTS IN THE DIAGNOSIS OF BREAST LESION BY MEANS OF<br />
REAL–TIME ELASTOGRAPHY.<br />
Anke Thomas 1 , Sherko Kümmel 1 , Holger Frey 2 , Glen Kristiansen 1 , Thomas Fischer 1 .<br />
1 Charité – CCM, University Berlin, Berlin, GERMANY; 2 Hitachi Medical Systems, Wiesbaden,<br />
GERMANY.<br />
Aims: The goal of the study consisted of testing the suitability of the method for breast tumour diagnosis<br />
in clinical practice.<br />
Background: Real-time elastography was carried out in 108 candidate patients with histologically<br />
confirmed findings as a new, non-invasive method for the diagnosis of mammary carcinoma.<br />
Methods: Differences between normal and tumour tissue were visualised by measurements of elasticity<br />
properties, based on the elastic deformability of tissue after probe pressure. The study contained<br />
108 female potential breast cancer patients with histologically confirmed focal signs (58 benign,<br />
50 malignant) in the age range of 16 to 84 years old. Evaluation was made with the real-time<br />
elastography method (Hitachi EUB 8500) and was colour-coded and superimposed on the ultrasound<br />
scan in brightness mode (B-mode). The results were compared with the data of previous ultrasound<br />
investigations and histology and were statistically assessed with the aid of matrices and ROC curves. The<br />
ultrasound classification was based on BIRADS and input from Ei Ueno, MD. A second examiner was<br />
employed, in order to evaluate the objectivity of the method.<br />
Results: The study showed that the correspondence between elastography and ultrasound in the BIRADS<br />
classification of mammary carcinoma was good. Assessment in McNemar’s Test gave a weighted kappa of<br />
0.5565 – 0.7751. Benign tissues were recognised with certainty, although malignant findings resulted in<br />
significant differences compared to the histological results which were moreover dependent on the<br />
examiner (p = 0.008/0.012). Overall, elastography possesses a sensitivity of 91% and a specificity of 83%.<br />
The area under the curve (AUC) gave 0.93 for ultrasound and 0.87 for the elastography. Both methods<br />
together showed in the ROC curve a greater AUC (0.94), but it is not significant.<br />
Conclusions: The conclusion is that measurement of tissue elasticity by means of real-time elastography<br />
combined with the familiar B image improves diagnosis of breast lesions. Additionally, the method can be<br />
integrated easily into daily clinical practice.<br />
<br />
indicates Presenter<br />
30
028 SONOELASTOGRAPHY OF THE TESTICLES: PRELIMINARY RESULTS IN THE DIAGNOSIS OF<br />
DIFFERENT PATHOLOGICAL PROCESSES.<br />
L Pallwein 1 , E Pallwein 1 , M Schurich 1 , V Fischbach 1 , H Steiner 2 , F Frauscher 1 .<br />
1 Radiology, 2 Urology Departments, Medical University, Innsbruck, AUSTRIA.<br />
Aims: To assess the value of sonoelastography in the differential diagnosis of inflammatory and<br />
neoplastic disease of the testicles.<br />
Background: In a patient with acute scrotal pain and swelling, the differentiation of neoplastic from<br />
inflammatory processes in the testicles can be difficult and usually a biopsy is required. Elastography of<br />
the testicles may improve the detection of areas with increased stiffness which are suspicious for<br />
neoplastic changes and, therefore, may also improve the differentiaton between neoplastic and<br />
inflammatory processes.<br />
Methods: In 15 patients suffering from scrotal pain and swelling, a routine US examination (B-mode and<br />
color Doppler US) was performed (Acuson Sequoia, Mountainview, Ca, USA). All patients underwent an<br />
additional qualitative measurement of tissue elasticity by using sonoelastography (Hitachi EUB-8500).<br />
These exams were performed by a different uroradiologist, who was blinded to the results of routine<br />
sonography. The stiffness of the lesion was displayed from red (soft) to blue (hard). Hard lesions were<br />
considered as malignant. The diagnostic outcome of the two examinations was compared in each patient.<br />
Results: In 7 patients, routine US was able to detect testicular masses of different size, which were<br />
histologically proven to be neoplastic lesions of different types (germ cell tumor, seminoma, teratoma,<br />
mixed tumors and sarcoma of the tunica albuginea in one case). Elastography was able to detect all these<br />
lesions and enabled the detection of two additional lesions that were not well circumscribed in a patient<br />
suspected to have tumor recurrence in a single testis. Elastography was also able to differentiate between<br />
inflammatory changes and testicular swelling in a patient suspected of diffuse lymphomatous infiltration<br />
based on the differences in tissue stiffness. Inflammatory processes of the testicles showed normal to<br />
decreased tissue stiffness in the suspected areas.<br />
Conclusions: Our preliminary findings showed that in patients with diffuse scrotal swelling and pain, the<br />
sonoelastography improved the detection of testicular masses and allow the differentiation of<br />
inflammatory changes from other pathological processes based on the differences in tissue elasticity.<br />
<br />
indicates Presenter<br />
31
040 SIMULATION STUDY OF RECONSTRUCTION OF SHEAR MODULUS, DENSITY, POISSON’S<br />
RATIO DISTRIBUTIONS – 2ND REPORT.<br />
Chikayoshi Sumi 1 .<br />
1 Sophia University, 7-1 Kioicho, Chiyodaku, Tokyo 102-8554, JAPAN.<br />
Aims: Previously, we proposed 3D and 2D methods to reconstruct the Poisson’s ratio distribution as well<br />
as shear modulus [1]. Furthermore, we proposed to reconstruct density distribution as well to allow<br />
dealing with dynamic deformation [1]. However, due to tissue incompressibility, reconstruction of shear<br />
modulus, Poisson’s ratio, and density become unstable. In this report, to stabilize these reconstructions,<br />
we report a new reconstruction method using mean normal stress as the unknown [2]. This method also<br />
allows stable reconstruction of shear modulus and density under the condition that Poisson’s ratio<br />
remains unknown. The effectiveness is verified through 3D simulations.<br />
Methods: By measuring the acceleration vector i (i = 1-3) and the strain tensor ij (i,j = 1-3) throughout<br />
the 3D ROI, motion equations are dealt with as the simultaneous first order partial differential equations<br />
for unknown distributions of the Lame’s constants of and shear modulus and density , i.e.,<br />
i = ( ) ,j ij +2 ij ,j + 2 ij,j (Equation 1)<br />
Provided that the reference values of the Lame’s constants are given in the ROI, this reconstruction<br />
problem becomes an initial-values problem for the unknown Lame’s constants and density distributions.<br />
To yield the reference value of , the reference value of the Poisson’s ratio can be set in the ROI.<br />
However, since almost soft tissues are considered to be incompressible (0.5; 0), volume strain <br />
generated in soft tissues is very small. This causes reconstruction of Lame’s constants to be unstable.<br />
Thus, by dealing with the mean normal stress p(= ) as unknown in Equation 1 instead of , we realize<br />
stable reconstruction of shear modulus, . In this new method, the reference (initial) values might be set<br />
for both of shear modulus and mean normal stress (reference is needless for density). However, since it is<br />
difficult to directly measure the mean normal stress, when reference region is incompressible<br />
(0.5; ), the reference value of mean normal stress p cannot be set. Furthermore, neither Poisson’s<br />
ratio nor mean normal stress might be reconstruction targets. In these cases, we determine only shear<br />
modulus under the condition that the mean normal stress remains unknown. As we utilize the iterative<br />
method (specifically, conjugate gradient method) to solve this problem for shear modulus and mean<br />
normal stress, by setting only reference shear moduli we stably obtain a unique shear modulus<br />
reconstruction and biased mean normal stress reconstruction (dependent on the initial distribution<br />
(value) used for the iterative method). If homogeneous region of exists in the ROI, reference region of <br />
can be set into the region, and the reference value set at an arbitrary value and volume strain are also<br />
used. When the tissue is not incompressible and Poisson’s ratio (or ) is target as well, reference of<br />
Poisson’s ratio need to be set. Reference density can also be used instead of reference shear modulus [2].<br />
In order to cope with occurrence of the improper configurations and noise-contamination, regularization<br />
is performed respective for unknown mechanical properties distributions.<br />
Results: The cubic phantom (50mm sides) includes a spherical inclusion (radius 5mm) at the center<br />
(depth 25.0mm) having twice as high a shear modulus as that of the surrounding medium, i.e.,<br />
2.0H105N/m 2 vs. 1.0H105N/m 2 . The Poisson’s ratio of the inclusion is 0.4, while the value of the<br />
surrounding medium is 0.47. Density is uniformly 1.0g/cm 3 . Noise-filled measurement data of<br />
displacement vector were simulated by adding white noise to the calculated raw displacement vector<br />
data. Regularization yields stable quantitative reconstructions. Figures 1a and 1b respectively show<br />
regularized and non-regularized shear modulus reconstructions obtained (i) without reference value of<br />
mean normal stress (mean values at central square region (5.0mmH5.0mm), 1.76 vs. 1.84), while<br />
Figures 1c and 1d respectively show regularized and non-regularized Poisson’s ratio reconstructions<br />
obtained (ii) with reference value of mean normal stress (mean values, 0.416 vs. 0.396) (density omitted).<br />
Conclusions: The developed method realizes stable reconstruction.<br />
<br />
indicates Presenter<br />
32<br />
Figure 1: Reconstructions<br />
References:<br />
[1] Sumi, “Simulation study of reconstruction of shear modulus, density,<br />
Poisson’s ratio distributions,” Proc. 3rd Int. Conf. Ultrason. Meas. Imag.<br />
Tissue Elasticity, p. 88, 2004.<br />
[2] Sumi, “Reconstruction of shear modulus distribution together with<br />
Poisson’s ratio distribution and Density Distribution,” Proc. of IEEE<br />
EMBS Conf (CD-ROM), Sep <strong>2005</strong>.
042 THERMAL PROPERTIES RECONSTRUCTION BASED ON TEMPERATURE<br />
MEASUREMENT - 2ND REPORT.<br />
Chikayoshi Sumi 1 .<br />
1 Sophia University, 7-1 Kioicho, Chiyodaku, Tokyo 102-8554, JAPAN.<br />
Aims: At the last conference, we reported methods to reconstruct thermal properties such as<br />
conductivity, capacity and diffusivity in addition to the mechanical properties for diagnosis and treatment<br />
(planning). Temperature distribution can be measured by ultrasonic imaging and MRI. Provided that the<br />
reference values of thermal properties are given in the ROI as initial conditions, by solving the<br />
simultaneous first order partial differential equations (heat transfer equations) having the heat flux field<br />
as inhomogeneous coefficients, we can determine the thermal properties distributions. In this report, we<br />
focus on non-steady case, in which respective thermal properties distributions are regularized using<br />
different regularization parameters. To verify the feasibility of the method, simulations and ultrasonic<br />
phantom experiments were conducted [1].<br />
Methods and Results:<br />
(1) Simulations: Our 3D techniques were evaluated using a cubic phantom (50.0mm sides) containing a<br />
central spherical region (diameter=5.0mm) which had twice as high conductivity and specific heat as those<br />
of the surrounding medium, i.e., 1.0 vs. 0.5W/(mK), and 8,400 vs. 4,200J/(KKg). The uniform density was<br />
1,000 kg/m 3 . A cubic ROI (30.0mm sides) was set at the center of the phantom. The phantom temperature<br />
was a uniform 36.0ºC. One surface was fixed at 36.0ºC, and the temperature of the opposite surface was<br />
heated with 46.0ºC stepwise. The following two cases were dealt with.<br />
(Case 1) Figure 1 shows the reconstructed conductivity, capacity, diffusivity (bird’s eye views of<br />
z = 25.0mm) obtained using two pairs of subsequent temperature distributions (1,000sec and 2,000sec,<br />
surface of x = 0.0mm was heated). The proper reference region was set at the surface of the ROI having<br />
higher temperatures. As shown, the thermal properties were stably reconstructed.<br />
(Case 2) Reconstructions were stably obtained using two paired subsequent temperature distributions<br />
generated by different heat source positions, i.e., temperatures having opposite heat fluxes generated by<br />
respectively heating opposite surfaces (surfaces of x = 0.0mm and x = 50.0mm). The reference region<br />
was set at the surface of the ROI, i.e., x = 10.0mm.<br />
Table I summarizes means of the conductivity, capacity, and diffusivity evaluated at the central square<br />
region (5.0H5.0mm) of the spherical region. In both cases, the thermal properties were quantitatively<br />
evaluated.<br />
(2) Phantom experiments: An agar phantom (height=50mm) was used (3.87%). A cylindrical<br />
inhomogeneous region (diameter=15mm) was made at the depth of 25mm using small amount of copper<br />
powder. The phantom was heated by hot water from the under side. Temperature was measured using<br />
our previously developed phase matching method by measuring generated strains due to thermal effect.<br />
In Figure 2, (a) B-mode image, (b) measured temperature (strain), (c) conductivity, (d) capacity,<br />
(e) diffusivity are shown. The inhomogeneous region was detected in these images (mean value of square<br />
region of 6.5H5.8mm vs. reference value: conductivity, 0.700 vs. 0.625W/(mK); capacity, 3.18 vs.<br />
4.20H10 6 J/(m 3 K); diffusivity, 2.20 vs. 1.49H10 -7 m 2 /s).<br />
Figure 1: Reconstructions of Thermal Conductivity, Capacity, Diffusivity (Case 1).<br />
Table I: Mean Values of Thermal Conductivity k, Capacity c, Diffusivity k/c.<br />
Figure 2: Phantom experiments:<br />
(a) B-Mode Image<br />
(b) Measured Temperature (Strain)<br />
(c) Conductivity<br />
(d) Capacity<br />
(e) Diffusivity<br />
Conclusions: These thermal properties were quantitatively reconstructed for agar phantoms as well as<br />
simulated phantoms. In vivo data will be reported soon.<br />
References: [1] Sumi, “Reconstruction of thermal peoperty distributions,“ Proc of IEEE EMBS Conf (CD-ROM), Sep <strong>2005</strong>.<br />
<br />
indicates Presenter<br />
33
044 REAL-TIME ELASTOGRAPHY FOR PROSTATE CANCER DETECTION:<br />
PRELIMINARY EXPERIENCE.<br />
Eva Pallwein 1 , Leo Pallwein 1 , Matthias Schurich 1 , Wolfgang Horninger 2 , Ferdinand Frauscher 1 .<br />
1 Radiology 2, 2 Urology Departments, Medical University, Innsbruck, AUSTRIA.<br />
Aims: For the first time, we used real-time elastography for the detection of prostate cancer.<br />
Background: Since most solid tumors differ with regard with their consistency from the deriving tissue,<br />
elastography may offer a new tool for cancer detection.<br />
Methods: We examined 15 patients (mean age: 56 ± 6.2 years; range: 46 - 71 years). All patients had the<br />
diagnosis of biopsy proven prostate cancer with a mean PSA of 4.6 (range, 1.4 - 16.1). All patients were<br />
scheduled for radical prostatectomy. We used a Voluson 730 (GE Ultrasound) US system with a 7.5 MHz<br />
transrectal transducer. The US examinations were performed by two investigators and interpreted in<br />
consensus. Cancer location and size was determined in the elastography mode. A single pathologist<br />
performed pathological classification of tumor localization, grade and stage. The real-time elastography<br />
findings were compared with pathological findings.<br />
Results: Radical prostatectomy was performed in all cases without major complications. All patients had<br />
a pT2 tumor on pathohistological examination. The Gleason score of our patients varied between 5 and 9.<br />
The tumor size varied from 0.2 to 3.5 cm (mean: 1.1 cm). Thirty-two foci of prostate cancer were present<br />
at pathologic evaluation. Multiple foci of cancer were found in 13 of the 15 glands (87%). Real-time<br />
elastography detected 28 of 32 cancer foci (sensitivity: 88%). Four sites were false-positive with no<br />
pathological abnormality. The patient by patient analysis demonstrated that real-time elastography<br />
detected at least one cancer foci in each of the 15 patients. The limitations of our study were: a relatively<br />
small number of patients and the lack of data on inter- and intra-observer variability. The elastographic<br />
findings were evaluated for the presence of cancer only, and so we had no data about elastographic<br />
findings in BPH or other benign diseases.<br />
Conclusions: Our data demonstrate that real-time elastography allows for detection of prostate cancer<br />
and estimation of tumor localization and size. Real-time elastography has shown to be capable for<br />
visualizing differences in tissue elasticity. Four sites with false positive findings on elastography and no<br />
pathohistological correlation were found in our study only. These findings were obtained in our first<br />
5 patients (learning curve!). In summary, real-time elastography of the prostate is a unique imaging<br />
modality with a great potential for the detection of prostate cancer.<br />
<br />
indicates Presenter<br />
34
055 AN APPLICATION OF THE LAGRANGIAN SPECKLE MODEL ESTIMATOR TO NON-INVASIVELY<br />
CHARACTERIZE THE CAROTID ARTERY: SIMULATION INVESTIGATIONS.<br />
Elizabeth Mercure 1 , Roch L. Maurice 1 , Gilles Soulez 2 , Guy Cloutier 1 .<br />
1 Laboratory of Biorheology and Medical Ultrasonics, 2 Department of Radiology, University of<br />
Montréal Hospital, Montréal, Quebec, CANADA.<br />
Aims: Atherosclerosis is a disease that often leads to plaque rupture. It has been suggested that this<br />
event is initiated by an alteration of the arterial wall elastic properties, and it was shown that these<br />
properties can be assessed by measuring the strain within the arterial wall. Ultrasound elastography<br />
techniques have been developed to assess the mechanical properties of soft tissue using measurements of<br />
strains. A model based on the Lagrangian description of speckle motion, known as the Lagrangian<br />
Speckle Model Estimator (LSME), allows the computation of the strain distribution inside the vessel wall<br />
using radio-frequency (RF) data acquired non-invasively. However, these RF images are rarely obtained<br />
under optimal scanning conditions. For the characterization of the carotid arterial wall, the positioning of<br />
the probe is impeded by the restricted area of the neck, and since this artery is often tortuous, this leads<br />
to errors in the estimation of the strain. Therefore, the motivation of this study was first to demonstrate<br />
the effectiveness of the LSME, using simulated RF data, for the case of an ideal probe and vessel position.<br />
A second motivation was to evaluate the errors of estimation coming from an off-axis probe position or<br />
when the vessel axis is inclined in the image.<br />
Methods: The modeling was achieved with realistic parameters corresponding to the specifications of the<br />
ES500RP (Ultrasonix, Vancouver, Canada) ultrasound system equipped with a 7 MHz linear array probe. The<br />
kinetics and geometry of a three-dimensional model of a homogenous common carotid artery were simulated<br />
using a commercial finite element software (Ansys, release 8.1). To validate the method, theoretical<br />
elastograms (axial strain distributions) obtained with Ansys were compared to those computed with the LSME<br />
on longitudinal sections of the simulated artery. These longitudinal sections were taken at the mid-plane of<br />
the straight 3D model, off its axis and at the mid-plane of an inclined version of the same model.<br />
Results: The results showed an underestimation of the mean axial strain by around 3% under ideal scan<br />
conditions. Such an underestimation is, at least, partly explained by the image-formation model used to<br />
simulate RF data and by the windowing process required by the LSME. In the case of the images<br />
simulating an off-axis probe position, the out-of-plane motion causes the strain to be underestimated<br />
with the error increasing with distance away from the longitudinal axis. In the case when the vessel is<br />
rotated, the axial strain is also underestimated with the error increasing with the angle of rotation<br />
according to a simple trigonometric function.<br />
Conclusions: Overall, the LSME showed promising results for the characterization of vascular tissues.<br />
However, in order to avoid any significant errors in the estimation of the axial strain due to the<br />
inclination of the vessel, one should be able to correct the strain results using the measured angle in the<br />
image, as it is done with Doppler ultrasound.<br />
<br />
indicates Presenter<br />
35
058 NON-RIGID SOFT TISSUE TRACKING WITH THREE-DIMENSIONAL ULTRASOUND.<br />
P Jordan 1,3 , T Zickler 1 , S Socrate 2 , RD Howe 1,3 .<br />
1 Harvard University, Division of Engineering and Applied Sciences, Cambridge, MA, USA;<br />
2 Massachusetts Institute of Technology, Departmant of Mechanical Engineering, Cambridge, MA,<br />
USA; 3 Harvard-MIT Division of Health Sciences and Technology, Cambridge, MA, USA.<br />
Aims: The primary focus of our research efforts is modeling the mechanical behavior of soft tissues for<br />
surgical simulation and virtual surgical environments. Our current tissue characterization approach<br />
combines traditional indentation testing with three-dimensional ultrasonic imaging. Estimates of<br />
complete deformation fields obtained through imaging are incorporated into an iterative finite-element<br />
modeling (FEM) scheme [1] to identify tissue-specific parameters of a physically based nonlinear<br />
poro-viscoelastic constitutive law [2, 3]. Our preliminary work suggests that deformation fields obtained<br />
from traditional optical flow techniques [4, 5] suffer from prohibitively high levels of noise present in<br />
ultrasound images. To address this, we present a non-rigid motion tracking technique that combines<br />
local optical flow measurements with a deforming finite-element model to improve motion estimates in<br />
noisy datasets.<br />
Methods: Characteristic force displacement relationships are obtained from an indentation of porcine<br />
liver while imaging with 3D ultrasound (Philips SONOS 7500 Live 3D Echo, Philips Medical Systems,<br />
Andover, MA, USA), providing the ability to estimate the complete three-dimensional deformation field of<br />
the sample under indentation. Since good textural information is required for differential optical flow<br />
techniques, principal component analysis is used to quantify local textural content and provide<br />
confidence values associated with local motion estimates. A sparse set of local estimates of optical flow is<br />
computed in regions with high confidence values by a modified version of the Lucas-Kanade algorithm [5].<br />
A finite-element model, reflecting tissue sample geometry, boundary conditions, and predetermined<br />
constitutive law parameters, is registered to the ultrasound volume and used to properly constrain and<br />
interpolate the sparse optical flow estimates. The resulting non-rigid tracking method relies on optical<br />
flow estimates in regions of significant texture and on displacement estimates from FEM in regions<br />
without trackable features. In future work, we plan to implement the proposed approach in an iterative<br />
framework where the computed deformation fields are used to refine the estimates of the FEM<br />
constitutive parameters.<br />
Results: We present preliminary results comparing deformation fields obtained from traditional optical flow<br />
methods of Horn and Schunck [4] and Lucas-Kanade [5] to those obtained from FEM-constrained optical<br />
flow. Tracking accuracy is evaluated on an indentation trial of porcine liver with embedded markers and<br />
synthetically generated motion scenes with varying levels of image noise. We demonstrate robustness of<br />
motion estimates in noisy datasets and reduced levels of multi-frame flow accumulation error.<br />
Acknowledgments: This work is supported by the U.S. Army Medical Materials Acquisition Research<br />
Command, contract number DAMD 17-01-1-0677.<br />
References:<br />
[1] Kerdok AE, Jordan P, Liu Y, Wellman PS, Socrate S, Howe RD. Identification of Nonlinear Constitutive<br />
Law Parameters of Breast Tissue. Proc. of the <strong>2005</strong> Summer Bioengineering Conference, ASME, <strong>2005</strong>.<br />
[2] Socrate S, Boyce MC. A constitutive model for the large strain behavior of cartilage. In <strong>Proceedings</strong> of<br />
2001 Bioengineering Conference, volume 50, pages 597-598. ASME, 2001.<br />
[3] Febvay S, Socrate S. Biomechanical modeling of cervical tissue: a quantitative investigation of<br />
cervical funneling. In ASME Int. Mechanical Engineering Congress and Exposition (IMECE), 2003.<br />
[4] Horn BPK, Schunck BG. Determining optical flow. Art. Intelligence, 16(1-3):186–203, August 1981.<br />
[5] Lucas BD, Kanade T. An iterative image registration technique with an application to stereo vision.<br />
Proc. of the 7th Inter. Joint Conf. on Artificial Intelligence (IJCAI ’81), pages 674–679, April 1981.<br />
<br />
indicates Presenter<br />
36
060 DETECTION OF NON-DEFORMABLE OBJECTS IN THE BODY USING ULTRASOUND<br />
ELASTICITY IMAGING.<br />
Unmin Bae 1 and Yongmin Kim 1 .<br />
1 Electrical Engineering and Bioengineering Departments, University of Washington, Seattle, WA, USA.<br />
Background: Ultrasound elasticity imaging has focused on differentiating among soft tissues with<br />
different elasticity moduli, such as detecting relatively hard cancerous breast tissue and analyzing the<br />
composition of atherosclerotic plaques. While the Young’s modulus of soft tissue falls in the range of kPa,<br />
bone, calcifications and many implanted objects, such as brachytherapy seeds, have a much higher<br />
Young’s modulus, e.g., above 1 MPa. Since these objects are hardly compressed with the small force<br />
applied in ultrasound elasticity imaging, they may be considered as non-deformable objects in ultrasound<br />
elasticity imaging. Detection of these objects is clinically important for the diagnosis and treatment of<br />
pathologies, such as determining the type of an atherosclerotic plaque and evaluating the efficacy of a<br />
brachytherapy procedure compared to the pre-implant plan. Using ultrasound, these non-deformable<br />
objects usually appear hyperechoic in B-mode images. However, they may be confused by bright speckles<br />
and/or strong echo spots, such as those caused by air bubbles introduced during brachytherapy. Since<br />
elasticity imaging is based on stiffness rather than echogenicity, it may be useful for detection of the nondeformable<br />
objects, such as brachytherapy seeds [1].<br />
Methods: We have conducted simulation and experiments to evaluate ultrasound elasticity imaging for<br />
detecting the non-deformable objects, specifically calcifications and brachytherapy seeds. Since the<br />
atherosclerotic calcification process is similar to bone formation and one of the main components of<br />
atherosclerotic calcifications is calcium hydroxyapatite [2], we embedded bone fractions and precipitates<br />
of calcium hydroxyapatite with a volume of several mm 3 into agar phantoms. The cylindrical<br />
brachytherapy seeds with a length of 4.5 mm and a diameter of 0.8 mm were embedded in agar<br />
phantoms and in an ex vivo porcine prostate gland with about 5 mm space between seeds. In<br />
experiments, ultrasound data were acquired by a Hitachi EUB-6000 ultrasound system (Hitachi Medical<br />
Corp., Japan) with a 7.5 MHz linear array transducer. In simulation, an object having a hard inclusion<br />
with a diameter of 1 mm was generated, and the elasticity modulus contrast between the inclusion and<br />
the background was varied up to 1000 to accommodate the modulus contrast between soft tissue and the<br />
non-deformable objects. For elasticity imaging, axial compression was applied and the angular strain<br />
method [3] estimated the resulting strain.<br />
Results: In simulation, increasing the modulus contrast between the inclusion and the background<br />
increases the strain contrast to noise ratio although the slope of the increment is quickly reduced as the<br />
modulus contrast increases beyond 10. The improved strain contrast with a high modulus contrast<br />
helped the visual recognition of the 1 mm inclusion. In experiments, the bone fractions and precipitates<br />
of calcium hydroxyapatite in the agar phantoms were clearly visible in the strain images. The longitudinal<br />
and cross sections of brachytherapy seeds in agar phantoms showed the reverberation effect and the<br />
dimension of seeds in the axial direction appears larger than the actual dimension in both B-mode and<br />
strain images, making seed detection easier. The brachytherapy seeds embedded in the porcine prostate<br />
did not show the strong reverberation effect seen with the seeds in agar phantoms, but were still readily<br />
detectable in the strain images.<br />
Conclusions: The results from simulation and experiments indicate the feasibility of ultrasound elasticity<br />
imaging for detecting non-deformable objects in the body. Ultrasound elasticity imaging would provide<br />
complementary information to B-mode imaging, helping identification of the non-deformable objects. The<br />
capability to image both soft tissue and non-deformable objects could make ultrasound imaging more<br />
attractive for diagnosis and treatments.<br />
References:<br />
[1] Rossignol G, Souchon R, Angel YC, and Chapelon JY. Using elastography to detect brachytherapy seeds: a<br />
feasibility study. The 1 st International Conference on the Ultrasonic Measurement and Imaging of Tissue<br />
Elasticity, Ontario, Canada, 2002.<br />
[2] Wexler L, Brundage B, Crouse J, Detrano R, Fuster V, Maddahi J, Rumberger J, Stanford W, White R, and<br />
Taubert K. Coronary artery calcification: pathophysiology, epidemiology, imaging methods, and clinical<br />
implications. A statement for health professionals from the American Heart Association. Circulation, 94:1175-<br />
1192, 1996.<br />
[3] Bae U and Kim Y. Angular strain method for strain estimation in ultrasound elasticity imaging. The 4 th International<br />
Conference on the Ultrasonic Measurement and Imaging of Tissue Elasticity, Austin, Texas, USA, <strong>2005</strong>.<br />
<br />
indicates Presenter<br />
37
064 ABSOLUTE ELASTICITY ESTIMATION WITH A NEW ULTRASONIC-MECHANICAL DEVICE.<br />
T. Sato 1 , Y. Fukuyama 1 , Y. Watanabe 1 , S. Goka 1 , H. Sekimoto 1 .<br />
1 Faculty of Urban Liberal Arts, Tokyo Metropolitan University, Tokyo, JAPAN.<br />
Aims: Absolute measurement of tissue elastic modulus is extremely important for assessing tissue<br />
properties, and is a goal of sonography. In this study, as the first step in absolute measurement of tissue<br />
elastic modulus, we have developed a device that estimates the absolute elastic modulus of layered tissue<br />
by obtaining strain images from pre- and post-compression datasets and accurately detecting the<br />
compression force to the complex tissue.<br />
Background: Relative elasticity reconstruction of complex tissue has been successful using the technique<br />
of static elastography [1], but estimating the absolute elasticity of each of various layers or units in actual<br />
biological tissue is still difficult. Here we develop an original device, which measures the absolute<br />
elasticity of complex tissue by combining the static measuring method of Young’s modulus with a<br />
technique of the ultrasonic strain imaging.<br />
Methods: An experimental device was developed based on the understanding that absolute estimation<br />
can be accomplished by adding a mechanical approach to static elastography. The device measures the<br />
loaded force F with a compression board attatched to a microbalance, and obtains sonograms with a<br />
transducer placed in the center of the compression board. In the sonograms of a rectangular-shaped twolayered<br />
phantom with known dimensions, the device detected the boundaries between the layers and the<br />
displacements in each layer, where the absolute Young’s modulus E was estimated with with the<br />
following equation:<br />
E = (Fg/S) / (L/L)<br />
where F is the value on the balance, g is the acceleration of gravity, S is the area of the top and the<br />
bottom of the phantom, L is the height of the phantom, and L is the compression stroke controlled with<br />
a motorized stage.<br />
Results: Experiments comfirmed the effectiveness of this device. Two-layered cylindrical phantoms with<br />
radii of 22 mm were used. Each phantom had an upper layer with a thickness of 6.3 mm and a Young’s<br />
modulus of 93.3 kPa and a lower layer with a thickness of 4.0 mm and a Young’s modulus of 46.8 kPa.<br />
The thickness and Young’s modulus estimated by our device, 6.2 mm and 90.3 kPa at the upper layer<br />
and 4.0 mm and 49.0 kPa at the lower layer, corresponded with the known values.<br />
Conclusions: The next steps in absolute measurement of tissue elasticity in situ should be directly<br />
attaching the compression board and the transducer to the microbalance and performing structural<br />
analysis of various geometries of complex tissues obtained from sonograms.<br />
Reference:<br />
[1] A. R. Skovoroda, S. Y. Emelianov and M. O’Donnell: Tissue Elasticity Reconstruction Based on<br />
Ultrasonic Displacement and Strain Images, IEEE. Trans. Ultrason., Ferroelect., Freq., Cont., Vol.42,<br />
No.4, 747-765, 1995.<br />
<br />
indicates Presenter<br />
38
066 THE FEASIBILITY OF USING ELASTOGRAPHIC TECHNIQUES FOR ASSESSING MEAT<br />
QUALITY ATTRIBUTES.<br />
Raffaella Righetti 1 , Jonathan Ophir 1 , Rhonda K. Miller 2 , Thomas A. Krouskop 1,3 .<br />
1 The University of Texas Health Science Center at Houston, 6431 Fannin St., Houston, TX 77030,<br />
USA; 2 Texas A&M University, College of Agriculture and Life Sciences, 2471 TAMU, College Station,<br />
TX 77843, USA; 3 Baylor College of Medicine, One Baylor Plaza, Houston, TX 77030, USA.<br />
Aim: To study the feasibility of using elastographic methods for assessing meat quality as reflected in the<br />
stiffness, water holding capacity and the amount of unbound water that characterize different meat samples.<br />
Background: Currently, beef carcasses are graded by human subjective evaluation. Because the grading<br />
process is based on expected differences in palatability, which include physiological age and marbling, high<br />
variations exist within a quality grade. In the last several years, many efforts have been made to find objective<br />
technologies for assessing meat quality that could replace the human subjective evaluations. In this paper, we<br />
investigated the feasibility of using elastographic techniques for predicting some porcine meat quality attributes.<br />
Methods: Data were acquired from porcine skeletal muscles harvested from meat that was characterized<br />
by one of the most important porcine meat quality-defect conditions: PSE (Pale, Soft and Exudative), a<br />
condition that is characterized by a pale color, a soft texture and a low water holding capacity; and DFD<br />
(Dark, Firm and Dry), a condition that is characterized by a darker than normal color, a stiff texture and<br />
a high water-holding capacity. For comparison, elastographic experiments were also performed on ovine<br />
livers, which are known to be more homogeneous and isotropic tissues. Optical images, sonograms, axial<br />
strain elastograms, strain ratio elastograms, poroelastograms and strain ratio time constant elastograms<br />
were generated from the three types of tissues. Statistical analyses were carried out to compare the<br />
spatial and temporal elastic and poroelastic distributions observed for the various tissue samples.<br />
Results: The preliminary results of this study suggest different spatial and temporal behaviors in the three<br />
types of tissues that were investigated. In the spatial domain, all porcine muscle tissues appear to behave<br />
as spatially complex structures, with some areas characterized by different elastic and compressibility<br />
properties. Distinct spatial elastic features were consistently observed in the elastograms obtained from the<br />
porcine muscle samples. These spatial features appeared to follow the general direction of the anisotropic<br />
muscle fiber orientation and are to be contrasted with the lack of such features in the elastograms obtained<br />
from the liver samples. The liver tissue appeared to be more homogeneously elastic, isotropic and nearly<br />
incompressible. Similarly, in the temporal domain, each of the tissues showed a different behavior. Figure 1<br />
shows the histograms of the strain ratio distributions for the three different types of tissue with time.<br />
Observe that the two PSE histograms exhibit a time-dependent increase in skewness towards lower strain<br />
ratios, while both the two DFD histograms and the two liver histograms were found not to have statistically<br />
significant differences in their means, medians, or modes and their strain ratio distributions appeared<br />
nearly constant with time. It is hypothesized that these temporal behaviors are related to the different<br />
tissue elastic properties, permeability and unbound water contents.<br />
Conclusions: These preliminary results suggest that elastographic techniques may have significant<br />
potential for predicting meat quality attributes based on the tissue stiffness, water content and water<br />
motility. However, larger statistical studies as well as independent mechanical measurements of the<br />
elastic and poroelastic properties of the tested tissues are required to confirm these expectations.<br />
Acknowledgements:<br />
This work was supported by NCI Program<br />
Project PO1-CA64597. The porcine muscle<br />
samples used for the study were courtesy of<br />
Texas A&M University.<br />
Figure 1<br />
<br />
indicates Presenter<br />
39
067 NOVEL STRAIN ELASTOGRAPHIC TECHNIQUES.<br />
Raffaella Righetti 1 , Arun Thitai Kumar 1,2 , Seshadri Srinivasan 1,2,3 , Jonathan Ophir 1,2 ,<br />
Thomas A. Krouskop 1,4 .<br />
1 The University of Texas Health Science Center at Houston, 6431 Fannin St., Houston, TX 77030,<br />
USA; 2 University of Houston Cullen College of Engineering, 4800 Calhoun Rd., Houston, TX<br />
77204, USA; 3 Siemens Acuson Ultrasound, 1230 Shorebird W., Mountain View, CA 94043, USA;<br />
4 Baylor College of Medicine, One Baylor Plaza, Houston, TX 77030, USA.<br />
Aim: To report on the novel elastographic image methodologies that have been developed in our<br />
laboratory during the last few years and elucidate the information contained in the various types of strain<br />
elastograms about the corresponding mechanical properties of the imaged material.<br />
Background: Initial work in the field of elastography was exclusively based on the estimation of local<br />
axial tissue displacements and strains [1]. Later, elastographic methods were also extended to estimate<br />
the additional parameters of local lateral and elevational displacements and strains [2]. These<br />
parameters, combined with further studies, opened the way for the generation of new types of<br />
elastograms, which have been referred to as the Poisson’s ratio elastogram, the shear strain elastogram,<br />
the poroelastogram, the Poisson’s ratio time constant elastogram and the permeability elastogram. This<br />
report summarizes the elastographic imaging methodologies that have been developed to create the<br />
various types of strain elastograms, with particular emphasis on the recently developed techniques,<br />
which allowed generation of these newer types of elastograms. This study also investigates the<br />
connections between the various elastographic images and the underlying mechanical properties of the<br />
material that is imaged.<br />
Methods: Simulations, phantom experiments and statistical analyses were performed to explain the<br />
procedures that allow generation of axial strain, lateral strain, Poisson’s ratio, shear strain, Poisson’s<br />
ratio time constant and permeability elastograms and poroelastograms and investigate how these<br />
elastograms relate to the corresponding ideal strain and mechanical property distributions, such as<br />
elastic modulus, Poisson’s ratio, permeability and connectivity.<br />
Results: The results obtained from the recent studies carried out in our laboratory suggest that, under a<br />
range of conditions of clinical interest, there exists good correlations between:<br />
1) axial strain elastograms and the corresponding elastic modulus distribution;<br />
2) Poisson’s ratio elastograms and the corresponding Poisson’s ratio distribution;<br />
3) Poisson’s ratio time constant elastograms and the corresponding permeability distribution; and<br />
4) shear strain elastograms and the corresponding internal connectedness of the materials.<br />
Conclusions: We have summarized our recent developments in the elastographic field, which yield new<br />
types of strain elastograms, and we have shown that there is a relationship between the several types of<br />
elastograms and the corresponding underlying mechanical properties of the material. The good<br />
correlation between the various elastographic images and the corresponding mechanical distributions<br />
suggests the potential of elastography to convey complementary information on the mechanical properties<br />
that govern the behavior of the material that is imaged. It is expected that the combined information<br />
derived from these different elastographic techniques will provide a powerful tool to understand the local<br />
mechanical behavior of a material.<br />
Acknowledgements: This work was supported by NCI Program Project PO1-CA64597-12.<br />
References:<br />
[1] Ophir J, Cespedes EI, Ponnekanti H, Yazdi Y, Li X. Elastography: a quantitative method for imaging<br />
the elasticity of biological tissues. Ultrasonic Imaging, 1991; 13:111-134.<br />
[2] Konofagou EE, Ophir J. A new elastographic method for estimation and imaging of lateral<br />
displacements, lateral strains, corrected axial strains and Poisson’s ratios in tissues. Ultrasound in<br />
Medicine and Biology. 1998. 24: 1183-1199.<br />
<br />
indicates Presenter<br />
40
070 VISCOELASTIC CHARACTERIZATION OF THERMAL LESIONS IN LIVER.<br />
M.Z. Kiss 1 , T. Varghese 1,2 .<br />
1 Medical Physics, 2 Biomedical Engineering Departments, 1300 University Ave., Room 1530,<br />
University of Wisconsin-Madison, Madison, WI, USA.<br />
Aims: The viscoelastic properties of thermal lesions in animal liver have been investigated. The success of<br />
elastography depends in part on the modulus contrast in the image, which in turn depends on accurate<br />
determination of the tissue’s modulus. The stiffness properties of thermal lesions created in the liver may<br />
provide a certain means to ascertain whether the ablation procedure was successful in inducing complete<br />
thermal necrosis of cancerous tissue.<br />
Background: Manual palpation is used extensively to detect lesions in <strong>org</strong>ans such as the liver. This is<br />
due to the fact that pathologic and stiffness changes in the body are generally well correlated.<br />
Elastography has shown some utility in imaging lesions, which may be too deep in the body or otherwise<br />
transparent to conventional ultrasound. The elastogram can be used to study the variations in the<br />
stiffness of thermal lesions in tissue as a function of lesion temperature. The success of elastography<br />
depends in part on the modulus contrast in the image, which in turn depends on accurate determination<br />
of the tissue’s modulus.<br />
Methods: Normal tissue from canine and porcine livers were excised from bulk tissue and cut to a useful<br />
geometry (typically cylindrical 20 mm in diameter and 3 – 6 mm in height). Lesions were prepared either<br />
through double immersion boiling or radio frequency ablation at several temperatures from 60°C – 90°C<br />
and placed in Bose/Enduratec ELF 3220, a dynamic testing device. The complex modulus was<br />
determined by applying a periodic strain amplitude of 1% (with a precompression strain of 1%), and a<br />
frequency from 0.1 – 50 Hz, and then measuring the force response at the load cell.<br />
Results: Experiments show that the complex modulus for both normal tissue and thermal lesions<br />
generally increased with increasing frequency from 4 kPa at 0.1 Hz for normal tissue to more than<br />
100 kPa at 50 Hz for thermal lesions. The phase of the modulus generally increased from 0.1 to 0.5 over<br />
the same frequency range, for all tissue types. When the modulus is plotted as a function of the lesion<br />
temperature, a distinct peak exists around 70°C. Depending on the animal type and method of lesion<br />
preparation, the modulus above 70°C will drop and then increase or drop without increasing. These<br />
results suggest that image contrast in elastograms may be optimized at lower temperatures, and issues<br />
such as blood coagulation or tissue desiccation may be avoided.<br />
Conclusions: Characterization of the viscoelastic properties of in vitro liver specimens may provide some<br />
insight to the expected elastographic image contrast and eventually lead to improved elastographic<br />
methods of monitoring the treatment of certain liver diseases.<br />
Acknowledgements: This research is supported in part by NIH grant T32CA09206, and the Whitaker<br />
Foundation grant RG-02-0457.<br />
<br />
indicates Presenter<br />
41
076 NOISE REDUCTION IN ELASTOGRAPHIC STRAIN ESTIMATED FROM DISPLACEMENT.<br />
Lijun Xu 1 , Jeffrey C. Bamber 1 .<br />
1 Joint Department of Physics, Institute of Cancer Research and Royal Marsden NHS Trust, Downs<br />
Road, Sutton, Surrey SM2 5PT, England, UK.<br />
Aim: The aim of this work was to demonstrate and evaluate the potential of a new wavelet transformbased<br />
approach to strain noise reduction that, it was hoped, would not compromise resolution.<br />
Background: Elastography is an established method for imaging soft tissue relative strain. Traditional<br />
methods for strain estimation first measure tissue displacement via cross-correlation and then calculate the<br />
strain as the gradient of the displacement. Trade-off exists between the axial resolution and the signal-tonoise<br />
ratio (SNR) [1]. Calculating the gradient amplifies the noise in the measured displacement. Published<br />
methods have tended to reduce this by averaging the gradient over time (using many compressions) or<br />
space (from a fitted equation, e.g., the least-square (LSQ) method), trading temporal or spatial resolution for<br />
improved strain SNR and CNR. We are investigating the use of the wavelet transform to reduce the noise<br />
level in the measured displacement and hence that in the estimated strain while still retaining strain<br />
transition details. We evaluate whether it offers improved spatial and contrast resolution.<br />
Methods: In the new approach to elastogram generation discussed here, the displacement image was<br />
decomposed using the wavelet transform into octave sub-bands (i.e., different scales) consisting of one<br />
“approximate sub-band” and several “detail sub-bands”. Each sub-image obtained in a detail sub-band<br />
contains information from the original displacement image at the corresponding scale. If a suitable wavelet<br />
is selected, the wavelet coefficients in a detail sub-band associated with the discontinuities in the image<br />
have larger values than the other coefficients associated with noise. Wavelet coefficient thresholding was<br />
implemented by removing the (noise) coefficients of smaller absolute value. A de-noised displacement image<br />
was then reconstructed from the thresholded detail sub-images and the untreated approximate sub-image.<br />
Finally, a strain image was obtained by applying the direct gradient operator to the de-noised displacement<br />
image. In this approach, the gradient operator amplified only a small amount of the noise, i.e. that present<br />
in the approximate sub-band, while most of noise in the other detail sub-bands was cancelled. Since the<br />
discontinuous details of the original image were retained while reducing the noise level, the spatial<br />
resolution in the estimated strain was hardly affected. This new approach offers potential for smaller data<br />
segment windows to be used for cross-correlation tracking and strain estimation, enabling a better spatial<br />
resolution to be obtained while retaining high strain SNR and CNR.<br />
Results: Zero mean white noise was added to a simulated displacement image obtained by integrating<br />
the strain in a homogeneous soft background containing a stiff inclusion of circular cross-section. The<br />
strain values in the background and the inclusion were 0.02 and 0.015. Strain images obtained using the<br />
direct gradient, LSQ and new estimators were compared. The LSQ estimator (window size 5) produced<br />
SNR and CNR values (18.4dB and 9.8) smaller than those obtained using the new estimator (19.0dB and<br />
11.3), and both were substantially better than values obtained with the direct gradient estimator (16.3dB<br />
and 8.5). The new estimator, however, retained many of the sharp boundary details of the inclusion that<br />
were blurred by the LSQ estimator. Similar observations have been made from tests using real echo data,<br />
obtained whilst straining gelatine phantoms that contain stiff spherical inclusions. All implementations<br />
used Matlab built-in functions without speed optimisation, but the wavelet method was much faster<br />
than the LSQ method (2 for a 100100 image and 13 for a 500100 image).<br />
Conclusions: Wavelet transform-based noise reduction methods in strain estimation appear to hold<br />
potential for enhancing contrast, spatial or temporal resolution in elastography. Further work is required<br />
to explore alternative approaches to taking advantages of the properties of the wavelet transform, and to<br />
determine whether potential concerns, e.g., those arising from noise retained at sharp boundaries,<br />
represent disadvantages.<br />
Acknowledgements: We are grateful to the EPSRC for supporting this work.<br />
References:<br />
[1] S. Srinivasan, R. Righetti and J. Ophir, “Trade-offs between the axial resolution and the<br />
signal-to-noise ratio in elastography,” Ultrasound in Med. & Biol., vol. 29, no. 6, pp.847-866, 2003.<br />
<br />
indicates Presenter<br />
42
078 VIRTUAL ENDOSCOPIC ELASTOGRAPHY – AN INITIAL EXPERIENCE IN VIVO.<br />
Peng-Fei Zhang 1 , Xin Yi 2 , Hai-Jun Su 3 , Mei Zhang 1 , Wen-Qiang Chen 1 , Yun Zhang 1 .<br />
1 Shandong University Qilu Hospital, No107 Wenhuaxi Road, Jinan, Shandong Province, 250012,<br />
CHINA; 2 Chinese Ministry of Education Key Laboratory of Cardiovascular Remodeling and<br />
Function Research, No107 Wenhuaxi Road, Jinan, Shandong Province, 250012, CHINA;<br />
3 Shandong University, No 27 Shandanan Road, Jinan, Shandong Province, 250014, CHINA.<br />
Aims: To develop virtual endoscopic elastography (VE-IVUSE) via a combination of virtual endoscopy (VE)<br />
technique and intravascular ultrasound elastography (IVUSE) technique. To validate the feasibility of<br />
in vivo application of VE-IVUSE on animal models.<br />
Background: Although the important role of two-dimensional intravascular elastography (IVUSE) in<br />
plaque components characterization has been demonstrated on animal models and human femoral or<br />
coronary arteries in vitro, it failed to reveal the spatial information which is of critical value in the<br />
localization of atherosclerotic plaques and thorough understanding of their geometric shape. The virtual<br />
endoscopy (VE) technique holds the feature of convenient human-computer interaction and dynamic<br />
navigator [1]. We hypothesized that the combination of IVUSE and VE techniques could provide more<br />
accurate spatial elastic information of local and global arterial intima.<br />
Methods: Software for VE-IVUSE was developed using the Microsoft® C++ computer language. Six<br />
Chinese experimental mini pigs were fed a diet with 4% cholesterol for 40 weeks. For each animal, the<br />
endothelia on one of the two renal arteries were injured with a F<strong>org</strong>aty balloon while the other renal<br />
artery was left as a control. The IVUS images of both renal arteries were acquired and then processed<br />
with the VE-IVUSE software. With the VE-IVUSE images, high-strain spots [2] were identified, and the<br />
number of the spots in each of the arteries was counted.<br />
Results: With a Galaxy intravascular ultrasound system (Boston Scientific Inc. USA), IVUS images were<br />
obtained from 12 renal arteries and were processed with a self-made software program. With the view<br />
observing the intima from the lumen side, which could be illustrated in Figure 1, high strain<br />
concentrated at the shoulders of the plaques and from the shoulders to the fibrous caps, the strain<br />
values decreased gradually. Moreover, the high-strain spots could be counted clearly. Significant<br />
difference existed between the numbers of high-strain spots in the injured arteries and those in the<br />
non-injured arteries (5.0±0.3 and 0.8±0.2, respectively, P
079 PLAQUE VOLUME COMPRESSION RATIO – A NEW INDEX IN EVALUATING PLAQUE<br />
ELASTICITY PROPERTIES.<br />
Peng-Fei Zhang 1 , Gui-Hua Yao 1 , Mei Zhang 1 , Hong Jiang 2 , Yun Zhang 1 .<br />
1 Shandong University Qilu Hospital, No107 Wenhuaxi Road, Jinan, Shandong Province, 250012,<br />
CHINA; 2 Chinese Ministry of Education Key Laboratory of Cardiovascular Remodeling and<br />
Function Research, No107 Wenhuaxi Road, Jinan, Shandong Province, 250012, CHINA.<br />
Aims: To validate a new method for quantitative assessment of plaque volume by real-time 3-D echo<br />
imaging (RT-3DE) on phantoms. To develop and elucidate a new index – plaque volume compression ratio<br />
(Rpv), for use in carotid arterial plaque elasticity evaluation.<br />
Background: A series of indices such as stiffness index (β), pressure-strain modulus (Ep), etc, have been<br />
documented to demonstrate the elastic characteristics of carotid arteries. Mainly, 1-D or 2-D parameters<br />
are involved in these equations [1, 2]. However, plaque volume should be a more accurate index for<br />
evaluating the pathological process of atherosclerosis because during this process, plaques grow not only<br />
along the short axis, but also along the long and the circumferential axes, of involved arteries [3]. Plaque<br />
volumes change periodically because of the pulsation of blood pressure, and the extent of such changing<br />
is different according to the elastic characteristics of plaques. That is, tissues with bigger elastic moduli<br />
tend to deform less and vice versa. So, plaque compression ratio (Rpv), calculated as Rpv = (Plaque<br />
volume at end diastole-Plaque volume at end systole)/Plaque volume at end diastole, could be a more<br />
accurate index to evaluate the elasticity. RT-3DE, a newly developed technique, has been shedding light<br />
on real-time plaque volume quantification. Compared with the massive cardiac application, few<br />
publications have been about the application of RT-3DE on carotid artery imaging. In the present study,<br />
the feasibility of plaque volume quantification via RT-3DE was first validated on vessel-mimicking<br />
phantoms and then the real-time carotid arterial plaque volumes were measured to calculated Rpv. The<br />
clinical value of Rpv index was elucidated also.<br />
Methods: Thirty-two carotid artery-mimicking phantoms were made from the mixture of gelatin, agar and<br />
silicon carbide. The diameter of the phantom lumen was 10.0±1.0mm and the maximum thickness of<br />
plaques was 1.40±0.20mm. The RT-3DE data sets, acquired with frame rate of 30f/s, were transferred<br />
into a TomTec 4D Cardio-View workstation, and plaque volume was measured using 8 cut planes. Two<br />
experienced sonographers measured each plaque volume in a double-blind way, and one sonographer<br />
repeated the same measurement one month later. Twenty patients were randomly selected for this study<br />
and divided into 3 groups: patients with hypertension (HTN), non-hypertension patients with myocardial<br />
infarction or cerebral infarction (VE) and normal controls (NC). There were no significant differences in<br />
risk factors such as age, smoking history, etc. In total, 30 plaques were detected and for each group,<br />
n=13, 11 and 6, respectively. The acoustic properties of the plaques were determined with an acoustic<br />
densitometry (AD) technique. According to the AD ratio of plaque to vessel adventitia, plaques were<br />
classified as lipid, fibrous and calcified plaques.<br />
Results: Good correlations were obtained between the real phantom plaque volume and the estimated<br />
plaque volume. There was no significant intra- and inter-observer difference between measurements.<br />
With a mean plaque volume ranging from 500mm 3 to 1,300mm 3 , the coefficient of variance varied from<br />
2.0% to 9.7%. Rpv values differed significantly in lipid, fibrous and calcified plaques (43.80%±6.99%,<br />
22.54%±6.88% and 11.63%±9.09%, respectively, P
082 PHANTOM EXPERIMENTS AND COMPUTER SIMULATION FOR BREAST CANCER<br />
ELASTOGRAPY BY WATER BAG PRESSING.<br />
Y Hayakawa 1 , K Ishida 1 , K Tsuji 1 , M Kaitoo 1 , M Nakamura 2 .<br />
1 Toin University of Yokohama, Yokohama, Kanagawa-ken, JAPAN; 2 Yokohama General Hospital,<br />
Yokohama, Kanagawa-ken, JAPAN.<br />
Aims: The present work aims to obtain the modulus of elasticity of lesions in the breast. As breast cancer<br />
has a higher elasticity modulus [1], this may lead to discrimination of cancer from benign lesions [2, 3].<br />
Although the apparatus for elastography of the breast is commercially available [e.g. Hitachi], the resultant<br />
image is rather qualitative. The present work aims to obtain more quantitative information by simplifying<br />
the force delivered to the breast by water bag pressing as schematically shown in the figure below.<br />
Background: The existing commercially available apparatus for elastography applies force by planar<br />
pressing. The stress inside the breast is too complex to obtain the modulus of elasticity quantitatively. We<br />
simplify the pressure distribution by using a water bag to exert the pressure, in which case the pressure<br />
is nearly uniform across the whole surface of the water-breast interface.<br />
Methods: A phantom of 10% by weight gelatin, width 8cm, height 4cm, and length 10cm, containing a<br />
Plexiglas rod of 1cm in diameter, centered at 1.5cm and 2.5cm depth from the upper and the lower<br />
surface, was created. Pressure was applied to the phantom using a water bag and ranged from 1.0kPa to<br />
2.3kPa. The deformation of the phantom was observed using an 11MHz ultrasound echo technique.<br />
Results: As the water pressure increased, the curvature of the water-gelatin surface was greater when<br />
the Plexiglas rod was nearer to the water-gelatin surface. These observations were simulated using Finite<br />
Element Methods (ANSYS9.0) and the elasticity modulus of the gelatin was estimated to be between<br />
5500Pa and 6500Pa under the assumption of Poisson’s ratio being 0.49. Another experiment using a<br />
5cmH5cmH8cm gelatin block with weight upon it was analyzed by Finite Element Method and gave an<br />
elasticity modulus of 5800Pa.<br />
Conclusions: Our preliminary study shows the qualitative and quantitative coincidence of the phantom<br />
experiments and computer simulation using Finite Element Method. A more realistic phantom<br />
experiment using a softer cancer model than a Plexiglas rod is under development, where the elasticity<br />
modulus of a cancer model is to be determined.<br />
References:<br />
[1] Krouskop TA, Wheeler TM, Kallel K et al., Ultrasonic Imaging 26(1998)260-274.<br />
[2] J Ophir, I Cespedes, H Ponnekanti et al., Ultrasonic Imaging 13(1991) 111-134.<br />
[3] M Yamakawa, N Nitta, T Shiina, et al., Jpn.J.Appl.Phys. 42(2003)3265-327.<br />
<br />
indicates Presenter<br />
45
088 PRELIMINARY CLINICAL STUDY OF SEMI-QUANTITATIVE FREEHAND ELASTOGRAPHY FOR<br />
THE ASSESSMENT OF RADIATION INDUCED BREAST FIBROSIS.<br />
Nigel L. Bush 1 , Jeffrey C. Bamber 1 , Paul E. Barbone 3 , John R. Yarnold 2 .<br />
1 Joint Department of Physics and 2 Section of Radiotherapy, Institute of Cancer Research and<br />
Royal Marsden NHS Trust, Downs Road, Sutton, Surrey, SM2 5PT, England, UK; 3 Department of<br />
Aerospace and Mechanical Engineering, Boston University, Boston, MA 02215, USA.<br />
Aims: We report on a small clinical pilot study designed to investigate the potential use of pseudo-static<br />
freehand ultrasound elastography as a tool for assessing diffuse tissue stiffness, as applied to gain<br />
further understanding of radiation-induced fibrosis of the breast, and in monitoring its severity and<br />
treatment. A compliant elastic standoff pad of known elastic modulus, placed between the compressor<br />
and breast, provides a measure of the applied axial stress profile at the tissue surface, allowing a simple<br />
first-order correction of the strain data to produce relative strain (stiffness) images.<br />
Background: Following radiotherapy treatment for early breast cancer, some women will develop<br />
disabling tissue hardness in the breast and shoulder girdle, with consequent compression of the<br />
lymphatic, vascular and nerve sheaths, leading to devastating disabilities. Radiation fibrosis can render<br />
tissue palpably and measurably stiffer than normal [1], and is primarily assessed and monitored<br />
clinically using subjective palpation methods. Physician assessment of radiation-induced induration is,<br />
however, unreliable [2] and unable to provide specific information concerning the distribution of<br />
radiation-altered mechanical properties amongst the component tissues of the breast. Thus, there is a<br />
need for an alternative objective non-invasive imaging method for assessing breast fibrosis. Although we<br />
are working towards a solution to this problem using inverse reconstruction methods, we decided, as a<br />
preliminary step, to gain some clinical experience of a simple calibrated strain imaging technique.<br />
Methods: Acquisitions were performed as part of a routine ultrasound examination using freehand<br />
contact scanning. The ultrasound imaging probe was manually guided to gently palpate the breast<br />
through a compliant gel pad of known, tissue-equivalent elastic modulus. The ultrasound scanner<br />
(Acuson XP10, 7.5MHz) provided radio frequency (RF) frame sequences corresponding to a compression<br />
palpation cycle. Off-line processing, using cross-correlation techniques, was applied to the RF frame<br />
sequence data to generate strain images for scan planes distributed radially (with respect to the nipple)<br />
around each treated breast, and for scan planes corresponding to contra-lateral sites on each untreated<br />
breast. Normalized strain images, referenced to the strain in the standoff, were generated using regional<br />
standoff strain values, where the reference regions were drawn on the strain images with the aid of<br />
registered B-mode images. A similar method was used to draw regions on the strain images within the<br />
breast, with the intention of separately evaluating any effect of fibrosis on tissue elasticity in regions<br />
classified as skin, adipose and fibro-glandular tissue.<br />
Results: Results for three patients are reported. In all three cases, the method demonstrated an increased<br />
stiffness in the irradiated breast relative to the unirradiated breast, for all tissue types, although the<br />
adipose tissue appeared to show the greatest contrast between the treated and untreated breasts.<br />
Conclusions: Increases in tissue stiffness due to radiation-induced fibrosis of the breast are detectable<br />
by comparing the palpation-induced strain in the breast to that produced simultaneously in an overlying<br />
standoff pad. Therefore, it would appear worthwhile developing and evaluating methods that offer a<br />
further improved degree of quantification, especially to compensate for the stress distribution within the<br />
breast, with a view to reducing variability of the measurement and confirming whether the fibrosis really<br />
does affect the adipose tissue more than other parts of the breast.<br />
Acknowledgements: This work is supported by funding from the EPSRC.<br />
References:<br />
[1] Zheng YP, Leung SF, Mak AFT. Assessment of neck tissue fibrosis using an ultrasound palpation<br />
system: a feasibility study. Medical and Biological Engineering and Computing, 38:497-502, 2000.<br />
[2] Gothard L et al, Double-blind placebo-controlled randomized trial of Vitamin E and pentoxifylline in<br />
patients with chronic arm lymphoedema and fibrosis after surgery and radiotherapy for breast<br />
cancer Radiotherapy and oncology, 73:133-139, 2004.<br />
<br />
indicates Presenter<br />
46
090 PROGRESS IN QUANTITATIVE BIOMECHANICAL IMAGING.<br />
Nachiket H. Gokhale 1 , Michael S. Richards 2 , Carlos Rivas Aroni 1 , Ricardo Leiderman 1 ,<br />
Assad A. Oberai 1 , Paul E. Barbone 1 .<br />
1 Aerospace & Mechanical Engineering, 2 Biomedical Engineering, Boston University, Boston, MA, USA.<br />
Aims: To noninvasively measure and thereby image in vivo distributions of biomechanical properties of<br />
soft tissues. The intended application of our work is in the detection and diagnosis of breast cancer and<br />
other soft tissue pathologies. This poster reviews our team's progress in this direction. The efforts<br />
described include the development and computational implementation of mathematical models to<br />
describe soft tissue behavior, the development of techniques to accurately measure vector displacements<br />
of tissue deformation, the analysis of inverse problems associated with the quantitative inference of<br />
material properties from measured displacements, and the development of algorithms to solve those<br />
inverse problems.<br />
Background and Methods: It is widely recognized that soft tissue pathologies often change the tissue's<br />
biomechanical properties. The inference of biomechanical properties from a measured deformation field<br />
requires a mathematical model that accurately describes tissue deformation. The parameters that go into<br />
the mathematical model may then be recovered by comparing the predictions of the model to the<br />
observed tissue deformations. Sometimes there is enough information in the observed deformation to<br />
confidently determine the desired tissue properties; sometimes there is not. In the latter case, additional<br />
information must be supplied in order to determine the tissue properties. To solve the inverse problem,<br />
we typically use an adjoint based gradient descent algorithm to determine the parameter values that<br />
minimize the difference between observed and predicted deformations.<br />
Results: We present progress in several areas: novel methods in displacement estimation, advanced<br />
mathematical models of tissue deformation, and analysis and solution of their associated inverse<br />
problems. In the first category, we present novel methods to improve displacement estimates via image<br />
registration. The measured deformation is interpolated on a finite element mesh. The flexibility inherent<br />
in the FEM interpolation provides a basis suitable to explore advanced techniques to accurately<br />
determine non-axial displacements. These techniques include regularization, physical constraints, and<br />
novel ultrasound data collections strategies. In the second category of effort, we present our experience<br />
with several different mathematical models for tissue behavior suitable for different experimental<br />
conditions. Some of these models are motivated by microstructural considerations. The models include<br />
both two and three dimensional deformations, and linear and nonlinear deformations. Finally,<br />
mechanical property reconstructions derived from our novel adjoint-based gradient descent quasi-Newton<br />
algorithm are presented. Where possible, these are compared to values determined by independent<br />
mechanical testing.<br />
Conclusions: Suitable mathematical models of tissue deformation, coupled with precise and accurate<br />
observations of tissue behavior can be used to determine many different biomechanical properties of soft tissue,<br />
including but not limited to shear elastic modulus. We demonstrate this on both phantom and simulated data.<br />
We also show that the measurement of displacement and strain itself can be improved by imposing physicsbased<br />
mathematical constraints on the measured displacements. Of course, if the mathematical model fails to<br />
accurately represent the real physical situation, then the displacement measurement will be incorrectly biased.<br />
Overall, the breadth of possibilities for biomechanical imaging is quite exciting.<br />
Acknowledgements: This work has been supported in part by CenSSIS (The Center for Subsurface<br />
Sensing and Imaging Systems) under the Engineering Research Centers Program of the National Science<br />
Foundation (Award No. EEC-9986821) and the Department of Defense Breast Cancer Research Program<br />
(Award No. W81XWh-04-1-0763).<br />
<br />
indicates Presenter<br />
47
099 TISSUE MOTION AND ELASTICITY IMAGING EVALUATED BY ULTRASOUND IN A TISSUE-<br />
MIMICKING PHANTOM.<br />
AAO Carneiro 1 , H Chen 2 , T Varghese 2 , TJ Hall 2 , JA Zagzebski 2 .<br />
1 Departamento de Física e Matemática, FFCLRP, Universidade de São Paulo, Ribeirão Preto, São<br />
Paulo, BRAZIL; 2 Departament of Medical Physics, University of Wisconsin-Madison, 1300<br />
University Avenue, 1530 MSC, Madison, WI 53706, USA.<br />
Aims: This work provides a comparison of low frequency compressions in the range of 0.5-10 cycles/sec<br />
for elasticity imaging. Tissue stiffness increases in some tumors, as they form and grow because of a<br />
dense cellular reaction, specifically in malignant breast lesions with highly cross-linked collagenous<br />
fibers. The development of elasticity imaging is driven, in part, by the need to improve the detection and<br />
differentiation of early malignant disease.<br />
Background: Elastography or elasticity imaging is a new imaging modality where elastic tissue parameters<br />
related to the structural <strong>org</strong>anization of normal and pathological tissues are imaged [1]. Both static and<br />
dynamic techniques have been utilized for measuring tissue elastic properties. In quasi-static elastography,<br />
radiofrequency (RF) signals acquired before and after a small amount of compression are compared.<br />
Dynamic methods, on the other hand, image local vibrations within tissues or structures induced by<br />
externally applied oscillations using transducers or acoustic radiation force at low frequencies [2].<br />
Methods: In this work, we apply a quasi-static compression to tissue-mimicking phantoms using a<br />
motorized system with controlled compression frequency. The 8cm cubic phantom was positioned<br />
between two aluminum plates. The top plate was fixed and also contained a rectangular slot to hold the<br />
transducer, while the bottom plate is moved up-down in a sinusoidal fashion by the motor. Loops of RF<br />
echo frames were acquired that were not synchronized to the compression. The compression frequency<br />
varied from 0.5 cycles/sec to 10 cycles/sec and the maximum deformation was 5%. Displacement and<br />
strain maps were evaluated using cross-correlation techniques between the pre- and post-compressed RF<br />
frames. Strain images were then obtained from the derivative of the displacement data. RF data were<br />
acquired using an ultrasound machine with a research interface, the Ultrasonix 500RP, with a linear<br />
array transducer.<br />
Results: Experiments were conducted on both uniformly elastic and inclusion phantoms. We observed<br />
increased viscoelastic contributions with an increase in the compression frequency. The use of sinusoidal<br />
compressions enable the averaging of data obtained at similar compression increments, thereby<br />
improving the noise properties of the strain images.<br />
Conclusions: Strain images obtained using different compression frequencies were compared. We<br />
observed viscoelastic contributions to the elastogram as the compression frequency increases. Variations<br />
in the signal-to-noise ratios and contrast-to-noise ratios in the phantom are presented.<br />
Acknowledgements: This work is supported in part by the University of Wisconsin-Madison and the<br />
University of São Paulo.<br />
References:<br />
[1] Ophir J, Cespedes I, Ponnekanti H, Yazdi Y and Li X 1991. Elastography: a quantitative method for<br />
imaging the elasticity of biological tissues, Ultrason. Imaging 13: 111–34.<br />
[2] Hall TJ, Zhu YN, Spalding CS 2003. In vivo real-time freehand palpation imaging; Ultrasound in<br />
Medicine and Biology 29 (3): 427-435.<br />
<br />
indicates Presenter<br />
48
101 COMPARISON BETWEEN AXIAL ELASTOGRAMS OF A CONNECTED AND DISCONNECTED<br />
INCLUSION IN HOMOGENEOUS BACKGROUND: A SIMULATION STUDY.<br />
A Thitai Kumar 1,2 , J Ophir 1,2 and TA Krouskop 1,3 .<br />
1 The University of Texas Medical School, Houston, TX, USA; 2 University of Houston, Houston, TX,<br />
USA; 3 Baylor College of Medicine, Houston, TX, USA.<br />
Introduction: When a material is compressed, there are several parameters that affect the stress<br />
distribution, and, hence, the strain distribution in the material. The coefficient of friction of an inclusion<br />
to the background material is a critical parameter. Current algorithms used to solve the inverse elasticity<br />
problem assume a fully connected interface between the inclusion and the background. This assumption<br />
may be applicable in some circumstances but not in general. In this poster, we perform a parametric<br />
study using simulations to compare the observed strain contrast and contrast-to-noise ratio (CNR) in the<br />
axial elastograms of material models with either a connected or a disconnected elastic cylindrical<br />
inclusion in a homogeneous, elastic background.<br />
Methods: We considered a 2D plane strain problem with a circular inclusion in a square region of<br />
interest. The assumptions for the material properties and external boundary conditions were taken to be<br />
1) both the inclusion and background are incompressible elastic materials (Poisson’s ratio =0.495)<br />
and<br />
2) there was no-slip at the center point in the bottom plane.<br />
We compared the axial elastograms obtained for a circular inclusion with varying degrees of coefficient of<br />
friction with respect to the background (modeled as the coefficient of friction at the interface between the<br />
inclusion and background). The effects of applied axial strain and modulus contrast between the<br />
inclusion and the background were also compared for the cases of a fully connected inclusion and a<br />
completely disconnected inclusion.<br />
Results: The results indicate that the observed strain contrast for a disconnected inclusion is<br />
significantly higher than that of the connected inclusion at all applied axial strains (Figure 1). There is<br />
also a significant difference between the observed strain contrasts in these two cases at higher modulus<br />
contrasts (Figure 2). In addition, the degree of friction causes significant differences in the observed strain<br />
contrast (Figure 3).<br />
Conclusions: We conclude from this study that at typical elastographic compression levels used in<br />
practice and at different modulus contrasts, there are significant differences between the axial<br />
elastograms of the two cases, completely disconnected and fully connected inclusion, in terms of the<br />
observed contrast and the CNRe. This indicates that care must be exercised in interpreting the<br />
information conveyed in an axial elastogram and also in using axial elastogram data to solve the inverse<br />
problem since the friction can change the ratio of the stiffnesses used in the calculations. In addition, we<br />
also conclude that shear strain elastograms can be explored for information about the degree of internal<br />
friction (Figure 4), and this may often be useful in solving the inverse problem.<br />
Acknowledgement: Supported by NIH Program Project P01-CA64597-12 to the University of Texas<br />
Figure 1 Figure 2 Figure 3<br />
Figure 4: SSE at various coefficients of friction<br />
from 5 (top left) to 0.01 (bottom right).<br />
<br />
indicates Presenter<br />
49
106 THEORETICAL AND SIMULATION STUDY OF WAVE GENERATION AND ITS EFFECT ON<br />
LESION DETECTABILITY IN SONOELASTOGRAPHY.<br />
JM Park 1 , SJ Kwon 1 , MK Jeong 1 , MH Bae 2 .<br />
1 Daejin University, Pocheon, Kyeonggi, 487-711, KOREA; 2 Hallym University, Chuncheon,<br />
Kangwon, 200-702, KOREA.<br />
Aims: In order to implement a sonoelastographic imaging modality in a medical diagnostic ultrasonic<br />
imaging system, in this paper we have investigated wave generation characteristics in soft tissue due to a<br />
surface vibrator and the effects of vibration patterns within tissue on lesion detectability.<br />
Background: Sonoelastography is an ultrasound-based technique that visualizes the elastic properties of<br />
soft tissues by measuring the tissue motion generated by an externally applied vibration [1], [2]. Requiring<br />
the use of separate vibrators, this method may be cumbersome to apply to the human body compared to<br />
the static method, but is advantageous in that it can deliver vibrational forces to deep-lying lesions to which<br />
it is difficult to apply pressure, and thus obtain images of the resulting vibrational amplitude.<br />
Methods: Theoretical expressions were derived for the wave generated by a vibration source applied<br />
perpendicularly to the surface of a semi-infinite solid, as well as an infinite plate, and were numerically<br />
evaluated to determine vibration patterns inside tissue subjected to an external vibration force. We also<br />
simulated the vibration pattern in a finite-sized inhomogeneous tissue embedded with hard lesions using FEM.<br />
Results: We found that the wave generation in soft tissue due to a surface vibrator is characterized by a<br />
shear wave propagating predominantly in particular directions. The directions in which the maximum<br />
energy of the shear wave propagates depend on the vibrator frequency and the distance from it. The<br />
maximum angles increase with decreasing distance and frequency, implying that the wave generation<br />
characteristic inside tissue cannot be accurately represented by the far-field approximation. When the<br />
shear wave frequency is increased such that the shear wavelength becomes shorter than the vibrator<br />
width, the number of shear lobes, which are separated into different regions, is found to increase. Based<br />
on vibrational amplitude images, we explain that the reflected wave from a boundary in a finite-sized<br />
tissue deforms the wave pattern emitted from the vibrator. The degree to which the wave pattern is<br />
deformed by interference was found to be large at low frequencies where attenuation is low, but turned<br />
out to be small at high frequencies where attenuation is high, resulting in nearly the same wave<br />
generation characteristic as observed in half space.<br />
Conclusions: We found it difficult to relate quantitatively the vibrational amplitude itself to tissue<br />
stiffness because lesion detectability from vibrational amplitude images varies greatly depending on the<br />
lesion location and vibrator frequency. We showed, however, that by contrast, strain imaging is less<br />
sensitive to the variation of modal patterns. Therefore, we conclude that if we obtain strain images using<br />
sonoelastography in a proper manner, they can be considered as a fairly quantitative measure of<br />
representing tissue stiffness, as is the case in static elastography.<br />
Acknowledgements: This work was supported by a research grant from Medison.<br />
References:<br />
[1] L Gao, KJ Parker, SK Alam, “Sonoelasticity imaging: Theory and experimental verification,” J.<br />
Acoust. Soc. Am, vol. 97, no. 6, pp.3875-3886, 1995.<br />
[2] KJ Parker, D Fu, SM Gracewski, F Yeung, SF Levinson, “Vibration sonoelasticity and the<br />
detectability of lesions,” Ultrasound in Med. Biol., vol. 24, no. 9, pp. 1437-1447, 1998.<br />
<br />
indicates Presenter<br />
50
109 ULTRASOUND CHARACTERIZATION OF MECHANICAL PROPERTIES OF SILICONE TUBE<br />
WALLS.<br />
Edward Haeggstrom 1 , Anders Wallin 1 and Mikko Leppänen 1 .<br />
1 Helsinki University, Vaino Auerin katu 11, Helsinki, Uusimaa, FINLAND.<br />
Aims: An acoustic method to estimate mechanical characteristics of the wall of an air-filled, freely<br />
suspended, non-porous silicone tube is being developed.<br />
Background: This method is based on our earlier work on thin plastic foils [1].<br />
Methods: A 1-cycle, 23 kHz, acoustic signal is excited into the tube wall (Tygone 3350 1/32 x 3/32) with<br />
a piezoceramic actuator and received with an inductive pickup (sensitivity 14.1±0.1 µV/nm). This kind of<br />
actuation-detection scheme can be used for radial and axial wave excitation and detection. By measuring<br />
the time of flight (TOF) at different actuator-receiver separations, the sound wave velocity in the tube wall<br />
was determined from a least-squares-fit. The corresponding elastic modulus was calculated.<br />
Results: The results were verified with a laser Doppler interferometer. Our next step will be to determine<br />
the sensitivity of the method to detect changes in the tube wall stiffness and thickness by monitoring the<br />
dispersion of the propagating modes.<br />
Conclusions: We hope that being able to determine mechanical tube wall parameters might carry interest<br />
with e.g. a) experimental verification of tube models used to predict vascular pathologies [2], b) acoustic<br />
wave devices for sensing based on propagating tube waves [3], and c) noise reduction in the intake<br />
system of an engine where the acoustic wall impedance of the inlet hose must be measured [4].<br />
References:<br />
[1] Leppänen, M., et al., <strong>2005</strong>, "Plastic Foam Porosity Characterization by Air-Borne Ultrasound", 32<br />
Annual Review of Progress in Quantitative Nondestructive Evaluation <strong>2005</strong>, 31.7- 5.8, Maine, USA.<br />
[2] Smye, S. W. and Bloor, M. I. G., 1995, “Prediction of reactive hyperaemia in vascular pathologies<br />
using elastic porous tube model", Medical & Biological Engineering & Computing. 33(2), p. 185-9.<br />
[3] Xing-Li et al. ,1996, “Ultrasonic thin-walled tube wave structure for sensing devices”, IEEE Trans. on<br />
Ultrasonics, Ferroelectrics and Frequency Control, 43(2), p. 331-6.<br />
[4] Chul-Min-Park. Et al., 2003, “Inverse estimation of the acoustic impedance of a porous woven hose from<br />
measured transmission coefficients”, Journal of the Acoustical Society of America 113(1), p.128-38.<br />
<br />
indicates Presenter<br />
51
114 ELASTICITY AND PATHOLOGY IMAGING CORRELATION OF BREAST TUMOURS – INITIAL RESULTS.<br />
William E Svensson 1 , Asel Usupbaeva 1 , Sami Shousha 2 , Sheena McLaggan 1 , A Al-Kufaishi 3 ,<br />
PTR Thiruchelvam 3 , Jackie SK Lewis 3 , H Dudley Sinnett 3 , Joe Malin 4 , Carol Lowery 4 .<br />
1 Radiology, 2 Pathology and 3 Surgery Departments, Charing Cross Hospital, London, England, UK;<br />
4 Siemens Medical Solutions Ultrasound Group, Issaquah, WA, USA.<br />
Aims: To determine how accurately freehand elasticity images and measurements correlate to the<br />
pathological appearances and dimensions of breast cancers.<br />
Background: Earlier work done in our centre has suggested that freehand compression elasticity imaging<br />
is more accurate than conventional B-mode ultrasound for the assessment of breast tumour extent.<br />
Reported series show re-operation rates of as high as 50% when wide local excision is based on<br />
conventional breast imaging techniques.<br />
Methods: Freehand elasticity images were obtained at regular intervals through tumour the day before<br />
surgery. The skin of the breast was marked to allow orientation sutures to be placed on the tumour<br />
specimen as it was excised. Histology sections were made in the same plane as the imaging planes at<br />
right angles to the greatest diameters of the B-mode tumour appearance. The edges of the specimen were<br />
examined to ensure tumour margin extent was accurately measured. The skin marking at imaging, and<br />
specimen marking at surgery, allowed ultrasound and specimen image correlation.<br />
Results: One of nine cases of elasticity imaging underestimated maximum tumour diameter. B-mode<br />
underestimated in seven cases. Seven cases of elasticity imaging had closer correlation to pathology<br />
diameters than B-mode imaging. On average, B-mode underestimated by 20% while elasticity imaging<br />
overestimated by 14%. The elasticity image of Case 1 extended to the edge of the strain box, which could<br />
explain the underestimation.<br />
Conclusions: Initial results suggest that elasticity imaging may provide a more reliable method of<br />
assessing tumour extent.<br />
comparison of B-mode, elasticity and pathology<br />
imaging<br />
Max diameter in cm.<br />
2<br />
1.8<br />
1.6<br />
1.4<br />
1.2<br />
1<br />
0.8<br />
0.6<br />
0.4<br />
0.2<br />
0<br />
1 2 3 4 5 6 7 8 9<br />
case number<br />
maximum<br />
diameter on<br />
B-mode<br />
maximum<br />
diameter on<br />
elasticity<br />
imaging<br />
maximum<br />
diameter at<br />
pathology<br />
Table 1: Results of all nine cases<br />
Figure 1: Histology<br />
B-mode Compressing Releasing<br />
Figure 2: Case 6 centre of tumour at right angles to longest diameter, images all same scale and orientation.<br />
<br />
indicates Presenter<br />
52
118 EFFECTS OF VISCOELASTICITY IN SHEAR WAVE SPEED RECONSTRUCTION.<br />
J Klein 1 , JR McLaughlin 1 .<br />
1 Rensselaer Polytechnic Institute, 110 8 th Street, Troy, NY, USA.<br />
Aims: In this report, we will show viscoelastic effects in transient elastography data and outline an<br />
approach to cope with these effects based on the idea of propagating wave fronts [1].<br />
Background: The talk is based on phantom and in vivo data gathered by Mathias Fink’s group [2].<br />
Methods: The estimation of the arrival time of the wave front is improved by taking the spreading of the<br />
wave, caused by the viscoelastic effects, into account.<br />
Results: The reconstruction of the shear wave speed is clearly improved by incorporating a simple model<br />
for viscoelasticity. This can be observed for the phantom as well as the in vivo data.<br />
Conclusions: The improvement in reconstruction quality is promising considering the use of a very<br />
simple model. This approach allows, for the first time, the reconstruction of in vivo data in good quality<br />
for the technique using the arrival time of wave fronts. Therefore, further studies regarding viscoelastic<br />
effects seem very worthwhile.<br />
Acknowledgements: This work has been supported by the NIH.<br />
References:<br />
[1] Ji L, McLaughlin J R, Renzi D, Yoon J R: Interior elastodynamics inverse problems: shear wave speed<br />
reconstruction in transient elastography, Inverse Problems, Vol. 19, No. 6, pp. s1-s29, 2003.<br />
[2] Bercoff J, Chaffai S, Tanter M, Sandrin L, Catheline S, Fink M, Gennisson J L, Meunier M: In vivo<br />
breast tumor detection using transient elastography, Ultrasound in Med. & Biol., Vol. 29, No. 10, pp.<br />
1387-1396, 2003.<br />
<br />
indicates Presenter<br />
53
119 VISCOELASTIC CHARACTERIZATION OF SOFT MATERIALS THROUGH CREEP TEST<br />
EXPERIMENTS.<br />
Jean Jacques Ammann 1,2 , Ricardo Rivera 1 , Jonathan Ophir 3 .<br />
1 Universidad de Santiago de Chile, Physics Department, Santiago, CHILE; 2 CIMAT, Santiago,<br />
CHILE; 3 The University of Texas Health Science Center at Houston, Houston, TX, USA.<br />
Aims: As previously shown by Righetti et al. through stress relaxation experiments [1], imaging and<br />
characterizing the time dependency of tissue elastic constants open a new field to elastography-based<br />
diagnostics. We present here a method based on a composed Standard Anelastic Solid model [2], for a full<br />
characterization of the viscoelastic behavior of biomimetic materials. This is achieved through a creep test<br />
experiment and extracts a set of five rheological parameters from 1-D RF signals.<br />
Methods: The method consists in determining the material viscoelastic<br />
parameters by interpreting time-dependant elastographic data through<br />
a 2 Voigt cell rheological model.<br />
The experiment consists in applying a constant force on the specimen<br />
and the time-dependant behavior is recorded as a series of RF traces<br />
along the compression axis, acquired at increasing time intervals.<br />
To process the acquired data, a windowed cross-correlation is performed between each pair of the<br />
successive traces. The Hilbert transform and a peak envelope detection routine allow the determination of<br />
the local displacement increment along the compression axis. The slope of the displacement curves vs.<br />
time corresponds to the strain increment. Integrating the slope from the application of the load to time-t<br />
yields the real strain vs. time curve.<br />
The interpretation of the time-dependent strain is based on<br />
a 2 Voigt cell rheological model (see inset) accounting for five<br />
parameters: three elastic moduli EElast, EVoigt,1 and EVoigt,2<br />
and two viscosity coefficients Voigt,1 and Voigt,2. The time<br />
dependant strain equation for this model becomes:<br />
EVoigt ,1 EVoigt ,2<br />
<br />
t<br />
t<br />
1 1 1<br />
<br />
Voigt ,1 Voigt ,2<br />
<br />
t = <br />
0<br />
(1e ) (1e ) <br />
EVoigt,1 EVoigt,2 EElast<br />
<br />
<br />
<br />
Voigt,1<br />
EVoigt,1<br />
Results: The method is applied in a temperature-controlled<br />
water bath to a sample of fresh white cheese of 50mm<br />
diameter and 37mm height. The experiment consists in<br />
applying a pre-compression load through a polymer disc of<br />
size larger than the specimen to the cylindrical specimen. The disc holds in its center a 2.2MHz<br />
broadband transducer, which is directly in contact with the specimen. After the acquisition of four<br />
control RF traces, an additional force (brass ring: 187g) is applied to the top of the polymer disk. A series<br />
of 20 transducer traces is then recorded, subtracting the transducer ring-down previously acquired. The<br />
time delay between each acquisition is increased exponentially for a total acquisition time of 22 minutes.<br />
After processing, the viscoelastic parameters are obtained from the fit of the strain vs. time plot according<br />
to the equation above, yielding the following values:<br />
Conclusions: A rheological model with two Voigt cells tracks consistently with the<br />
experimental behavior of a viscoelastic materials observed through a creep test<br />
experiment. The creep test experiment is expected to be readily implemented for<br />
tissue viscoelastic characterization.<br />
Acknowledgements: This work is supported by Fondecyt project No. 1040206,<br />
Chile, ECOS-Conicyt project No C01E01(Chile-France), Fondap project No.<br />
11980002 and Dicyt/USACH, Chile.<br />
Voigt,2<br />
EVoigt,2<br />
Parameter<br />
0<br />
E Elast<br />
E Voigt,1<br />
Voigt,1<br />
E Voigt,2<br />
Voigt,2<br />
EElast<br />
Value<br />
-94.54 Pa<br />
3.376 kPa<br />
1.15 kPa<br />
1.3 MPa·s<br />
5.05 kPa<br />
0.2 MPa·s<br />
References:<br />
[1] R. Righetti, J. Ophir, and T. A. Krouskop, Ultrasound in Med. & Biol., Vol. 31, No. 6, pp. 803–816, <strong>2005</strong>.<br />
[2] A. S. Novick and B. S. Berry, Anelastic Relaxation in Crystalline Solids, Academic Press, New York, 1972.<br />
<br />
indicates Presenter<br />
54
Session MIP-1: Methods for Imaging Elastic Tissue Properties – I<br />
Monday, October 17 8:00A – 9:45A<br />
003 FROM STATIC TO DYNAMIC ELASTOGRAPHY: THE UNIFIED RANGE OF ELASTIC RESPONSE.<br />
KJ Parker 1 , LS Taylor 1 , SM Gracewski 2 , DJ Rubens 3 .<br />
1 Electrical and Computer Engineering, 2 Mechanical Engineering, 3 Radiology Departments,<br />
University of Rochester, Rochester, NY, USA.<br />
Background: New approaches to imaging the elastic properties of tissue have been developed over the<br />
last 20 years, using either ultrasound or MRI to image the tissue response to some stimulus. Researchers<br />
have evaluated a wide range of stimuli, including heat, water jets, vibration shear waves, compression,<br />
and quasi-static compression, using single or multiple steps or low-frequency (
009 ULTRASONIC TRACKING OF ACOUSTIC RADIATION FORCE-INDUCED DISPLACEMENT IN<br />
HOMOGENEOUS MEDIA.<br />
ML Palmeri 1 , SA McAleavey 2 , GE Trahey 1 , and KR Nightingale 1 .<br />
1 Duke University, Durham, NC, USA; 2 University of Rochester, Rochester, NY, USA.<br />
Aims: Tracking tissue deformation generated by impulsive acoustic radiation force using ultrasonic<br />
methods, as is done in Acoustic Radiation Force Impulse (ARFI) imaging, is subject to jitter and<br />
displacement underestimation (bias). The purpose of these studies is to study the impact of acoustic<br />
material properties, excitation focal configuration, and tracking parameters on the bias and jitter in<br />
dynamic ultrasonic displacement estimates performed during ARFI imaging.<br />
Background: Studies by McAleavey et al. [1] have demonstrated that steady-state, Gaussian<br />
displacement fields in the focal zone of the tracking beams are subject to bias and jitter due to scatterer<br />
shearing in the lateral and elevation dimensions of the point spread function (PSF) of the tracking beams.<br />
These studies expand upon those findings to quantify the displacement estimate bias and jitter for<br />
realistic, dynamic 3D displacement fields generated by ARFI excitations.<br />
Methods: Models have been developed using Finite Element Methods and Field II [2], a linear acoustic<br />
field simulation package, to study the impact of focal configuration, frequency and material properties on<br />
the accuracy of ultrasonic tracking tissue deformation generated by acoustic radiation force excitation.<br />
Field II was used to simulate the acoustic radiation force field generated during ARFI imaging, while<br />
LS-DYNA3D was used to solve the equations of motion to determine the resulting dynamic<br />
3D displacement fields in materials of varying stiffness [3]. Those displacement fields were then used to<br />
translate 3D distributions of randomly positioned, uniform amplitude acoustic scatterers, and Field II<br />
was used to simulate different transducer configurations and their impact on tracking the displacement<br />
fields through time.<br />
Results: Displacement underestimation can be as great as 50% and jitter can be as great as +/- 2 m<br />
immediately after excitation in an 8.5 kPa medium. Both displacement underestimation and jitter<br />
improve with time after excitation as shear wave propagation away from the region of excitation reduces<br />
scatterer shearing within the tracking PSF in the lateral and elevation dimensions. The use of a broader<br />
excitation configuration (greater F/#) compared with the tracking beams can reduce shearing in the<br />
lateral dimension of a 1D array. The use of higher tracking frequencies in broadband transducers leads to<br />
decreased jitter levels and more accurate displacement tracking. Relative displacement underestimation<br />
remains constant and jitter increases as a function of displacement magnitude (i.e., applied force).<br />
Underdeveloped speckle (SNR < 1.91) leads to greater jitter and peak displacement underestimation<br />
immediately after ARFI excitation. Axial shearing over the tracking kernel lengths used in ARFI imaging<br />
does not impact ARFI displacement estimation.<br />
Conclusions: These models demonstrate that lateral and elevation shearing underneath the PSF of the<br />
tracking beam leads to displacement underestimation in the focal zone that can be reduced by using<br />
tracking beams that are confined within the extent of the displacement fields. Dynamic displacement<br />
estimate bias and jitter are dependent on material stiffness. The use of higher tracking frequencies with<br />
broadband transducers and multi-dimensional arrays should improve bias and jitter in displacement<br />
estimates. This model will allow for the impact of other factors on displacement tracking, such as<br />
physiologic motion, to be evaluated in ARFI imaging.<br />
Acknowledgements: The authors would like to thank Dr. Jeremy Dahl and Gianmarco Pinton for their<br />
insights, and Joshua Baker-LePain for his technical assistance.<br />
References:<br />
[1] S.A. McAleavey, K.R. Nightingale, and G.E. Trahey. “Estimates of echo correlation and measurement<br />
bias in acoustic radiation force impulse imaging,” IEEE Trans. Ultrason., Ferroelec., Freq. Contr.,<br />
50(6): 631-641, 2003.<br />
[2] J.A. Jensen and N.B. Svendsen. “Calculation of pressure fields from arbitrarily shaped, apodized,<br />
and excited ultrasound transducers,” IEEE Trans. Ultrason., Ferroelec., Freq. Contr., 39(2): 262-267,<br />
1992.<br />
[3] M.L. Palmeri, A.C. Sharma, R.R. Bouchard, R.W. Nightingale, and K.R. Nightingale. “A finite element<br />
method model of soft tissue response to impulsive acoustic radiation force,” IEEE Trans. Ultrason.,<br />
Ferroelec., Freq. Contr., in press.<br />
<br />
indicates Presenter<br />
56
013 THE IMPACT OF PHYSIOLOGICAL MOTION ON ABDOMINAL ACOUSTIC RADIATION FORCE<br />
IMPULSE IMAGING.<br />
BJ Fahey 1 , ML Palmeri 1 , GE Trahey 1 .<br />
1 Duke University, Department of Biomedical Engineering, 136 Hudson Hall, Durham, NC, USA.<br />
Aims: To assess the impact of physiological motion in <strong>org</strong>ans such as the liver on abdominal acoustic<br />
radiation force impulse (ARFI) imaging and suggest strategies for minimizing the prevalence of motion<br />
artifacts in images.<br />
Background: The presence of physiological motion in target tissues during ARFI imaging has two major<br />
consequences. First, significant motion can decorrelate speckle patterns, decreasing the effectiveness of<br />
correlation-based methods used for motion tracking. Secondly, axial components of physiologic motion<br />
will add biases to displacement estimates. Previous work has demonstrated the feasibility of acquiring<br />
ARFI images of the human abdomen that are free of significant motion artifacts [1], and Kolen et al. [2]<br />
have investigated physiological motion in the liver for the application of elasticity imaging. The current<br />
research builds upon these previous studies to quantify the tolerance for physiological motion in<br />
radiation force-based imaging methods (which generally have different methods and timescales for data<br />
acquisition compared to elastography) and assess the implications this has on imaging parameters such<br />
as line density, which govern the time window needed for data acquisition.<br />
Methods: A multi-axis linear translation stage with programmable velocity and acceleration settings was<br />
used to simulate single and multi-axis physiologic motion while imaging a uniform tissue-mimicking<br />
phantom. Velocity and acceleration values were chosen to cover ranges presented in [2]. Statistical<br />
methods were used to quantitatively assess the effects of motion in terms of speckle decorrelation and<br />
displacement bias. Finite Element Method (FEM) mechanical models were also used in conjunction with<br />
synthetic RF data to model the effects of physiological motion at a range of velocities, accelerations, and<br />
transmit frequencies. Experimental results and models were compared to theoretical predictions of<br />
speckle decorrelation and measurement bias. In addition, during in vivo ARFI imaging of human<br />
volunteers and of RF ablation procedures in ovine livers, images were acquired with and without<br />
implementing ECG-triggering and motion-correcting filters.<br />
Results: Motion of target tissues in ARFI imaging leads to speckle decorrelation artifacts if it is significant<br />
during the time period over which a single data line is sampled (1 – 3 ms). Therefore, in many ARFI<br />
imaging applications, motion artifacts are manifested mainly in the form of an added displacement bias to<br />
data. However, decorrelation artifacts will persist in ARFI images if large (e.g. respiratory) or high-velocity<br />
(e.g. imaging near large vessel) tissue motions are encountered. Although linear motion filters can be<br />
used to remove biases introduced by tissue motion, these filters become less effective as velocities<br />
increase and ineffective (and technically invalid) when significant tissue acceleration is present during<br />
acquisition. In vivo results from both human volunteers and animal models indicate that ECG-triggered<br />
data acquisitions with appropriately selected trigger delays can be used to effectively eliminate the<br />
presence of motion artifacts in many abdominal imaging applications.<br />
Conclusions: Physiological motion of target tissues can degrade the quality of ARFI images if it is of<br />
significant velocity or magnitude. Imaging parameters, such as line density, field-of-view, and the<br />
temporal window over which displacements are monitored, must be chosen carefully in order to maximize<br />
trade-offs between image quality and acquisition time. ECG-triggered data acquisitions used in<br />
conjunction with linear motion filters are effective at eliminating many artifacts in ARFI images associated<br />
with abdominal physiological motion.<br />
Acknowledgements: This work is supported by NIH grant #1R01CA114093-01.<br />
References:<br />
[1] Fahey, Brian J., et al. "Acoustic Radiation Force Impulse Imaging of the Abdomen: Demonstration of<br />
Feasibility and Utility." Ultrasound in Medicine and Biology, in press, <strong>2005</strong>.<br />
[2] Kolen, Alexander F. et al. "Characterization of Cardiovascular Liver Motion for the Eventual Application<br />
of Elasticity Imaging to the Liver In Vivo." Physics in Medicine and Biology, 49: 4187-4206, 2004.<br />
<br />
indicates Presenter<br />
57
017 RADIO FREQUENCY ABLATION ELECTRODE DISPLACEMENT ELASTOGRAPHY – A PHANTOM<br />
STUDY.<br />
Shyam Bharat 1,2 , Ernest L. Madsen 1 , James A. Zagzebski 1 , Tomy Varghese 1,3 .<br />
1 Medical Physics; 2 Electrical and Computer Engineering; 3 Biomedical Engineering Departments,<br />
University of Wisconsin – Madison, 1300 University Avenue, 1530 MSC, Madison, WI, 53706, USA.<br />
Aims: We describe a phantom-based validation study of a novel method of tissue perturbation for the<br />
elastographic visualization of radio frequency (RF) ablation-induced thermal lesions. This method involves<br />
the use of the RF ablation electrode as a controlled compression or displacement device. This method of<br />
inducing tissue displacement has previously been reported for in vivo experiments on porcine liver [1]. It<br />
provides localized compression in the region of interest. This phantom-based study seeks to quantify<br />
various aspects of this tissue displacement technique in terms of parameters such as inclusion size,<br />
contrast or strain ratio, contrast-to-noise ratio (CNR e ) and signal-to-noise ratio (SNR e ).<br />
Background: Various techniques such as external plate compression, diaphragmatic motion resulting<br />
from respiration and cardiovascular motion have been employed to induce in vivo compressions in the<br />
liver for elastographic imaging. Early in vivo uses of RF ablation electrode displacement elastography<br />
resulted in good quality elastograms for small electrode displacements, on the order of 0.05 – 0.1 mm.<br />
Problems such as excessive lateral and elevational motions (which are commonplace in external plate<br />
compression) are not expected to be encountered in this tissue displacement method.<br />
Methods: Initial studies have been performed on a single spherical inclusion phantom, with the inclusion<br />
being approximately 5 times stiffer than the background. Stepper motor controlled displacement was<br />
applied to an electrode with a U-shaped tip embedded in the inclusion, and raw ultrasound RF data was<br />
acquired with the ultrasound transducer positioned adjacent to the electrode stem. Data were acquired<br />
for different stages of electrode displacement away from the ultrasound transducer and towards the<br />
transducer (after an initial pre-compression of 0.25 mm). Ten independent data sets were acquired in<br />
each case. The inclusion width, height and area (as seen on the elastograms) were compared with known<br />
values. The contrast, CNR e and SNR e were also evaluated.<br />
Results: The elastographic inclusion width estimates are close to the actual value, although in this<br />
version of the phantom the height and area measures were consistently underestimated. The contrast is<br />
greater than expected, likely because of perturbation mode that provides the localized deformation. The<br />
CNR e and SNR e are fairly consistent over all stages of displacement.<br />
Conclusions: The RF ablation electrode displacement method for elastography offers the advantages of<br />
localized compression in the region of interest and results in good quality elastograms for extremely small<br />
displacements. It also causes little or no non-axial tissue motion and reduces lateral slippage, both of<br />
which, if present, are factors in reducing elastographic image quality. In an in vivo RF ablation procedure,<br />
this method offers the possibility of integrating the processes of RF ablation and elastography.<br />
Acknowledgements: This work is supported by the Whitaker Foundation grant RG-02-0457.<br />
References:<br />
[1] Varghese T, Zagzebski JA, Lee FT Jr. Elastographic imaging of thermal lesions in the liver in vivo<br />
following radiofrequency ablation: preliminary results. Ultrasound Med Biol 2002; 28(11/12):1467-1473.<br />
<br />
indicates Presenter<br />
58
053 IN-VITRO DEMONSTRATION OF REAL TIME MONITORING OF REGIONAL TISSUE ELASTICITY<br />
DURING FOCUSED ULTRASOUND THERAPY USING HARMONIC MOTION IMAGING.<br />
Caroline Maleke 1 , Mathieu Pernot 1 , Elisa E. Konofagou 1 .<br />
1 Columbia University, Department of Biomedical Engineering, 1210 Amsterdam Avenue,<br />
New York, NY 10027, USA.<br />
Aims: In this study, we discuss a new Harmonic Motion Imaging technique (HMI) that estimates tissue<br />
displacements produced by harmonic radiation force excitation using a single focused element in in-vitro<br />
tissue.<br />
Background: Previously, we demonstrated the feasibility of a technique for simultaneous monitoring of<br />
ultrasound therapy treatment using two separate focused ultrasound transducer elements [1]. First, wave<br />
propagation simulation models were used to compare the use of one Amplitude-Modulated (AM) focused<br />
beam versus two overlapping focused beams as previously implemented for HMI [1]. Simulation results<br />
indicated that, in unlike the two-beam configuration, the AM beam produced a consistent, stable focus<br />
for the applied harmonic radiation force. The AM beam thus offered the unique advantage of sustaining<br />
the application of the radiation force on the same tissue region.<br />
Methods: Experiments were then performed on tissue mimicking phantom and in-vitro tissues. The<br />
radiation force was generated by a 4.68 MHz focused transducer using a low-frequency<br />
Amplitude-Modulated (AM) Radio Frequency signal (RF). A 7.5 MHz single element, diagnostic transducer<br />
was placed through the center of the focused transducer so that the diagnostic and focused beams were<br />
properly aligned. A bandpass analog filter was used to remove the spectrum of the focused beam.<br />
Consecutive RF signals were acquired with a Pulse Repetition Frequency (PRF) of 5 kHz and the<br />
displacements were estimated using a classical cross-correlation algorithm.<br />
Results: The intensity of the focused beam was varied from 26.34 W/cm 2 to 421.44 W/cm 2 with the AM<br />
frequency at 5 Hz allowing us to detect tissue displacements before and after tissue ablation. Tissue<br />
displacements before and after ablation were found up to 131 μm and up to 101 μm respectively. The<br />
local elastic properties were reconstructed using a Voigt model [2], and the regional elastic moduli before<br />
and after ablation were found to be 1.4 kPa and 1.8 kPa respectively. Furthermore, taking advantage of<br />
the real-time capability of our method, the change in the elastic properties was monitored during focused<br />
ultrasound (FUS) ablation of tissue mimicking phantom. In this experiment, the intensity of the focused<br />
ultrasound beam was 948.23 W/cm 2 at the focus, in order to simultaneously generate the harmonic<br />
radiation force and the tissue temperature variation and ablation. A decreasing slope of the oscillatory<br />
displacements was observed with time due to the change in the speed of sound vs. temperature. Based on<br />
the harmonic displacements and the calculated acoustic radiation force, the local elastic modulus was<br />
determined.<br />
Conclusions: In conclusion, the feasibility of using an AM radiation force for harmonic motion imaging<br />
for simultaneous monitoring of tissue elasticity variation during ultrasound therapy was demonstrated in<br />
tissue mimicking phantoms and in-vitro tissues. Further study of this method will include stiffness and<br />
temperature mapping, ex-vivo and in-vivo.<br />
Acknowledgements: This study was supported by a Special Development Award from the Whitaker<br />
Foundation. The authors also wish to acknowledge the Riverside Research Institute for providing the<br />
transducers used for this study.<br />
References:<br />
[1] Konofagou EE, Hynynen K., Ultras Med Biol; 29(10), 1405-1413 (2003).<br />
[2] Krouskop, T., et al., Ultrasonic Imaging 20, 260-274 (1998).<br />
<br />
indicates Presenter<br />
59
019 NORMAL AND SHEAR STRAIN ESTIMATION AND ANGULAR COMPOUNDING USING BEAM<br />
STEERING ON LINEAR ARRAY TRANSDUCERS.<br />
Min Rao 1 , Quan Chen 1 , Hairong Shi 1 , E.L. Madsen 1 , J.A. Zagzebski 1 , Tomy Varghese 1 .<br />
1 University of Wisconsin-Madison, 1530 Medical Science Center, 1300 University Ave., Madison, WI, USA.<br />
Aims: In elastographic imaging, all components of the strain tensor are required to characterize the<br />
displacement following a compression since the resultant tissue motion inevitably occurs in three<br />
dimensions. Techavipoo et al. [1] recently proposed a method to estimate components of a displacement<br />
vector using RF echo signal data acquired along multiple angular insonification directions. In this study,<br />
we use this technique for estimating displacement vectors and strain tensor components using beam<br />
steering on a linear array transducer. We also investigate the performance of spatial angular<br />
compounding for elastography using the angular elastograms obtained.<br />
Background: Previous research for the estimation tissue displacement vectors for strain imaging has<br />
been reported [2, 3]. Lubinski et al. [2] obtained lateral displacements for strain imaging utilizing<br />
assumptions of tissue incompressibility. However, the incompressibility assumption may not hold in<br />
some tissues, and the Poisson’s ratio may not be a constant. Konofagou and Ophir [3] proposed the<br />
simultaneous estimation of both axial and lateral displacements and strains using a precision tracking<br />
algorithm. However, the extensive interpolation and recorrelation steps required increases the<br />
computational complexity. Spatial-angular compounding for elastography was also recently discussed [4].<br />
Methods: Single and multiple inclusion phantoms with different boundary conditions between the<br />
inclusion and background material were imaged. Phantoms were scanned using an Ultrasonix 500RP<br />
machine with a 5 MHz linear-array transducer having an approximately 60% band width. A compression<br />
plate with a rectangular slot fitted with the transducer was mounted on a stage driven by a stepper<br />
motor. Data was collected using an automated beam-steering and RF echo data acquisition algorithm<br />
implemented on the Ultrasonix system. Pre-compression data along specified angles (-15º to 15º) at 0.75º<br />
increments are acquired, following which, the stepper motor is activated to compress the phantom.<br />
Following the compression, post-compression RF data are acquired along the same angles. Displacements<br />
were then measured along each beam direction. Axial (parallel to the compression direction) and lateral<br />
components of the displacement vector were estimated from the angular displacement data using a least<br />
squares solution. Strain tensor components are then estimated from the axial and lateral displacements.<br />
For spatial angular compounding the angular elastograms estimated at different angles are appropriately<br />
weighted and then averaged to generate a compounded elastogram.<br />
Results: Axial-strain elastograms using this technique have higher image quality than traditional strain<br />
images. Lateral strain images have a lower signal to noise ratio (SNR) than axial strain images. Inclusions<br />
are clearly visible in both lateral and axial strain elastograms as well as in the estimated shear strain<br />
elastograms. Different patterns are observed in shear strain images of a mobile inclusion than in images<br />
of fixed inclusions. Improvements in the signal-to-noise (SNR e ) of 5dB for maximum angles in the range of<br />
9 to 15º and contrast-to-noise ratios (CNR e ) of around 8 to 16dB, with the maximum angles ranging from<br />
9 to 12º are obtained with by angular compounding for the single inclusion phantom.<br />
Conclusions: Angular RF echo signals synchronized to the mechanical, uniaxial compressions using<br />
beam steering on a linear array transducer are acquired. These were used to generate axial, lateral, and<br />
shear strain images. Compounded elastograms also can be generated from angular elastograms to reduce<br />
noise artifacts. Experimental results suggest that shear strain images have a role in differentiating fixed<br />
from mobile lesions in the breast. The compounded elastograms demonstrate significant improvement in<br />
the SNR e and CNR e obtained by angular compounding.<br />
Acknowledgements: This work is supported in part by NIH grant R21 EB003853 and R01EB000459.<br />
References:<br />
[1] Techavipoo, U., et al., IEEE Trans. Med. Imag., 2004. 23(12): p. 1479-1489.<br />
[2] Lubinski, M.A., et al., IEEE Trans. Ultrason. Ferroel. Freq Cont., 1996. 43(2): p. 247-256.<br />
[3] Konofagou, E., and J. Ophir, Ultrason. Med Biol., 1998. 24(8): p. 1183-1199.<br />
[4] Techavipoo, U., et al., IEEE Trans. Ultrason. Ferroel. Freq Cont., 2004. 51(5): p. 510-520.<br />
<br />
indicates Presenter<br />
60
071 DESIGN OF A HAND-HELD PROBE FOR IMAGING TISSUE ELASTICITY.<br />
Hassan Rivaz 1 , Robert Rohling 1 .<br />
1 Department of Electrical and Computer Engineering, University of British Columbia, Vancouver, BC, CANADA.<br />
Aims: This paper describes a hand-held probe with a combined vibration source and ultrasound<br />
transducer to measure the motion. A multi-frequency excitation is used together with a recently<br />
developed vibro-elastography (VE) [1] method for extracting the tissue properties. Since the hand-held<br />
device is light, reaction forces from the tissue induce large amplitude vibrations of the user’s hand.<br />
Therefore, the design uses a vibration absorption system to counter-balance the reaction forces from<br />
contact with the tissue.<br />
Background: VE identifies the mechanical properties of tissue by measuring tissue motion in response to<br />
an external multi-frequency vibration, followed by system identification techniques to estimate the tissue<br />
properties. Previous research on VE showed the possibility of measuring the tissue properties by solving 1D<br />
equations of motion of a tissue model, or plotting the transfer function of motion between two points.<br />
Methods: Four different methods for reducing vibration are well known: vibration isolation, passive<br />
vibration absorption, semi-active vibration absorption and active vibration absorption. An active dynamic<br />
vibration absorption (DVA) technique called the Delayed Resonator (DR-DVA) [2] is exploited in this<br />
design. Figure 1(a) shows a model of an active dynamic vibration absorber attached to the primary<br />
system, the hand-held device. In this picture, F e , F c , m a , b a and k a are the excitation forces that vibrate<br />
tissue, the vibration absorption control force, absorber mass, absorber damping and absorber stiffness<br />
respectively. In order for DR to cancel the vibrations of the hand-held device at the excitation frequency of<br />
ω e , the feedback force, F c , should be applied such that the absorber system mimics a resonator at the<br />
frequency of ω e [2].<br />
Results: Figure 1(b) shows the design of the hand-held device. The main parts of the probe are two linear<br />
voice-coil actuators (one for excitation, one for DR-DVA), a faceplate, an absorber mass and an<br />
accelerometer. The probe is designed for a desired frequency range of 5-25 Hz to cover a significant<br />
bandwidth of the tissue response. Different ranges are possible by tuning the system. Several experiments<br />
were then carried out on the probe to show the effectiveness of the DR-DVA. In Figure 1(c), the probe is held<br />
by a human operator on the forearm of a human subject. In this experiment, the DR-DVA starts at t=0.8 s,<br />
and decreases the peak-to-peak motion from 1.28 mm to 0.13 mm. A B-mode image obtained from a three<br />
layered phantom is shown in Figure 1(d). The middle layer of the phantom is stiffer than the other layers<br />
but exhibits the same acoustic properties; therefore is not visible in the B-mode image. Figures 1(e) and 1(f)<br />
show two vibro-elastograms obtained with the hand-held device using a 5 Hz excitation without and with<br />
DR-DVA respectively. The time domain cross-correlation with prior estimates [3] is used for motion<br />
tracking. The motion tracking accuracy is reduced by probe vibration, resulting in a poor vibro-elastogram<br />
(Figure 1(e)). A vibro-elastogram obtained with the hand-held device using a 1 Hz excitation is shown in<br />
Figure 1(g). The use of such low frequency excitations requires a new control algorithm that is operational<br />
from 0-25 Hz. We are currently developing such a new algorithm based on proportional-integral control.<br />
Future research will therefore continue to focus on two main goals: reduce probe vibration as a way to<br />
increase the accuracy of VE, and reduce user fatigue.<br />
Figure 1: (a) schematic of active vibration absorber (b) hand-held device (c) vibration absorption experiment at 10 Hz (d) B-mode<br />
image (e) elastogram without DVA (f) elastogram with DVA (g) elastogram at 1 Hz.<br />
References:<br />
[1] E. Turgay, S. MacIntosh, R. Rohling and S. Salcudean. Parameter identification of tissue lumped models based on sequences<br />
of ultrasonic train images. Second Intl. Conf. on Ultrasonic Measurement and Imaging of Tissue Elasticity. pp. 29, Corpus<br />
Christi, Texas, Oct. 2003.<br />
[2] N. Olgac, Holm-Hansen. A novel active vibration absorption technique: delayed resonator. J. of Sound and Vibration Vol. 176<br />
pp 93-104, 1994.<br />
[3] R. Zahiri, S. E. Salcudean. Time domain cross correlation with prior estimates. Third Intl. Conf. on Ultrasound Measurement<br />
and Imaging of Tissue Elasticity. Lake Windermere, Cumbria, UK, Oct. 2004.<br />
<br />
indicates Presenter<br />
61
Session FIP-1: Forward and Inverse Problems – I<br />
Monday, October 17 10:15A – 11:30A<br />
049 SHEAR MODULUS RECONSTRUCTION USING DIRECT FINITE ELEMENT INVERSION<br />
ALGORITHM IN TRANSIENT ELASTOGRAPHY.<br />
Eunyoung Park 1 , Antoinette M. Maniatty 1 .<br />
1 Rensselaer Polytechnic Institute, Jonsson Engineering Center 2049, 110 8th Street, Troy, NY, USA.<br />
Aims: The goal of this work is to reconstruct the shear modulus field in tissue from discrete<br />
measurements of the displacement field in space and time resulting from an interior or exterior,<br />
transient, dynamic excitation. A robust, fast algorithm that considers the complete equations of isotropic,<br />
linear, elasto-dynamics is sought.<br />
Background: Reconstruction of tissue elastic properties, in particular shear modulus which characterizes<br />
elastic resistance to shape change, holds great promise as a diagnostic tool because of the close<br />
relationship between the elastic shear modulus and the underlying structure of tissue. The shear<br />
modulus is also closely related to the shear wave speed; thus, observation of shear waves traveling<br />
through tissue can provide a rich dataset for recovering the shear modulus. Based on this premise,<br />
ultrasound [1] and MRI [2] techniques have been developed for measuring the displacement field in tissue<br />
resulting from a single frequency pulse excitation in order to observe propagating shear waves. Using<br />
such data, several researchers have presented methods for reconstructing the shear modulus field. In<br />
order to simplify the inversion algorithm, most researchers assume the equations for elasto-dynamics can<br />
be approximated by the Helmholz equation. To make this simplification, the gradients of the pressure and<br />
shear modulus fields are neglected. In this work, the complete equations for elasto-dynamics are<br />
considered and the effect of these simplifying assumptions investigated.<br />
Methods: A space-time finite element method is used as a basis for the inversion algorithm. This<br />
approach is chosen because it reduces the highest order derivatives in space and time from two to one,<br />
which reduces sensitivity to noise, and allows for the general equations of elasto-dynamics to be<br />
considered. A mixed formulation, with interpolation of both the displacement and pressure field, is used<br />
in order to handle the relatively, nearly incompressible behavior of tissue. A direct inversion approach is<br />
used for solving for the shear modulus field because it does not overweight the boundary data and is<br />
quick since it does not require iterations nor forward solution of the governing equations. In addition, it<br />
can be applied on local subdomains, which also reduces the computation time as well as allows for<br />
straightforward parallelization of the algorithm. In this approach, the pressure as well as the shear<br />
modulus are reconstructed.<br />
Results: The shear modulus distribution is reconstructed quantitatively from numerical and experimental data.<br />
The effect of neglecting the pressure gradient is considered. The effect of the time window of the data chosen to<br />
be used in the reconstruction for a given region of interest is also investigated. This choice of window is<br />
important because sufficient data is needed for a unique reconstruction, and the data with the most<br />
information, i.e. data with a high signal to noise ratio, should be chosen.<br />
Conclusions: The primary advantages of this algorithm are: it considers the complete equations for<br />
isotropic, linear elasto-dynamics; it is extendible to more complex constitutive models, such as<br />
considering anisotropy and viscoelastic effects, provided sufficient data is available; does not overweight<br />
boundary data; and is fast relative to other finite element based methods. Since this method requires the<br />
reconstruction of the pressure distribution, which depends on both space and time, there is the potential<br />
to have too many unknowns. An appropriate choice for the window in the time domain is needed to<br />
ensure that the number of equations will be more than that of unknowns.<br />
Acknowledgements: This work has been supported by the National Science Foundation through grant<br />
DMS-0101458 and by the National Institutes of Health through grant 5 R21 EB003000-02. The authors<br />
thank J. McLaughlin, J-R. Yoon, and D. Renzi at Rensselaer for many valuable discussions.<br />
References:<br />
[1] J. Bercoff, M. Tanter, and M. Fink, “Supersonic Shear Imaging: a new technique for soft tissues elasticity<br />
mapping,” IEEE Trans. Ultrason., Ferroelec., Freq. Contr. 51 (4), 374-409, 2004.<br />
[2] P.J. McCracken, A. Manduca, J. Felmlee, R.L. Ehman, “Mechanical transient-based magnetic resonance<br />
elastography,” Magn. Reson. Med., 53 (3), 628-639, <strong>2005</strong>.<br />
<br />
indicates Presenter<br />
62
023 FINITE ELEMENT ANALYSIS AND YOUNG’S MODULUS RECONSTRUCTION FOR ELASTICITY<br />
IMAGING WITH DEFORMATION BY A RADIOFREQUENCY ABLATION ELECTRODE.<br />
J Jiang 1 , T Varghese 1 , TJ Hall 1 , Q Chen 1 and JA Zagzebski 1 .<br />
1 Medical Physics Department, University of Wisconsin-Madison, Madison, WI, USA.<br />
Background: Recent results (e.g. [2]) indicate changes in tissue stiffness following RF ablation correlate<br />
with the ablation temperature. Hence, elasticity imaging might be a means to monitor tissue status<br />
during the RF ablation process. Previous work by our group [1] demonstrated that tissue deformation<br />
obtained by moving the ablation electrode during radiofrequency (RF) ablation was controllable and<br />
reproducible and yielded clinically acceptable elastograms. This presentation will summarize our recent<br />
advances in modulus imaging for monitoring RF ablation.<br />
Aims: The aims of this study were to understand the mechanics of tissue deformation with the RF<br />
ablation electrode using finite element analysis (FEA) and to develop a computer model to reconstruct<br />
Young’s modulus from simulated ultrasound data. One of the challenges that must be met in this effort<br />
stems from the fact that a typical RF needle electrode and the tissue interactions are three dimensional<br />
and nonlinear. Even modeling the biomechanical contact between the needle electrode (cylindrical<br />
geometry) and thermal lesion (spherical or oval objects) with FEA is a computationally demanding task.<br />
We have developed a new approach under which the reconstruction problem for this geometry is<br />
simplified to a two-dimensional problem. This simplification relaxes computational demands typically<br />
required for full three-dimensional finite element analysis (FEA) based modulus reconstruction.<br />
Methods: Forward FEA was used to investigate the feasibility of reconstructing the Young’s modulus<br />
distribution resulting from RF ablation. Specifically, assuming that the RF electrode is always bound to<br />
the treated tissue but is not attached to the untreated tissue, realistic tissue deformations were<br />
simulated from a 3D rigorous finite element model where tissue was deformed by displacing the RF<br />
ablation electrode. The simulated tissue deformation patterns were then employed to deform an assumed<br />
numerical phantom. A frequency-domain ultrasound simulation program [4] was employed to compute<br />
images of the numerical phantom and to obtain pre- and post-deformation RF echo data. Lastly, an<br />
iterative Young modulus reconstruction with total variation regularization [3] was used to obtain tissue<br />
modulus with axial displacements estimated from the numerical phantom.<br />
Results: The effect of this 2-D simplification on modulus reconstruction was evaluated by comparing the<br />
axial displacement field to that of its corresponding rigorous three-dimensional FEA model. The absolute<br />
difference between the axial displacement images obtained using the 3-D model and the 2-D simplified<br />
model provides a quantitative measure of the errors incurred for the simplification. The absolute peak<br />
difference was 12% for the plane stress condition and 25% for the plane strain condition, while the<br />
average absolute differences were 7% and 17%, respectively. The plane stress condition, therefore,<br />
provides the best approximation to the 3-D model. Preliminary results, obtained using the ultrasound<br />
simulation program [4], suggest that high contrast modulus images can be reconstructed. The estimated<br />
Young’s moduli for thermally-introduced lesions were underestimated by about 10%, while the size of<br />
thermal lesions was underestimated by 15-20% along the direction perpendicular to the needle<br />
displacement direction on modulus images.<br />
Conclusions: FEA of tissue deformation with the RF ablation electrode is an important step toward understanding<br />
this biomechanical system in vivo. Using numerical phantoms based on FEA computed tissue deformations, we<br />
found that it is feasible to reconstruct the Young’s modulus distribution following measurements of tissue<br />
deformation with a RF ablation electrode. The underestimation of lesion size and the large error variance in<br />
modulus estimates are due to the 2D simplified model; this topic requires further attention.<br />
Acknowledgements: This work is supported in part by grants from CDMRP DAMD17-00-1-0596,<br />
NIH-R01CA100373, NIH-R21-EB002722, Whitaker Foundation RG-02-0457, and the UW-Madison.<br />
References:<br />
[1] T. Varghese, J. A. Zagzebski, and F. T. Lee, "Elastographic imaging of thermal lesions in the liver in vivo following<br />
radiofrequency ablation: preliminary results," Ultrasound Med Biol, 28, pp. 1467-73, 2002.<br />
[2] S. Bharat et al., "Monitoring stiffness changes in lesions after radiofrequency ablation at different temperatures<br />
and durations of ablation," Ultrasound in Med Biol, 31, pp. 415-422, <strong>2005</strong>.<br />
[3] C. R. Vogel and M. E. Oman, "Fast, robust total variation-based reconstruction of noisy, blurred images," IEEE<br />
Transactions on Image Processing, 7, pp. 813-824, 1998.<br />
[4] Y. Li and J. A. Zagzebski, "Frequency domain model for generating B-mode images with array transducers," IEEE<br />
Transactions on UFFC, 46, pp. 690-699, 1999.<br />
<br />
indicates Presenter<br />
63
086 THREE DIMENSIONAL ULTRASOUND IMAGE REGISTRATION AND SHEAR ELASTIC<br />
MODULUS RECONSTRUCTION.<br />
Michael S Richards 1 , Nachiket H Gokhale 2 , Assad A Oberai 2 , Paul E Barbone 2 .<br />
1 Biomedical Engineering, 2 Aerospace and Mechanical Engineering Departments, Boston<br />
University, 110 Cummington Street, Boston, MA 02215, USA.<br />
Aims: To develop and evaluate an ultrasound technique to quantitatively measure and image the<br />
mechanical properties of soft tissues in 3D. The intended application of our work is in the detection and<br />
diagnosis of breast cancer and other soft tissue pathologies. The specific goal of this project is the accurate<br />
measurement of the elastic shear modulus distribution of a tissue mimicking ultrasound phantom, using a<br />
3D ultrasound imaging system. This requires the design and characterization of algorithms to provide<br />
3D motion estimates and to solve the 3D inverse problem to recover shear elastic modulus.<br />
Background: Ultrasound elastography typically utilizes quasistatic compression of tissues. The<br />
deformation is observed via 2D (plane) ultrasound. It is measured by cross-correlation block image<br />
matching, and interpreted via the strain field. These methods are simple to apply clinically,<br />
computationally inexpensive, easy to interpret, and have demonstrated clinical benefit in several studies.<br />
Nevertheless, they have some drawbacks; the elimination of which may further improve clinical<br />
performance. For example, though the observation is 2D, the deformation field in vivo may be expected to<br />
violate 2D assumptions. In addition, in noisy situations, block-matching tends to produce noisy<br />
displacement estimates. We have developed two methods by which we reconstruct a 3D modulus image<br />
from the ultrasound data. In both cases, the measured deformation is interpolated on a 3D finite element<br />
mesh, which effectively provides local and optimal "companding". The first method uses a sum-squared<br />
intensity difference objective function, which is minimized to produce displacements. These<br />
displacements are then used in an inverse algorithm which minimizes the difference in displacement from<br />
those measured, to those predicted given a shear modulus distribution and the equations of linear<br />
elasticity. The adjoint method combined with a gradient based, quasi-Newton inversion algorithm is used<br />
to find the modulus distribution which minimizes this equation. The second is a constrained optimization<br />
algorithm which minimizes the sum-squared image intensity difference with respect to the shear modulus<br />
distribution directly. The adjoint method and a gradient based, quasi-Newton inversion algorithm is also<br />
used to find this modulus distribution.<br />
Methods: To acquire our 3D ultrasound images, we mechanically translate a linear ultrasound array in<br />
the elevation direction to obtain multiple images. We use a 10-12 MHz linear array driven by our Analogic<br />
Ultrasound Engine (AN 2300) which allows us access to the preprocessed RF data. The modulus inversion<br />
algorithms require the input of either the displacement or traction boundary conditions of the image<br />
domain. This data can either be calculated from the images or known experimentally. The algorithms can<br />
also calculate modulus distributions from multiple sets of images, or multiple displacements, if they are<br />
necessary to ensure the uniqueness of the solution.<br />
Results: Results are presented of displacement measurements and shear modulus inversions which were<br />
calculated from the ultrasound phantom created and imaged in our lab. The exact dimensions and<br />
contrast of the resulting shear modulus image are compared with the actual phantom dimensions and<br />
independently calibrated mechanical properties. A comparison of the shear modulus inversion from<br />
displacement measurements and inversion directly from ultrasound image pairs is shown. The effect of<br />
the boundary conditions and regularization methods on the reconstructed modulus images and the<br />
uniqueness of the solution are also discussed.<br />
Conclusions: Our algorithms for shear modulus reconstructions may improve the detection and<br />
diagnostic power of standard mammography practices. The resulting modulus images are quantitative<br />
and can provide an accurate representation of the mechanical properties and spatial distributions of soft<br />
tissue. Our image acquisition and computational costs are high due to the size of the 3D images and<br />
problem calculations. The nature of this algorithm makes it well suited for applications in mammography,<br />
where the mechanical behavior of the tissue is well controlled. This algorithm also has the potential to be<br />
applied to a broad spectrum of imaging modalities, including Ultrasound, X-ray tomosynthesis, and MRI.<br />
Acknowledgements: This work is supported in part by CenSSIS (The Center for Subsurface Sensing and<br />
Imaging Systems) under the Engineering Research Centers Program of the National Science Foundation<br />
(Award No. EEC-9986821) and the Department of Defense Breast Cancer Research Program (Award<br />
No. W81XWh-04-1-0763).<br />
<br />
indicates Presenter<br />
64
089 ZERO MEMORY GAUSS-NEWTON METHOD FOR THE DETECTION OF SMALL INCLUSIONS.<br />
J Fehrenbach 1 , M Masmoudi 1 , R Souchon 2 , P Trompette 2 .<br />
1 Laboratoire MIP, Toulouse, FRANCE; 2 INSERM UMR 556, Lyon, FRANCE.<br />
Aims: Elastography is an emerging imaging technique that provides a strain image of an elastic tissue<br />
under a small compression. Here, we address the problem of Young's modulus estimation from an<br />
elastogram. A Gauss-Newton algorithm was applied to elastography under known boundary conditions in<br />
[1] and [2], but this algorithm has a heavy computational cost. Our first contribution is to identify the<br />
boundary conditions. We also propose an implementation of Gauss-Newton algorithm that requires little<br />
memory (only one stiffness matrix is stored) and few computations. This algorithm was applied to<br />
experimental data.<br />
Background: Numerous reports and methods have been published on the estimation of Young's<br />
modulus. In [3], the strain-based and model-based modulus elastography were compared, and it was<br />
shown that model-based elastography provides a better estimation of modulus contrast.<br />
Methods: In this contribution, we implemented a Gauss-Newton algorithm that uses both direct and<br />
reverse modes of algorithmic differentiation [4]. This implementation was applied to two consecutive<br />
inverse problems. The first one was to estimate the forces on the boundaries, since measured data are<br />
only radial strain. The second inverse problem is the Young's modulus reconstruction itself.<br />
Results: Our algorithm was applied to data obtained from a gelatin phantom [5]. The estimation of the<br />
boundary conditions was satisfactory, at least qualitatively, since with our experimental data, 4 small<br />
inclusions out of 6 were detectable. The Young's modulus reconstruction showed the 4 inclusions, as<br />
expected. All these computations were performed on a standard desktop computer. However, the true<br />
value of the Young's modulus was not checked against an independent method.<br />
Conclusions: The Gauss-Newton implementation presented here allowed working on fine meshes for<br />
solving the Young's modulus inverse problem. This allowed finding small inclusions in an elastic medium.<br />
Further studies have to be conducted to compare the measured contrast to the true contrast.<br />
Acknowledgements: This work was supported in part by the National Cancer Institute (USA) Program<br />
Project Grant P01-64597 to the University of Texas Medical School at Houston; and by the ACINIM CNRS<br />
Project (France)<br />
References:<br />
[1] F Kallel, M Bertrand, Tissue Elasticity Reconstruction Using Linear Perturbation Method, IEEE<br />
Trans.Med.Imag. 15(3), 299-313 (1996).<br />
[2] M Doyley, P Meaney, J Bamber, Evaluation of an Iterative Reconstruction Method for Quantitative<br />
Elastography, Phys.Med.Biol. 45(6), 1521-1540 (2000).<br />
[3] M Doyley, S Srinivasan, S Pendergrass, Z Wu, J Ophir, Comparative Evaluation of Strain-Based and<br />
Model-Based Modulus Elastography, Ultrasound Med.Biol.31(6), 787-802 (<strong>2005</strong>).<br />
[4] A Griewank, Evaluating Derivatives, Principles and Techniques of Algorithmic Differentiation,<br />
Frontiers in Applied Mathematics, SIAM (2000).<br />
[5] R Souchon, O Soualmi, M Bertrand, JY Chapelon, F Kallel, J Ophir, Ultrasonic Elastography Using<br />
Sector Scan Imaging and a Radial Compression, Ultrasonics 40(1-8) 867-871 (2002).<br />
<br />
indicates Presenter<br />
65
092 THE INFLUENCE OF CAUSALITY ON THE RECONSTRUCTION OF SHEAR MODULUS FOR<br />
DYNAMIC ELASTOGRAPHY.<br />
Benjamin Robert 1 , Ralph Sinkus 1 , Jeremy Bercoff 1 , Mickael Tanter 1 , Mathias Fink 1 .<br />
1 Laboratoire Ondes et Acoustique, ESPCI, 10 rue Vauquelin, 75005 Paris, FRANCE.<br />
Aims: The principle of causality (Kramers-Kronig relations) imposes an underlying relationship between<br />
the loss modulus G l and the dynamic modulus G d . Thereby, the shear modulus - as reconstructed by the<br />
classical Voigt model - does not represent the elasticity at zero frequency ( 0 ). Aim of this analysis is to<br />
present a technique leading to a reduced bias for the reconstruction of the shear modulus in case of<br />
dynamic elastography.<br />
Background: Many analyses suggest that attenuation of acoustic waves obeys a power law dependence on<br />
frequency . This leads the loss modulus to the general form G l b Utilization of the Kramers-Kronig<br />
relations yields the corresponding expression for the dynamic modulus G d = 0 +ctg(/2)*G l [2].<br />
Reconstruction is typically done utilizing the classical wave equations [3], i.e.:<br />
qG d qiG l q, q=curl(u), u = displacement vector. Equation (1)<br />
Thus, if the material obeys a linear power law (i.e. =1), reconstruction of the dynamic modulus G d provides<br />
the desired information 0 . There is, however, strong evidence that tissue does not obey a linear power law<br />
[4, 5] leading to difficulties to properly interpret G d . In steady-state mono-frequent elastography, the<br />
assessment of the power is not possible. Moreover, due to the utilization of compressional waves for<br />
mechanical excitation, it is observed that the reconstruction of the loss modulus G l yields negative values<br />
within tumors. This is caused by the fact that tumors act as sources of shear waves due to strong internal<br />
mode conversion. Thus, a malignant absorbing tumor might appear soft in the image of G d (Figure1).<br />
Methods: G d and G l correspond to the material parameters of the classical Voigt model ( Voigt =G l ,<br />
Voigt =G l /). Thus, the bias for the estimation of 0 is determined by Voigt = ctg(/2)*G l which can vary<br />
depending on the sign of G l . If we choose to reconstruct the data not with the classical Voigt model but<br />
rather with the Maxwell model (spring and dashpot are here in series), we find the following equation:<br />
q-i Max qi 3 Max Max q. Equation (2)<br />
This equation can be rewritten such that it resembles the form of Equation (1) providing:<br />
Max = Voigt + (G l ) 2 /G d . Equation (3)<br />
The second term in Equation (3) does not depend upon the sign of the loss modulus and counteracts the<br />
first term. It can be shown that the bias on Max is greatly diminished for those cases were G l is negative.<br />
Whenever G l is positive, the Voigt model is the one providing less bias.<br />
Results & Conclusions: In-vivo results from breast lesions indicate the necessity to take the sign of G l<br />
into account for reconstruction of G d . Furthermore, it is demonstrated that the power dependence of the<br />
loss modulus is not linear within breast lesions since otherwise the maps of G d would show the tumors.<br />
a) b) c) d) e)<br />
Figure 1: a) MR-subtraction image indicating the location of the tumor. b) Map of reconstructed lost modulus<br />
Voigt =Gl/ [Pa*s]. Strongly negative values are recorded at the location of the tumor. c) Map of<br />
reconstructed dynamic modulus Gd= Voigt [kPa]. The tumor does not appear as a hard entity although<br />
the change in wavelength is clearly visible in the map of qy=curl(u)y (see d). e) the tumors are well<br />
visualized. Here, both values, Voigt and Maxwell , are mixed according to the sign of Gl.<br />
References: [1] Szabo, J. Acoustic Soc. Am. 96 (1) July (1994) 491-500.<br />
[2] Pritz, Applied Acoustics 65 (2004) 1027-1036.<br />
[3] Sinkus et. el, MRI 23 (2) February (<strong>2005</strong>) 159-165.<br />
[4] Mason et. al., J. Rheol. 44 (4) July/August (2000) 917-928.<br />
[5] Kiss et al., Phys. Med. Biol. 49 (2004) 2307-4218.<br />
<br />
indicates Presenter<br />
66
Session CVE: Cardiovascular Elasticity<br />
Monday, October 17 1:00P – 2:45P<br />
007 MOTION COMPENSATION FOR INTRAVASCULAR ULTRASOUND PALPOGRAPHY FOR IN VIVO<br />
VULNERABLE PLAQUE DETECTION.<br />
K. Y. Esther Leung 1 , Radj A. Baldewsing 1 , Frits Mastik 1 , Mikhail G. Danilouchkine 1 ,<br />
Johannes A. Schaar 1 , Andries Gisolf 2 , and Antonius F. W. van der Steen 1,3 .<br />
1 Biomedical Engineering, Thorax Centre, Erasmus MC, Rotterdam, The NETHERLANDS;<br />
2 Acoustical Imaging and Sound Control, Faculty of Applied Sciences, Delft University of<br />
Technology, The NETHERLANDS; 3 Interuniversity Cardiology Institute of The Netherlands,<br />
Utrecht, The NETHERLANDS.<br />
Background: Intravascular ultrasound palpography can assess the mechanical properties of coronary<br />
arteries in vivo by radial strain measurements. Validation studies of this technique, previously reported at<br />
this conference, have revealed a clear association between high-strain patterns and the number of<br />
vulnerable plaques. The strain is measured by cross-correlating RF signals acquired at different systemic<br />
pressures. However, catheter motion due to cardiac activity causes misalignment of these signals, so that<br />
fewer strain estimates are obtained.<br />
Aims: This study reports motion compensation methods to correct for in-plane catheter rotation and<br />
translation.<br />
Methods: Four motion compensation methods, all based on block matching, were devised. The global<br />
rotation block matching (GRBM) and contour mapping (CMAP) methods measured catheter rotation,<br />
while local block matching (LBM) and catheter rotation and translation (CRT) estimated displacements of<br />
local tissue regions. The methods were validated on nine in vivo pullback acquisitions, acquired with a<br />
20 MHz 64 element phased-array transducer (Volcano Corp.) at 30 frames/s. Each frame consisted of<br />
512 circumferential RF lines and 1024 radial samples, which were sampled at 100 MHz. The motion<br />
compensation methods were used to align the RF signals of consecutive diastolic frames before strain<br />
calculation. The resulting strain images, i.e. partial palpograms, were aligned and averaged per heart<br />
cycle to produce more accurate and robust compounded palpograms. To assess the performance of each<br />
method, the number of valid strain estimates in the partial and compounded palpograms was compared<br />
with the number without motion compensation. The validity of a strain estimate was determined from the<br />
theoretical relationship between strain and decorrelation of the signals: if the decorrelation did not fit the<br />
expected value as predicted by the measured strain within a certain bandwidth, the strain estimate was<br />
considered invalid.<br />
Results: We found that all four methods significantly increase the number of valid strain estimates in the<br />
partial and compounded palpograms (P
005 A COMPOUNDING METHOD FOR RECONSTRUCTING THE HETEROGENEOUS YOUNG’S<br />
MODULUS DISTRIBUTION OF ATHEROSCLEROTIC PLAQUES FROM THEIR RADIAL STRAIN.<br />
Radj A. Baldewsing 1 , Frits Mastik 1 , Johannes A. Schaar 1 , and Antonius F. W. van der Steen 1,2 .<br />
1 Biomedical Engineering, Thorax centre, Erasmus MC, Rotterdam, The NETHERLANDS;<br />
2 Interuniversity Cardiology Institute of the Netherlands, Utrecht, The NETHERLANDS.<br />
Background: Rupture of vulnerable atherosclerotic plaques, with subsequent thrombosis, is the main<br />
cause of stroke and myocardial infarction. Pharmaceutical treatments aim at stabilizing a plaque by<br />
reducing or stiffening its atheroma. Stabilization can be quantitatively monitored by imaging the Young’s<br />
Modulus (YM). Since a radial strain elastogram can be reliably measured in vivo using intravascular<br />
ultrasound (IVUS) elastography, a YM image can be obtained from it by solving the inverse problem.<br />
Aims: A compounding method for solving the inverse problem for arbitrary atherosclerotic plaques is<br />
described. It is an extension of a previous YM reconstruction framework [1] that was mainly suited for<br />
reconstruction of thin-cap fibroatheromas (i.e., plaques with a large lipid pool covered by a thin fibrous<br />
cap). To allow YM reconstruction of an arbitrary plaque, the following adaptations are made to the<br />
existing framework: (1) use of deformable Bezier curves to parameterize arbitrary geometries of plaque<br />
components, (2) use of the strain elastogram to define initial YM distributions and (3) use of a<br />
compounding method to obtain a heterogeneous YM distribution from individual YM reconstructions.<br />
Methods: An individual YM reconstruction is obtained from a measured strain elastogram, as follows: an<br />
optimization algorithm adjusts the morphology and stiffness parameters of a Plaque Finite Element Model<br />
(PFEM), to maximize the similarity (in terms of root mean squared error) between the simulated and<br />
measured strain elastograms. The PFEM’s morphology parameters are the control-points of two<br />
deformable Bezier curves, one curve delineates the lipid pool, the other the cap; each of these plaque<br />
components is homogenous and its stiffness is characterized by a YM. The inner and outer PFEM<br />
boundaries are detected from the IVUS echogram.<br />
Each individual YM reconstruction was started from a PFEM Initial State (IS) (i.e., initial values for the<br />
PFEM morphology and stiffness parameters). IS were automatically created, as follows: (a) each high<br />
strain (>~0.7%) region produced an IS by placing the PFEM lipid pool tightly around it and the PFEM cap<br />
in front of it, and (b) at the area of maximum wall-thickening a large PFEM lipid pool was placed with the<br />
PFEM cap in front of it. The initial YM of the plaque components were estimated from their mean strain<br />
according to a theoretical “YM-strain” relationship for a pressurized axisymmetric homogeneous tube.<br />
Finally, each reconstructed YM image was compounded into a final YM image. This was done by locally<br />
weighting each reconstruction with the inverse of the local difference between simulated and measured<br />
strain elastogram. The method was applied to five FE-simulated radial strain elastograms (e.g., Figure A)<br />
obtained from histology-traced YM distributions [2] (e.g., Figure B) of five atherosclerotic human coronaries.<br />
Results: For the studied arteries, the compounded YM image (e.g., Figure C) showed much resemblance<br />
with the histology-traced YM (e.g., Figure B). However, not all soft regions were (correctly) identified.<br />
Probable causes are: (a) not every soft region gives rise to high strain and vice versa, consequently, no IS<br />
was placed, or (b) there was too much strain decay from inner to outer wall-border as a result of natural<br />
stress decay caused by the circumferential geometry of the vessel wall.<br />
Conclusions: Our fully automatic method reconstructs the heterogeneous YM distribution of arbitrary<br />
atherosclerotic plaques from their radial strain elastogram. It may be used for in vivo tissue<br />
characterization to quantify pharmaceutical induced plaque stabilization. The method can be generalized<br />
to other arteries/<strong>org</strong>ans where one or more strain-tensor components are measurable. More validation is<br />
needed using measured strain elastograms and corresponding arterial histology to quantify its accuracy.<br />
Acknowledgements: STW, NWO and Volcano Corporation.<br />
References:<br />
[1] Baldewsing et al., IEEE TMI, 24(4), 514-28, <strong>2005</strong>.<br />
[2] Baldewsing et al., Ultrasound Med. Biol., 30(6), 803-13, 2004.<br />
<br />
indicates Presenter<br />
68
025 AN INTEGRATED ULTRASOUND-BASED INTRAVASCULAR IMAGING OF ATHEROSCLEROSIS.<br />
Shriram Sethuraman 1 , Salavat R. Aglyamov 1 , James H. Amirian 2 , Richard W. Smalling 2 , and<br />
Stanislav Y. Emelianov 1 .<br />
1 Department of Biomedical Engineering, University of Texas at Austin, Austin, TX 78712, USA; 2 Division of<br />
Cardiology, University of Texas Health Science Center Houston, Houston, TX 77030, USA.<br />
Aims: In this work we investigate the possibility of combining intravascular ultrasound (IVUS),<br />
photoacoustic (IVPA) and elasticity imaging to detect and differentiate vulnerable coronary plaques. Our<br />
aim is to utilize many synergistic features of these imaging techniques and to develop an integrated<br />
intravascular imaging system capable of direct assessment of morphological, functional and<br />
biomechanical properties of atherosclerotic plaques of coronary arteries.<br />
Background: Cardiovascular diseases continue to be the leading cause of death and disability in the<br />
United States. High mortality rates result from the rupture of plaques that is considered insignificant on<br />
a coronary angiographic evaluation. Unfortunately, all clinical imaging procedures lack the specificity and<br />
sensitivity to effectively guide coronary interventions. Indeed, most of the clinical imaging systems can<br />
identify luminal diameter, stenosis, wall thickness and plaque volume; however, none can reliably<br />
characterize plaque composition and therefore identify vulnerable plaques. To address these limitations,<br />
we introduce combined intravascular imaging approach based on photoacoustic imaging augmented by<br />
ultrasound and elasticity imaging. Intravascular photoacoustic (IVPA) imaging involves the detection of<br />
pressure transients generated by a laser induced optical excitation of the tissue. Primary contrast<br />
mechanism for IVPA imaging is the presence of structures (hemoglobin, fat, fibrous tissue, etc.) with<br />
different optical absorption. Therefore, starting with IVUS images of tissue morphology, plaque<br />
composition can be identified using IVPA. In addition, significant changes in the mechanical properties of<br />
atherosclerotic lesions can be assessed using intravascular elasticity imaging. As a result, the<br />
combination of these ultrasound-based imaging techniques could aid in determining the morphology and<br />
composition of coronary plaques.<br />
Methods: To evaluate the performance of the combined IVUS, IVPA and intravascular elasticity imaging<br />
system, the studies were performed using vessel mimicking phantoms made out of polyvinyl alcohol<br />
(PVA). Inclusions with optical contrast (0.08% graphite particles) and elastic contrast were embedded in<br />
the vascular phantom (8% PVA and 0.4% silica scatterers for ultrasonic contrast). Single element high<br />
frequency IVUS imaging catheters (20 MHz and 40 MHz) were used to image the modeled vessel with<br />
atherosclerotic plaques. Laser excitation required for IVPA imaging was provided by an Nd:YAG (532 nm)<br />
pulsed laser system. Simultaneous acquisition of ultrasound and photoacoustic signals allowed<br />
automatic registration of intravascular images. For intravascular elasticity imaging, the phantom was<br />
deformed using intravascular pressures. A high speed acquisition system was used to collect a large<br />
number of IVUS frames during the deformation of the phantom. Multiple IVUS frames acquired at<br />
different pressures were post-processed to obtain intravascular strain images.<br />
Results: The integration of IVUS imaging with intravascular elasticity and IVPA imaging was successful<br />
without any major modifications to IVUS imaging. The combined imaging procedure was capable of<br />
identifying the inclusions not necessarily visible in the IVUS image alone. For example, images of radial<br />
strain revealed less than 2 mm diameter inclusion in the vessel wall based on the mechanical contrast<br />
between inclusion and surrounding medium. The inclusion was further identified in the IVPA image due<br />
to elevated optical absorption. These results demonstrate that both IVPA and elasticity imaging can<br />
provide additional information complementary to IVUS imaging.<br />
Conclusions: A combined IVUS, IVPA and intravascular elasticity imaging is possible and could provide a<br />
much needed comprehensive imaging solution to detect and differentiate atherosclerotic plaques based<br />
on anatomic and functional properties.<br />
Acknowledgements: This research was supported by The University of Texas Center for Biomedical<br />
Engineering seed grant. We thank Boston Scientific, Inc. for supplying IVUS imaging catheters.<br />
<br />
indicates Presenter<br />
69
054 ELECTROMECHANICAL MAPPING OF THE NORMAL AND ISCHEMIC MYOCARDIUM.<br />
Mathieu Pernot 1 , Simon D. Fung-Kee-Fung 1 , Elisa E. Konofagou 1 .<br />
1 Department of Biomedical Engineering, Columbia University, New York, NY, USA.<br />
Aims: The heart is a complex electromechanical pump. Therefore, accurate and complete diagnosis of<br />
heart diseases should entail quantitative analysis of the electromechanical mechanisms. However, this is<br />
currently limited by the lack of noninvasive imaging techniques of the global electromechanical function.<br />
We propose here an ultrasound based method for measuring and imaging the electromechanical regional<br />
function of the myocardium.<br />
Background: The propagation of electrical waves through the cardiac muscle induces contraction of the<br />
myocardium that results in the propagation of a strong mechanical wave. Since this wave results from<br />
coupling of the electrical excitation and the mechanical response of the tissue, it is hereby named<br />
“electromechanical wave”.<br />
Methods: Our method is based on imaging and analyzing the delay in small tissue displacements<br />
resulting from the propagation of the electrical excitation. In-vivo experiments were performed in<br />
anesthetized open chested dogs. A 2.5MHz phased array transducer (Terason 2000, Teratech, Inc.) was<br />
placed over the anterior wall in order to obtain a short-axis view of the left ventricle. Sequences of<br />
approximately three cardiac cycles were acquired at a frame rate of 56 images/s. The 2D displacement<br />
maps were estimated using a cross-correlation algorithm between two successive frames (window size:<br />
5mm, 90% overlap). Temporary regional ischemia was then induced by a 90% flow constriction of the left<br />
anterior descending (LAD) coronary artery.<br />
Results: The displacement maps clearly showed the propagation of several mechanical waves along the<br />
circumference of the myocardium (Figure 1). The wave velocity was found to be approximately 0.6m/s in<br />
the posterior wall. After the induction of ischemia, the mechanical wave completely disappeared in the<br />
ischemic region. These results were corroborated through invasive electrophysiological measurements<br />
using a matrix of electrodes on a proximal site.<br />
Conclusions: These results demonstrate the feasibility of imaging the electromechanical activity of the<br />
myocardium in vivo. Since the electromechanical wave speed is a function of both electrical and<br />
mechanical properties of the myocardium, i.e., the electrical conductivity and the shear modulus, this<br />
method could potentially be used for early, noninvasive and simultaneous detection of electrical and<br />
mechanical dysfunctions in the heart and monitoring of treatment such as resynchronization therapy.<br />
Acknowledgements: This study was supported by a Scientist Development Grant from the American<br />
Heart Association and a Special Developmental Award from the Whitaker Foundation.<br />
1) 0ms 2) 18ms 3) 36ms<br />
Figure 1: Propagation of the electromechanical wave in the dog myocardium. The displacement maps in<br />
color are superimposed on the grayscale ultrasound image. The white arrows show the position<br />
of the wavefront of the electromechanical wave.<br />
<br />
indicates Presenter<br />
70
056 ANGLE INDEPENDENT STRAIN ESTIMATION IN MYOCARDIAL ELASTOGRAPHY.<br />
Simon D. Fung-Kee-Fung 1 , Elisa E. Konofagou 1 .<br />
1 Columbia University, Department of Biomedical Engineering, 1210 Amsterdam Avenue,<br />
New York, NY 10027, USA.<br />
Aims: To remove the dependence of current strain estimations on the position and angle of the<br />
transducer, by converting them to strain estimates with respect to the heart’s geometry.<br />
Background: Current methods for the detection and measurement of ischemia and related heart diseases<br />
involve human visual observation and other qualitative methods of assessing wall motion and wall<br />
thickening of the myocardium. Myocardial Elastography has been previously proposed as a new method<br />
to quantify and visualize muscle abnormalities by measuring regional axial displacements and strains [1].<br />
However, these measurements are dependent on transducer location and the angle of the ultrasound<br />
beam relative to the direction of motion of the muscle. In order to make these measurements useful and<br />
more relevant to cardiologists, in a step towards the development of this technique as a clinical tool, this<br />
paper describes a method for the removal of the aforementioned angle-dependence and transforms<br />
strains measured in (x, y, z) with respect to the beam of the transducer to strains that could be displayed<br />
to the cardiologist as radial, circumferential and longitudinal, i.e. with respect to the heart’s geometry.<br />
Methods: A 2D simulation model was created for testing the hypothesis. Temporal displacement<br />
measurements of motion in the short axis (SA) plane of a canine left ventricle (LV) were generated at a<br />
frame rate comparable to that achieved with a standard echocardiography machine. This simplified<br />
2D model simulated basic wall motion of the left ventricle by including radial expansion and contraction,<br />
circumferential twisting and wall thickening and thinning. These displacements were generated using the<br />
same configuration as that of current elastography techniques (i.e. axially and laterally with respect to<br />
the transducer). Full representation of the strain tensor was obtained by calculating the gradient of each<br />
displacement map in both axial and lateral directions. It has been previously shown that eigenvalue<br />
decomposition of the complete strain tensor yields the principal strains (eigenvalues) that match the<br />
corresponding regional strains in the radial, circumferential and longitudinal directions in an<br />
axisymmetric configuration [2]. Model complexities were also introduced, by simulating<br />
non-homogeneous areas of strain, areas of ischemia through decreased regional motion, and phase<br />
delays to simulate the propagation of the electromechanical wave of muscle stimulation around the<br />
myocardium.<br />
Results: During mid-diastole, the model was given an incremental radial strain of 2.20% without any<br />
circumferential strain. Axial and lateral strain values were calculated from displacement maps at the<br />
same phase of the heart cycle. Axial and lateral strains varied around the myocardium in the<br />
homogeneous case, with average values of 1.3% ± 0.7% and 1.3% ± 0.7% respectively. After eigenvalue<br />
decomposition, the average value of the principal strain found in the myocardium was 2.17%. The<br />
principal strain was found to be homogeneous across the entire muscle, and, therefore,<br />
angle-independent. Similar good results were found throughout all phases of the cardiac cycle.<br />
Conclusions: An analytic, homogeneous strain model was created. Using this simple model we have<br />
shown a robust method of converting strain values from an arbitrary coordinate space with respect to the<br />
transducer beam to values with respect to left-ventricular geometry; a more reliable method for the<br />
accurate depiction of myocardial properties during freehand, echocardiographic scanning.<br />
Acknowledgements: This study was supported by a Scientist Development Grant from the American<br />
Heart Association and a Special Developmental Award from the Whitaker Foundation.<br />
References:<br />
[1] Konofagou E, D’hooge J, Ophir J. Myocardial Elastography – A Feasibility Study In Vivo. Ultrasound<br />
in Med. & Biol., Vol. 28, No. 4, pp. 475–482, 2002.<br />
[2] Waldman L, Fung Y, Covell J. Transmural Myocardial Deformation in the Canine Left Ventricle. Circ<br />
Res 57: 152-163, 1985.<br />
<br />
indicates Presenter<br />
71
063 NON-INVASIVE VASCULAR ELASTOGRAPHY FOR CAROTID ARTERY PLAQUE<br />
CHARACTERIZATION: IN VIVO FEASIBILITY STUDY.<br />
Roch L. Maurice 1 , Guy Cloutier 1 , Marie-France Giroux 2 , Sylvain Lanthier 3 , and Gilles Soulez 2 .<br />
1 Laboratory of Biorheology and Medical Ultrasonics, Research Center, 2 Radiology, 3 Neurology<br />
Departments, University of Montreal Hospital, Montreal, CANADA.<br />
Aims: A fatal complication of carotid artery atherosclerosis is thrombosis, a consequence to plaque<br />
rupture or fissure. Plaque rupture is a complicated mechanical process, correlated with plaque<br />
morphology, composition, mechanical properties and with the blood pressure and its long term repetitive<br />
cycle. Extracting information on the plaque local mechanical properties and on the surrounding tissues<br />
may thus reveal relevant features about plaque vulnerability. This paper presents preliminary in vivo<br />
results for two healthy subjects and one patient.<br />
Background: Our group recently developed a new approach to characterize mechanical properties of<br />
arteries by non-invasively assessing the strain within the vascular wall (non-invasive vascular<br />
elastography, NIVE) [1, 2]. For this purpose, the ultrasound transducer is placed on the neck over the<br />
carotid artery, whereas the vessel wall is compressed (dilated) by the normal cardiac pulsation. In NIVE,<br />
the elastograms are computed from the assessment of the vascular tissue kinetics using the Lagrangian<br />
Speckle Model Estimator (LSME). The LSME is a model-based estimator that considers the speckle as a<br />
material property [3].<br />
Methods: Ultrasound radio-frequency (RF) data were acquired with an ES500RP system (Ultrasonix,<br />
Vancouver, Canada) equipped with a 7 MHz linear array transducer. Two healthy subjects and one<br />
patient were investigated. For each of them, elastograms were computed from longitudinal segments of<br />
the common and proximal internal carotid arteries (CCA and PICA, respectively).<br />
Results: For the healthy subjects, comparisons were made for the NIVE elastograms computed from the<br />
RF data collected by two radiologists over the left and right carotid arteries. For each healthy segment<br />
(CCA and PICA), strain values around 1% were estimated. Considering the recorded cardiac pulsation,<br />
the instrumentation parameters along with the LSME implementation, that is around 300 kPa of elastic<br />
modulus for the healthy carotid arteries. These results also showed good similarities between the left and<br />
right carotid arteries as well as between the two radiologists. Regarding the pathologic subject, very low<br />
strain values (1%) were observed in areas where B-mode images revealed the presence of an<br />
atherosclerotic plaque.<br />
Conclusions: This study allowed differentiating normal vessel walls from a plaque non-invasively based<br />
on the strain patterns. Similarities between mechanical properties of the left and right carotids were<br />
observed. The reproducibility of the process was also addressed and confirmed by two radiologists. In<br />
summary, these results suggest that NIVE could be a potential clinical tool for carotid artery<br />
investigations. Whereas small wall thickness of such arteries may be a limitation, our group currently<br />
conducts a Phase 1 clinical investigation to fully investigate the potential of NIVE. This clinical protocol<br />
will be introduced and some preliminary results will be discussed.<br />
References:<br />
[1] Roch L. Maurice, Jacques Ohayon, Yves Frétigny, Michel Bertrand, Gilles Soulez, Guy Cloutier, Noninvasive<br />
Vascular Elastography: Theoretical Framework, IEEE – Transactions on Medical Imaging,<br />
Vol. 23, No 2, pp. 164-180, February 2004.<br />
[2] Roch L. Maurice, Michel Daronat, Jacques Ohayon, Ékatherina Stoyanova, Stuart Foster, Guy<br />
Cloutier, Non-Invasive High-frequency Vascular Ultrasound Elastography, Physics in Medicine &<br />
Biology, Vol. 50, pp. 1611-1628, <strong>2005</strong>.<br />
[3] Roch L. Maurice, Michel Bertrand, Lagrangian Speckle Model and Tissue Motion Estimation - Theory,<br />
IEEE – Transactions on Medical Imaging, Vol. 18, No 7, pp. 593-603, July 1999.<br />
<br />
indicates Presenter<br />
72
068 A 3D SIMULATION MODEL FOR PERFORMANCE ASSESSMENT OF 2D MYOCARDIAL<br />
ELASTOGRAPHY.<br />
Wei-Ning Lee 1 , Christopher Ingrassia 1 , Elisa E Konofagou 1 .<br />
1 Columbia University, Department of Biomedical Engineering, 1210 Amsterdam Avenue,<br />
New York, NY 10027, USA.<br />
Aims: The main purpose of this paper is to fundamentally characterize the performance of Myocardial<br />
Elastography in 2D and identify the optimal parameters to be used for the more reliable detection of<br />
ischemia or infarction.<br />
Background: A complete representation of the left-ventricular function throughout an entire cardiac cycle<br />
was previously demonstrated through the use of a 3D finite-element analysis (FEA) model [1]. This FEA<br />
model together with an ultrasound image formation model is used here in order to test the performance<br />
of 2D Myocardial Elastography at distinct phases of the cardiac cycle and at different states of<br />
myocardium, i.e., normal and ischemic, based on in vivo canine data [1].<br />
Methods: A previously developed 3D finite-element analysis (FEA) model of a normal canine left ventricle<br />
with 40 nodes and 16 elements was first used to simulate the passive filling phase. The finite-element<br />
model [1] was defined in prolate coordinates (λ, μ, θ) while the RF images were generated in Cartesian<br />
coordinates (x, y, z). Short-axis displacement and strain maps were computed using the FEA model at<br />
several slices (i.e., μ = 0 – 120) starting with an undeformed representation (0 mmHg) and passively<br />
inflating the model up to 1.875 mmHg. Second, to simulate the ischemic case, a 3D regionally (i.e.<br />
posterior lateral wall) ischemic model, LCx (left circumflex) occlusion canine model was used and<br />
evaluated at two different end systolic pressures, which started from 111 mmHg to 75 mmHg with a<br />
constant level of contractility (constant elastance). The model in this case contained 48 nodes and<br />
24 elements. A convolutional image formation model was employed to generate the corresponding<br />
2D short axis RF images in both normal and ischemic cases. The axial and lateral displacements within<br />
multiple image (x-y) planes across the left-ventricular volume were iteratively calculated and corrected to<br />
reduce the decorrelated noise [2]. Thus, the displacement in each strain component is corrected in the<br />
direction perpendicular to that calculated, i.e., the post-deformation RF signals are corrected for the<br />
lateral displacement previous to the axial strain estimation.<br />
Results: The iterative correction method successfully obtained high quality axial and lateral displacement<br />
images as well as elastograms of normal and shear strain components with a very good agreement between<br />
the radial FEA and elastographic estimates, in both normal and ischemic simulations. The strains<br />
measured were found to be within an error of 5% in the normal and 2% in the ischemic case on the<br />
average. The ischemic region was most visible on the elastogram at high pressure gradients during systole.<br />
Conclusions: The performance of Myocardial Elastography was evaluated using a previously established<br />
left-ventricular FEA model. Given the excellent agreement between the FEA solution and the<br />
elastographic strains measured in the axial and lateral directions, Myocardial Elastography proves to be a<br />
reliable technique for the accurate assessment of the myocardial deformation in 2D at distinct phases of<br />
the cardiac cycle as well as detection of ischemia.<br />
Acknowledgements: This study was supported by the American Heart Association.<br />
References:<br />
[1] Usyk T.P., LeGrice I.J., McCulloch A.D., Computational model of three-dimensional cardiac<br />
electromechanics, Comput Visual Sci 4: 249–257, 2002.<br />
[2] Konofagou E.E. and Ophir J., ‘A new elastographic method for estimation and imaging of lateral<br />
displacements, lateral strains, corrected axial strains and Poisson’s ratios in tissues’, Ultrasound in<br />
Med. & Biol., Vol. 24, No. 8, pp.1183-1199, 1998.<br />
<br />
indicates Presenter<br />
73
Session MMA: 3D, Multi-Modality & Alternative Applications<br />
Monday, October 17 3:15P – 4:15P<br />
008 FRAME FILTERING FOR IMPROVED FREEHAND 3D ULTRASOUND ELASTOGRAPHY.<br />
JE Lindop 1 , GM Treece 1 , AH Gee 1 , RW Prager 1 .<br />
1 University of Cambridge, Cambridge, England, UK.<br />
Aims: 2D elastograms produced from freehand scans are of unreliable quality. Frame filtering has been<br />
investigated as a means of improving the contrast-to-noise ratio (CNR) in 3D elastograms. This enhances<br />
the freehand 3D elastography system outlined in a previous article [1], which to our knowledge remains<br />
the only such system to have been reported in the literature.<br />
Background: To record a 3D elastogram, the probe is swept across a volume of several centimetres in<br />
length over the course of up to ten seconds. Strain estimates are calculated by tracking speckle between<br />
consecutive ultrasound frames, using an adaptation of the efficient, high-accuracy algorithm described<br />
by Pesavento et al. [2]. Each 2D elastogram is normalised according to a min-max strain scale, and these<br />
are stacked together to form a 3D data set, using the position sensing and software of an existing<br />
freehand 3D ultrasound system [3]. The problem with freehand scanning is that excessive non-axial<br />
motion often causes too much signal decorrelation for successful strain estimation. The high frame<br />
acquisition rate (>30 Hz) reduces the level of motion, but this means that some strains are too small to<br />
record. Frame filtering can be used to discard data where the correlation or the strain is too low.<br />
Methods: A phantom was constructed simulating a stiff inclusion in soft<br />
tissue (olive/gelatin). A freehand scan was processed offline: A-lines were<br />
analysed using 60 windows at 85% overlap between neighbours; a least<br />
squares strain estimator of length 2, 3 or 5 windows produced the final<br />
estimates. A reslice plane (Figure 1) was defined perpendicular to the<br />
scan plane, incorporating data from all the 308 2D elastograms. In every<br />
resultant 3D elastogram the olive/gelatin CNR was evaluated to measure<br />
performance, using a segmentation based on B-scans not elastograms.<br />
Figure 1: Unfiltered Elastogram Reslice.<br />
Results: Figure 2 shows the effect on reslice CNR of discarding 2D elastograms whose mean strain is<br />
below a threshold. 0.04% gave the highest CNR, so Figure 3 shows the results for mean correlation<br />
thresholds which were applied in addition to a 0.04% strain threshold. Up to a correlation threshold of<br />
0.87, this produced considerably improved 3D elastograms regardless of the length of the least squares<br />
filter that was used. Higher thresholds discarded too much data, however, and the sparse distributions of<br />
retained data became insufficient for accurate representation of the strain field.<br />
Figure 2: Strain Threshold Results.<br />
Figure 3: Correlation Threshold Results.<br />
Conclusions: Frame filtering offers a simple, computationally inexpensive means of significantly boosting<br />
the quality of freehand 3D elastograms. There remains scope for introducing more sophisticated<br />
measures of elastogram quality, which are likely to yield further improvements.<br />
References:<br />
[1] JE Lindop, GM Treece, AH Gee, and RW Prager. 3D elastography using freehand ultrasound. In Medical Image<br />
Computing and Computer-Assisted Intervention — MICCAI’04(2): 1103–1104, 2004.<br />
[2] A Pesavento, C Perrey, M Krueger, and H Ermert. A time efficient and accurate strain estimation concept for<br />
ultrasonic elastography using iterative phase zero estimation. IEEE T. Ultrason. Ferr., 46(5): 1057–1067, 1999.<br />
[3] GM Treece, AH Gee, RW Prager, CJC Cash, and L Berman: High definition freehand 3D ultrasound. Ultrasound<br />
Med. Biol. 29: 529–546, 2003.<br />
<br />
indicates Presenter<br />
74
057 AN INVERSE DEFORMATION METHOD FOR THE VISUALIZATION OF REAL-TIME 3D LUNG<br />
DYNAMICS.<br />
Anand P Santhanam 1 , Jannick P Rolland 1,2 .<br />
1 School of Computer Science, 2 College of Optics and Photonics (CREOL/FPCE), University of<br />
Central Florida, 4000 Central Florida Blvd, Orlando, FL 32816, USA.<br />
Aims: Physically accurate simulation of 3D lung dynamics is an effective tool for guidance in clinical<br />
maneuvers. Technical advances in medical imaging techniques have led to the availability of 3D<br />
high-resolution lung models. The main focus of our research is to simulate a patient’s normal and<br />
patho-physical lung dynamics using physically based deformation methods. However, for accuracy and<br />
smoothness in simulation, physically based deformation methods are required to deform lungs using<br />
human subject specific elastic parameters. Such estimations may also be an early indicator for patients’<br />
disease states such as COPD and tumor. The focus of this paper is on the estimation of elastic tissue<br />
properties of a normal human subject’s lungs from a sequence of high-resolution 3D lung models. Such<br />
estimation would facilitate accurate simulations of the 3D lung dynamics. The approach adopted for such<br />
estimation is to use a deformation algorithm that can account for the morphological changes from one<br />
3D model to another during breathing.<br />
Background: The method previously used for lung deformations was based on Finite Element Methods<br />
(FEM), NURBS, and Green’s Formulation (GF) [1]. While the FEM is computationally expensive, NURBS is<br />
not a physically based deformation method. Thus, in this paper, we use a GF based deformation for<br />
modeling lung dynamics which is a convolution of the force applied on each node and a transfer matrix<br />
traditionally referred to as either transfer function or operator. The force applied on each node represents<br />
the air-flow and is based on the distance from the resting surface (due to gravity) [2]. This paper presents<br />
a method for inverse analysis using spectral decomposition of a GF based deformation using spherical<br />
harmonic (SH) transformations. A key property of the transfer matrix is that the row of this matrix forms<br />
a converging sequence. Thus, the SH coefficients of every row also form a converging sequence which can<br />
be approximated using Dirichlet integrals [3]. The usage of this approximation allows us to simplify the GF.<br />
Methods: For mathematical analysis the GF is represented in a continuous domain. A polar coordinate<br />
representation is used for representing each node in the Green’s Formulation. The displacement of every<br />
node is taken as input from the CT data. The force applied on each node is estimated for a supine<br />
position. They are then re-represented in frequency space using SH transformations and plugged into the<br />
GF. The SH coefficients of the deformation are now represented as a direct product of the SH coefficients<br />
of the applied force and a summation of a set of SH coefficients of the transfer matrix’s row which can be<br />
computed for a known applied force and displacement. The individual SH coefficients of this summation<br />
are then estimated using Dirichlet integrals as shown in [3]. Thus, for a known applied force the SH<br />
coefficients of the transfer function can be computed, and the original transfer function can be estimated.<br />
Results: The proposed method is used for a sequence of 3D lung models obtained from a 4D HRCT [4].<br />
The number of 16 SH coefficients is used for the analysis. An initial estimation of the transfer matrix<br />
shows that the actual deformation from a 3D model to another and the re-simulated deformation match<br />
closely with less than 1% RMS error.<br />
Conclusions: The method presented in this paper allows us to estimate the elasticity of high-resolution<br />
3D lung models of normal human subjects. The average range of elasticity of human lungs can be<br />
estimated for set of patients.<br />
Acknowledgements: This work is funded by CREOL/FPCE.<br />
References:<br />
[1] Santhanam, A., Fidopiastis, C., Hamza-Lup, F., Rolland, J.P., and Imielinska, C., "Physically-based Deformation of<br />
High-resolution 3D lung models for Augmented Reality based Medical Visualization. "Medical Image Computing and<br />
Computer Aided Intervention, AMI-ARCS. Rennes,St-Malo Lecture Notes on Computer Science (2004). pp. 21-32.<br />
[2] Fan, L., Chen, C.-W., Hoffman, E.A., and Reinhardt, J.M., "Evaluation and application of 3D lung warping and<br />
registration model using HRCT images."Proc. SPIE Conf. Medical Imaging. San Diego,CA (2001). pp. 234-243.<br />
[3] MacRobert and Murray, T., Spherical Harmonics an elementary treatise on harmonic functions with applications.<br />
International series of monographs in pure and applied mathematics. New York: Oxford Pergamon Press (1967).<br />
[4] Segars, W.P., "Development of a new dynamic NURBS-based cardiac-torso (NCAT) phantom." 2002, University of<br />
North Carolina Chapel-Hill.<br />
<br />
indicates Presenter<br />
75
091 COMPARISON OF THREE NON-AXIAL STRAIN ESTIMATION TECHNIQUES FOR 3D STRAIN<br />
ESTIMATION IN ELASTIC MATERIALS AND TISSUES.<br />
Richard G.P. Lopata 1 , Maartje M. Nillesen 1 , Inge H. Gerrits 1 , Johan M. Thijssen 1 , Livia Kapusta 2 ,<br />
Chris L. de Korte 1 .<br />
1 Clinical Physics Laboratory, 2 Children's Heart Center, Radboud University Medical Center,<br />
Nijmegen, The NETHERLANDS.<br />
Aims: In this study, a framework is set for future 3D anisotropic strain imaging in a complex structure as<br />
the human heart, by determining the strain in 3 orthogonal directions.<br />
Background: Imaging of 2D elastic properties of human tissue has been proven to be a useful tool in the<br />
clinical setting. In previous studies, capturing radio-frequency data (RF) of 2D ultrasonic datasets has<br />
enabled estimation of axial and lateral strain. Complex structures like the human heart require 3D<br />
imaging techniques to fully capture the strains in different directions involved in active contraction and<br />
relaxation during a single heart cycle. Also, the orientation of the muscle fibers is not confined to one<br />
single plane. With the availability of 3D ultrasound, new techniques are available for assessing strain in<br />
all dimensions.<br />
Methods: Using a Philips SONOS 7500, equipped with a 4MHz 3D transducer and a RF-interface, raw<br />
ultrasound data were acquired. The non-axial displacement was estimated using three different algorithms.<br />
I. The axial displacement is estimated using cross-correlation analysis of the RF-data and<br />
subsequently, the non-axial displacement is assessed using cross-correlation analysis of the<br />
envelope. The axial displacement was used as an offset for non-axial displacement measurements.<br />
Interpolation was performed in axial (32 times) and in non-axial direction (16 times).<br />
II. A 2D RF-based displacement tracking algorithm was implemented using the 2D cross-correlation<br />
function. Five post-deformation lines were compared to five pre-deformation lines.<br />
III. An integrated algorithm was implemented. The axial and non-axial displacements were measured<br />
using the previous algorithm (I). The obtained axial displacements were used to calculate the local<br />
axial strain, which was used to stretch the data in axial direction. This iterative procedure was<br />
performed using the RF-data. After optimizing the axial strain, the lateral displacement was<br />
measured, using the axial displacement and strain as input.<br />
All methods were validated using simulations (uniform axial compression of 1% and 0.5% non-axial<br />
compression (to simulate a material with a Poisson-ratio of 0.5) and phantom (10% PVA or 10% gelatin,<br />
15μm SiC-scatterers) experiments. In vivo the algorithms were further evaluated using a volunteer’s<br />
biceps and calf muscle during passive compression with the transducer and active compression by<br />
means of muscle contraction.<br />
Results: The simulation revealed that using the first two algorithms a bias in the lateral displacement is<br />
introduced by axial decorrelation due to an axial strain component. This decorrelation cannot be<br />
corrected for by extensive interpolation. The third algorithm (using axial stretching) significantly improved<br />
the lateral displacement measurements (no additional improvement in the axial strain after 3 iterations).<br />
Using stretching, the standard deviation of the strain estimate in axial direction decreased with a factor<br />
15 whereas 5 times better strain estimates were found in non-axial direction.<br />
The phantom experiments revealed similar results. 2D interpolation (Method II) performed better than the<br />
two-step approach (Method I). Stretching (Method III) had similar results as 2D interpolation. A possible<br />
explanation is the limited accuracy of the used local axial strain estimates. Global stretching wasn’t used<br />
in this study, since it is often not applicable for cardiac strain imaging. The in vivo experiment revealed<br />
different strain values in lateral and elevational direction due to the anisotropy of the muscle tissue.<br />
Conclusions: 3D strain estimation is feasible using a real-time 3D scanner. Additional validation studies<br />
in anisotropic phantoms are required to fully validate the technique.<br />
Acknowledgements: The financial support of the Dutch Technology Foundation (STW) is acknowledged.<br />
<br />
indicates Presenter<br />
76
102 STEADY-STATE HARMONIC ELASTOGRAPHY: VISUALIZING THE VISCOELASTIC<br />
PROPERTIES WITHIN SOFT TISSUES.<br />
Marvin M. Doyley 1,2 , Qin Feng 2 , John B. Weaver 1,2 , Francis E. Kennedy 2 , Keith D. Paulsen 2 .<br />
1 Department of Radiology, Dartmouth Medical School, Hanover, NH 03755, USA; 2 Thayer School<br />
of Engineering, Dartmouth College, Hanover NH 03755, USA.<br />
Aims: The primary objective of this paper is to report the results of experiments conducted on viscoelastic<br />
phantoms and volunteer breast cancer patients to validate the performance of viscoelastic image<br />
reconstruction procedure.<br />
Background: Magnetic resonance elastography (MRE) is an emerging imaging modality that derives intrinsic<br />
tissue mechanical property images from MR measured induced internal tissue displacements based on the<br />
premise that soft tissues exhibit linear isotropic elastic behavior. Although these assumptions have proven to<br />
be a good approximation for some tissues, it is inappropriate for tissues that exhibit considerable viscoelastic<br />
tendencies, such as the breast. Consequently, an enhanced inverse image reconstruction technique has been<br />
developed based on a viscoelastic formulation of shear wave propagation.<br />
Methods: The governing partial differential equations (PDEs) that describes the propagation of shear<br />
waves in a linear isotropic viscoelastic medium is given by u +(+) u =(iw-w 2 ) u , where u is the<br />
spatially varying complex-valued displacement vector u, and are Lamé constants, is the damping<br />
coefficient and is the density of the medium, which in this study was assumed to be equivalent of water<br />
(1000kg/m 3 ). Information regarding shear wave propagation obtained by employing contrast enhanced<br />
MRI is generally in the form of phase and harmonic amplitude maps. However, this information was<br />
transformed to frequency domain Viz. u(x,y,z,t)=Re{ u (x,y,z)e iwt } to facilitate image reconstruction. The<br />
dominant mechanical parameters (i.e. shear modulus, , and the damping coefficient, ) were estimated<br />
from the complex-valued displacements by employing an overlapping subzone inversion strategy that we<br />
have recently developed based on the equations of motions for a viscoelastic medium.<br />
Results. Figure 1 shows representative examples of contrast enhanced T2 weighted MR images, and<br />
shear modulus elastograms that were obtained from a breast cancer patient with a locally advanced<br />
malignancy. The tumor that is visualized in the contrast enhanced MR images has a highly localized<br />
region of low intensity, which corresponds to an area of high shear modulus (mean shear modulus =<br />
11 2kPa; shear modulus contrast 14.8dB (5:1)) in the shear modulus elastogram. Figure 2 shows a<br />
montage of damping coefficient elastograms corresponding to the images shown in Figure 1. The<br />
inclusion is not discernible in damping coefficient elastograms, which suggests that globally both tissue<br />
types (inclusion and surrounding tissues) exhibit similar viscoelastic behavior. It is apparent from the<br />
images shown in Figure 1 and the damping coefficient images shown in Figure 2, that there is a strong<br />
correlation between regions of high contrast uptakes and regions of low damping (as well with regions of<br />
high shear modulus); however, not all regions with high contrast uptakes correspond to regions of low<br />
damping. We believe that the regions where low damping correlates with areas of high shear modulus<br />
correspond to areas where the fibrous encapsulation of the malignancy is intact. Further investigations<br />
are currently being conducted to corroborate this hypothesis.<br />
Figure 1: Montage of contrast enhanced T2 weighted MR images<br />
(left) and shear modulus elastograms (right) obtained<br />
from a patient with a locally advanced malignancy. The<br />
red arrows indicate areas of contrast enhancement.<br />
Figure 2: Montage of damping coefficient elastograms<br />
corresponding to the modulus elastograms and<br />
MR images shown in Figure 1. Arrows denotes<br />
areas of increased damping coefficient.<br />
Conclusions: The preliminary results reported in this article demonstrate that taking proper account of<br />
viscoelastic effects in breast tissues will not only provide a new contrast mechanism that could aid the differential<br />
diagnosis of breast cancer but should also improve the statistical accuracy of shear modulus elastograms.<br />
<br />
indicates Presenter<br />
77
Session SIP-1: Signal and Image Processing – I<br />
Monday, October 17 4:15P – 5:30P<br />
059 ANGULAR STRAIN METHOD FOR STRAIN ESTIMATION IN ULTRASOUND ELASTICITY<br />
IMAGING.<br />
Unmin Bae 1 and Yongmin Kim 1 .<br />
1 Electrical Engineering and Bioengineering Departments, University of Washington, Seattle, WA, USA.<br />
Aim: Our aim is to develop an accurate and computationally efficient strain estimation method to<br />
accelerate and/or enable the use of ultrasound elasticity imaging in various clinical applications.<br />
Background: Traditional ultrasonic strain estimators derive tissue displacements before and after<br />
compression, and then compute the strain from a spatial derivative of the displacement. For typical<br />
ultrasonic strain estimation, such as the imaging depth of several cm and a sub-mm strain sample<br />
length, a displacement can be as large as a hundred times of the displacement difference. For example,<br />
when 1% compression is applied to a 3 cm elastically homogeneous object and the strain sample length is<br />
200 m, a displacement can be up to 300 m, which is 150 times larger than the displacement difference<br />
of 2 m. Thus, if strain is computed from large displacements, any error in displacement estimation can<br />
be magnified in strain computation.<br />
Methods: We have developed a phase-based direct strain estimator called angular strain method (ASM).<br />
It computes temporal and spatial correlation between the correlated ultrasound signals from pre- and<br />
post-compression frames. The phase of temporal and spatial correlation is defined as angular strain,<br />
which leads to strain after normalization. Before estimating the angular strain, a motion-vector<br />
estimation technique, such as the crosscorrelation method, is utilized to find the correlated signals from<br />
different frames where the distance between the correlated signals (in samples) is defined as a gross<br />
motion vector.<br />
Results: We have found in simulation that our phase-based direct strain estimator improves the strain<br />
signal to noise ratio (SNR) and the dynamic range of strain SNR, compared to the conventional strain<br />
estimator using crosscorrelation with interpolation. For example, using ASM, strain SNR is improved to<br />
about 3 times for the strain ranging from 0.1% to 3% when the correlation window of 0.49 mm and the<br />
strain sample length of 0.23 mm were used. If an ideal gross motion vector is used (instead of an<br />
estimated one), the dynamic range of the strain SNR curve is further improved, indicating that strain SNR<br />
for large compression is limited by the gross motion vector estimation using the crosscorrelation method,<br />
rather than the subsequent phase-based strain estimation. In experiments with gelatin-based phantoms,<br />
the hard inclusions with diameter ranging from 0.8 cm to 1.1 cm can be delineated in the ASM-based<br />
strain images for large compressions, such as 3%, whereas noise due to large compression dominates the<br />
strain images derived from the strain estimator using crosscorrelation with interpolation.<br />
Conclusions: A new strain estimator has been developed for ultrasound elasticity imaging. It improves<br />
the accuracy and strain SNR by directly estimating strain from the phase of temporal and spatial<br />
correlation between the correlated ultrasound signals from different frames. In addition, the proposed<br />
strain estimator is computationally efficient. The computational burden of traditional strain estimation is<br />
usually very high due to computer-intensive processing methods, such as accurate interpolation<br />
processing, or a large amount of data to be processed arising from a high sampling frequency and/or a<br />
high frame rate. Since our phase-based strain estimator does not require interpolation, a high frame rate<br />
or a high sampling frequency, it can be implemented in commercial ultrasound machines to provide realtime<br />
ultrasound elasticity imaging, which we have demonstrated.<br />
<br />
indicates Presenter<br />
78
037 MULTIDIMENSIONAL AUTOCORRELATION AND DOPPLER METHODS VERSUS<br />
CROSS-SPECTRUM PHASE GRADIENT METHOD.<br />
Chikayoshi Sumi 1 .<br />
1 Sophia University, 7-1 Kioicho, Chiyodaku, Tokyo 102-8554, JAPAN.<br />
Aims: Two new methods of measuring a multidimensional displacement vector using an instantaneous<br />
ultrasound signal phase are reported, i.e., the multidimensional autocorrelation method [1, 2] and the<br />
multidimensional Doppler method [1, 2]. High measurement accuracy is achieved by combining either<br />
method with our developed lateral Gaussian envelope cosine modulation method (LGECMM) [2].<br />
Compared with our previously developed multidimensional cross-spectrum phase gradient method<br />
(CSPGM) [3], as shown, both methods yield accurate measurements, require less computational time, and<br />
provide real-time measurement. Both methods can be applied to the measurement of tissue strain, blood<br />
flow, sonar data, and other target motions.<br />
Results: 2D displacement vector measurements are simulated, assuming that LGECMM is used (ultrasound<br />
frequency fx = lateral modulation frequency, fy = 3.5MHz, x = y = 0.4mm, speed of sound =1,500m/s). The<br />
distribution of a displacement vector (0.01mm, 0.01mm) is evaluated. First, the usefulness of LGECM was<br />
verified for our previously developed phase matching [2] using CSPGM. When laterally modulating, the axial<br />
and lateral estimation converged to 2 iterations, i.e., by one phase matching. However, non-modulation<br />
resulted in their slow convergence. Nine iterations do not allow the lateral measurement accuracy to reach<br />
that of modulation case. Utilization of LGECMM realizes rapid convergence.<br />
Next, measurement accuracy (SNR) is evaluated for multidimensional autocorrelation and Doppler methods<br />
by changing fy and y . White noise is added to the pre- and post-echo data. SNR versus lateral modulation<br />
wavelength was evaluated when moving average width is set at 64H64 points (3.2mmH3.2mm) for<br />
calculating the phase and spatial derivatives, i.e., instantaneous frequencies (echo data SNRs of 20dB and<br />
dB (no noise)). Here, we should keep in mind that the phase of the autocorrelation signal evaluated from<br />
the moving-averaged real and imaginary components yields a more accurate displacement vector<br />
measurement than the moving-averaged phase [1]. The accuracy of axial displacement measurement is<br />
sufficiently high regardless of fy. However, when the lateral modulation wavelength is longer than half the<br />
ultrasound wavelength ( axial /2), the accuracy of lateral displacement measurement decreases compared<br />
with that of axial displacement measurement. Also, if the echo is not laterally modulated (wavelength = ),<br />
then, in the absence of noise, the accuracy of lateral displacement measurement is quite high (>40dB).<br />
However, the accuracy is considerably lower at a low echo data SNR. If the moving average width is set to a<br />
smaller value, all measurement accuracies decrease. These two methods allow more accurate measurement<br />
than CSPGM using a window having the same size as that of moving average (Figure 1, 64H64). When y is<br />
changed from 0.4mm to a larger value under a constant echo data SNR (20dB), the accuracies of the axial<br />
and lateral displacement measurements decrease slightly in a similar manner (omitted).<br />
Conclusions: To realize high measurement accuracy, lateral<br />
modulation frequency and ultrasound frequency should be set higher<br />
at the same echo data SNR. Moreover, beam width and pulse length<br />
should be narrower and shorter, respectively. These conditions also<br />
yield high spatial resolution. A large moving average width stabilizes<br />
the measurement at a trade off with spatial resolution. However,<br />
phase matching [3] and echo compression/stretching allows<br />
heightening the spatial resolution. Moreover, we previously confirmed<br />
that the regularization method is effective in increasing the<br />
measurement stability and accuracy of the CSPGM [4]. Future work<br />
will be directed at evaluating the effectiveness of the regularization<br />
Figure 1: Multidimensional Autocorrelation<br />
method for the application to both instantaneous phase methods.<br />
Method vs. CSPGM.<br />
Measurement accuracies of strains will also be compared.<br />
References:<br />
[1] Sumi, Technical report of Japan Soc of Ultrason in Med, 102, no. 4, pp. 37-40, Dec 2002 (in Japanese).<br />
[2] Sumi, “Multidimensional displacement vector measurement methods utilizing instantaneous phase,” Proc. of<br />
IEEE EMBS Conf. (CD-ROM), Sep <strong>2005</strong>.<br />
[3] Sumi, IEEE Trans. UFFC, 46, pp. 158-166, 1999.<br />
[4] Sumi, Technical report of Japan Soc of Ultrason in Med, 101, no. 4, pp. 31-41, Dec 2001 (in Japanese).<br />
<br />
indicates Presenter<br />
79
087 HIGH RESOLUTION TIME OF FLIGHT MEASUREMENTS WITH THE PULSED PHASE LOCKED LOOP.<br />
Ted Lynch 1 , Joe S. Heyman 1 , David Blaker 2 .<br />
1 Luna Innovations, Inc., 130 Research Dr., Hampton, VA 23666, USA; 2Luna Innovations, Inc.,<br />
2851 Commerce Street, Blacksburg, VA 24060, USA.<br />
Aims: This report compares the resolution of the ultrasonic pulsed phase locked loop (PPLL), FFT-based phase<br />
measurements, and cross-correlation time-shift analysis for assessing tissue motion in elasticity studies.<br />
Background: The PPLL was invented in the 1980’s at NASA Langley Research Center and has been used<br />
extensively in materials characterization studies, demonstrating the ability to detect changes in the time<br />
of flight of an ultrasonic tone-burst with parts-in-ten-million resolution [1-5]. For ultrasonic<br />
measurements in the MHz frequency range with a 10 microsecond path length, this translates to the<br />
ability to resolve changes in the time of flight in the picosecond range. Recently, Luna has begun testing<br />
medical applications of the PPLL, particularly for the noninvasive assessment of intracranial pressure<br />
and intramuscular pressure. We are currently updating the processing architecture of the PPLL so that it<br />
can provide absolute measurements of the time-of-flight with equal resolution to the derivative<br />
measurements already demonstrated using analog signal processing.<br />
Methods: Computer simulations were performed comparing the PPLL with the cross-correlation<br />
time-shift algorithm and FFT-based phase measurements. For the PPLL and FFT-based measurements,<br />
the simulation employed a 10-cycle, 1 MHz ultrasonic tone-burst with 20 dB of random noise added; for<br />
cross-correlation, a single-cycle 1 MHz return echo with 20 dB of random noise added was used. For each<br />
algorithm, the simulated signal was converted to a 16-bit signal and sampled at 48 MHz and the time<br />
delay was computed using digital signal processing.<br />
Results: The PPLL was able to resolve phase shifts down to 0.001°, equivalent to a 2 picosecond time shift,<br />
better than twice the resolution of FFT-based phase measurements and several orders of magnitude better<br />
than cross-correlation analysis. We have also found that the PPLL phase detection algorithm is more robust<br />
than FFT-based measurements in the presence of frequency dispersion, interference or noise.<br />
Conclusions: PPLL-based phase measurements provide superior time resolution than comparable<br />
techniques used in tissue motion analysis and are particularly useful in applications where the use of<br />
5-10 cycle tonebursts will provide adequate depth resolution of tissue boundaries.<br />
Acknowledgements: Portions of this work was funded through a U.S. Army Phase II SBIR contract.<br />
References:<br />
[1] J.S. Heyman. “A CW Ultrasonic Bolt Strain Monitor,” SESA Experimental Mechanics, 17 (1977) 183.<br />
[2] J.S. Heyman and E.J. Chern. “Characterization of Heat Treatment in Aluminum Based on Ultrasonic<br />
Determination of the Second and Third Order Elastic Constants,” proceedings of the 1981 IEEE<br />
Ultrasonics Symposium. 1981 (936-939).<br />
[3] J.S. Heyman, S.G. Allison and K. Salama. “The Effect of Carbon Concentration and Plastic Deformation<br />
on Ultrasonic Higher Order Elastic Properties of Steel,” Ultrasonics International. 1985 (786).<br />
[4] J.S. Heyman, S.G. Allison and K. Salama. “Temperature Dependence of Ultrasonic Velocity in Carbon<br />
Steels,” proceedings of the 1983 IEEE Ultrasonics Symposium, Atlanta, GA,<br />
October 31-Novermber 2, 1983.<br />
[5] Ueno T, Macias BR, Hargens AR and Yost WT. “Pulsed Phase Lock Loop Technique to Measure<br />
Intracranial Pressure Noninvasively.” <strong>Proceedings</strong> 2003 IEEE Ultrasonics Symposium,<br />
October 5-8, 2003, Honolulu, Hawaii.<br />
[6] JE Lynch, JS Heyman and AR Hargens. “Ultrasonic Device for the Noninvasive Diagnosis of<br />
Compartment Syndrome.” Physiological Measurement, 25(1), N1-N9.<br />
<br />
indicates Presenter<br />
80
093 EFFECTS OF PHYSIOLOGICAL TISSUE MOTION STATISTICS ON PREDICTED<br />
ELASTOGRAPHIC IMAGE QUALITY IN VIVO.<br />
R. Chandrasekhar 1,2 , J. Ophir 1,2 , T. Krouskop 3 and K. Ophir 4 .<br />
1 The University of Texas Medical School, Houston, TX, USA; 2 University of Houston, Houston, TX,<br />
USA; 3 Baylor College of Medicine, Houston, TX, USA.; 4 Austin, TX, USA.<br />
Introduction: In elastography, the time elapsed between the pre- and the post-compression frame is<br />
referred to as the inter-frame interval. For in vivo elastography, the inter-frame interval is critical because<br />
uncontrolled physiological motion, such as heartbeat, muscle motion, respiration and blood flow,<br />
introduce inter-frame decorrelation that reduces the quality of elastograms [1]. To obtain a measure of<br />
this decorrelation, in vivo experimental data (from human livers and thyroids) at various inter-frame<br />
intervals were obtained from twenty healthy subjects. In order to further examine the effect of the<br />
different inter-frame intervals on the elastographic image quality, the experimental data were also used in<br />
combination with elastographic simulation data.<br />
Methods: RF data from liver and thyroid were obtained from twenty healthy subjects using a Philips<br />
HDI-1000 ultrasound scanner and a digital motion controller (DMC). The transducer was placed in the<br />
region of interest using the DMC to ensure a controlled experimental setup to remove undesired effects<br />
such as operator and out of plane motion. Ten exams (each with twenty frames of data) were performed at<br />
the maximum frame rate possible by the apparatus. The post-compression step was skipped as only<br />
uncontrolled in-vivo motion was of interest. The decorrelation (noise) introduced due to uncontrolled<br />
motion was obtained at various inter-frame intervals from these data (Figure 1). An exponential curve fit<br />
was employed to obtain a noise measure at various inter-frame intervals which was then used to compute<br />
the combined SNR used in simulations. The deterioration of elastographic image quality was objectively<br />
evaluated by computing the area under the strain filter (SF) at a given resolution [2]. The variation of the<br />
area Q under the SF with inter-frame interval is shown in Figure 2.<br />
Results: The results of this study demonstrate a statistical exponential behavior of the temporal decay of<br />
the echo signal cross-correlations from tissues in vivo due to uncontrollable motion. The results also<br />
indicate that the dynamic range and height of the SF at a given resolution are reduced at increased<br />
inter-frame intervals, suggesting that in elastographic applications, good objective image quality may be<br />
achieved only when a high frame rate is maintained.<br />
Conclusions: The study indicates that elastography can be used successfully in vivo on homogeneous<br />
regions when the inter-frame interval meets the minimum requirements for a specific image quality.<br />
Processing extra data without significant improvement in the quality might affect system performance in<br />
real time elastography, and the results may help in understanding the (nonlinear) tradeoff between the<br />
frame rate and the image quality in real time elastography.<br />
References:<br />
[1] Souchon, R., Ophir, J, Srinivasan, S., Chapelon, J.: Prostate Elastography: Causes of decorrelation<br />
in-vivo, First International Conference on the Ultrasonic Measurement and Imaging of Tissue<br />
Elasticity, Niagara Falls, Ontario, Canada, p. 86, October 20-23, 2002.<br />
[2] Varghese, T. and Ophir, J.: A theoretical framework for the performance characterization of<br />
elastography: The Stain Filter, IEEE Transactions on Ultrasonics, Ferroelectrics, and Frequency<br />
Control Society, Vol. 44 (1), pp. 164 - 172, 1997a.<br />
Acknowledgement: Supported by NIH Program Project P01-CA64597-10 to the University of Texas.<br />
Correlation coefficient<br />
1.00<br />
0.95<br />
0.90<br />
0.85<br />
0.80<br />
0.75<br />
0.70<br />
0 0.5 1.0 1.5 2.0 2.5<br />
Time (secs)<br />
Figure 1<br />
Q as a % of maximum<br />
quality<br />
Figure 2<br />
100%<br />
90%<br />
80%<br />
70%<br />
60%<br />
50%<br />
40%<br />
0 0.5 1.0<br />
Time (secs)<br />
Thyroid<br />
Liver<br />
1.5<br />
<br />
indicates Presenter<br />
81
052 ELASTICITY IMAGING USING ULTRAFAST VS. CONVENTIONAL ULTRASOUND IMAGING.<br />
Suhyun Park 1 , Salavat R. Aglyamov 1 , Jignesh Shah 1 , W. Guy Scott 2 , Stanislav Y. Emelianov 1 .<br />
1 Department of Biomedical Engineering, University of Texas at Austin, Austin, TX 78712, USA;<br />
2 Winprobe Corporation, North Palm Beach, FL 33408, USA.<br />
Aims: In elasticity imaging, conventional and ultrafast ultrasound imaging approaches have been used.<br />
Each one has advantages and limitations including image quality and frame rate. The goal of this study is<br />
to quantitatively compare the performance of elasticity imaging based on each of these imaging<br />
techniques and combination of both.<br />
Background: In elasticity imaging, ultrasound images are acquired during externally or internally applied<br />
motion/deformation of the tissue. If the motion or the deformation rate is small (e.g., breast or prostate<br />
imaging), the conventional ultrasound imaging can be used. Here each ultrasound beam is tightly<br />
focused on transmit and dynamically focused on receive to form high quality ultrasound images.<br />
However, if the motion or deformation rate is high (e.g., shear wave or cardiac strain rate imaging), the<br />
severe decorrelation between the neighboring conventional ultrasound images requires alternative high<br />
frame rate imaging techniques such as ultrafast ultrasound imaging. Indeed, in ultrafast ultrasound<br />
imaging, the transmitted broad and unfocused ultrasound beam interrogates the entire volume and the<br />
backscattered signal is received on all elements of the array transducer at once and is dynamically<br />
focused at every depth to produce an image. Compared to conventional imaging, ultrafast ultrasound<br />
imaging has the advantage of the higher frame rate, but image quality is reduced. In this paper, we<br />
quantitatively compare elasticity images obtained with conventional and ultrafast ultrasound imaging<br />
methods. Much of the work in elasticity imaging has been focused on ultrafast or conventional imaging<br />
separately, however very little simulation and experimental data are available for both.<br />
Methods: The performance of elasticity imaging based on ultrafast and conventional imaging techniques<br />
was evaluated using simulated data. Both ultrafast and conventional ultrasound images were obtained<br />
from tissue phantoms measuring 40-mm laterally and 50-mm axially. Specifically, a homogeneous<br />
phantom and a phantom with a single hard inclusion were imaged using 128-element transducer<br />
operating at 5 MHz. To produce either conventional or ultrafast ultrasound images of the entire phantom,<br />
the custom simulations using linear acoustic propagation were performed where backscattered<br />
ultrasound signals from necessary transmit-receive combinations of elements were digitized at 40 MHz,<br />
base-banded, interpolated and appropriately added. Surface deformations of the phantoms, applied in<br />
increments of 0.30%, were calculated using analytical solutions of the equations of equilibrium. After<br />
ultrafast and conventional images of the phantom were obtained, the 2-D cross-correlation based speckle<br />
motion tracking was performed to evaluate displacement vector and strain tensor components. Based on<br />
a priori known size of the inclusion and displacement and strain values, the signal-to-noise ratio (SNR),<br />
contrast-to-noise ratio (CNR) and spatial resolution of the resulting images were estimated.<br />
Results: The simulated ultrafast and conventional ultrasound images clearly indicated the expected<br />
difference in ultrasound image quality – these differences were also apparent in the displacement and strain<br />
images. For example, at the focal region of the conventional imaging, the SNR, CNR and lateral resolution of<br />
axial displacement and strain images were generally greater compared to that of the ultrafast imaging. The<br />
differences of the maximum strain SNR and CNR between conventional and ultrafast imaging were no more<br />
than 16% and 12%, respectively. These differences, however, rapidly tapered off away from the focal region.<br />
For ultrafast imaging, the displacement/strain SNR and CNR did not vary significantly throughout the<br />
entire image. There were also similarities between both imaging methods. For instance, as the applied<br />
strain increases, strain SNR and CNR in both imaging modes reached maximum values around 3-5% of the<br />
axial strain. Finally, the axial resolution was comparable in all images.<br />
Conclusions: The results of the study suggests that the ultrafast ultrasound imaging can be reliably<br />
used for the elasticity imaging if frame rate is critical to capture the fast motion or high-rate deformation<br />
of the tissue. The displacement and strain estimates obtained using ultrafast ultrasound imaging has<br />
tolerable levels of SNR, CNR and axial resolution. The quality of the displacement and strain images can<br />
be improved with averaging since ultrafast imaging frame rate is faster compared to conventional images.<br />
In addition, different implementations of motion tracking algorithms are possible with ultrafast imaging.<br />
However, further experimental studies are needed to support these observations.<br />
Acknowledgements: Support in part by National Institutes of Health under grants CA110079 and CA96018 is acknowledged.<br />
<br />
indicates Presenter<br />
82
Session CAA-1: Clinical and Animal Applications – I<br />
Tuesday, October 18 8:00A – 9:15A<br />
104 ARTERIAL ELASTIC MODULUS RECONSTRUCTION FROM IN-VIVO STRAIN IMAGING AND PWV.<br />
W.F. Weitzel 1 , Kang Kim 2 , Hua Xie 2 , J.M. Rubin 3 , Congxian Jia 2 , M. O’Donnell 2 .<br />
1 Internal Medicine, 2 Biomedical Engineering, and 3 Radiology Departments, University of Michigan,<br />
Ann Arbor, MI 48109, USA.<br />
Aims: Using a simple arterial model, we determined the arterial wall elastic modulus independently from<br />
strain and pulse wave velocity (PWV) measurements and compared these results with each other.<br />
Background: Arterial compliance is an important indicator of vascular disease. Stiffening of the arterial<br />
wall lowers the strain in the vessel wall and increases the PWV.<br />
Methods: For both strain and PWV measurements, an ultrasound correlation-based, phase-sensitive,<br />
speckle-tracking algorithm was employed for data collection. For the elastic modulus reconstruction from<br />
strain image, a simple model was used in which elastic modulus, E1, of the artery wall is related to elastic<br />
modulus, E2, of surrounding tissue by<br />
p<br />
<br />
E1<br />
K<br />
2<br />
E<br />
2<br />
K<br />
1 <br />
<br />
<br />
<br />
where K1 and K2 are geometric factors, p is pulse pressure and is inter-cardiac strain (i.e., change in<br />
strain from systole to diastole). Within an offset proportional to E2, it is possible to reconstruct the<br />
arterial elastic modulus as a function of mean arterial strain from the ratio [p/]. To reconstruct elastic<br />
modulus from PWV, Moens-Kotewerg equation for tethered elastic tube was employed. In both cases,<br />
artery geometrical factors, including inner and outer radius, were obtained from B-scan images and<br />
speckle tracking correlation images. For the PWV case, the density of the arterial wall was assumed to be<br />
in the range of 1071-1100kg/m 3 . Incompressibility was also assumed for both cases. A non-invasive<br />
free-hand ultrasound scanning procedure was performed to measure both strain and PWV. Using a<br />
commercial ultrasound probe, a transverse scan was performed for strain estimation and a longitudinal<br />
scan was performed at the same location for the PWV measurement. Using a 5.8 MHz linear transducer,<br />
the scanhead was applied over the brachial artery of a 43 year old healthy volunteer. A pressure<br />
equalization procedure, previously evaluated in our lab, was used to lower the transmural arterial<br />
pressure and resulting vessel wall strain and PWV.<br />
Results: Using arterial mean pressure equalization, the reconstructed elastic modulus of the brachial<br />
artery (inner and outer radii were 1.3mm and 2.0mm) from a measured pulse pressure induced strain of<br />
30.0% was 30.0kPa. The longitudinal PWV measurements along the ultrasound scanhead were 2.8 m/sec<br />
yielding an elastic modulus of and 28.0kPa from the Moens-Kotewerg equation for a tethered elastic tube.<br />
These values are comparable to each other and lower by a factor of about 3 compared to the values before<br />
pressure equalization i.e., under normal physiological pressure. Assuming arterial geometry can be<br />
determined within an error as large as half of the speckle size (0.1mm), the error in elastic moduli is<br />
estimated to be within 20% for the artery sizes to be studied using this method.<br />
Conclusions: These preliminary results demonstrate that the arterial elastic modulus can be determined<br />
from regional longitudinal PWV data generated by the ultrasound scanhead using pressure equalization<br />
and ultrasound speckle tracking. Additional study is underway to explore this method further.<br />
Acknowledgements: Work supported in part by NIH grants HL-47401, HL-67647, HL-68658 and a grant<br />
from the Renal Research Institute.<br />
<br />
indicates Presenter<br />
83
074 COMPUTER AIDED DIAGNOSIS OF BREAST CANCER BASED ON ELASTICITY IMAGES.<br />
Tsuyoshi Shiina 1 , Makoto Yamakawa 1 , Ako Itoh 2 , Eriko Tohno 2 , Ei Ueno 2, Takeshi Matsumura 3 ,<br />
Tsuyoshi Mitake 3 .<br />
1 Graduate School of Systems and Information Engineering, 2 Graduate School of Human Sciences,<br />
University of Tsukuba, Tsukuba, JAPAN; 3 Research & Development Center, Hitachi Medical<br />
Corporation, Kashiwa, JAPAN.<br />
Background: Conventional sonogram, B-mode image, based on the magnitude of echoes often produces<br />
poor contrast between tumor and surrounding tissues. Consequently, the detection of cancerous breast<br />
tumors by B-mode images often requires a high degree of skill on the part of the operators. In other<br />
words, one must know how to detect an unclear boundary of a tumor and evaluate the smoothness of<br />
contour, to understand the intra-tumor texture in the image and subtle differences in brightness. In<br />
addition, some artifacts, such as shadow, make the diagnosis more difficult. On the other hand,<br />
ultrasonic tissue elasticity imaging can provide novel diagnostic information based on tissue hardness<br />
and, consequently, is expected to detect tumor with high contrast and also discriminate benign and<br />
malignant disease.<br />
Methods: We recently developed commercially based equipment for tissue elasticity imaging and have<br />
acquired tissue elasticity images (strain images) as well as B-mode images for 111 cases of beast tumor. In<br />
addition, we constituted scores of malignancy by comparing the hypoechoic region of B-mode and elasticity<br />
image, which is referred to as elasticity score and categorizes patterns of elasticity images into five classes<br />
from malignancy to benign. As a result of diagnosis based on the elasticity score, we found that it was<br />
possible for non-experienced doctors to attain high precision of diagnosis, that is, sensitivity, specificity and<br />
accuracy were 87%, 92% and 90%, respectively, while the accuracy attained by experts based on B-mode<br />
image was 88%. It should be noted that even a non-expert could attain a precise diagnosis based on the<br />
elasticity score as well as experts since the criteria on the elasticity score is much simpler than<br />
conventional B-mode images which requires the skill to recognize many complicated characteristics of the<br />
images. This means that the elasticity score is suited to be implemented into the computer-aided diagnosis<br />
(CAD) system. In this work, therefore, we tried to develop the CAD system based on the elasticity score. The<br />
CAD system extracted characteristics of malignancy from elasticity images based on the elasticity score and<br />
categorizes images to five classes by the following procedure. First, the region of tumor in the B-mode image<br />
is detected using an adaptive method for boundary detection. Next, by obtaining means and variance of<br />
intensity of elasticity image within the tumor region, elasticity images are classified to two major groups,<br />
that is, relative benign and malignant groups. Finally, by detecting the extension and pattern of low strain<br />
region, the two groups are classified to five classes.<br />
Results: The algorithm of the CAD was evaluated by using images for 86 cases of breast tumor such as<br />
intraductal carcinoma and fibroadenoma The result categorized by the CAD system showed the high<br />
coincidence, that is, 89% with those by experts.<br />
Conclusions: These results indicate that the CAD system based on elasticity images is promising as<br />
practical means for cancer diagnosis.<br />
Examples of processed images and results of scoring<br />
<br />
indicates Presenter<br />
84
033 DIAGNOSIS OF LIVER FIBROSIS IN CHILDREN USING FIBROSCAN ® .<br />
Laurent Sandrin 1 , Véronique Miette 1 , C Fournier 1 , Thierry Lamireau 2 , Victor de Lédinghen 3 .<br />
1 Echosens, 32 rue des Jeuneurs, 75002 Paris, FRANCE; 2 Département de Pédiatrie, Hôpital<br />
Pellegrin, CHU Bordeaux, 33076 Bordeaux, FRANCE; 3 Service d’Hépato-Gastroentérologie, Hôpital<br />
Haut Lévêque, C.H.U. Bordeaux, 33604 Pessac, FRANCE.<br />
Aims & Background: FibroScan ® is based on transient elastography. This novel, non-invasive and rapid<br />
(
112 CLINICAL EVALUATION OF THYROID TUMOR WITH REAL-TIME TISSUE ELASTOGRAPHY.<br />
K Tanaka 1 , N Fukunari 2 , H Akasu 1 , W Kitagawa 1 , K Shimizu 2 , K Ito 2 , T Mitake 3 .<br />
l Department of Surgery, Nippon Medical School, Tokyo, JAPAN; 2 Ito Hospital, Tokyo, JAPAN;<br />
3 Hitachi Medical Corporation, Tokyo, JAPAN.<br />
Aims: Various practical difficulties exist in realizing an objective technique for visualizing palpable thyroid<br />
tumors. In this study, we have explored the feasibility of using Elastography technique for the clinical<br />
evaluation of thyroid tumors. We will discuss the technique and the clinical outcome of this study.<br />
Methods: Sixty cases with nodular lesions (40 papillary thyroid cancers, 8 follicular thyroid cancers,<br />
12 adenomatous goiters, and 5 malignant lymphomas) found by ultrasound B-mode were examined and<br />
evaluated with the Elastography (EUB-8500, HITACHI, Japan). The results of Elastography were compared<br />
against the cytology, the cut section, the pathology, and with the images of computed tomography.<br />
Results: Using Elastography, unique and characteristic images were obtained in every type of thyroid<br />
nodular disease. Elastography images were classified into 4 types: Pattern 1, light green throughout the<br />
inside of the nodule; Pattern 2, light green in the center and blue in the periphery of the nodule;<br />
Pattern 3, blue base with mixed colors of light green and red; and Pattern 4, blue in the entire nodule.<br />
(Figure 1) Papillary thyroid cancer images mainly showed Pattern 3 or 4, while lymph node metastasis<br />
specifically had the images of Pattern 4. Follicular thyroid cancer showed Pattern 2. Adenomatous goiter<br />
showed diffuse light green (Pattern 1).<br />
Conclusions: Elastography provides new information for diagnosing thyroid tumors and helps with<br />
deciding therapy. In follicular lesions, it shows distinct differences in tissue elasticity between the<br />
peripheral zone and the center. It is possible to see the presence of lymph node metastasis in papillary<br />
thyroid cancer, yielding important information for clinical diagnosis. Thus, we believe that Elastography<br />
will help in creating treatment plans by providing new substantial clinical information.<br />
Figure 1: Proposed Clarification of Elastography for Thyroid Tumors<br />
<br />
indicates Presenter<br />
86
115 ELASTICITY IMAGING OF 67 CANCERS AND 167 BENIGN BREAST LESIONS SHOWS THAT<br />
IT COULD HALVE BIOPSY RATES OF BENIGN LESIONS.<br />
William E Svensson 1 , Dimitri G Amiras 3 , Sami Shousha 2 , Anand Rattansingh 1 , Dupinder Chopra 1 ,<br />
H Dudley Sinnett 3 , Tim J Hall 4 , Yanning Zhu 5 , Joe Malin 6 , Carol Lowery 6 .<br />
1 Radiology, 2 Pathology and 3 Surgery Departments, Charing Cross Hospital, Imperial College School<br />
of Medicine, London, England, UK; 4 Medical Physics Department, University of Wisconsin-Madison,<br />
Madison, WI, USA; 5 Radiology Department, University of Kansas Medical Center, Kansas City, KS,<br />
USA; 6 Siemens Medical Solutions Ultrasound Group, Issaquah, WA, USA.<br />
Aims: To evaluate real time elasticity imaging on a clinical ultrasound system in a dedicated symptomatic<br />
breast unit and to determine how it to would alter clinical management.<br />
Background: In vitro and in vivo work in recent years has shown that elasticity imaging profiles of benign lesions<br />
are smaller than the grayscale appearance and malignant lesions are larger. Though new imaging developments<br />
have not reduced the biopsy rate of palpable lesions, they could help to reduce the false positive rate associated<br />
with abnormalities found on breast ultrasound examinations particularly in the screening situation.<br />
Methods: Real Time Elasticity Imaging (Software from Hall & Zhu of KUMC) was implemented on a<br />
Siemens Elegra ultrasound scanner. Breast imaging performed with a VFX 13-5 linear array transducer.<br />
Patients attending for routine breast ultrasound in the work up of mammographic or palpable focal<br />
breast abnormalities were invited to have breast strain imaging at the end of their ultrasound<br />
examination if there was a focal abnormality. The strain images were assessed during the clinic and<br />
correlated with subsequent histology or follow up.<br />
Results: 234 lesions were assessed and correlated with the subsequent diagnosis; 67 cancers:<br />
5 intermediate (1 radial scars, 3 phylloides, 1 intraductal papilloma) and 162 benign lesions:<br />
(103 fibroadenomas, 21 cysts, and 10 inflammatory masses, 6 intramammary lymph nodes, 6 normal<br />
breast, 2 gynaecomastia and 14 other lesions (scars, duct ectasia, necrosis, lipoma, sebaceous cyst).<br />
Table 1: Ratio of Elasticity: B-mode.<br />
Lesion Larger elasticity than B-mode image Larger B-mode than elasticity image<br />
Cancer 57 10<br />
Intermediate 3 2<br />
Benign 31 131<br />
Ratio of Elasticity: B-mode >1 indicative of a cancer or intermediate lesion: sensitivity= 83%,<br />
specificity = 81%, positive predictive value = 66%, negative predictive value = 92%.<br />
Table 2: Ratio of Elasticity: B-mode to ensure all cancers and intermediate lesions are detected.<br />
Lesion Elasticity to B-mode ratio > 0.75 Elasticity to B-mode ratio < 0.75<br />
Cancer 67 0<br />
Intermediate 5 0<br />
Benign 79 83<br />
For Cancers and intermediate lesions: Sensitivity = 100%, specificity = 51%,<br />
negative predictive value= 100%, positive predictive value equals 48%.<br />
Conclusions: The smaller the elasticity image of a lesion, compared with the B-mode size, the greater the<br />
likelihood of the lesion being benign. In this study, any lesion with elasticity to B-mode ratio of less than<br />
0.75 was benign. If a ratio of less than 0.75 was used to determine the necessity for biopsy, no cancers<br />
would have been missed. In the screening situation, this would halve the number of biopsies of benign<br />
lesions (false positive biopsies). As elasticity imaging is a new modality, it is probable that increasing<br />
experience with and improvements in elasticity imaging would lead to a further decrease in false positive<br />
results than achieved in this study. This modality merits further evaluation in breast ultrasound imaging.<br />
<br />
indicates Presenter<br />
87
Session BTM: Biomechanical Tissue Modeling<br />
Tuesday, October 18 9:15A – 10:00A<br />
031 THE ROLE OF ANISOTROPIC ELASTICITY AND VISCOSITY IN SKELETAL MUSCLE.<br />
SF Levinson 1 , S Catheline 2 , M Fink 2 , RL Ehman 3 .<br />
1 Rehabilitation Institute of Michigan, Wayne State University, Detroit, MI, USA; 2 Laboratoire Onde<br />
et Acoustique, Ecole Supérieure de Physique et de Chimie Industrielles, Paris, FRANCE; 3 Magnetic<br />
Resonance Research Laboratory, Mayo Clinic Department of Radiology, Rochester, MN, USA.<br />
Aims: We sought to apply elastography to measure anisotropic elasticity and viscosity in skeletal muscle.<br />
Background: Although skeletal muscle is known to be anisotropic, little is known about the relationship<br />
between anisotropic viscoelasticity and the contractile mechanism. We have previously demonstrated that<br />
muscle elasticity is transversely isotropic and increases with contraction [1, 2]. From recent observations,<br />
we hypothesize that viscosity is also transversely isotropic and the dominant property in the transverse<br />
direction. Anisotropic viscoelastic properties have never previously been measured in human muscle and<br />
their relationship to the force of contraction is unknown, as are the potential biomechanical implications.<br />
Methods: Supersonic Shear wave Imaging (SSI) involves ultrafast ultrasonic imaging of<br />
radiation-force-induced shear waves in tissue. By measuring the speed and attenuation of propagation in<br />
different directions, anisotropic moduli can be derived. Using SSI, we calculated elastic and viscous moduli<br />
in the biceps brachii of 3 healthy subjects as a function of the applied load. Magnetic Resonance<br />
Elastography (MRE) also provides a means of measuring 3D wave propagation. We imaged wave<br />
propagation using MRE in the triceps surae of 2 healthy subjects during sustained, controlled contractions.<br />
Results: A representative speed of sound map produced from SSI is shown in Figure 1. From the speed of<br />
sound data, we noted that the elastic modulus increases uniformly with the applied load, that the axial<br />
modulus is roughly 4 times greater than the transverse modulus at rest and that this difference increases<br />
dramatically with even modest degrees of contraction. Although the attenuation data was considerably<br />
noisier, we were able to ascertain that the transverse viscosity is significantly greater than longitudinal<br />
viscosity and that it increases so dramatically with contraction that transverse waves do not propagate at<br />
even moderate loads. The data from MRE are more complex and currently being analyzed.<br />
Conclusions: Although preliminary, the data obtained using SSI completely support our hypotheses. The<br />
degree to which transverse viscosity increases with contraction, however, was unexpected and could have<br />
profound implications in our understanding of human biomechanics.<br />
Acknowledgements: The authors gratefully acknowledge the support of the University of Rochester<br />
School of Medicine and Dentistry, ESPCI and the Mayo Clinic for making this work possible.<br />
References:<br />
[1] S. F. Levinson, "Ultrasound propagation in anisotropic soft tissues: the application of linear elastic theory,"<br />
Journal of Biomechanics, vol. 20, pp. 251-60, 1987.<br />
[2] S. F. Levinson, M. Shinagawa, and T. Sato, "Sonoelastic determination of human skeletal muscle elasticity,"<br />
Journal of Biomechanics, vol. 28, pp. 1145-54, 1995.<br />
No Load 0.4 kg 1.2 kg<br />
Axial<br />
Propagatio<br />
n<br />
Transverse<br />
Propagatio<br />
n<br />
Speed of Sound<br />
(meters/second)<br />
Figure 1:<br />
Speed of sound maps of axial and transverse shear wave propagation in the human biceps as a function of the<br />
applied load. Viscous attenuation completely dampened transverse propagation as the load exceeded 1 kg.<br />
<br />
indicates Presenter<br />
88
094 MICROMECHANICAL ANALYSIS OF DENTIN ELASTIC ANISOTROPY.<br />
Anil Misra 1 , Paulette Spencer 2 , Orestes Marangos 1 , Yong Wang 2 , Mary Walker 2 , J. Lawrence Katz 1,2 .<br />
1 University of Missouri-Kansas City, SCE, 350H Flarsheim Hall, 5100 Rockhill Road, Kansas City,<br />
MO 64110, USA; 2 University of Missouri-Kansas City, SOD, 650 East 25 th Street, Kansas City, MO<br />
64108, USA.<br />
Aims: The objectives of this work are: (1) to develop a micromechanical model that relates the anisotropic<br />
elastic properties to the microstructure of dentin using a virtual bond idealization, and (2) to study the<br />
average force constants and anisotropy parameters utilizing the developed model in order to understand<br />
how the dentin elasticity is affected by the presence of water.<br />
Background: Resonant ultrasound spectroscopy has been used recently to measure the elastic constants<br />
of millimeter sized samples of dry and wet dentin [1]. These measurements indicate that the wet dentin is<br />
transversely isotropic, with higher stiffness perpendicular to the tubule direction, while dry dentin is<br />
isotropic. A micromechanical analysis of dentin elasticity is performed to understand the fundamental<br />
mechanisms that effect dentin elasticity. This micromechanical analysis is based upon the precept that<br />
the material stress-strain behavior critically depends upon the underlying mechanisms that occur at<br />
scales smaller than the material sample scale.<br />
Methods: To accomplish the task of relating the small scale mechanisms to the sample-scale, we<br />
consider dentin to be divided into grains whose centroids represent material points. In analogy with<br />
atomistic-scale interactions, these grains are viewed as interacting with each other through virtual bonds.<br />
These virtual bonds, which are oriented in the different directions of a 3-dimensional space, represent on<br />
average how the primary and secondary bonds between various phases contribute to the overall stiffness<br />
of the bulk material. Based upon the micromechanical model, closed form expressions of the transverse<br />
isotropic stiffness tensor are obtained. These expressions are utilized to compute the stiffness and<br />
anisotropy parameters for dry and wet dentin utilizing an optimization method and the resonant<br />
ultrasound spectroscopy measurements.<br />
Results: Dry dentin anisotropy parameter is found to be zero indicating that dry dentin is isotropic. Wet<br />
dentin anisotropy parameter is found to take on negative values indicating that wet dentin is transversely<br />
isotropic with a stiffer isotropic plane perpendicular to the tubule direction. The force constants for wet<br />
dentin are found to be higher than those of dry dentin.<br />
Conclusions: The force constant calculations indicate that the presence of water results in the stiffening<br />
of bonds as well as an increase in bond density that contribute to the mechanical stiffness at the sample<br />
scale. Moreover, the anisotropy parameter of wet dentin indicates that the bond density becomes higher<br />
in the isotropy plane in the presence of water.<br />
Acknowledgements: A contribution of the University of Missouri-Kansas City Center for Research on<br />
Interfacial Structure and Properties (UMKC-CRISP). This research was supported in part by RO1<br />
DE14392 (PS), K25 DE015281 (YW) from the National Institute of Dental and Craniofacial Research, NIH.<br />
Reference:<br />
[1] Kinney JH, Gladden JR, Marshall GW, Marshall SJ, So JH, Maynard, JD. Resonant ultrasound<br />
spectroscopy measurements of the elastic constants of human dentin. J. Biomech. 37(4), 437-441 (2004).<br />
<br />
indicates Presenter<br />
89
095 CALIBRATING SCANNING ACOUSTIC MICROSCOPY FOR MICROMECHANICAL PROPERTY<br />
QUANTIFICATION.<br />
Orestes Marangos 1 , Anil Misra 1 , J. Lawrence Katz 1,2 , Yong Wang 2 , Paulette Spencer 2 .<br />
1 University of Missouri-Kansas City, SCE, 350H Flarsheim Hall, 5100 Rockhill Road, Kansas City,<br />
MO 64110, USA; 2 University of Missouri-Kansas City, SOD, 650 East 25th Street, Kansas City,<br />
MO 64108, USA.<br />
Aims: In this work, we utilize two methods of calibration for scanning acoustic micrographs: (1) a time<br />
domain method; and (2) a frequency domain method.<br />
Background: Scanning acoustic microscopy (SAM) has been extensively used for imaging of biological<br />
material micromechanical properties by the measurement of the reflection coefficient. However, for biological<br />
materials the reflection coefficients vary over a wide range and are often frequency (scale) dependent.<br />
Therefore, for any quantification of micromechanical properties, it is important that the scanning acoustic<br />
microscope is carefully calibrated.<br />
Methods: The time domain method gives an average value of the reflection coefficient over the transducer<br />
frequency spectrum whereas the frequency domain method gives reflection coefficients as a function of<br />
frequency. Therefore, it is expected that for frequency independent materials, both methods will give very<br />
similar reflection coefficients. For frequency dependent materials, the frequency domain method could<br />
provide more information as to how the reflection coefficient might vary as function of frequency.<br />
Results: Several reference materials with acoustic impedance ranging from ~2 MRayls to 100 MRayls<br />
were imaged with SAM using transducers with central frequencies ranging from 30 to 100 MHz. These<br />
images were analyzed to generate calibration curves utilizing the above mentioned methods.<br />
Conclusions: These calibration curves may be used to quantify the reflection coefficients, acoustic<br />
impedance and elastic moduli of biological materials of unknown properties. Examples of these<br />
quantifications will be presented.<br />
Acknowledgements: A contribution of the University of Missouri-Kansas City Center for Research on<br />
Interfacial Structure and Properties (UMKC-CRISP). This research was supported in part by RO1<br />
DE14392 (PS), K25 DE015281 (YW) from the National Institute of Dental and Craniofacial Research, NIH;<br />
NIH High-End Instrumentation Grant S10 RR16710 (PS); and R01 HL 69064-01-05 from the National<br />
Heart, Lung, Blood Institute (JLK).<br />
<br />
indicates Presenter<br />
90
Session MMT: Mechanical Measurement Techniques for Tissues<br />
Tuesday, October 18 10:30A – 12:00P<br />
001 AVERAGE “GRAIN-SIZE” ESTIMATION IN LIQUID OR SOLID CHANNELS.<br />
D. Hazony 1 , Y. Hazony 2 , J. L. Katz 1,3 .<br />
1 Case Western Reserve University, Cleveland, OH, USA; 2 Boston University, Boston, MA, USA;<br />
3 University of Missouri-Kansas City, Kansas City, MO, USA.<br />
Aims: To use image processing of acoustic signals in order to estimate the average “grain-size” in liquid<br />
or solid channels This presentation is an extension of a conference paper "Average grain-size estimation<br />
in polycrystalline channels" J. Acoustic. Soc. Am., No. 4, Pt. 2. p. 2566. Oct. 2004.<br />
Background: Of concern is stress pulse propagation in dissipating acoustic media constituted of liquids<br />
or solids where the pulse expands as it travels. It will be seen that this expansion may relate to the<br />
presence of a very large number of cells (“grains”) or liquid clusters. The size of each is a random variable<br />
with a defined mean, g s, which may be estimated from the shape changes between the transmitted (echo 1<br />
in the figure below) and received (echo 2) pulses.<br />
Methods: We may define a frequency independent attenuation constant with the propagation which is<br />
proportional to g s . Both theoretical and experimental results will be given. The process is relatively fast<br />
and results are highly reproducible. It is developed by associating – with the channel – a relatively long,<br />
cascading and cellular, electrical network model of a known transfer function. The size of each network<br />
cell is proscribed by g s and the model’s transfer function approaches the Gaussian shape when the<br />
number of cells is increased arbitrarily. It then follows that the transducer input drive must be adjusted<br />
to provide a stress pulse closely approximating a modulated Gaussian shape.<br />
Results: An example is shown in the figure below for a glycerin channel. The impact of the model and the<br />
amelioration of measurement quantization errors will be demonstrated. This procedure also has been<br />
applied to measure the average particle size in a powdered compact of hydroxyapatite (HAp) that is used<br />
for calibration of scanning acoustic microscope (SAM) images. Using a 20 MHz shear wave transducer a<br />
value of 0.2 μm average particle size was obtained.<br />
Conclusions: This procedure has a number of potential applications in biomedical research and clinical<br />
procedures, as well as in manufacturing processes, e.g. HAp crystallite size and growth in coronary artery<br />
disease, mineralite size and growth in bone remodeling during fracture healing and distraction<br />
osteogenesis; metallographic, polymer, and ceramic processing, etc.<br />
Acknowledgements: Work supported by NIH-NIHLB (DH & JLK).<br />
<br />
indicates Presenter<br />
91
002 STUDY OF THE EFFECT OF BOUNDARY CONDITIONS AND INCLUSION’S POSITION ON THE<br />
CONTRAST TRANSFER-EFFICIENCY IN ELASTOGRAPHY.<br />
D Sosa Cabrera 1,2 , J Ophir 1,3 , T Krouskop 4 , A Thitaikumar 1,3 , J Ruiz-Alzola 2 .<br />
1 The University of Texas Medical School, Department of Radiology, Ultrasonics Laboratory,<br />
Houston, TX, USA; 2 University of Las Palmas de Gran Canaria, Center for Technology in Medicine,<br />
Department of Signals and Communications, Canary Islands, SPAIN; 3 University of Houston,<br />
Electrical and Computer Engineering Department, Houston, TX, USA; 4 Baylor College of Medicine,<br />
Department of Physical Medicine and Rehabilitation, Houston, TX, USA.<br />
Introduction: In classical elasticity, the effects of defects such as holes and cracks on the stress<br />
distribution in an elastic medium have been favorite objects for study. The effects of holes drilled in<br />
structural members are accounted for by using formulae that reduce the effective dimensions of the<br />
remaining material, and have been tabulated for most common geometries [1]. It seems evident that<br />
elastographic images of strain are influenced by the size, location relative to the boundaries of the tissue<br />
mass, and by the geometry of inclusions.<br />
Methods: The Contrast Transfer Efficiency (CTE), η, is defined as the observed strain contrast divided by<br />
the true modulus contrast [2]. In the present work, we investigate this efficiency of elastography for true<br />
modulus contrast (Ct) ranging from 1.25 to 3. We describe the results of 2-D FEA simulations designed to<br />
study how the position of a stiff circular inclusion in an elastic background and the boundary conditions<br />
affect the CTE. Six inclusion locations were used with 5 boundary configurations (BC), having a total of<br />
30 cases at 3 levels of Ct, to study how lesion-to-background modulus contrasts were modulated in the<br />
corresponding strain images (Figure 1). Later, we studied 3 more positions (positions 7, 8 and 9 in<br />
Figure 1) to understand the effect of having an inclusion away from the edge. The unfilled arrowheads<br />
indicate the direction in which motion was constrained during displacement of the top surface.<br />
Results and Discussion: It was observed that, there is generally a good efficiency of contrast transfer,<br />
and there are some cases where such contrast transfer is higher than 1. As expected from previous<br />
results [2], the CTE decreases with the modulus contrast. It was observed that the effect of the BC at the<br />
left edge on CTE was insignificant when the inclusion was three diameters away from this edge. In<br />
Figure 2, we show a strain image showing a partial shadowing of the inclusion due to the BC. Important<br />
parameters that affect the contrast transfer were identified as the location of the inclusion, the boundary<br />
conditions, and the relation between them.<br />
Acknowledgement: Supported by NIH Program Project Grant P01-CA64597, CIFEC Program (Canary<br />
Islands’ Government), and USIMAG grant (TEC2004-06647-C03-02/TCM) from the Spanish Government.<br />
References:<br />
[1] W Young and R Budynas: Roark’s Formulas for Stress and Strain, McGraw-Hill, 2002<br />
[2] H Ponnekanti et al: Fundamental Mechanical Limitations on the Visualization of Elasticity Contrast in<br />
Elastography, Ultrasound in Med. & Biol. Vol. 21, No 4, pp. 533-543, 1995<br />
A B C D E<br />
4<br />
5<br />
6<br />
1<br />
2<br />
7 3 8 9<br />
Figure 1: Schemes for the different cases for the<br />
boundary conditions and positions of the<br />
inclusion.<br />
Figure 2: Strain image Pos. 6<br />
Case E.<br />
<br />
indicates Presenter<br />
92
026 IN VIVO MECHANICAL BEHAVIOR OF HUMAN LIVER.<br />
Edoardo Mazza 1 , Alessandro Nava 1 , Dieter Hahnloser 2 , Wolfram Jochum 3 , Michael Bajka 4 .<br />
1 Mechanical Engineering Department, Swiss Federal Institute of Technology, 8092, Zurich,<br />
SWITZERLAND; 2 Visceral and Transplantation Surgery, 3 Pathology, 4 Obstetrics and Gynecology<br />
Departments, University Hospital, Zurich, SWITZERLAND.<br />
Aims: Characterization of the in vivo mechanical behavior of soft human <strong>org</strong>ans is essential for medical<br />
applications such as surgery planning, virtual reality surgery training, trauma research, and various<br />
diagnostic methods. In vivo mechanical testing with well defined kinematic and kinetic boundary<br />
conditions provides information for fitting phenomenological constitutive models. In order to gain further<br />
understanding of the biomechanical properties of human <strong>org</strong>ans, the parameters of the constitutive<br />
models must be linked to histological findings. This paper presents results of in vivo mechanical<br />
measurements on human liver complemented by histological analysis of biopsies obtained from the<br />
testing location.<br />
Background: Experiments for the mechanical characterization of the human liver were performed in vivo,<br />
during open surgery under sterile conditions. Local measurement of the mechanical response of healthy<br />
and diseased tissue was undertaken before <strong>org</strong>an extraction. After extraction, tissue samples were<br />
removed and histological exams were carried out. In this way correlations between mechanical<br />
parameters and histological findings could be investigated.<br />
Methods: Mechanical testing was carried out using the tissue aspiration device, Figure 1. The technique<br />
is based upon the pipette aspiration procedure. The device consists of a tube in which the internal<br />
pressure can be controlled according to a desired pressure law. The experiment is performed by (1) gently<br />
pushing the tube against the tissue to ensure a good initial contact, (2) creating a (time variable) vacuum<br />
inside the tube so that the tissue is sucked in through the aspiration hole (diameter of 10 mm). A digital<br />
camera records the tissue deformation and a pressure sensor measures the applied pressure. A control<br />
system guarantees the repeatability of the same loading conditions for all the experiments performed and<br />
therefore allows a direct comparison of the results obtained in different tests. Biopsies were analyzed<br />
using standard histological techniques and tissues were classified according to the presence of normal<br />
tissue, fibrosis, steatosis, or cancerous tissue.<br />
Results: Mechanical parameters were determined from the analysis of tissue’s deformation history for<br />
given loading conditions. The parameters are related to stiffness and time dependent behavior. Fibrosis of<br />
liver tissue leads to significant stiffness enhancement, whereas modest changes are observed in liver<br />
tissue with steatosis. Increased stiffness is also seen in cancer tissues, e.g. hepatocellular carcinoma<br />
(HCC), with fibrotic tumor stroma, Figure 2.<br />
Conclusions: High quality mechanical data were obtained from aspiration experiments during open<br />
surgery. These data can be used for fitting of constitutive models and indicate that changes in<br />
mechanical properties can be linked to specific pathological modifications of tissue microstructure.<br />
References:<br />
[1] Nava, A., Mazza, E., Journal of Technology and Health Care 12 (2004), 269-280.<br />
[2] Mazza, E., Nava, A., Bauer, M. Winter, R. Bajka, M. Holzapfel, G.A., Mechanical properties of the<br />
human uterine cervix: an in vivo study. Medical Image Analysis, accepted for publication.<br />
stiffness index<br />
0.5<br />
0.4<br />
0.3<br />
0.2<br />
0.1<br />
0<br />
Figure 1: In vivo Aspiration Experiment<br />
1<br />
Carcinoma with prominent<br />
Normal liver tissue<br />
fibrosis of stroma<br />
2<br />
1<br />
1<br />
normal normal 80%<br />
70%<br />
HCC<br />
fibrosis<br />
fibrosis<br />
Figure 2: Stiffness Index for Different Samples<br />
2<br />
Liver 3<br />
<br />
indicates Presenter<br />
93
027 MECHANICAL CHARACTERIZATION OF SOFT TISSUE: COMPARISON OF DIFFERENT<br />
EXPERIMENTAL TECHNIQUES ON SYNTHETIC MATERIALS.<br />
Davide Valtorta 1 , Marc Hollenstein 1 , Alessandro Nava 1 , Vincent Luboz 2 , Minhua Lu 3 , Alex Choi 3 ,<br />
Edoardo Mazza 1 , Yongping Zheng 3 , Stephane M. Cotin 2 .<br />
1 ETH Zürich, Swiss Federal Institute of Technology, 8062 Zürich, SWITZERLAND; 2 CIMIT,<br />
Simulation Group, Massachusetts General Hospital, Boston, MA, USA; 3 The Hong Kong<br />
Polytechnic University, Hong Kong, CHINA.<br />
Aims: Accurate mechanical modeling of soft tissue is essential for many applications like medical<br />
simulation or surgical planning. Several techniques are currently available for mechanical testing of soft<br />
biological tissues. Based on different working principles, strain and frequency ranges, these methods<br />
deliver a set of mechanical parameters which can then be used to define constitutive models. The goal of<br />
the present work is to propose a system for assessing the reliability of these devices and techniques.<br />
Toward this goal, we have created a silicone phantom called TC2. The TC2 has been tested using different<br />
devices currently developed in 3 different laboratories. The results, comparing constitutive model<br />
parameters determined by each method, are an indicator of the accuracy of each approach.<br />
Background: The TC2 is a cylindrical phantom made of silicone gel (Figure 1) with stiffness properties<br />
comparable to those of soft biological tissues and showing hyperelastic response up to relatively large<br />
deformations. The mechanical properties of the TC2 are stable over time, thus allowing direct comparison<br />
of the results obtained in subsequent investigations in different laboratories. Following previous work by<br />
Kerdok et al. [1] on a similar phantom, barium markers were embedded inside the cylinder to enable CT<br />
measurement of the deformation field in a large strain indentation test.<br />
Methods: Independent tests were carried out on the same TC2 phantom: standard uniaxial compression<br />
tests [1], shear tests, quasi-static aspiration experiments [2], dynamic torsion tests [3], quasi-static and<br />
dynamic indentation (with the device called TeMPeST, [4]), and ultrasonic indentation tests [5]. The large<br />
strain indentation experiment has been used as benchmark for the constitutive models obtained from<br />
different procedures.<br />
Results: Comparison of the experimental results highlighted specific limitations and error sources related<br />
to (1) the measurement techniques and (2) the algorithms for material parameter extraction. After<br />
analysis of the results, a good agreement was obtained for the material parameters evaluated, the static<br />
Young module ranging from 26kPa to 34kPa. Using the constitutive model derived from the experiments,<br />
the large strain indentation test has been simulated using FE models (see Figure 2): calculation results<br />
agree to a great extent with the experimental forces vs. displacement curve as well as with the<br />
deformation field obtained from the CT-scans.<br />
Conclusions: This study provides a useful reference for the development of mechanical testing procedures<br />
for soft tissue. It also shows that accurate evaluation of mechanical measurements allows definition of<br />
reliable constitutive models, which can be used for simulation of large deformation of soft tissue.<br />
References:<br />
[1] Kerdok, A.E. et al., Medical Image Analysis 7(2003), 283-291.<br />
[2] Nava, A., Mazza, E., Journal of Technology and Health Care 12 (2004), 269-280.<br />
[3] Valtorta, D., Mazza E., Lecture Notes in Computer Science 3217 (2004), 284-292.<br />
[4] Ottennsmeyer, M.P., Experimental Techniques 26 (2002), 48-50.<br />
[5] Zheng, Y.P., Mak, A.F.T. IEEE Transactions on Biomedical Engineering 43 (1996), 912-918.<br />
Figure 1: TC2 Phantom<br />
Figure 2: Large Strain Indentation (Real on left; Simulated on right)<br />
<br />
indicates Presenter<br />
94
039 SHEAR MODULUS RECONSTRUCTION USING ULTRASONICALLY MEASURED STRAIN RATIO.<br />
Chikayoshi Sumi 1 .<br />
1 Sophia University, 7-1 Kioicho, Chiyodaku, Tokyo 102-8554, JAPAN.<br />
Aims: Our previously developed three methods of shear modulus reconstruction using strain (elongation<br />
or compression) ratio [1, 2] are reviewed, and the usefulness of the methods is summarized. Although we<br />
have reported the usefulness of the methods for in vivo deeply situated tissues such as liver [3], here we<br />
focus on the application to in vivo breasts.<br />
Methods: Method 1 evaluating the strain ratio is useful when the measurement accuracy of the strain is<br />
high. However, since tissue having high shear moduli, such as scirrhous carcinoma, often causes singular<br />
points/regions, Method 1 interpolates or truncates, using pre-specified upper values, the shear modulus<br />
values at singular points/regions, whereas both Methods 2 and 3 realize the regularized implicit-integration<br />
using the conjugate gradient method [3]. Specifically, Method 3 carries out regularized implicit-integration<br />
only at the singular points/regions while Method 2 caries out throughout ROI (strain ratio is used as initial<br />
value). Thus, the smaller number of singular points allows for Method 3’s more rapid reconstruction than<br />
Method 2. As Method 1, the Method 3 is also useful when the measurement accuracy of strain is high. When<br />
evaluating strains at reference regions with a high spatial resolution, reconstructions obtained with Methods<br />
1-3 often become laterally unstable. To cope with this instability, reconstruction of the inverse of the shear<br />
modulus obtained by the strain ratio is efficiently low-pass filtered rather than reconstruction of the shear<br />
modulus. In this case, implicit-integration (Methods 2 and 3) is performed with respect to the inverse of the<br />
shear modulus [2]. Otherwise, when using a homogeneous region as reference such as a block of reference<br />
material or fatty tissue, evaluation of strain at reference regions with a low spatial resolution is also effective.<br />
Results: A female 59 year old volunteer with a scirrhous carcinoma was supinely positioned. To obtain<br />
absolute shear modulus reconstructions, a homogeneous agar phantom with a shear modulus of<br />
1.4 10 6 N/m 2 was used as the reference. References are taken at the points on the line of 36.1mm depth<br />
(reference line) existing in the homogeneous reference. Reconstruction results of the shear modulus and the<br />
inverse of the shear modulus are shown in Figure 1 obtained by Method 1 (Methods 2 and 3, omitted).<br />
Lateral instability was coped with by low-pass filtering of the strain ratio and evaluating the strains with<br />
a low spatial resolution at the reference line. Although the evaluation of strains with the low spatial<br />
resolution yields stable reconstructions with a high spatial resolution (Figures 1f and 1g) compared to<br />
low-pass filtering of strain ratio (Figures 1c and 1d), we confirmed through simulations that this yields<br />
low quantitative results when reducing artifacts due to 1D reconstruction.<br />
That is, although the quantitativeness of the stiff region and the soft region is improved by setting<br />
reference regions to pass through the stress concentration regions and the weak stress regions in front of<br />
and behind the regions together with reducing the artifacts occurring at the stress concentration regions<br />
and the weak stress regions [2], in such cases reduction of spatial resolution of measured strain is not<br />
desirable at the point of quantitativeness.<br />
Conclusions: All these methods using strain ratio realizes real-time shear modulus reconstruction.<br />
However, we should keep in mind that when the measurement<br />
accuracy of strain is not high, Method 2 using, not the strain ratio,<br />
but a uniform distribution as an initial value is effective in obtaining<br />
stable reconstructions though it takes more iterations, which was<br />
confirmed for monitoring of electromagnetic coagulation therapy on<br />
in vivo liver carcinoma [2].<br />
Refereces:<br />
[1] Sumi, IEICE Trans. Fundamentals, E78-A, pp. 1655-1664, 1995.<br />
[2] Sumi, “Usefulness of ultrasonic strain measurement-based shear<br />
modulus reconstruction for diagnosis and thermal treatment,” IEEE<br />
Trans. UFFC, Oct <strong>2005</strong> (in press).<br />
[3] Sumi, IEEE Trans. MI, 17, 419-428, 1998.<br />
Figure 1:<br />
Shear Modulus Reconstructions Obtained by Calculating Strain<br />
Ratio (Method 1). (a) Shear modulus. (b) Inverse shear modulus.<br />
(c) Low-pass filtered (a). (d) Low-pass filtered (b). (e) Inverse of (d).<br />
(f) Shear modulus obtained by using moving-averaged strains at<br />
reference line. (g) Inverse shear modulus obtained by using moving-averaged strains at reference line.<br />
<br />
indicates Presenter<br />
95
081 NONINVASIVE INTRAMUSCULAR PRESSURE MEASUREMENTS THROUGH HARMONIC<br />
ANALYSIS OF ARTERIAL PULSATIONS.<br />
Ted Lynch 1 , Toshiaki Ueno 2 , AD Cutuk 2 , JM Wiemann 2 , BR Macias 2 , Alan R Hargens 2 .<br />
1 Luna Innovations, Inc., 130 Research Dr., Hampton, VA 23666, USA; 2 University of California<br />
San Diego, Dept of Orthopaedics, 350 Dickinson St., San Diego, CA 92103, USA.<br />
Aims: A method for the non-invasive assessment of intramuscular pressure (IMP) is developed based on<br />
high resolution displacement measurements. The higher harmonics of the displacement waveform are<br />
filtered out as IMP increases, providing a means for diagnosing acute compartment syndromes (ACS).<br />
ACS is defined as sufficiently high IMP to restrict blood flow in the muscle.<br />
Background: The ultrasonic pulsed phase locked loop (PPLL) obtains high resolution displacement<br />
waveforms of muscle compartments, the intracranial compartment and vascular walls. The shape of these<br />
waveforms is highly correlated to simultaneously obtained pressure waveforms obtained with pressure<br />
sensors inserted into the tissue compartment [1]. There is a considerable body of literature [2-11] in which<br />
a Windkessel model is applied to the pressure waveform to estimate arterial and intracranial compliance<br />
based on the harmonic content of the waveform. Similar analysis of the displacement waveform allows<br />
estimation of IMP, and the results have been validated clinically for ACS diagnosis.<br />
Methods: ACS is diagnosed with the PPLL by detecting arterial pulsations with micrometer precision. As<br />
IMP increases, higher harmonics of the arterial pulsation waveform are filtered out, which is detected by<br />
the PPLL. The ratio of the fundamental wave to the second harmonic (FW/H2) is linearly correlated to<br />
IMP. Healthy subjects and patients admitted to the UCSD Trauma Center were included in a clinical<br />
study used to establish the diagnostic utility of the PPLL for ACS diagnosis.<br />
Results: In healthy subjects, the FW/H2 correlated linearly to IMP (R=0.86). As a thigh tourniquet<br />
increased IMP from 12 mmHg (+/-2mmHg) to 26mmHg (+/-4mmHg), the FW/H2 increased significantly<br />
from 0.65AU (+/-0.05AU) to 1.00AU (+/-0.2AU). FW/H2 further increases at the higher IMP values seen<br />
in ACS, with a high of 2.67AU recorded for a patient whose IMP was 60mmHg.<br />
Conclusions: The linear correlation of FW/H2 to IMP is demonstrated clinically. Preliminary results<br />
indicate that similar algorithms may be employed for the noninvasive measurement of intracranial<br />
pressure, and the assessment of cardiovascular disease.<br />
Acknowledgements: This work was funded by a Phase II SBIR contract from the Army Research Office.<br />
References:<br />
[1] Wiemann JM, et al. “Noninvasive Measurements of Intramuscular Pressure using Ultrasound in a Model<br />
Compartment Syndrome.” Presentation to the Orthopedic Research Society Annual Conference, <strong>2005</strong>.<br />
[2] Brinton TJ, et al. “Arterial compliance by cuff sphygmomanometer: application to hypertension and early<br />
changes in subjects at genetic risk” Hypertension 1996 Oct; 28(4):599-603.<br />
[3] Chesney CF, Finkelstein SM and Cohn JN. “Method and instrument to measure vascular impedence.” U.S.<br />
Patent #6,623,434, 2003.<br />
[4] Chio SS. “Method for diagnosing, monitoring and treating hypertension and other cardiac problems.” US Patent<br />
#6,540,687.<br />
[5] Molino P, et al. “Beat-to-beat estimation of Windkessel model parameters in conscious rats.” Am J Physiol Heart<br />
Circ Physiol 274: H171-H177, 1998.<br />
[6] Watts TB and Burrus CS. “Arterial pressure contour analysis for estimating human vascular properties.” J Appl<br />
Physiol 40: 171-176, 1976.<br />
[7] Daley ML, et al. “An estimated compliance index derived from intracranial pressure recording.” Acta Neurochir<br />
(2002) [Suppl] 81:183-185.<br />
[8] Daley ML, et al. “Intracranial pressure dynamics: changes of bandwidth as an indicator of cerebrovascular<br />
tension.” Med Eng & Physics 25 (2003) 679-689.<br />
[9] Lang EW, et al. “Noninvasive intracranial compliance monitoring: Technical note and clinical results.” J<br />
Neurosurg. 2003 Jan;98(1):214-8.<br />
[10] Michaeli D and Rappaport ZH. “Tissue resonance analysis; a novel method for noninvasive monitoring of<br />
intracranial pressure.” J Neurosurg. 2002 Jun; 96 (6):1132-7.<br />
[11] Piper IR, et al. “Systems analysis of cerebrovascular pressure transmission: an observational study in headinjured<br />
patients.” J Neurosurg 1990 Dec;73(6):871-80.<br />
<br />
indicates Presenter<br />
96
Session MIP-2: Methods for Imaging Elastic Tissue Properties – II<br />
Tuesday, October 18 1:30P – 3:30P<br />
061 THE SPATIO-TEMPORAL VARIATION OF THE STRAIN FIELD INSIDE COMPRESSED<br />
POROELASTIC MATERIALS.<br />
Gearóid P Berry 1 , Jeffrey C Bamber 1 , Nigel L Bush 1 , Naomi R Miller 1 .<br />
1 Institute of Cancer Research, 15 Cotswold Road, Sutton, Surrey, SM2 5NG, England, UK.<br />
Aims: To image the spatio-temporal variation of the strain field<br />
inside compressed materials containing mobile fluid, and to<br />
compare images obtained with analytical and finite element<br />
predictions.<br />
Background: Soft tissues contain mobile fluid, and this fluid can<br />
be encouraged to flow by the application of a compressive<br />
displacement to the surface of the tissue [1]. In an attempt to<br />
model the effect of this flow on the compression-induced strain<br />
field, soft tissue has previously been treated as a poroelastic<br />
material [2,3]. Previous preliminary experimental elastographic<br />
imaging of the induced strain field in a fluid-rich sample showed<br />
time-dependent spatially-varying behaviour that appeared to<br />
agree with theoretical predictions [3]. Further experiments, using<br />
more samples, were desired to provide statistically valid<br />
confirmation of this behaviour.<br />
Methods: Using analytical and finite element (FEM) techniques,<br />
previous theoretical predictions [2, 3] were further developed and<br />
interpreted. Five tofu phantoms, each containing mobile fluid,<br />
were subjected to sustained compression, and the time-evolution<br />
of the strain field was imaged using elastographic techniques.<br />
Results: Analytical and FEM results were in good agreement,<br />
providing helpful validation of the modeling software for future<br />
use in more general compression problems. The imaged strain<br />
field in each phantom was found to be both time-dependent and<br />
spatially-varying, and behaved in a manner consistent with both<br />
previous predictions of poroelastic theory [2, 3, 4] and those<br />
developed in this work. A typical example is shown in Figure 1.<br />
Conclusions:<br />
This study provides confidence in our previous experimental<br />
results and further insight into how the strain field in soft<br />
tissues rich in mobile fluid might behave when the tissue is<br />
subjected to sustained compression. Potential applications of<br />
importance include the diagnosis of medical conditions such as<br />
lymphoedema and malignant tumours.<br />
References:<br />
[1] Levick JR. An Introduction to Cardiovascular Physiology 4 th<br />
ed. 2003. ISBN: 0340809213.<br />
[2] Konofagou E, Harrigan TP, Ophir J, Krouskop TA.<br />
Poroelastography: imaging the poroelastic properties of<br />
tissues. UMB 2001;27(10):1387-1397.<br />
[3] Berry GP, Bamber JC, Miller NR. Towards a model-based<br />
poroelastic imaging method. Proc of the 3rd Int. Conf. on the<br />
Ultrasonic Measurement and Imaging of Tissue Elasticity<br />
2004:p96.<br />
[4] Biot MA. General Theory of Three-Dimensional<br />
Consolidation. J. Applied Physics 1941;12:155-164.<br />
Figure 1: The measured<br />
spatio-temporal variation of the<br />
lateral-to-axial strain ratio inside a<br />
mobile-fluid-rich phantom showing<br />
the characteristic retreat with time,<br />
of the region of high strain ratio,<br />
away from the sample boundaries<br />
(centre line = axis of symmetry).<br />
<br />
indicates Presenter<br />
97
065 A NEW COMPRESSION METHOD FOR GENERATING POROELASTOGRAMS IN INHERENTLY<br />
NOISY APPLICATIONS.<br />
Raffaella Righetti 1 , Jonathan Ophir 1 , Brian S. Garra 2 , Thomas A. Krouskop 1,3 .<br />
1 The University of Texas Health Science Center at Houston, 6431 Fannin St., Houston, TX 77030,<br />
USA; 2 The University of Vermont College of Medicine, 111 Colchester Av., Burlington, VT 05401,<br />
USA; 3 Baylor College of Medicine, One Baylor Plaza, Houston, TX 77030, USA.<br />
Aim: To develop a new compression method that allows generation of poroelastograms in inherently noisy<br />
environments such as those of clinical interest.<br />
Background: Poroelastography requires the acquisition of data over a time interval in order to detect<br />
time-dependent changes that occur in poroelastic materials and tissues due to fluid flow. The<br />
experimental methodology proposed thus far for phantoms and tissues in vitro [1] may not be suitable for<br />
monitoring relatively slow time-dependent poroelastic changes in tissue in vivo, because of echo<br />
decorrelation problems due to uncontrollable motion. To overcome these limitations, we propose a new<br />
compression methodology that is more robust in poroelastographic applications in vivo.<br />
Methods: In this paper, we compare the performance of poroelastography when using the step<br />
compression and a new compression scheme. The new compression scheme requires the application of a<br />
constant strain rate to the sample and data acquisition during the loading phase. Successively,<br />
poroelastograms are generated by continuously moving the reference frame and cross-correlating frames<br />
that are equally spaced in time. This allows long acquisition times and also minimizes the decorrelation<br />
because of the short inter-frame time interval between the frames that are correlated. Poroelastographic<br />
experiments were performed on phantoms and tissues in vivo using both methodologies and the two sets<br />
of results obtained from the controlled experiments were compared using standard statistical tests.<br />
Results: Figure 1 shows the results of the poroelastographic experiments performed on phantoms. The<br />
Poisson’s ratio elastograms shown in the top row refer to a poroelastogram obtained using a step<br />
compression displacement, while the Poisson’s ratio elastograms shown in the bottom row refer to a<br />
poroelastogram obtained using the new compression scheme. Figure 2 shows the corresponding average<br />
Poisson’s ratio values (solid curve: step compression; dashed curve: new compression), which were found<br />
not to be statistically different. However, in in vivo applications, the step method did not allow any<br />
meaningful information on the time-dependent poroelastic behavior of the tissues to be collected after 1s.<br />
The new compression methodology, instead, retained relatively high correlation between the frames that<br />
were used for the generation of the poroelastograms for longer times, thus suggesting the feasibility of<br />
using it for monitoring fast (1s) tissue time-dependent poroelastic changes.<br />
Conclusions: In this paper, we<br />
have described a new<br />
compression scheme for<br />
poroelastography. The new<br />
compression method was found<br />
to produce similar results to the<br />
traditional compression method<br />
in controlled phantom<br />
experiments, and appeared to be<br />
more robust in inherently noisy<br />
applications. Figure 1<br />
Acknowledgements: This work was supported by NCI Program Project<br />
PO1-CA64597-12.<br />
Reference:<br />
[1] Righetti R, Ophir J, Srinivasan S and Krouskop TA. The feasibility<br />
of using elastography for imaging the Poisson’s ratio of porous<br />
media. Ultrasound Med. Biol. 2004. 30: 215-228.<br />
Figure 2<br />
<br />
indicates Presenter<br />
98
018 MAXIMUM STRAIN ACCUMULATION FOR IN VIVO BREAST TISSUE.<br />
AM Sommer 1 , TJ Hall 1 , J Jiang 1 .<br />
1 Department of Medical Physics, University of Wisconsin – Madison, Madison, WI, USA.<br />
Background and Aims: The aim of this study is to determine the maximum amount of tissue<br />
deformation that can be tracked accumulatively for in vivo breast tissue and study that maximum as a<br />
function of the step size for summing multiple deformations. The results for in vivo tissue were then<br />
compared to that for data from gel phantoms.<br />
Methods: Radio frequency (RF) echo data was acquired from a Siemens Elegra with freehand scanning of<br />
in vivo breast tissue and phantoms. RF-echo fields were dynamically paired with a range of time<br />
separations to vary the frame-average strain used to accumulate larger total strains. The displacement<br />
field between a reference and deformed RF frame was estimated using a 2-D block-matching technique.<br />
The estimated displacement was used to warp the deformed RF-echo field back to the geometry of the<br />
reference RF-echo field. Normalized cross correlation between the reference RF field and the<br />
motion-compensated deformed RF field was used to measure motion tracking accuracy and compare the<br />
various step sizes and to determine the maximum amount of strain that could be accumulated given an<br />
acceptable amount of decorrelation.<br />
Results: The normalized cross correlation between the reference RF field and the motion-compensated RF<br />
field accumulated with frame-average strain step sizes of nominally 0.3%, 0.6%, and 1.2% were compared<br />
(Figure 1) with a single large deformation for benign in vivo breast tissue. The maximum strain that can<br />
be accurately tracked improves significantly by summing multiple smaller strains, but the difference<br />
between accumulating 0.3%, 0.6%, and 1.2% strain fields is very small. This data also demonstrates that<br />
it is easier to accurately track large deformation in gel phantoms compared to benign and malignant<br />
tissue (Figure 2). Tissue motion is significantly more complex than that in phantoms, leading to a large<br />
discrepancy between phantom and in vivo tissue data. Since malignant tissue is typically much stiffer<br />
than benign tissue, significantly more compression of normal tissue is required to achieve the same<br />
frame-average strain in a malignant tumor compared to a benign tumor of the same size.<br />
Conclusions: Using our current motion tracking algorithm the optimal step size for in vivo tissue was<br />
found to be nominally 1% frame-average strain. The maximum strain that can be accurately accumulated<br />
is limited by the ability of the motion tracking algorithm currently being used. Improving the motion<br />
tracking algorithm will decrease the accumulated error and allow for tracking larger tissue deformation<br />
accumulatively.<br />
Acknowledgements: We are grateful for the support from the USAMRMC (DAMD17-00-1-0596), the<br />
NIH (R01-CA100373), the University of Wisconsin and to colleagues at the Mayo Clinic in Rochester, MN,<br />
USA, and the Charing Cross Hospital in London, UK, for providing some of the data used in this study.<br />
Figure 1 Figure 2<br />
<br />
indicates Presenter<br />
99
032 DOPPLER MYOGRAPHY—DETECTING AND IMAGING INTRINSIC MUSCLE SOUNDS.<br />
SF Levinson 1 , H Kanai 2 , H Hasegawa 2 .<br />
1 Rehabilitation Institute of Michigan, Wayne State University, Detroit, MI, USA; 2 Tohoku<br />
University, Department of Electronic Engineering, Sendai, JAPAN.<br />
Aims: We sought to measure and image intrinsic vibrations that occur with skeletal muscle contraction.<br />
Background: It has long been known that muscle fibers vibrate during contraction. These vibrations<br />
occur at the resonant frequency of the fibers, which is related to fiber length, tension and elasticity [1, 2].<br />
We have previously demonstrated the ability to use Doppler ultrasound principles to detect propagating<br />
heart sounds. The ability to detect skeletal muscle sounds noninvasively could reduce or eliminate the<br />
need for needle electromyography (EMG) in neuromuscular diagnosis.<br />
Methods: Using surface electrodes and a microphone, we measured surface EMG and phonomyographic<br />
(PMG) signals during contractions of the forearm flexor muscles in a single subject. Using an ultrasound<br />
transducer coupled to hardware and software previously applied in cardiac experiments, we<br />
simultaneously recorded ultrasonic Doppler waveforms from within the contracting muscles. The<br />
experimental apparatus is shown in Figure 1.<br />
Results: A representative set of waveforms is shown in Figure 2. The Doppler myographic (DMG) signals<br />
correlated well with both surface EMG and PMG. Further, it was possible to differentiate between<br />
contractions in different digits of the hand with DMG, but not EMG nor PMG.<br />
Conclusions: We have demonstrated the feasibility of using Doppler myography to detect the intrinsic<br />
sounds of contracting skeletal muscles. Further, we have demonstrated that these sounds can in part be<br />
localized without the use of the invasive needles as required for EMG. We anticipate that DMG could<br />
become a significant new clinical modality for the diagnosis of neuromuscular disorders.<br />
Acknowledgements: The authors gratefully acknowledge the support of the University of Rochester<br />
School of Medicine and Dentistry for making this work possible.<br />
References:<br />
[1] D. T. Barry, S. R. Geiringer, and R. D. Ball, "Acoustic myography: a noninvasive monitor of motor<br />
unit fatigue," Muscle & Nerve, vol. 8, pp. 189-94, 1985.<br />
[2] P. A. Dalton and M. J. Stokes, "Frequency of acoustic myography during isometric contraction of fresh<br />
and fatigued muscle and during dynamic contractions," Muscle & Nerve, vol. 16, pp. 255-61, 1993.<br />
Figure 1: Measurement setup for simultaneous<br />
recording of surface EMG, PMG and DMG<br />
signals.<br />
Figure 2:<br />
Representative recordings of surface EMG,<br />
PMG & DMG during contraction of the<br />
forearm flexor muscles.<br />
<br />
indicates Presenter<br />
100
029 TRANSIENT ULTRASOUND ELASTOGRAPHY USING IMPULSIVE ULTRASOUND RADIATION FORCE.<br />
D Melodelima 1 , J Bamber 1 , F Duck 2 , S Shipley 2 .<br />
1 Joint Department of Physics, Royal Marsden NHS Trust and Institute of Cancer Research,<br />
Sutton, Surrey, England, UK; 2 Medical Physics Department, Royal United Hospital NHS Trust,<br />
Bath, England, UK.<br />
Aims: The use of a focused ultrasound transducer to generate impulsive radiation force for strain<br />
imaging was investigated to improve breast cancer detection.<br />
Background: Alternative imaging methods are needed to improve the effectiveness of breast cancer<br />
detection and diagnosis. As a result, the development of imaging systems capable of evaluating the<br />
mechanical properties of tissues with high resolution is being carried out by numerous research teams<br />
[1-3]. Several groups are studying acoustic radiation force-based imaging modalities [4, 5]. However, to<br />
date these have been largely based on the detection, by various means, of signals that are proportional to<br />
the displacement induced by radiation force, whereas in pseudo-static elastography generally strain is<br />
imaged, as a surrogate for inverse stiffness. The imaging of strain generated by radiation force from a<br />
focused ultrasound transducer may be of interest to improve breast cancer detection.<br />
Methods: In this study, a focused ultrasound transducer having an f-number of 1.3 was driven at an<br />
operating frequency of 1.7 MHz, and was used to apply localised radiation force to a small volume of<br />
tissue mimicking phantom. Images were created using a single "pushing" burst at each location, of 8 ms<br />
duration. A linear array with a centre frequency of 7.5 MHz was used to obtain echo signals. The focused<br />
transducer and the linear array were aligned such that the focus was in the plane of imaging. The<br />
time-dependent transient strains resulting from the impulsive radiation force were mapped using a<br />
least-squares strain estimator and ultrasound RF correlation-based displacement tracking methods.<br />
Gelatine phantoms containing cylindrical stiff inclusions were used.<br />
Results: Experimental results demonstrate that strain on the order of 0.04 can be generated and detected<br />
with a resolution of about 1 mm. A stiffer region exhibits lower strain than a more compliant region. The<br />
instantaneous strain immediately following cessation of the radiation force varies approximately linearly<br />
with the Young's modulus of the material. Good agreement was obtained between the size of the inclusion<br />
seen macroscopically and measurements made using transient radiation force elastography.<br />
Conclusions: Strain imaging using impulsive radiation force offers several advantages. The highly<br />
localised and transient strain that is produced by focused and impulsive radiation force may permit the<br />
sensing of changes in tissue elastic properties that are difficult to detect with conventional elastography,<br />
due to greater independence from boundary conditions and a resulting improved global contrast-to-noise<br />
ratio. For example, the characteristic, bi-directional, high strain artefacts due to stress concentration,<br />
often seen with static elastography at the tissue-inclusion interface, do not appear using the transient<br />
radiation force strain imaging technique. It is also possible to utilize a single pushing burst, strongly<br />
focused in two dimensions, that acts as a spatially localised impulse, and to use low frequencies to<br />
supply radiation force more efficiently to deeper tissues.<br />
Acknowledgements: This work was supported by funding from the UK Department of Health (NEAT D008).<br />
References:<br />
[1] Ophir J., Cespedes I., Ponnekanti H., Yazdi Y. and Li X. Elastography: a quantitative method for<br />
imaging the elasticity of biological tissues. Ultrason Imaging 1991 13(2):111-134.<br />
[2] Bercoff J., Tanter M. and Fink M. Supersonic shear imaging: A new technique for soft tissue<br />
elasticity mapping. IEEE Trans Ultrason Ferroelectr Freq Control 2004b 51(4):396-409.<br />
[3] Fatemi M. and Greenleaf J. F. An imaging modality based on ultrasound-stimulated acoustic<br />
emission. Proc Natl Acad Sci 1999 96:6603-6608.<br />
[4] Nightingale K. R., Bentley R. and Trahey G. Observations of tissue response to acoustic radiation<br />
force: opportunities for imaging. Ultrason Imaging 2002 24(3):129-138.<br />
[5] Lizzi F., Murator R., Deng C., Ketterling J., Alam S., Mikaelian S. and Kalisz A. Radiation-force<br />
technique to monitor lesion during ultrasonic therapy. Ultrasound Med Biol 2003 29(11):1593-1605.<br />
<br />
indicates Presenter<br />
101
080 COMPARATIVE ASSESSMENT OF SPECTRAL AND TEMPORAL BASED ADAPTIVE<br />
ELASTOGRAPHIC TECHNIQUES.<br />
K Hoyt 1,2 , F Forsberg 2 , CRB Merritt 2 , JB Liu 2 , J Ophir 3 .<br />
1 Drexel University, Philadelphia, PA, USA; 2 Thomas Jefferson University, Philadelphia, PA, USA;<br />
3 University of Texas Medical School, Houston, TX, USA.<br />
Aims: The objective of this study was to perform an in vivo comparative assessment of both spectral- and<br />
temporal-based adaptive elastographic techniques.<br />
Background: It has been established that due to tissue heterogeneity, adaptive elastographic techniques<br />
are better suited for describing strain distributions in vivo than their non-adaptive counterparts [1, 2].<br />
Currently, there are two disparate approaches to elastographic imaging, namely, spectral- (incoherent)<br />
and temporal-based (coherent). In general, strain estimators using spectral methods are more robust<br />
against decorrelation noise sources whereas those derived using temporal methods are more precise.<br />
Methods: Stiff hepatic lesions of varying size and depth were induced in swine [3]. A modified HDI 1000<br />
scanner (Philips Medical Systems, Bothell, WA, USA) with a 7.5 MHz linear array was used (either in<br />
automated or freehand mode), directly on the surgically exposed surface of the liver with respiration<br />
suspended. Following data acquisition, consecutive frames of digitized RF data were windowed (3.0 mm<br />
with 80% overlap) and subsequently, used to compute tissue strain using both adaptive spectral [2] and<br />
temporal [1] elastographic approaches. Lesions depicted in elastograms were circumscribed and area<br />
measurements were computed. A linear regression analysis was used for analyzing lesion measurements<br />
against varying doses at constant depth (and vice versa). Automated and freehand results were compared<br />
with t-tests. Elastography lesions sizes were compared to corresponding gross pathology. Lastly,<br />
comparison of adaptive spectral- and temporal-based elastographic lesion measurements was performed<br />
using a 2-sample t-test.<br />
Results: A difference was observed in measurement of lesions of varying size but located at constant<br />
depth (p < 0.015 and p < 0.001 for the spectral- and temporal-based elastographic results, respectively).<br />
Conversely, same-sized lesions imaged at varying depths resulted in no statistically significant difference<br />
when measured from the spectral elastograms (p > 0.318). Measurements performed on the same lesions<br />
depicted in the temporal elastograms yielded a significant difference (p = 0.04) for smaller sized lesions<br />
(0.5 ml ethanol injections corresponding to 29 mm2 lesions) located at constant depths, whereas no<br />
statistically significant difference (p = 0.729) was found for larger lesions located at constant depths.<br />
Hence, lesion depth does not appear to influence the corresponding spectral elastogram lesion sizes,<br />
whereas adaptive temporal elastography demonstrate a statistically significant difference for smaller-sized<br />
lesions. Analysis into the role of scanning technique (automated vs. freehand) concluded that neither the<br />
adaptive spectral nor temporal elastographic approaches yielded a statistically significant difference<br />
(p > 0.14). A regression analysis of lesion sizes depicted in both the spectral or temporal elastograms and<br />
the corresponding lesions in the pathology photographs found a statistically significant difference<br />
between the image sets (p < 0.001). A comparison of congruent adaptive spectral and temporal<br />
elastographic lesion measurements concluded that there was no statistically significant difference<br />
(p = 0.48) between (lesion) data sets.<br />
Conclusions: Results indicate that adaptive spectral elastography may be more suited for imaging small<br />
and deep sited lesions as compared to adaptive temporal elastographic techniques. This conclusion is<br />
predicated on the increased robustness demonstrated by spectral elastographic techniques; an important<br />
attribute for elastographic imaging of deep lesions due to the associated increased decorrelation effects.<br />
Acknowledgements: This work supported in part by National Institutes of Health (USA) Program Project<br />
Grant P01-CA64597.<br />
References:<br />
[1] Srinivasan S, Kallel F, Souchon R, Ophir J. An analysis of an adaptive strain estimation technique in<br />
elastography. Ultrasonic Imaging 24: 109-118, 2002.<br />
[2] Hoyt K, Forsberg F, Ophir J. Adaptive spectral strain estimation in elastography (abstract). J.<br />
Ultrasound Med. 23(6): Supplement, <strong>2005</strong>.<br />
[3] Hoyt K, Forsberg F, Merritt CRB, Liu JB, Ophir J. In vivo elastographic investigation of<br />
ethanol-induced hepatic lesions. Ultrasound Med. Biol. 31(5): 607-612, <strong>2005</strong>.<br />
<br />
indicates Presenter<br />
102
043 DISPLACEMENT OF A SOLID SPHERE IN A VISCOELASTIC MEDIUM IN RESPONSE TO AN<br />
ACOUSTIC RADIATION FORCE: THEORETICAL ANALYSIS AND EXPERIMENTAL VERIFICATION.<br />
Salavat R. Aglyamov 1 , Andrei B. Karpiouk 1 , Yurii A. Ilinskii 2 , Evgenia A. Zabolotskaya 2 ,<br />
Stanislav Y. Emelianov 1 .<br />
1 Department of Biomedical Engineering, University of Texas at Austin, Austin, TX 78712, USA;<br />
2 Applied Research Laboratories, The University of Texas at Austin, Austin, TX 78713, USA.<br />
Aims: The static displacement and transient motion of a small spherical object (e.g., gas bubble) in<br />
response to continuous or pulsed acoustic radiation force depends on the mechanical properties of the<br />
surrounding material. The overall goal of our program is to estimate the mechanical properties of the<br />
tissue based on the displacements of the gas bubble perturbed by radiation force. The goal of this study<br />
was to investigate the dynamic behavior of a rigid sphere in a viscoelastic medium.<br />
Background: Methods using acoustic radiation force have been developed to estimate the mechanical<br />
properties of tissue. In these approaches, the radiation force of focused ultrasound is used to induce<br />
motion in a small volume within the tissue. The magnitude of the radiation force and, therefore, the<br />
induced displacement depends primarily on the absorption and reflection of ultrasound. For soft tissues,<br />
the absorption has a dominant effect. However, if there is an acoustic inhomogeneity, such as a gas<br />
bubble, the reflection of ultrasound may play a more significant role. However, the response depends not<br />
only on the viscoelastic properties of the medium but also on the properties of the reflector. Since in<br />
many biomedical and clinical applications, the microbubbles are introduced in soft tissue, spherical<br />
reflectors are of particular interest. Using a previously developed theoretical model [1], we have performed<br />
theoretical, numerical and experimental studies to investigate the dynamic behavior of spherical objects<br />
surrounded by a viscoelastic medium.<br />
Methods: In theoretical analysis, the viscoelastic medium (Voigt model) was assumed to be isotropic,<br />
homogeneous, and incompressible. An impulse or finite duration acoustic radiation force was applied to<br />
spherical objects embedded in the medium. Equations describing the displacements of the object were<br />
derived using a frequency-domain formalism, and solved analytically or numerically. To verify our<br />
theoretical and numerical model, the experiments were performed using the rigid spheres of various<br />
diameters (0.3-3.0 mm) and densities embedded into gel-based phantoms of varying viscoelastic<br />
properties. The mechanical properties of the gels were estimated independently using load-displacement<br />
tests. A 1.5 MHz single-element focused transducer was used to apply the radiation force of desired<br />
duration (0.1-5.0 ms). Another single-element focused transducer operating at 25 MHz was used to track<br />
the displacements of the sphere every 50 s. The foci of both transducers were aligned at the position of<br />
the sphere, and the displacement of the sphere was measured for up to 40 ms.<br />
Results: The results of this study demonstrate good agreement between theoretical predictions and<br />
experimental measurements. For short pulses, both gas bubbles and solid spheres continue to move even<br />
after the applied force has ended. The delay between the application of radiation force and the displacement<br />
reaching the maximum depends strongly on the elasticity of the surrounding tissue, and the size and<br />
mass/density of the target. This time delay decreases with increased elasticity of the surrounding tissue,<br />
and, in contrast, increases for heavier (higher density) spheres. Maximum displacements are inversely<br />
proportional to the Young’s modulus of the surrounding material. There are no oscillatory displacements for<br />
the relatively light spheres, while the heavier spheres may exhibit a few decaying oscillations. Tissue<br />
viscosity dampens the oscillations and reduces the amplitude of the displacement.<br />
Conclusions: The developed theoretical model accurately predicts the displacement of the spherical<br />
acoustic inhomogeneity in tissue in response to the acoustical radiation force and can thus be used to<br />
evaluate mechanical properties of tissue.<br />
Acknowledgements: Support in part by National Institutes of Health under grants CA112784 and<br />
EB004047 is acknowledged.<br />
Reference:<br />
[1] Y.A. Ilinskii, G.D. Meegan, E.A. Zabolotskaya, S.Y. Emelianov (<strong>2005</strong>). "Gas bubble and solid sphere<br />
motion in elastic media in response to applied force," J. Acoust. Soc. Am. 117, 2338–2346.<br />
<br />
indicates Presenter<br />
103
050 ELASTOGRAPIC IMAGING OF UTERINE TISSUE.<br />
M. A. Hobson 1 , M. Z. Kiss 1 , H. Shi 1 , T. Varghese 1,2 , M. A. Kliewer 3 , J. A. Zagzebski 1 T. J. Hall 1 ,<br />
J. Harter 4 , E. M. Hartenbach 5 and E. L. Madsen 1 .<br />
1 Medical Physics, 2 Biomedical Engineering, 3 Radiology, 4 Pathology, 5 Obstetrics and Gynecology<br />
Departments, University of Wisconsin-Madison, 1300 University Avenue, 1530 MSC, Madison, WI<br />
53706, USA.<br />
Aims: Leiomyomas (fibroids) and adenomyosis, a condition in which soft endometrial tissue invades the<br />
myometrium of the uterus, have similar appearances on conventional ultrasound images. We are<br />
investigating whether elastography can aid in differentiation between these two conditions, since the<br />
clinical treatments for the two conditions are very different. In addition, clinical differentiation of<br />
endometrial cancer from other benign conditions is also of interest.<br />
Background: Uterine abnormalities tend to present clinically as dysfunctional uterine bleeding. Causes<br />
of irregular vaginal bleeding, especially in post-menopausal women, are often benign endometrial atrophy<br />
or hyperplasia (polyps, leiomyomas), although, approximately 10% to 30% of women will be found to have<br />
endometrial cancer. For pre-menopausal women, dysfunctional uterine bleeding most often results from<br />
benign conditions, such as leiomyomas, endometrial polyps, and adenomyosis. Currently MRI is the only<br />
imaging modality capable of distinguishing between these two conditions, leiomyomas and adenomyosis.<br />
Methods: Ultrasound elastography was performed on uteri removed via elective hysterectomies. A<br />
Siemens Antares with a VFX13-5 transducer was used to acquire radiofrequency data sets, which were<br />
post-processed using 2-D block matching and 1- and 2-D cross-correlation analysis to create<br />
elastograms. Manual freehand compression using the transducer as the displacement device and stepper<br />
motor controlled compressions using a rectangular plate were applied to the excised uterine tissue during<br />
the imaging procedures. Following elastographic imaging, rectangular tissue samples were excised from<br />
the cervix and the endometrium for dynamic testing on a Bose Enduratec ELF system.<br />
Results: Excised uteri from 15 patients have been evaluated. In 8 patients with uterine fibroids, masses<br />
identified by the pathologist appeared darker (were stiffer) than the surrounding uterine muscle, In some<br />
cases, there is evidence of a softer tissue surrounding the mass, enabling it to be seen more clearly.<br />
Elastograms provide more complete visualization of the mass than B-mode images.<br />
Conclusions: In vitro results support the idea that elastography can play a role in diagnosing the source<br />
of postmenopausal bleeding. Fibroids appear stiffer than surrounding muscle tissue; at this time<br />
elastographic features of uterine tissue when a diagnosis of adenomyosis has been made are not clear.<br />
Strategies for performing in vivo elastography have also been developed. Uterine elastography may provide<br />
physicians an alternative to MRI.<br />
<br />
indicates Presenter<br />
104
Session PTO: Phantoms and Test Objects<br />
Tuesday, October 18 4:00P – 4:45P<br />
045 PVA PROSTATE PHANTOM FOR ULTRASOUND AND MR ELASTOGRAPHY.<br />
Walaa Khaled 1 , Thosten Neumann 1 , Joerg Stapf 1 , and Helmut Ermert 1 .<br />
1 Institute of High Frequency Engineering, Ruhr-University, Bochum, GERMANY.<br />
Aims: The real time ultrasound elastography system presented in [1] allows the use of elastography in a<br />
clinical study for the early detection of prostate cancer during conventional transrectal ultrasound<br />
examinations. Since tumors often consist of hard tissue structures, imaging the elastic properties<br />
promises to increase the ability to detect prostate cancer. However, in transrectal elastography, the<br />
compression is manually induced by the conducting physician, which is operator dependent and leads to<br />
unstable image sequences. In this paper, we present a newly designed phantom to help physicians adapt<br />
to our real time elastography system.<br />
Background: Tissue mimicking phantoms used for elastographic experiments are made mostly from a<br />
mixture of agar and gelatin. The solution of agar and gelatin has effectively revealed interesting<br />
properties, since gelatin contributes to the elastic character and agar insures stiffness and cohesion [2].<br />
As for the acoustical scattering of such phantoms, it can be adjusted by simply varying the scatterer<br />
concentration. The independent control of acoustical and mechanical properties of such phantoms made<br />
agar gelatin phantoms attractive for elastographic experiments. However, the disadvantages are the<br />
long-term change in geometric and physical properties, and that agar-gelatin phantoms tend to rupture<br />
easily under increasing radial stress.<br />
Methods: For testing the prostate diagnostic using ultrasound elastography and a rectal probe these<br />
phantoms could not simulate the ruggedness and elasticity of the rectal wall. For those reasons, a new<br />
material has been tested for this specific application purpose, which has a high breaking strength and is<br />
able to emulate the prostate along with structures simulating the rectal wall and the urethra. This<br />
material is Poly-Vinyl Alcohol. As a cryogel, it acquires its properties by freeze-thaw cycle processes.<br />
Chu et al. [3] have studied this material and found that the acoustical and elastic characteristics of the<br />
PVA cryogel are within the range of those of soft tissues. Therefore, for the production of<br />
anthropomorphic prostate phantoms with variable realistic elastic, ultrasound and MR properties, we<br />
need a set of materials to represent fat, glandular and the perineal membrane. These materials consist of<br />
ethyl alcohol in Polyvinyl alcohol with TLC Silica gel 60 H dispersions with different concentrations.<br />
Production of molds for making phantoms with geometries suitable for current US and MR prostate<br />
elastography with internal structures was achieved including simulated tumors. Some niceties in<br />
mechanical properties, like the seminal vesicles, will also be simulated in the phantoms.<br />
Results and Conclusion: The variation of the elastic modulus according to thaw and freeze cycles was<br />
quantified. Preliminary results established a range of 30± 5.2 kPa – 90.2± 15 kPa for 2-5 freeze-thaw<br />
cycles and 7.5% to 10% solution concentration. Different studies of the Young’s moduli, the US speeds,<br />
US attenuation coefficient, MR T 1 ’s and T 2 ’s are being calculated. The results show that the stress-strain<br />
relationship of PVA-phantoms is close to that of a pig tissue, and that the US propagation speed is in the<br />
range of (1500m/s -1600m/s). The attenuation values are also promising at 10 MHz.<br />
Scheme of the PVA Prostate Phantom Images of the Phantom and Results Using US-elastography<br />
Acknowledgements: A project of the Ruhr Center of Excellence for Medical Engineering (KMR). Supported by the<br />
German Federal Ministry of Education and Research, No. 01 IR A 14 B.<br />
References:<br />
[1] Pesavento A, Lorenz A, Ermert H (1999): System for real-time elastography, Electronics Letters, Volume 35, 11, 941-942.<br />
[2] Hall T.J:, Bilgen M., Insana M.F., and Krouskop T.A., Phantom materials for elastography IEEE transactions<br />
UFFC 1997, Vol. 44, no. 6, pp. 1355-1364.<br />
[3] Chu K. C. and Rutt B. K., Polyvinyl Alcohol Cryogel: An Ideal Phantom Material for MR studies of Arterial Flow<br />
and Elasticity, Magnetic Resonance in Medicine, 1997, Vol. 37, no.2, pp. 314-319.<br />
<br />
indicates Presenter<br />
105
046 A NOVEL 3D HAPTIC SENSOR SYSTEM BASED ON ULTRASOUND ELASTOGRAPHY.<br />
Walaa Khaled 1 , Stefan Reichling 2 , Otto T. Bruhns 2 , Andreas Lorenz 3 , Andreas Pesavento 3 , Helmut Ermert 1 .<br />
1 Institute of High Frequency Engineering, 2 Institute of Mechanics, Ruhr-University, Bochum, GERMANY;<br />
3 LP-IT Innovative Technologies GmbH, Bochum, GERMANY.<br />
Aims: A standard screening procedure for the detection of breast, thyroid, prostate, and liver abnormalities<br />
is palpation. The pathological state of soft tissues is often correlated with changes in stiffness; however,<br />
current medical practice routinely uses sophisticated diagnostic tests through magnetic resonance,<br />
computed tomography and ultrasound imaging, which cannot provide direct measure of tissue elasticity.<br />
Background: Last year, we presented the concept and first results of the haptic sensor actuator system to<br />
visualize mechanical properties of tissue using ultrasonic elastography and electrorheological fluids. Using<br />
this system, we reconstruct tissue properties from a real time ultrasound elastography system on a<br />
controllable haptic display capable of emulating and differentiating normal and abnormal biological tissue.<br />
Methods: Firstly, during the solution of the mechanical forward problem, the biological tissue was<br />
modeled as a linear, isotropic, incompressible, elastic medium and a 2-D plane strain state model was<br />
used. Furthermore, to develop an inverse elastography reconstruction procedure, finite element<br />
simulations were performed for a number of biological tissue object models. The results obtained from<br />
finite element analysis were confirmed in the ultrasonic experiments on a set of tissue-like phantoms<br />
with known acoustical and mechanical properties. These phantoms were produced using PVA-Materials<br />
with different thaw and freeze cycles so that the relative Young’s modulus E2/E1 of the inclusions (E2)<br />
with the surrounding medium (E1) as a reference is nearly 3 (E1= 30±5kPa, E2=90±15kPa). The RF-data<br />
was acquired using a standard ultrasound system (SONOLINE Omnia, Siemens AG, Germany) equipped<br />
with a 9 MHz linear array probe and a conventional ADC at a sampling frequency of 50 MHz. The axial<br />
displacements were calculated using the fast root-seeking technique [1]. Secondly, we deduce the relative<br />
Young’s modulus of the sample by solving the inverse problem using two different methods. The first<br />
method is a modified direct method based on solving the equations of equilibrium proposed by [2] and<br />
modified by the authors. The second method is an iterative method for solving the inverse elasticity<br />
problem and is based on recasting the problem as a non-linear optimization problem.<br />
Results and Conclusion: The results of an ongoing clinical study on the prostate tumor diagnostic with<br />
more than 200 patients show that our real time ultrasound elastography system is able to differentiate<br />
hard lumps from soft tissue in a qualitative manner. The data collected with our real time elastography<br />
system were also used in the reconstruction approaches which seem promising for an additional<br />
quantitative differential diagnosis of lesions in biological tissue. The phantom results show that the<br />
iterative approach leads to a relative Young’s modulus ratio of about 1.9 (E2~ 57kPa for the inclusion),<br />
whereas the direct method results in a ratio of 1.32 (E2~ 40kPa). The feasibility of both methods was also<br />
demonstrated using the measured real time ultrasound data from a tissue-like phantom with multiple<br />
inclusions and in vitro data. The proposed methods were compared with respect to the stability of<br />
algorithms using numerical simulations and ultrasound measurements. Based on this comparison, an<br />
approach is introduced, which is capable of taking into account large deformations, whereas other<br />
existing methods are generally based on the theory of linear elasticity. The images below show the relative<br />
Young’s modulus in an US experiment and in an FE simulation with noisy input data.<br />
Experiment Scheme Measured Relative E-Modulus US Experiment Simulation Results (Relative E-Modulus) with Noisy Input Data<br />
Acknowledgements: A project of the Ruhr Center of Excellence for Medical Engineering (Kompetenzzentrum Medizintechnik<br />
Ruhr (KMR), Bochum). Supported by the German Federal Ministry of Education and Research, (BMBF) No. 01 IR A 14 B.<br />
References:<br />
[1] Pesavento A, Lorenz A, Ermert H (1999): System for real-time elastography, Electronics Letters, Volume 35, 11, 941-942.<br />
[2] Sumi et. al., IEEE Trans. BME, Vol. 42, 1995, p.193-202.<br />
<br />
indicates Presenter<br />
106
048 TISSUE MIMICKING MATERIALS AND PHANTOMS FOR ELASTICITY IMAGING.<br />
John Beck 1 , Shriram Sethuraman 1 , Srivalleesha Mallidi 1 , Andrei B. Karpiouk 1 ,<br />
Salavat R. Aglyamov 1 , Stanislav Y. Emelianov 1 .<br />
1 Department of Biomedical Engineering, The University of Texas at Austin, Austin, TX 78712, USA.<br />
Aims: To identify the materials and to develop the procedures for fabrication of sophisticated, durable<br />
and time-stable tissue mimicking phantoms of known properties for ultrasound elasticity imaging.<br />
Background: Ultrasound elasticity imaging techniques are being developed and improved upon for the<br />
use in various biomedical applications. In order to aid in the development of these techniques, it is<br />
necessary to produce phantoms which can reliably mimic the properties of human tissue. Before these<br />
phantoms can be produced, however, it is also necessary to investigate and to be able to precisely<br />
manipulate the properties of the phantom materials. In addition, the properties of the materials must be<br />
stable over time, and the phantoms should be easy to produce and have a long shelf-life.<br />
In ultrasound elasticity imaging, the most notable properties of the phantom material are the acoustic<br />
and mechanical characteristics. Several materials including gelatin, polyacrylamide gel, plastisol, poly<br />
(vinyl alcohol), silicone rubber, etc. have been successfully used to produce tissue phantoms as reported<br />
in literature. In this paper, we focus our attention on poly (vinyl alcohol) (PVA) hydrogels because of<br />
several unique properties of this material. First, a rich set of parameters (molecular weight and<br />
concentration of PVA, number of freeze/thaw cycles, concentration of crosslinking additives, etc.) allows<br />
producing hydrated gels of high water content and variable elasticity (Young’s modulus). Second, the<br />
fabricated hydrogels are easy to produce, nontoxic, stable, durable and have a reasonable shelf-life.<br />
Finally, PVA hydrogels can be used in optical, X-ray, ultrasound and NMR (MRI) imaging making these<br />
hydrogels attractive for studies of multi-modality imaging techniques.<br />
Methods: Aqueous solutions of PVA were prepared by dissolving crystalline granules of PVA in water at<br />
96C. Once the granules were totally dissolved, the resulting solution was cooled to room temperature<br />
and cast into a container of desired shape and size. If left at room temperature, the PVA solution will not<br />
crosslink and will remain a liquid. Among mechanical (freeze/thaw cycles), chemical (addition of<br />
crosslinking or bonding compounds) and irradiation (e.g., UV light) methods to crosslink PVA solution,<br />
freeze/thaw cycles were used exclusively in our experiments. Each cycle consisted of freezing the aqueous<br />
solution for 17 hours at 10°C followed by thawing of the sample in water for 7 hours at 25°C. The effect of<br />
cycling on polymer strength and the overall stability of mechanical properties of PVA was measured using<br />
cylindrical samples subjected to uniaxial load-displacement test. The mechanical properties of hydrogels<br />
were also altered using varying (4–10% by weight) concentration of PVA. In all samples, the ultrasound<br />
pulse-echo measurements of attenuation and speed of sound were performed to investigate the effect of<br />
PVA concentration and number of freeze/thaw cycles on the acoustic properties of the material. Finally,<br />
the mass and volume of each sample were also monitored over time.<br />
To produce composite phantoms for elasticity imaging (i.e., layered phantom or phantom with an<br />
inclusion), the mechanical structures were contrasted using different number of freeze/thaw cycles.<br />
These structures were adhered to each other due to the interpenetration of polymer chains. For<br />
ultrasound imaging purposes, the silica particles (0.4-2%) were added to act as ultrasonic scatterers.<br />
Results: The attenuation and the speed of sound in PVA hydrogels was measured to be 0.2 dB/cm/MHz<br />
(or less) and 1530 m/s, respectively, and did not change appreciably with freeze/thaw cycles or PVA<br />
concentration. The mechanical strength of hydrogels was shown to be almost linearly proportional to the<br />
PVA concentration. Increasing the number of freeze/thaw cycles increases nonlinearly the mechanical<br />
strength of PVA hydrogels. The PVA gels maintained their size, shape, and acoustic and mechanical<br />
properties when stored in water at room temperature. The ultrasound and elasticity imaging experiments<br />
confirmed that composite PVA-based phantoms maintained their integrity and acoustic/mechanical<br />
properties since they were fabricated.<br />
Conclusions: The results of this study clearly demonstrate that poly (vinyl alcohol) can be used to<br />
produce complex tissue mimicking phantoms with desired acoustic and mechanical properties. The<br />
number of freezing and thawing cycles and concentration of aqueous solution of different molecular<br />
weight PVA can be manipulated to control properties such as the overall water content and mechanical<br />
strength while acoustic properties remain nearly the same. Using PVA, time stable and sturdy composite<br />
phantoms with distinct mechanical structures well adhered to each other were produced.<br />
Acknowledgements: This research was supported in part by seed grant from The University of Texas Center for<br />
Biomedical Engineering.<br />
<br />
indicates Presenter<br />
107
Session INS: Instrumentation<br />
Tuesday, October 18 4:45P – 5:30P<br />
035 DEVELOPMENT OF AN IN VIVO TISSUE INDENTATION SYSTEM USING AN<br />
ELECTROMAGNETIC SPATIAL LOCATING SENSOR.<br />
Yongping Zheng 1 , Minhua Lu 1 , Qinghua Huang 1 , Winnie Yu 1 , Grace H.Y. Lo 1 .<br />
1 The Hong Kong Polytechnic University, Hong Kong, CHINA.<br />
Aims: Indentation tests have been widely used for the assessment of soft tissue stiffness in vivo. Its<br />
operation resembles the manual palpation using fingers. We have previously developed an ultrasound<br />
indentation system with a pen-size ultrasound palpation probe [1]. It has been successfully applied for<br />
the assessment of many different soft tissues in vivo. However, it requires that the tissue should have a<br />
bony substrate to reflect ultrasound echoes. The aim of this study is to develop an indentation system<br />
using an electromagnetic spatial locating sensor for the assessment of tissues without body substrate.<br />
Background: Quantitative assessment of tissue elasticity in vivo is becoming more important recently.<br />
The traditional tissue assessment approach using finger palpation is subjective and qualitative.<br />
A number of tissue elasticity measurement devices have been developed to provide objective and<br />
quantitative assessment. The essential techniques involved are the approaches to measure the tissue<br />
deformation and applied load. Hand-held indentation probes are preferred, as they provide more flexible<br />
assessment for tissues at various locations.<br />
Methods: In this study, we used an electromagnetic spatial locating sensor to measure the tissue<br />
deformation. The dimension of the spatial sensor is approximately 5x5x15 mm 3 . Therefore, it can be<br />
attached to a small indentation probe. The applied load is sensed by a strain gauge load cell. A pen-size<br />
palpation probe was constructed with the spatial sensor and the load cell. The Young’s modulus was<br />
extracted from the load-indentation relationship using the equation provided by Hayes et al. [2] and<br />
assuming that the thickness is large enough. A series of elastomers with different Young’s modulus<br />
(ranging from 13.1 to 36.2 kPa) were assessed with both the hand-held indentation system and a<br />
Hounsfield material testing machine. Intra- and inter-operator repeatability of the measurement was<br />
tested with five operators. The hand-held indentation system was used to measure the effective Young’s<br />
modulus of the tissues located in the abdominal region in vivo. Twenty healthy female subjects with age<br />
of 21.1 ± 1.8 years old were recruited for the test.<br />
Results: The system was shown to be highly accurate (R 2 = 0.99) and had good reliability (intra-operator<br />
variation = 5.43%, inter-operator variation = 5.99%). The mean effective Young’s moduli of the soft tissues<br />
surrounding the umbilicus region were approximately 12 kPa.<br />
Conclusions: The indentation system based on the electromagnetic spatial sensor is a highly reliable and<br />
accurate for the measurement of the tissue stiffness in vivo. The system is portable, and the probe is easy<br />
to operate. It is particularly suitable for the assessment of those body parts with thick soft tissues, such<br />
as breast, waist, abdomen, hip and thigh regions. For the body parts with thin soft tissues covering bony<br />
substrates, the tissue thickness plays an important role in extracting the modulus from the<br />
load-indentation relationship and should be measured. The ultrasound indentation may play a<br />
complementary role, as it is particularly useful for the tissues with bony substrate. In addition, one<br />
should be careful that metal objects are avoided near the electromagnetic transmitter or sensor during<br />
the measurement.<br />
Acknowledgements: This work was partially supported by the Research Grants Council of Hong Kong<br />
(PolyU 5245/03E) and The Hong Kong Polytechnic University.<br />
References:<br />
[1] Zheng YP and Mak AFT. An Ultrasound Indentation System for Biomechanical Properties Assessment<br />
of Soft Tissues In-Vivo. IEEE Trans. Biomed. Eng., 1996; 43: 912-918.<br />
[2] Hayes WC, Keer LM, Herrmann G and Mockros LF. A mathematical analysis for indentation tests of<br />
articular cartilage, J. Biomech., 1972; 5: 541-551.<br />
<br />
indicates Presenter<br />
108
036 DEVELOPMENT OF A SOFTWARE PLATFORM FOR ULTRASOUND MEASUREMENT OF<br />
MOTION AND ELASTICITY (UMME).<br />
Yongping Zheng 1 , Jun Shi 1 , Qinghua Huang 1 and Xin Chen 1 .<br />
1 The Hong Kong Polytechnic University, Hong Kong, CHINA.<br />
Aims: Various techniques have been developed by different research groups for ultrasound measurement<br />
and imaging of tissue elasticity. Each group uses their own software for the data collection, processing<br />
and displaying results. The aim of this project is to develop a software platform which integrates the data<br />
collection, processing and displaying results within the same interface and can handle different modes of<br />
ultrasound tissue elasticity measurement and imaging.<br />
Background: Because of the lack of an available software platform, researchers need to develop their own<br />
programs using many different computer languages to acquire ultrasound signals or images, to process<br />
the data using various algorithms to extract the motion and elasticity of tissues and, finally, to display<br />
the results. It can be imagined that all the groups are using different software interfaces and different<br />
data structures. Even within the same group, different investigators may use different custom designed<br />
software to solve different problems related to ultrasound elasticity imaging and measurement.<br />
Methods: We have developed a software platform, which is designed for multiple purposes to handle<br />
various problems related to ultrasound measurement of motion and elasticity (UMME) of tissues. UMME<br />
is programmed in Visual C++ and can perform ultrasound signal and image collection from A/D and<br />
video capture cards, data processing using various algorithms in both 1D and 2D, and result display.<br />
Results: UMME has successfully served as a platform for our techniques of ultrasound elasticity imaging<br />
and measurement including ultrasound indentation [1], ultrasound elastomiscroscopy [2, 3], water jet<br />
ultrasound indentation [4], ultrasound monitoring of osmosis swelling [5] and sonomyography [6].<br />
Figure 1 shows two typical interfaces. A data structure has been designed for different applications. The<br />
software can collect data from A/D and video capturing cards supplied by different companies. The<br />
ultrasound signals and images can be simultaneously collected with other variables including force,<br />
pressure, angle, vibration, electromyography (EMG), electrocardiography (ECG), etc.<br />
Conclusions: It is feasible to use UMME for different modes of ultrasound measurement of tissue motion<br />
and elasticity. We expect that other groups may also benefit from this UMME software interface through<br />
collaboration. The investigators may focus more on the new problems and algorithms.<br />
Acknowledgements: This project is supported by HK RGC (PolyU5245/03E and PolyU 5199/02E).<br />
References:<br />
[1] Zheng YP, Mak AFT. Ultrasound indentation. IEEE Trans Biomed Eng 43: 912-918, 1996.<br />
[2] Zheng YP, et al. 1D ultrasound elastomicroscopy. Phys Med Biol 47: 3165-3180, 2002.<br />
[3] Zheng YP, et al. 2D ultrasound elastomicroscopy. Phys Med Biol. 49: 3925-3938, 2004<br />
[4] Lu MH, et al. Water jet ultrasound indentation. Ultrasound Med Biol 31: 817-26, <strong>2005</strong>.<br />
[5] Zheng YP, et al. Ultrasound monitoring of cartilage swelling. Ultrasound Med Biol 30: 841-89, 2004.<br />
[6] Zheng YP, et al. Sonomyography. Med Eng Phys. In print, <strong>2005</strong>.<br />
Displacements<br />
B-mode<br />
M-mode<br />
Displacements<br />
A-mode<br />
A-mode<br />
Parameters<br />
(a) Applied Force<br />
Figure 1: Different Interfaces of UMME. (a) 2D Ultrasound Elastomicroscopy; (b) Ultrasound Indentation<br />
(b)<br />
<br />
indicates Presenter<br />
109
084 MEASURING STIFFNESS OF BREAST TISSUE EX-VIVO.<br />
Asif Iqbal 1 , Tim Frank 1 , Donald McLean 1 , Alastair Thompson 1 , Alfred Cuschieri 1 .<br />
1 Surgery Technology Group, Division of Surgery and Oncology, Ninewells Hospital and Medical<br />
School, University of Dundee, Dundee, DD1 9SY, Scotland, UK.<br />
Aims: Breast tumors are known to be harder than normal tissue with palpation. Palpation produces a<br />
subjective assessment and, therefore, requires substantial clinical experience. In addition, the qualitative<br />
nature of such assessments makes the accumulation of knowledge difficult and imprecise learning. In<br />
this study, we present tissue stiffness measurement using a palpating probe.<br />
Background: Quantification of tissue stiffness can be done by various mechanical material testing<br />
methods. However, indentation testing is probably the non-invasive technique for determining the in-vivo<br />
and ex-vivo mechanical behavior of tissues.<br />
Methods: After obtaining ethical clearance and patient permission, we examined fresh mastectomy<br />
specimens containing large cancers, excised breast tumors from patients undergoing breast conservation<br />
treatment and excised benign lesions before fixation. A hand-held indenter’s tip was pressed against the<br />
tissue to measure the displacement relative to a cylindrical ring surrounding it. The inner and outer<br />
diameters of the ring were 11.5 and 17.5mm, respectively, while the indenting tip was 4.0mm. The probe<br />
was comprised of a force transducer and a linear variable displacement transducer.<br />
Results: The force-displacement measurement curves on samples of invasive ductal carcinoma,<br />
fibroadenoma, medullary carcinoma, fibrocystic breast disease, lobular carcinoma and mucinous<br />
carcinoma were plotted in Figure 1. The results indicate not only that the stiffness of benign tissue is<br />
different than that of malignant tissue, but also show significant variation in the stiffness of several<br />
malignant tumors. Contrary to clinical palpation, the suppleness of mucinous carcinoma is very different<br />
than invasive ductal carcinoma.<br />
Conclusions: There is demonstrable difference in stiffness of various tumors. This instrument<br />
demonstrates the ability of the system to acquire the desired data. Analysis of the results of our initial<br />
experiments will be used to make several preliminary observations regarding the characteristics of our<br />
measurement system. Our next goal is to develop a detailed look-up table for various tumors at different<br />
stages of growth for a clinical assessment system to correlate with corresponding elastographic images.<br />
Such a diagnostic test would be particularly useful for breast cancer screening.<br />
Acknowledgements: This work is financially supported by the Melville Trust for Care and Cure of<br />
Cancer, Tayside University Hospitals Trust (TUHT) and Anonymous Trust grants.<br />
5<br />
4.5<br />
4<br />
3.5<br />
T1 T2 T3 T4 T5<br />
Figure 1: Force-Displacement Curves for Seven Tissue<br />
Samples: High Grade Invasive Ductal<br />
Carcinoma (T1); Intermediate Grade Invasive<br />
Ductal Carcinoma (T2); Fibroadenoma (T3);<br />
Fibrocystic Breast Disease (T4); Lobular<br />
Carcinoma (T5); Medullary Carcinoma (T6);<br />
Mucinous Carcinoma (T7).<br />
3<br />
force (N)<br />
2.5<br />
2<br />
1.5<br />
T6<br />
1<br />
0.5<br />
T7<br />
0<br />
0 0.5 1 1.5 2 2.5 3 3.5 4 4.5 5<br />
displacement (mm)<br />
Figure 2: Demonstration of the Indentation Test Using<br />
the Hand-Held Probe on a Fresh Breast<br />
Tissue Sample.<br />
<br />
indicates Presenter<br />
110
Session SIP-2: Signal and Image Processing – II<br />
Wednesday, October 19 8:00A – 9:00A<br />
098 2D STRAIN ESTIMATION BASED ON A NEWTON CONSTRAINED MINIMIZATION STRATEGY:<br />
APPLICATION TO EXPERIMENTAL DATA.<br />
E Brusseau 1 , JF Déprez 1 , G Said 1 , O Basset 1 .<br />
1 CREATIS UMR CNRS 5515 INSERM U630, Lyon, FRANCE.<br />
Aims: The aim of this study is the development of an accurate 2D strain estimation technique.<br />
Background: Strain estimation is a crucial step in ultrasound elastography since strain fields are directly<br />
used for medium interpretation or for reconstruction of mechanical parameters. Thus, it is essential to<br />
estimate strains with high accuracy, by considering the 3D tissue motion induced by the physical<br />
compression. Because acquired data are 2D ultrasound RF images, we propose beginning with the<br />
investigation of a 2D strain estimation numerical model. So far, only a few 2D techniques have been reported.<br />
Methods: Recently, we have developed an initial 2D strain estimator [1] that is now improved by the<br />
introduction of a Newton constrained minimization strategy. For each 2D RF region, R1, selected in the<br />
pre-compression image, (I1), the principle consists in finding its corresponding version, R2, in the<br />
post-compression image, (I2), and in estimating its 2D strain. In the axial direction, R2 is supposed to be a<br />
time-delayed and scaled replica of R1. The delay, tax, is induced by the accumulation of axial deformations<br />
of the regions located between the probe and the region of interest. In the lateral direction, only shifts are<br />
considered due to the poor resolution. Locally, after having compensated for tax, the axial scaling factor,<br />
α, and the lateral shift, u, are estimated as the arguments that minimize an objective function, f, defined<br />
as the opposite of the correlation coefficient between R1 and R2 compensated for α and u.<br />
Technique efficiency, and therefore, results accuracy are directly related to the objective function shape,<br />
and f may suffer from multiple local minima unless strong constraints are introduced on the variable<br />
bounds, defining the admissible domain. The chosen technique is a constrained descent method, that<br />
generates a sequence of admissible iterates, until satisfying the Kuhn-Tucker conditions. The descent<br />
direction is computed, at each major iteration, by considering the associated quadratic problem. It is<br />
calculated as the projection of the Newton direction onto the admissible domain. The descent step is<br />
varied to insure fast convergence.<br />
Results: The developed technique has been assessed with simulated and experimental data. Two<br />
simulated media were created. The first was a 3-layer medium whose middle layer, with Young’s modulus<br />
(YM) of 50kPa, is twice as soft as the top and bottom layers. The second was a homogeneous cube<br />
(YM = 50kPa) with an embedded a harder cylindrical inclusion (YM = 100kPa). Media deformation was<br />
computed with FEM software, and corresponding RF ultrasound images were generated with the FIELD II<br />
program. The resulting elastograms demonstrate that, in the axial direction, estimated displacement and<br />
strain fields are very close to the theoretical ones. In the lateral direction, they are in accordance with the<br />
theory, but noisier, due to the poor resolution. Moreover, as the objective function is based on the<br />
correlation coefficient between a 2D initial region and its compensated deformed version, this one has<br />
been estimated to an average of 0.96. Results have also been obtained with tissue mimicking phantoms.<br />
One is a parallelepiped containing a harder cylindrical inclusion, both made of cryogel. This phantom has<br />
been subjected to a 3% global deformation. Data were acquired with a 7 MHz central frequency probe and<br />
with a 50 MHz sampling frequency. Estimated axial displacement and strain fields are of very good<br />
quality with a mean strain of 3.05%, corroborating the experimental conditions. The lateral displacement<br />
is noisier, but its significant amplitude demonstrates the necessity of not ignoring it. Finally, the mean<br />
correlation coefficient is, in this experimental case, close to 0.9.<br />
Conclusions: The proposed technique is robust in regard to the signal decorrelation induced by the<br />
lateral motion, resulting in more accurate displacement and strain fields. Future work will deal with<br />
in vitro and in vivo experiments.<br />
Acknowledgements: This work has been financially supported by the scientific committee of the INSA-Lyon, France.<br />
References:<br />
[1] E. Brusseau, G. Said, J. Fromageau, O. Basset, D. Vray, 2D Strain estimation algorithm – Initial Results, 3rd<br />
Int. Conf. on the Ultrasound Measurement and Imaging of Tissue Elasticity, Windermere, Cumbria, United<br />
Kingdom, October 17-20, 2004.<br />
<br />
indicates Presenter<br />
111
083 STRAIN ESTIMATION WITH PULSE SHAPING.<br />
R Souchon 1 , S Vassant 1 , J-C Béra 1 , J-Y Chapelon 1 .<br />
1 INSERM UMR 556, Lyon, FRANCE.<br />
Aims: Pulse shaping [1] can theoretically fully restore signal correlation. It consists in compressing the<br />
post-compression point spread function (PSF), p 2 , by a scaling factor in the time domain:<br />
p 2 (t) = p 1 (t), Equation (1)<br />
where p 1 is the pre-compression PSF, and t denotes time. Global stretching [2] by a factor 1/ is then<br />
applied to the received echo signal prior to time delay estimation. For optimal performance, the scaling<br />
factor, is matched to the tissue strain, by the relation:<br />
= (1+) -1 Equation (2)<br />
We investigated the potential of pulse shaping to increase the signal-to-noise ratio (SNRe) in simulated elastograms.<br />
Background: In ultrasonic elastography the precision of strain estimates improves with the correlation<br />
between the pre- and post-compression echo segments. Unfortunately, the strain to be measured induces<br />
signal decorrelation that cannot be fully compensated, even when using adaptive stretching.<br />
Methods: We compared the SNRe obtained with and without pulse shaping in 1D simulations of a<br />
homogeneous phantom. Simulated RF lines, s, were generated by convolving the one-dimensional PSF, p,<br />
with the scattering function, m, of the material (a normal distribution of scatterer amplitudes uniformly<br />
distributed). The PSF, p, was calculated by convolving the excitation voltage waveform, u, by the<br />
return-trip impulse response, h, of the transducer. A Gaussian impulse response of central frequency, f c ,<br />
and bandwidth, B, was assumed. The process is summarized by Equation (3), where z denotes the<br />
distance to the transducer, c, the speed of sound, and * is the convolution product :<br />
s(t) = u(t) * h(t) * m( t = 2z/c ) Equation (3)<br />
For pulse shaping, the pre-compression excitation waveform, u 1 , was calculated using Equation (1),<br />
yielding: u 1 (t) * h(t) = u 2 (t) * h(t). Note that the impulse response, h(t), must be known to calculate u 1 .<br />
All elastograms were calculated from the gradient of the time delay estimates, using uniform stretching.<br />
SNRe was estimated from the mean to standard deviation ratio of strain estimates.<br />
Results: Figure 1 shows SNRe vs. strain with and without pulse shaping for f c =6.5 MHz and B/f c =60%.<br />
Figure 2 shows what happens for =5% in case of an error in the estimate of the bandwidth of the<br />
impulse response: SNRe is maximal when the bandwidth of the impulse response, h(t), is properly<br />
estimated, but pulse shaping still performs well if fractional bandwidth is only known with ±20%<br />
accuracy. Figure 3 shows what happens when the strain estimate, is not exactly equal to tissue strain,<br />
0 : pulse shaping performs significantly better than stretching alone only within a small range around 0 .<br />
Conclusions: Pulse shaping can significantly improve the SNRe, provided that the scaling factor is<br />
accurately chosen and that other causes of decorrelation (SNRs, out of beam motion) are minimized. In<br />
practice, it may be necessary to repeat acquisitions while adaptively updating the scaling factor.<br />
SNRe<br />
4500<br />
4000<br />
3500<br />
3000<br />
2500<br />
2000<br />
1500<br />
1000<br />
500<br />
0<br />
With PS<br />
Without PS<br />
0 5 10 15 20 25 30<br />
Strain (%)<br />
Figure 1: SNRe vs strain with and<br />
without pulse shaping (PS)<br />
900<br />
800<br />
700<br />
600<br />
500<br />
400<br />
300<br />
200<br />
100<br />
020 30 40 50 60 70 80 90 100<br />
Estimated bandwidth B/f c (%)<br />
Figure 2: Effect on SNRe of an error in<br />
transducer bandwidth estimate B<br />
SNRe<br />
With PS<br />
Without PS<br />
SNRe<br />
1000<br />
900<br />
800<br />
With PS<br />
Without PS<br />
700<br />
600<br />
500<br />
400<br />
300<br />
200<br />
100<br />
0-6.5 -6 -5.5 -5 -4.5 -4 -3.5<br />
Estimated strain<br />
Figure 3: Effect on SNRe of an error in<br />
strain estimate (true strain 0=5%)<br />
Acknowledgements: This project is supported in part by the National Cancer Institute (NCI) Program Project Grant<br />
no. P01-CA64957 to the University of Texas Medical School.<br />
References:<br />
[1] Bilgen M, Insana MF. Deformation models and correlation analysis in elastography. J Acoust Soc Am 99 (5), 3212-3224 (1996)<br />
[2] Varghese T, Ophir J. Enhancement of echo-signal correlation in elastography using temporal stretching. IEEE<br />
Trans Ultrason Ferroelectr Freq Control 44(1), 173-180 (1997)<br />
<br />
indicates Presenter<br />
112
100 SIGNAL-TO-NOISE RATIO UPPER-BOUND IN SHEAR STRAIN ELASTOGRAMS .<br />
A Thitai Kumar 1,2 , J Ophir 1,2 , TA Krouskop 1,3 .<br />
1 The University of Texas Medical School, Houston, TX, USA; 2 University of Houston, Houston, TX,<br />
USA; 3 Baylor College of Medicine, Houston, TX, USA.<br />
Introduction: There is only a minimal body of literature relating to images of the shear strains in soft<br />
tissues and soft tissue-like materials [1]. The shear strain induced upon the application of axial<br />
compression to an inhomogeneous system depends in part on the nature of the bonding between tissue<br />
components and their orientation with respect to the axis of normal compression. Therefore, shear strain<br />
elastograms (SSE) may provide additional information about the nature of the bonding between tissue<br />
components of interest that is not available in current normal strain elastograms. In order to understand<br />
the limitations of the SSE, we developed a theoretical upper bound on the signal-to-noise ratio (SNR sse )<br />
and verified it using simulations and experiments.<br />
Methods: Shear strain is estimated elastographically as shown in Equation (1) below.<br />
ˆ =<br />
i, j<br />
lim<br />
b0,<br />
t<br />
0<br />
a<br />
1 <br />
i,<br />
<br />
2<br />
<br />
j<br />
a<br />
<br />
b<br />
i1,<br />
j<br />
2<br />
2 a 2 l<br />
<br />
<br />
=<br />
<br />
i ,<br />
<br />
i j<br />
<br />
j<br />
,<br />
ˆ i , j<br />
<br />
<br />
bb<br />
<br />
Tt<br />
l<br />
<br />
i,<br />
<br />
<br />
<br />
<br />
j<br />
l<br />
<br />
t<br />
i,<br />
j 1<br />
<br />
<br />
<br />
Equation (1)<br />
Equation (2)<br />
Where τ a and τ l represent the time delay estimate and positional shift estimate along axial and lateral<br />
directions respectively, and Δt and Δb are the shifts in the corresponding directions. The variance of this<br />
estimator can be obtained by treating a and l as uncorrelated random variables and assuming a linear<br />
covariance function for a components and l components. The lower bound on the variance is given by<br />
Equation (2) in terms of lower bound on axial and lateral delay estimates. The ratio between the applied<br />
shear strain and the lower bound on the variance yields SNRsse. Simulated SSE values were obtained<br />
from a 40mm x 40mm uniform finite element phantom after subjecting it through steps shown in<br />
Figure 1. SNRsse from resulting SSE are studied as a function of the applied shear strain (referred to as<br />
the shear strain filter, SSF). Experimental SSE obtained after subjecting a gelatin phantom through the<br />
steps shown in Figure 1 was used to create an experimental SSF.<br />
Results: The results indicate that the signal-to-noise ratio of shear-strain elastograms improves with<br />
increasing shear strain (see Figure 2). It was also observed to improve with improvements in system<br />
parameters such as the sonographic signal-to-noise ratio (SNR s ) , beamwidth, center frequency, and<br />
fractional bandwidth.<br />
Conclusions: The trend predicted by the theoretical shear strain filter was verified using simulations and<br />
experiments and was found to be in reasonable agreement. An important conclusion is that a better<br />
quality SSE may be expected for a case where higher shear strains are induced compared to a case where<br />
smaller shear strains are induced, for a given axial compression.<br />
Acknowledgement: Supported by NIH Program Project P01-CA64597-12 to the University of Texas.<br />
References:<br />
[1] Konofagou, E.E., Harrigan, T., and Ophir, J.: Shear strain estimation and lesion mobility assessment in<br />
elastography. Ultrasonics, 38, pp 400-404, 2000.<br />
Step 1: Bottom<br />
Point Fixation<br />
Step 2: Axial<br />
Compression<br />
Figure1: Steps Involved in Applying Shear Strain<br />
Step 3: Simple<br />
0<br />
Shear Deformation<br />
10 -2 10 -1 10 0 10 1 10 2<br />
SNRsse----------><br />
12<br />
8<br />
4<br />
Applied Shear Strain (%)<br />
Figure 2: SSF from theory (solid) and<br />
simulation (-o-).<br />
<br />
indicates Presenter<br />
113
041 REGULARIZATION FOR STRAIN MEASUREMENT AND SHEAR MODULUS RECONSTRUCTION.<br />
Chikayoshi Sumi 1 .<br />
1 Sophia University, 7-1 Kioicho, Chiyodaku, Tokyo 102-8554, JAPAN.<br />
Aims: We developed multidimensional cross-spectrum phase gradient method, multidimensional<br />
autocorrelation method and multidimensional Doppler method. Moreover, we are developing strain<br />
measurement-based shear modulus reconstruction methods. We previously reported the effectiveness of<br />
regularization for stabilizing these methods, i.e., strain (displacement) measurement method [1] and shear<br />
modulus reconstruction method [2]. In this report, we present the regularized results obtained on in vivo<br />
liver carcinoma which was treated by interstitial microwave coagulation therapy. As penalty terms,<br />
L 2 -norm of target distribution, L 2 -norm of gradient and the Laplacian of the target distribution are used.<br />
Methods: Respective regularization parameter should be determined by echo SNR, correlation coefficient<br />
(peak value of cross-correlation function), and ultrasound parameters (frequency, bandwidth). One<br />
approach for determining the parameters is utilization of SNR of measured strain evaluated by using<br />
mean of strain and lower bound or upper bound of strain variance, e.g., Ziv Zakai Lower Bound (ZZLB)<br />
and Strain Filter etc. Thus, these regularization parameters are set at each position (non-uniformly).<br />
Furthermore, the regularization parameters for the L 2 -norm gradient and the Laplacian can be set as<br />
different values in each direction of the partial derivative. These can also be evaluated by plural<br />
measurements at same positions or different positions [2]. In this report, at the beginning, the correlation<br />
coefficient is used to determine the parameters at each position (set at inverse proportional values).<br />
Results: The volunteer was a 73-year-old female with carcinoma (diameter = 18mm) located in liver<br />
segment 6 [2]. A needle electrode was used having a diameter of 1.6mm [70W, 2.45GHz]. Treatment was<br />
carried out for 4 min under abdominal section. During treatment, the ROI was manually compressed with<br />
the transducer and echo data frames were successively acquired. The ROI B-mode image during treatment<br />
is shown in Figure 1a (7.5 MHz, 29.6mmH41.5mm). 2D cross-spectrum phase gradient method was used (a<br />
local region, 0.8mmH1.4mm). The cutoff frequency of the differential filter was 1.02mm –1 . The reference line<br />
was set at depth of 5.7mm (in the liver; value, 1.0) where no blood vessels could be detected.<br />
The non-regularized, and non-uniformly regularized axial strain images are shown in linear gray scale<br />
(Figures 1b and 1c), while uniformly regularized, and non-uniformly regularized shear modulus images are<br />
in log gray scales where a bright region indicates a relatively soft region and vice versa (Figures 2a and 2b).<br />
The strain images 1c and shear modulus images 2a and 2b are sufficiently regularized ones because peak<br />
values of local cross-correlation functions evaluated at the heated region remained low during phase<br />
matching (Figure 3: a, before; b, after matching). In other words, measurement accuracy of strains at<br />
heated region was not improved by phase matching and remained low although regularization stabilized<br />
the measurement. The decorrelation is mainly caused by changes of reflectivity of ultrasound during echo<br />
data acquisition (due to generation/fade of bubbles, flow of bubbles, degeneration, congestion etc.). Thus,<br />
the measured strain images do not allow effective evaluation of the spatial and temporal changes of the<br />
shear modulus. However, from the regularized shear modulus images, particularly from the<br />
non-uniformly regularized image 2b, we were able to stably confirm that during treatment the tumor<br />
became soft, while a marginal region of several millimeters became considerably stiff.<br />
Figure 1 Figure 2 Figure 3<br />
Conclusions: Although regularization is effective to stabilize the strain measurement, it does not always<br />
improve measurement accuracy, particularly, when correlation coefficients are low in large regions. On<br />
the other hand, stabilization by regularization is significantly effective when incorporating information<br />
about stress distribution, i.e. when reconstructing shear modulus.<br />
References:<br />
[1] Sumi, “Stabilization of tissue displacement vector measurement utilizing ultrasonic cross-spectrum,” Technical report<br />
of the Japan Society of Ultrasonics in Medicine, 101, no. 4, pp. 31-41, Dec 2001.<br />
[2] Sumi, “Usefulness of ultrasonic strain measurement-based shear modulus reconstruction for diagnosis and<br />
thermal treatment,” IEEE Trans UFFC, Oct <strong>2005</strong> (in press).<br />
<br />
indicates Presenter<br />
114
Session FIP-2: Forward and Inverse Problems – II<br />
Wednesday, October 19 9:00A – 10:15A<br />
107 2D AND 3D ELASTICITY AND VISCOSITY IMAGING USING NEW RECONSTRUCTION<br />
STRATEGIES IN DYNAMIC ELASTOGRAPHY.<br />
Jeremy Bercoff 1 , Ralph Sinkus 1 , Mickael Tanter 1 , Mathias Fink 1 .<br />
1 Laboratoire Ondes et Acoustique, ESPCI, 10 rue Vauquelin, 75005, Paris, FRANCE.<br />
Aims: Observation of shear-wave propagation in soft tissue is of great interest for the study of tissue<br />
viscoelastic properties. Such waves can be generated either by an external vibrator or by an acoustic<br />
radiation force and imaged by ultrasound based or MRI techniques. In this work, we investigated two<br />
different vibrations modes: monochromatic and transient excitations. New adapted local inversion<br />
algorithms are proposed to estimate viscous and elastic parameters of the medium and meet<br />
requirements of each mode.<br />
Methods: Key parameters influencing the robustness of the algorithms are carefully studied and<br />
solutions are proposed. A strategy for decoupling compressional and shear waves by applying the curl<br />
operator is investigated. This strategy is shown to be crucial for a correct and quantitative estimation of<br />
those parameters in the monochromatic case. In the transient case, it suppresses mode conversion<br />
artifacts at lesion boundaries and enhances elasticity and viscosity estimations. Usually assuming local<br />
elastic homogeneity, we propose in addition generalized inversion algorithms reconstructing viscoelastic<br />
parameters heterogeneously.<br />
Results: Studies are validated with 3D finite differences simulations then tested in vitro and in vivo on<br />
female breast using MR based and ultrasound based elastography (the Supersonic Shear imaging<br />
technique presented in previous works). Clinical results on carcinomas demonstrate a significant<br />
increase in quality and robustness of the developed algorithms compared to classical ones.<br />
<br />
indicates Presenter<br />
115
097 AN ANALYTICAL MODEL FOR 3D LONGITUDINAL WAVE PROPAGATION IN A VISCOELASTIC<br />
CYLINDER: APPLICATIONS TO MR ELASTOGRAPHY.<br />
Geert J. Streekstra 1 , P. van Horssen 1 , D.M.J. van den Berg 1 , J.G.G. Dobbe 2 , J. Strackee 1 .<br />
1 Medical Physics, 2 Medical Technological Development Departments, Academic Medical Center,<br />
Amsterdam, The NETHERLANDS.<br />
Introduction: Viscoelastic properties of tissue are potential indicators for disease, specifically for cancer<br />
detection. Accurate measurement of in vivo tissue viscoelasticity may help to distinguish between benign<br />
and malignant tumors. A modality to measure tissue viscoelasticity is MR Elastography where a 3D<br />
displacement field is acquired at several phases of steady state oscillatory motion. Reconstruction of<br />
shear viscoelastic properties from the displacement field is established by local inversion of the partial<br />
differential equation describing the mechanical wave propagation in tissue.<br />
In MR Elastography equipment, a longitudinal mode of wave excitation is commonly used to allow wave<br />
propagation deep into the tissue. Mode conversion due to the presence of boundaries and local<br />
inhomogeneities leads to the presence of both dilatational and transverse waves. The transverse wave<br />
component is used for the reconstruction of local shear viscoelasticity [1].<br />
The nature of the wave pattern in tissue is dependent on the wave excitation protocol (e.g. longitudinal<br />
vs. transverse excitation). We present an analytical model for wave propagation in a viscoelastic cylinder<br />
that mimics the principles of excitation and wave propagation in a MR Elastography setting.<br />
Methods: In a cylinder, only specific wave patterns (modes) can be present. We consider longitudinal<br />
modes that are characterized by a wave number k0 corresponding to longitudinal wave propagation along<br />
the cylinder axis (z-axis). In a viscoelastic cylinder, k0 will in general be a complex number. This implies<br />
that damping of the modes occur along the cylinder axis.<br />
We developed a method to obtain the modes (i.e. k0 values) present in a viscoelastic cylinder with radius R<br />
and complex shear stiffness =re+iim. We combined multiple modes to arrive at a 3D wave pattern in the<br />
cylinder corresponding to longitudinal excitation at one end of the cylinder.<br />
Results: To illustrate the usefulness of our model, we estimated the wave numbers (k0) for a cylinder with<br />
a radius of 10cm. The viscoelastic properties are those of kidney at a frequency of 66 Hz [2].<br />
The results reveal that multiple modes are present in a cylinder with viscoelastic properties. Moreover,<br />
the k0 values are complex indicating a mode dependent wavelength and damping of the modes (Figure 1).<br />
The lowest mode has an extremely large wavelength (in the order of 10km) which corresponds to the<br />
“DC component” as observed in MR Elastography image sequences [1].<br />
Conclusions: We developed an analytical model of wave propagation in a cylinder that reflects the<br />
mechanism of wave propagation in dynamic elastography. The model might be useful to gain insight into<br />
the relationship between the wave excitation protocol and the characteristics of the waves or serve as a<br />
reference for numerical simulations.<br />
References:<br />
[1] Sinkus R, Tanter M, Catheline S, Lorenzen J, Kuhl C, Sondermann E, Fink M. Imaging anisotropic and viscous<br />
properties of breast tissue by magnetic resonance-elastography. Magnetic Resonance in Medicine 53 (2): 372-387, <strong>2005</strong>.<br />
[2] Nasseri S, Bilston LE, Phan-Thien N. Viscoelastic properties of pig kidney in shear, experimental results and<br />
modelling. Rheologica Acta 41 (1-2): 180-192, 2002.<br />
Figure 1:<br />
(a)<br />
(b)<br />
Wave pattern components in the axis direction (z-axis) of a cylinder with 0.1m radius. (a) mode with large<br />
wavelength and high attenuation. (b) mode with small wavelength and low attenuation.<br />
<br />
indicates Presenter<br />
116
103 A BAYESIAN IMAGE RECONSTRUCTION APPROACH FOR MODEL-BASED ELASTOGRAPHY.<br />
Marvin M. Doyley 1,3 , Seshadri Srinivasan 2 , Eugen Dimidenko 1 , Nirmal Soni 3 , Jonathan Ophir 2 .<br />
1 Dartmouth Medical School, Hanover, NH 03755, USA; 2 Ultrasonics Laboratory, University of<br />
Texas Medical School, Houston, TX 77030, USA; 3 Thayer School of Engineering, Dartmouth<br />
College, Hanover, NH 03755, USA.<br />
Aims: The primary objective of this work is to corroborate the hypothesis that including a priori<br />
information regarding the mechanical property of the underlying tissue structures and displacement<br />
measurement uncertainty will render the inverse elasticity problem a well-posed problem.<br />
Background: Quasi-static elastography is an emerging ultrasonic imaging technique that depicts tissue<br />
elasticity by visualizing externally or internally induced internal tissue strain. Despite its simplicity and<br />
robustness, quasi-static elastographic imaging technique currently endures mechanical artifacts and<br />
incomplete contrast recovery when strain images are interpreted as relative stiffness images based on the<br />
premise of stress uniformity – an assumption that is valid only for very special cases. Consequently, we<br />
are exploring the feasibility of developing quasi-static elastography within the framework of solving the<br />
inverse problem – a strategy that holds great promise for improving the elastographic contrast<br />
discrimination and contrast recovery. In general, inverse problems are difficult to solve because they are<br />
usually ill posed in the original sense of Hadamard, consequently, their solutions are typically<br />
non-unique, and small degree of measurement noise often produces erroneous results. To overcome these<br />
limitations we have developed a novel inverse reconstruction technique that incorporates a priori<br />
information procured by employing standard strain imaging methodology in the image reconstruction<br />
process via the Bayesian framework.<br />
Methods: To evaluate the effect of decorrelation noise and lesion size on the quality of modulus<br />
elastograms computed with the Bayesian inversion approach (BA) relative to those computed using three<br />
other estimation criteria (the standard least squares estimation criterion (LS), the weighted least squares<br />
method (WLS) and the Tikhonov method), we conducted elastographic imaging experiments on elastically<br />
inhomogeneous gelatin phantoms. Three performance metrics were employed: contrast recovery, contrast<br />
discrimination and spatial resolution.<br />
Results. Figure 1 shows representative examples of strain elastograms obtained when elastographic<br />
imaging is performed using applied strains of 1.25%, 2% and 4%. The inclusion is discernible in the<br />
elastograms at the correct location; however, image quality is compromised noticeably with larger internal<br />
strain. In Figure 2, the contrast-to-noise ratio (CNR e ) and contrast-transfer efficiency (CTE e ) performance<br />
metrics are plotted as a function of the percentage of applied strain. The quality of the modulus<br />
elastograms decreased significantly when the applied strain exceeded 2%. However, it is apparent from<br />
Figure 2a that modulus elastograms computed by employing the Bayesian framework were more tolerant<br />
to structural decorrelation noise relative to those computed by employing the standard least squares, the<br />
weighted least squares and the Tikhonov estimations criteria. Interestingly, the influence of structural<br />
decorrelation noise on our ability to completely recover modulus contrast was small when image<br />
reconstruction was performed using the Bayesian reconstruction approach.<br />
(a)<br />
(b)<br />
Figure 1: Strain elastograms obtained from a phantom<br />
containiing a single 20mm diameter<br />
inclusion when elastographic imaging was<br />
performed using an applied strain of 1.25%,<br />
2% and 4% respectively.<br />
Figure 2: (a) CNRe and (b) CTEe performance metrics computed<br />
from elastograms reconstructed using four<br />
estimation criteria: standard least squares, weighted<br />
least squares, Tikhonov method and Bayesian<br />
approach.<br />
Conclusion: The preliminary results reported in this abstract demonstrate unequivocally that<br />
incorporating additional a priori information in the modulus image reconstruction process via the<br />
Bayesian estimation criterion will render the inverse problem a well-posed problem, thus bolstering its<br />
performance particularly when structural decorrelation noise is significant.<br />
<br />
indicates Presenter<br />
117
077 IMAGING ANISOTROPIC ELASTICITY USING SUPERSONIC RADIATION FORCE EXCITATION.<br />
Jeong-Rock Yoon 1 , Daniel Renzi 2 , Joyce R. McLaughlin 2 .<br />
1 Clemson University, Clemson, SC 29634-0975, USA; 2 Rensselaer Polytechnic Institute, Troy, NY<br />
12180, USA.<br />
Aims: It is important to consider anisotropic tissue models, since some tumors exhibit anisotropy and<br />
the structure of fiber orientation may have a correlation with the malignancy of tumor. Based on the<br />
multiple supersonic radiation force excitation, we aim to recover two shear moduli and fiber structures in<br />
incompressible transversely isotropic tissue model. Our potential application is to distinguish malignancy<br />
of tumor.<br />
Background: For the isotropic tissue model, a series of uniqueness results for the transient elastography<br />
inverse problem have been presented, and a fast stable algorithm to reconstruct the shear stiffness based<br />
on arrival time has been suggested [1, 2]. We want to extend this arrival time technique to anisotropic<br />
media.<br />
Methods: We can generate line sources moving radiation force sources [3]. Observing the SH-polarized<br />
shear wave propagation by ultrafast ultrasound scanner [3], we can estimate the arrival times [1, 2].<br />
Assuming the tissue model as incompressible transversely isotropic medium, we derive a nonlinear<br />
arrival time equation that relates two shear moduli and fiber orientation with the estimated arrival times.<br />
This equation tells that we need at least four measurements, and we show in most cases four<br />
measurements are enough to reconstruct the SH-related anisotropic properties.<br />
Results: Using four measurements of the SH-wave arrival times (which are generated by supersonic<br />
radiation force excitation), we can establish a fourth order polynomial. Solving this polynomial we can<br />
find one of the shear moduli and derive an explicit formula for the other shear modulus and fiber<br />
orientation. Simulation results are also presented.<br />
Conclusions: We show that, in most cases, four SH-wave measurements are enough to reconstruct two<br />
shear moduli and fiber direction in incompressible transversely isotropic tissue model. We hope this<br />
algorithm can be used to distinguish the malignancy of tumors. In order to recover Young’s moduli<br />
information (which cannot be recovered in current SH-wave based algorithm), we should look at QS-wave.<br />
We are extending our method to QS-wave.<br />
References:<br />
[1] J. R. McLaughlin, J. R. Yoon, Unique identifiability of elastic parameters from time dependent<br />
interior displacement measurement, Inverse Problems, 20(1):25--45, 2004.<br />
[2] L. Ji, J. R. McLaughlin, D. Renzi, J. R. Yoon, Interior elastodynamics inverse problems: shear wave<br />
speed reconstruction in transient elastography, Inverse Problems, 19(6):S1--S29, 2003.<br />
[3] J. Bercoff, M. Tanter, M. Fink, Supersonic shear imaging: a new technique for soft tissue elasticity<br />
mapping, IEEE Trans. on Ultra., Ferro., and Freq. Cont., 61(4)396-409, 2004.<br />
<br />
indicates Presenter<br />
118
113 FAST INVERSION TECHNIQUES FOR 3D SONOELASTICITY IMAGING.<br />
B.B. Guzina 1 , A.I. Madyarov 1 , I. Chikichev 1 .<br />
1 Univiersity of Minnesota, 500 Pillsbury Drive S.E., Minneapolis, MN, USA.<br />
Aims: This paper highlights three recent inversion algorithms for 3D sonoelasticity imaging. The first<br />
method, based on non-linear minimization, is shown to perform well provided that the initial “guess” (in<br />
terms of lesion geometry and characteristics) is sufficiently close to the true situation. To deal with the<br />
latter restriction, two alternative sampling inversion algorithms have been proposed that are both<br />
computationally effective and robust as they nullify the need for initial guess.<br />
Background: Studies have shown that the resolution of elasticity imaging could be enhanced by following<br />
the strain or velocity images with a solution to the inverse elasticity problem, e.g. [1]. An efficient and<br />
robust solution to the latter ill-posed problem is, however, very much an open question, especially in<br />
three dimensions.<br />
Methods: Boundary-Only Imaging (BOI): For the 3D sonoelasticity imaging problem, a technique was<br />
recently proposed in [2] on the basis of: i) boundary element method, and ii) minimization of the misfit<br />
between experiment and elastodynamic theory for a trial obstacle geometry. The key advantage of this<br />
approach rests on the fact that BOI avoids costly volume discretization often associated with elastic<br />
tomography. Figure 1a illustrates the iterative BOI process of delineating a soft lesion, hidden in a<br />
homogeneous tissue (z>0), from synthetic measurements.<br />
Topological Derivative Approach (TDA): One recent approach to sonoelastic imaging [3] that does not require<br />
global minimization and thus eliminates the need for initial guess is based on the concept of topological<br />
derivative, originally developed for structural shape optimization [4]. The topological derivative, T, furnishes<br />
information about the variation of a given cost functional when an infinitesimal lesion is nucleated at a<br />
sampling (i.e. trial) point z in the reference (background) tissue. Theory suggests that a finite lesion and its<br />
stiffness can both be identified by computing T(z) over the prescribed grid of internal sampling points and<br />
plotting the resulting T-distribution or its associated (“optimal”) shear modulus, see Figure 1b.<br />
Linear Sampling Method (LSM): As an alternative to TDA, an effort is undertaken to generate elastograms<br />
equivalent to those in Figure 1b by means of LSM. The latter imaging technique, although being the<br />
subject of mounting attention in far-field acoustics and electromagnetism (e.g. [5]) has only recently been<br />
extended to near-field elastodynamics [6]. Although stemming from a distinct mathematical platform, the<br />
elastodynamic LSM is shown to generate images on a point-sampling basis similar to TDA, i.e. without<br />
the need for initial guess.<br />
Results:<br />
Figure 1:<br />
a) b)<br />
a) Evolution of a trial lesion during BOI minimization (k = iteration number);<br />
b) Shear modulus distribution (horizontal section) obtained using TDA: blue – high modulus, white – low modulus.<br />
Conclusions: This paper summarizes three alterative inversion algorithms (BOI, TDA and LSM) for<br />
3D elasticity imaging. The latter two techniques, commonly termed the sampling methods, appear to be<br />
especially tractable for medical applications owing to their robustness and computational efficiency. For<br />
comparative purposes, all three methods are designed to interpret common experimental data sets.<br />
Acknowledgements: Support of NSF through grant CMS-324348 to B. Guzina is kindly acknowledged.<br />
References:<br />
[1] M.M. Doyley, S. Srinivasan, S. Pendergrass, Z. Whu, J. Ophir (<strong>2005</strong>). Ultrasnd. Med. Biol., 6, 787-802.<br />
[2] B.B. Guzina, S.F. Nintcheu, M. Bonnet (2003). Int. J. Solids Struct., 40, 1505-1523.<br />
[3] B.B. Guzina, M. Bonnet (2003). Quart. J. Mech. Appl. Math., 20, 161-179.<br />
[4] H.A. Eschenauer, V.V. Kobelev, A. Schumacher (1994). Struct. Optim., 8, 42-51.<br />
[5] D. Colton, J. Coyle and P. Monk (2000). SIAM Rev., 42, 369-414.<br />
[6] S.F. Nintcheu, B.B. Guzina (2004). Inv. Problems, 20, 713-736.<br />
<br />
indicates Presenter<br />
119
Session CAA-2: Clinical and Animal Applications – II<br />
Wednesday, October 19 10:45A – 12:15P<br />
004 ULTRASOUND ELASTICITY IMAGING FOR AGING DEEP VENOUS THROMBOSIS IN HUMANS.<br />
JM Rubin 1 , H Xie 1 , K Kim 1 , WF Weitzel 1 , SY Emelianov 2 , S Aglyamov 2 , TW Wakefield 1 ,<br />
M O’Donnell 1 .<br />
1 University of Michigan, Ann Arbor, MI, USA; 2 University of Texas at Austin, Austin, TX, USA.<br />
Aims: To study the usefulness of ultrasound elasticity imaging for aging deep venous thrombosis (DVT).<br />
Background: It is well known that DVTs harden as they age, and the treatment of DVT depends on the<br />
age of the thrombi. Given this fact, ultrasound elasticity imaging should be an excellent method to age<br />
DVT, and animal studies have confirmed this fact [1, 2]. However, except for case reports [3], the efficacy<br />
of elasticity imaging for aging DVT in humans has yet to be shown in a controlled large study.<br />
Methods: 57 total DVT patients, 27 patients with chronic DVT, and 30 with acute DVT were evaluated.<br />
Chronic DVT subjects had no symptoms and had known thrombi for a year or greater through follow-up<br />
examinations on a Greenfield filter protocol. Acute DVT patients had duplex venous ultrasound proven<br />
calf or thigh DVTs, and had symptoms or signs of DVT for two weeks or less without a prior history of<br />
DVT. Scanning was performed using a 5 MHz linear array scanhead on a Siemens Elegra (Siemens<br />
Ultrasound, Issaquah, WA) ultrasound scanner. We performed continuous, freehand external<br />
deformation of each thrombus using the scanhead. Strain estimates for the deformation of each<br />
thrombus were estimated using a 2D phase-sensitive speckle tracking algorithm. Intrathrombus strains<br />
were normalized to the average strain between the skin surface and the back wall of the involved vein.<br />
Statistical analyses were performed using a two-tailed T-test assuming unequal variances and ROC<br />
analysis.<br />
Results: Seven patients were excluded from analysis. Three had acute and four had chronic thrombi.<br />
Five were excluded because the overall average deformation was too small (
030 A NOVEL PERFORMANCE DESCRIPTOR FOR ULTRASONIC STRAIN IMAGING:<br />
A PRELIMINARY STUDY.<br />
J Jiang 1 , TJ Hall 1 , AM Sommer 1 .<br />
1 Medical Physics Department, University of Wisconsin-Madison, Madison, WI, USA.<br />
Background and Aims: The aim of this study is to differentiate ‘good’ from ‘poor’ strain images with a<br />
quantitative measure for applications where the ‘right answer’ is unknown (for example, in vivo tissues).<br />
In addition, the strain image quality measure can be used for visual feedback during scanning to assist<br />
training and scanning technique optimization. This will lead to improvements in the diagnostic<br />
performance of ultrasonic strain imaging.<br />
Methods: The proposed performance measure is based on two parameters: accuracy of motion tracking<br />
and consistency among consecutive strain fields. The accuracy of motion tracking assesses the reliability<br />
of strain images. The consistency among consecutive strain images, in theory, directly reveals the signal<br />
quality in strain images if strain signal is coherent but noise is incoherent among successive strain<br />
images. A single summary descriptor was obtained by combining these two parameters. Compared to the<br />
methods available in the literature (e.g. strain filter [1]), the proposed method has several advantages: (1)<br />
no assumptions regarding the signals, underlying motion, or motion tracking algorithms are needed; (2)<br />
performance of strain imaging can be assessed for individual cases accurately; (3) the final performance<br />
descriptor, a scalar value between zero and one, is quantitative and easy to use. The proposed method<br />
has been successfully integrated into our existing program for strain image formation [2].<br />
Results: Experiments with tissue-mimicking phantoms and in vivo breast tissue data [3] are reported to<br />
demonstrate the proposed method. Preliminary results suggest that the measured performance values<br />
matched well with a limited human observer study (three trained physicists, 200 strain images acquired<br />
from fibroadenoma and invasive ductal carcinoma). The performance values as a function of<br />
frame-average axial strain estimated from in vivo breast data indicated that there is an ‘optimal’<br />
deformation range (0.8~1.5% frame average strain) under which high quality strain images were likely<br />
formed, consistent with previous work.<br />
Conclusions: Our results suggested the proposed method can be used to assess the quality of strain<br />
images with full automation and the measured performance is consistent with visual perception.<br />
Acknowledgements: We are grateful for the support from the USAMRMC (DAMD17-00-1-0596), the NIH<br />
(R01-CA100373), and the University of Wisconsin. We are also grateful to colleagues at the Mayo Clinic in<br />
Rochester, MN, USA, and the Charing Cross Hospital in London, England, UK for providing some of the<br />
data used in this study.<br />
References:<br />
[1] T. Varghese and J. Ophir, "Theoretical framework for performance characterization of elastography:<br />
the strain filter," IEEE Transactions on UFFC, vol. 44, pp. 164-172, 1997.<br />
[2] Y. Zhu and T. J. Hall, "A modified block matching method for real-time freehand strain imaging,"<br />
Ultrasonic Imaging, vol. 24, pp. 161-76, 2002.<br />
[3] T. J. Hall, Y. Zhu, and C. S. Spalding, "In vivo real-time freehand palpation imaging," Ultrasound in<br />
Medicine & Biology, vol. 29, pp. 427-35, 2003.<br />
<br />
indicates Presenter<br />
121
111 A COMPARISON OF REAL-TIME AND POST-PROCESSED ELASTOGRAPHY WITH SURGICAL<br />
FINDINGS FOR INTRA-OPERATIVE DETECTION OF BRAIN TUMOURS.<br />
A Chakraborty 1 , JC Bamber 2 , NL Dorward 1 .<br />
1 Department of Neurosurgery, Royal Free Hospital, London, England, UK; 2 Department of Physics,<br />
Institute of Cancer Research, Sutton, Surrey, SM2 5PT, England, UK.<br />
Aims: We present a study comparing elastographic appearances of brain tumours in vivo, produced using<br />
both a commercial real-time system and a freehand off-line system, with surgical findings and with<br />
appearances on MRI. Elastography was applied to the brain intra-operatively during tumour resection.<br />
Background: Detection of the brain tumour interface is essential when resecting brain tumours.<br />
Elastography may assist in detecting this interface, but the majority of elastography techniques require<br />
off-line processing. For elastography to be useful intra-operatively, images would have to be produced<br />
between the time the skull has been removed and the start of tumour removal. Hence, a real-time<br />
ultrasound elastography system would be advantageous.<br />
Methods: 20 patients were recruited into this study. The Acuvix XQ (Medison, Korea) with the<br />
Elastoscan® protocol was used for real-time scanning. The Acuson 128XP scanner with access to RF data<br />
was used for generation of off-line elastograms, employing a least squares strain estimator applied to<br />
displacement fields obtained using an incremental 2D correlation-based tracking algorithm, as described<br />
by Doyley et al [1]. Pre-operative MRI scans were re-sampled in the same plane as the off-line<br />
elastograms, employing a StealthStation TM optical tracking system to achieve the required registration<br />
between ultrasound and MRI data. Real-time elastography sequences were acquired in approximately the<br />
same plane, as best as could be judged visually. Assessment of elastographic contrast and structure was<br />
by visual inspection of the images, which were compared with surgical findings that included the relative<br />
stiffness of brain compared to tumour and the mechanical properties of the brain tumour interface.<br />
Results: It was possible to determine the difference in strain between brain and tumour using both real-time<br />
and off-line elastography. Internal tumour structure, such as elastographic heterogeneity, was also seen in<br />
both, and correlated with MRI appearances. For real-time, this assessment is an interactive process, involving<br />
adjustment of palpation speed and amplitude whilst studying the structures apparent in different frames of<br />
the real-time sequence. Areas of high strain correlated with areas of slip using both methods.<br />
Conclusions: Real-time elastography can be used intra-operatively when resecting brain tumours. The<br />
images produced provide basic strain information analogous to strain information produced using our<br />
off-line system, and hold potential for future use in assisting tumour resection.<br />
References:<br />
[1] Doyley MM, Bamber JC, Fuechsel F, Bush NL (2001). Ultrasound Med Biol; 27: 1347-1357.<br />
Figure 1:<br />
Single frame from a sequence showing a<br />
B-scan and associated real-time elastogram.<br />
The tumour is stiffer than surrounding<br />
brain. There is an area of brain that is stiffer<br />
than surrounding brain below the sulcus. It<br />
is likely that correlation is poor in this area<br />
as slip is occurring above.<br />
Figure 2:<br />
B-mode and off-line elastogram. Tumour has<br />
similar or lower strain compared to brain.<br />
The strain contrast in the area below the<br />
sulcus is less marked than for the real-time<br />
image. At surgery a well-developed brain<br />
tumour interface was observed, with tumour<br />
of a similar stiffness to brain.<br />
<br />
indicates Presenter<br />
122
051 SOFT TISSUE BIOMECHANCIAL BEHAVIOR DURING ROBOTIC ACUPUNCTURE IN LOW BACK<br />
PAIN USING ULTRASOUND ELASTICITY IMAGING.<br />
Helene M. Langevin 1 , Elisa E Konofagou 2 , Junru Wu 3 , James R. Fox 4 and James C. Iatridis 5 .<br />
1 Neurology, 3 Physics, 4 Orthopaedics and 5 Engineering Departments, University of Vermont,<br />
Burlington, VT, USA; 2 Department of Radiology, Columbia University, New York, NY, USA.<br />
Aims: The goal of this study is to examine tissue behavior during acupuncture in the lower back and legs<br />
in subjects with Low Back Pain (LBP) compared with subjects without LBP (No-LBP). We hypothesize that<br />
needle force and tissue displacement patterns are abnormal in LBP and that these abnormalities are<br />
localized to specific locations as predicted by traditional acupuncture theory.<br />
Background: The mechanisms of both acupuncture and low back pain are poorly understood. We have<br />
previously shown that computer-controlled robotic acupuncture can be successfully used in combination<br />
with ultrasound elasticity imaging to quantify soft tissue biomechanical behavior during acupuncture<br />
needling [1]. Soft tissue (connective tissue and muscle) pathological abnormalities including fibrosis,<br />
atrophy and inflammation may contribute to the pathophysiology of LBP and may cause biomechanical<br />
abnormalities that can be detected using these techniques. Thus ultrasound elasticity imaging may reveal<br />
important information on both the pathophysiology of LBP and the mechanism of acupuncture.<br />
Methods: Ten subjects (5 with LBP and 5 with No-LBP) were tested at the time of abstract submission.<br />
We anticipate testing a further 10 subjects by the fall of <strong>2005</strong>. All points tested were non-acupuncture<br />
points either on acupuncture meridians or off meridians. Each subject received robotic acupuncture<br />
needling at four locations: one back point (back Meridian) bilaterally, one point on the right leg (leg<br />
Meridian) and one point on the left leg (leg Non-Meridian). The needling procedure consisting of needle<br />
insertion at an angle of 20º relative to the ultrasound transducer and to a depth of 0.5 mm beyond the<br />
superficial border of muscle (determined by ultrasound prior to needling). After insertion, the needle was<br />
rotated (8 uni-directional revolutions at 8 revs-sec) followed by five oscillations (up and down movement)<br />
of the needle with an amplitude of 2 mm and at a rate of 5 mm/sec. Needle torque and force were<br />
measured during rotation and oscillation respectively. Tissue B-scan ultrasonic imaging was performed<br />
with a SystemFive (GE-Vingmed) scanner equipped with a linear array transducer at a frequency of<br />
6.9 MHz. A five second ultrasound cine-loop was acquired during the oscillation sequence at a rate of<br />
13.2 frames/sec. Tissue displacement and strain are estimated using cross-correlation techniques [2].<br />
Results: In the subjects tested to date, mean±SE needle torque in the back was 0.23 ± 0.03 mN-m for<br />
LBP compared with 0.33 ± 0.06 mN-m for No-LBP. Mean needle force decay rate was 24.2 ± 4.4% over<br />
5 seconds for LBP compared with 10.0 ± 2.3% for No-LBP. Mean±SE tissue displacement in the back was<br />
23.3±2.2μm for LBP vs. 25.2±3.2μm for No-LBP. In the leg, displacement for LBP and No-LBP respectively<br />
were 25.7±7.6μm vs. 35.5±7.4μm at meridians and 27.6±2.1μm vs. 28.7±4.1μm at non-meridians. These<br />
results suggest that, in LBP, the tissues did not wind as tightly around the needle during rotation<br />
(decreased torque) and were slipping past the needle during oscillation (decreased tissue displacement<br />
and increased force decay). Preliminary analysis of these data using a mathematical model treating tissue<br />
zones (subcutaneous, perimuscular, muscle) as one-dimensional simple harmonic oscillators indicated<br />
increased stiffness, decreased damping and decreased needle-tissue coupling time constant in LBP,<br />
which could result from abnormal tissue composition and/or architecture. The preliminary observation of<br />
a difference between LBP and No-LBP at leg Meridians but not at Non-Meridians also suggests that the<br />
abnormal tissue behavior in LBP is not generalized, but rather may be restricted to specific locations.<br />
Conclusion: These preliminary results suggest that soft tissue abnormalities may be detectable in LBP<br />
using a combination of robotic acupuncture and ultrasound elasticity imaging. These techniques thus may<br />
provide biological measurements that could 1) open up a new approach to understanding the mechanisms<br />
of both acupuncture and LBP and 2) be used as objective outcome measures in clinical trials.<br />
Acknowledgements: Funded by the National Center for Complementary and Alternative Medicine.<br />
References:<br />
[1] Langevin HM, Konofagou EE, Badger GJ, Churchill DL, Fox JR, Ophir J, and Garra BS. Tissue<br />
displacements during acupuncture using ultrasound elastography techniques. Ultrasound in<br />
Medicine and Biology 30: 1173-1183, 2004.<br />
[2] Ophir J, Cespedes I, Ponnekanti H, Yazdi Y, and Li X. Elastography: a quantitative method for<br />
imaging the elasticity of biological tissues. Ultrason Imaging 13: 111-134, 1991.<br />
<br />
indicates Presenter<br />
123
110 REALTIME SONOELASTOGRAPHY OF 156 BREAST LESIONS IN A PROSPECTIVE CLINICAL<br />
SETTING.<br />
S. Weber 1 , S. Wojcinski 1 , K. Ertan 1 , K. Remberger 2 , U. Stein 2 , R. Ohlinger³, A. Thomas 4 , W. Schmidt 1 .<br />
1 Department of Gynecology and Obstetrics, 2 Institute for Pathology, University of Saarland,<br />
Homburg/Saar, GERMANY; 3 Department of Gynecology and Obstetrics, Ernst-Moritz-Arndt-<br />
University, Greifswald, GERMANY; 4 Department of Gynecology and Obstetrics, Charité – CCM,<br />
University Berlin, Berlin, GERMANY.<br />
Aims: Ongoing technical progress has increased the accuracy of imaging in ultrasound mammography.<br />
Using a HITACHI EUB-L54M (50mm, 13-6MHz) and the HITACHI EUB-L53L (92mm, 10-5MHz)<br />
transducer, different criteria of dignity can be evaluated for validity. Some diseases, including cancer, can<br />
lead to a change of tissue hardness. Therefore, compressibility of a lesion can be used as a criterion.<br />
Real-time elasticity imaging is a precise ultrasound technique that can easily be performed with<br />
conventional ultrasound probes. Sonoelastography may provide more accurate discrimination of cancers<br />
from benign masses because it enables differences in tissue hardness to be detected.<br />
Methods: Over a period of 6 months, 156 breast tumors were examined using sonography by two<br />
independent examiners. The study was comprised of lesions detected either by mammography,<br />
ultrasound or manual palpation. An elastography score consisting of 5 grades has been proposed for the<br />
differential diagnosis of breast masses. This elastography score was determined and all images and videos<br />
were digitally archived and reviewed by a second examiner without having any other information about<br />
the patients. Finally, a biopsy was taken, and the data were then analyzed by previously defined criteria.<br />
Diagnostic validity was quantified by means of sensitivity, specificity, positive and negative predictive<br />
value, as well as the ODDS-ratio.<br />
Results: In total, 135 patients with 156 breast lesions participated in our study. Their mean age was 56<br />
years (16-93 years). 75% of the patients were postmenopausal. The 156 lesions in these patients required<br />
biopsy either due to the mammographic, sonographic or clinical appearance. Pathological examination of<br />
the material led to the diagnosis of 67 malignant tumors (5 cases of ductal carcinoma in situ [DCIS], 2<br />
cases of lobular carcinoma in situ [LCIS] and 60 cases of invasive carcinoma) and 89 benign diseases (32<br />
mastopathic lesions, 18 fibroadenoma, 18 cysts, and 21 other findings – fat tissue necrosis, lymph nodes,<br />
scars, papilloma, mastitis). A higher elastography score was more frequently associated with malignant<br />
tumors. Using the L54 probe SonoElastography as a single method showed only a sensitivity of 64% (CI:<br />
50%-77%) and a specificity of 89% (CI: 83%-95%). The US-BI-RADS classification had a sensitivity of 94%<br />
(95% CI: 91%-97%) and a specificity of 99% (CI: 96%-100%). Regarding only those lesions which were<br />
difficult to classify in B-mode sonography and therefore were assigned US-BI-RADS 3 or 4, there was no<br />
significant advantage in adding SonoElastography as the sensitivity was 55% for the US-BI-RADS 3<br />
lesions and 67% for the US-BI-RADS 4 lesions compared with the overall sensitivity of 64% for<br />
SonoElastography.<br />
Conclusions: The accuracy of SonoElastography was dependent on the histological subtype of the lesion.<br />
As known from pathological examinations, ductal carcinoma, often is the less lobular carcinoma, shows a<br />
desmoplastic stroma reaction, a dense cellular reaction with highly cross linked collagenous fibers. The<br />
more distinctive this reaction is, the harder the lesion gets. That proposes better results in<br />
SonoElastography for ductal carcinoma. This is represented by a higher specificity of 82% for ductal<br />
carcinoma, 100% for mixed type ductal/lobular carcinoma versus 64% for all tumors.<br />
<br />
indicates Presenter<br />
124
075 NORMAL AND SHEAR ELASTOGRAPHY OF SKIN UNDER SURFACE EXTENSIVE LOADING.<br />
Louise Coutts 1 , Jeffrey C. Bamber 1 , Naomi R. Miller 1 .<br />
1 Institute of Cancer Research, 15 Cotswold Road, Sutton, Surrey, SM2 5NG, England, UK.<br />
Aims: Our aim was to evaluate the ability to use ultrasound to produce high resolution in vivo images of<br />
the stiffness distribution within the skin and investigate the effects of surface extensive loading, of<br />
varying direction, on the normal and shear strain generated within normal skin and the underlying tissue<br />
layers.<br />
Background: The measurement of skin elasticity has the potential to play an important role in the<br />
clinical assessment of a range of skin conditions, including acne scars, wounds, skin cancer, radiation<br />
fibrosis and lymphoedema, but many of these applications would require measurement of highly local<br />
values of elastic properties. Existing methods of assessing skin elasticity, such as measuring overall<br />
strain while applying suction, torsion or a uniaxial load to the skin, provide only an overall value of skin<br />
stiffness on a scale no smaller than centimetres.<br />
Methods: Pseudo-static linear extensive strains of about 20%, large enough for collagen fibre<br />
recruitment, were applied to the skin surface on the forearms of 6 normal volunteers whilst measuring<br />
the load and acquiring a sequence of ultrasound images using a Sequoia 15L8 probe at 14MHz. The<br />
small strain (1-2%) between images acquired in sequence allowed two dimensional incremental<br />
correlation-based displacement tracking for imaging the total displacement. Least squares strain<br />
estimation then formed lateral and axial strain images, using both normal strain and shear strain, for a<br />
field of view of about 15mm deep by 40mm wide.<br />
Results: At least 9 frame/s were needed to separate the effects of linear elasticity from those of viscous<br />
creep. Account also needed to be taken of the limit strain, at which a near linear stress-strain<br />
relationship begins. In general, uniform normal strains were seen in the skin, with the strain propagating<br />
down into the subcutis, despite the use of surface extensive loads, with a pronounced anisotropy<br />
observed as a modulation factor of about two and a periodicity of 90 degrees for the variation of relative<br />
stiffness (measured as the ratio of load to strain) with direction of loading. On the other hand, little or no<br />
normal strain was generated in underlying muscle. Correspondingly, the extensive (lateral) shear strain<br />
was uniformly low in all layers, except for high values at the boundary between subcutaneous fat and<br />
muscle.<br />
Conclusions: Preliminary conclusions are that the uniformity of strain with depth for normal skin should<br />
be helpful in the future, for measuring the effect of lymphoedema and for visualising skin tumours, if<br />
they possess stiffness contrast against this background. Care, however, needs to be taken to account for<br />
the complex stress-strain characteristics of skin, and for the pronounced anisotropy. This complexity, on<br />
the other hand, may contain substantial useful information yet to be taken advantage of.<br />
Acknowledgements: This work is supported by funding from the EPSRC.<br />
<br />
indicates Presenter<br />
125
Session MPT: Mechanical Properties of Tissues<br />
Wednesday, October 19 1:45P – 3:30P<br />
047 DIFFERENTIATING MECHANICAL PROPERTIES OF CORNEAL PHANTOMS USING AN<br />
ULTRASOUND METHOD.<br />
J Liu 1 , CJ Roberts 1 , X He 1 .<br />
1 The Ohio State University, Columbus, OH, USA.<br />
Aims: To detect the differences in mechanical properties of corneal phantoms (i.e., contact lenses) made<br />
of different materials using an ultrasound method.<br />
Background: Recent studies [1] indicated that variations in corneal biomechanical properties in the<br />
normal population may introduce significant error to the measurement of intraocular pressure using<br />
Goldmann tonometry – a routine ophthalmic practice for glaucoma diagnosis. There is no method that is<br />
currently available for non-invasive measurement of corneal biomechanical properties. We have developed<br />
an ultrasound model and system for non-destructive determination of the mechanical properties of<br />
cornea-like, thin layer structures. Contact lenses made from different materials were used in this study to<br />
verify the sensitivity of our approach in differentiating the mechanical properties of cornea phantoms.<br />
Methods: Three types of contact lenses were obtained. They were made of polymethyl methacrylate<br />
(PMMA), hydrogel, or hydrogel+silicone. The lenses were immersed in 0.9% saline during ultrasonic<br />
measurement. The position of the lenses was controlled by XYZ linear stages and two goniometers to<br />
ensure that the ultrasonic beam was centered at the apex of the lens. A broadband ultrasound<br />
transducer (20MHz, V316, Panametrics) was used, and driven by a pulser/receiver (5900PR,<br />
Panametrics). All reflected signals from the contact lenses were recorded by a 500MHz/8-bit digitizer<br />
(Acqiris, DP105). A reference signal was recorded on a Plexiglas block with flat surfaces. The experimental<br />
reflection spectra were obtained using Fast Fourier Transformation on experimental data. The theoretical<br />
reflection spectra were calculated based on a wave propagation model assuming contact lenses as<br />
isotropic materials. An inverse algorithm was constructed to estimate the three physical properties of the<br />
contact lenses: density ρ, thickness h, and longitudinal modulus (+2μ), using least squares minimization.<br />
Results: The experimental spectral curves from different contact lenses had different forms, such as the<br />
magnitude and location of minima and maxima (Figure 1). It appeared that the spectra from the PMMA<br />
lenses had higher magnitudes in comparison to those from the other two types of lenses. The<br />
reconstructed values of the longitudinal modulus were significantly different for lenses made of different<br />
materials, while PMMA lenses had the highest longitudinal modulus (P
010 ACOUSTOELASTICTY TO BIOLOGICAL TISSUES: MEASUREMENT OF REFLECTION<br />
COEFFICIENT CHANGE IN TENDONS UNDER DIFFERENT TENSILE STRAINS.<br />
Hirohito Kobayashi 1 , Ashish L. Oza 1 , Ray Vanderby 1 .<br />
1 Department of Orthopedics and Rehabilitation, University of Wisconsin-Madison, 600 Highland<br />
Ave., Madison, WI, USA.<br />
Aims: Biological tissues undergo dynamic patterns of physiological stress producing local strains. These<br />
strains help maintain the tissues via cell signaling and indicate normal or pathological function. An<br />
accurate, non-invasive measurement of strain would then be useful to medical science. Using tendon as a<br />
model, the aim of this study was to investigate whether acoustic characteristics of tissues are sufficiently<br />
load dependent that they can determine tissue loadings, in vivo.<br />
Background: Acoustoelasticity (AE) is a theory that describes wave propagation in deformed media. The<br />
basis of AE is that acoustic characteristics are stress dependent [1]. A strong correlation between the<br />
longitudinal wave velocity and ligament tension has been reported [2] suggesting an AE effect in these<br />
tissues. Töyräs et al. similarly showed stress dependence in bovine articular cartilage [3].<br />
Methods: In this study, we use reflection coefficients from the surface of tendons under different applied<br />
strains to compute tissue strains via AE. The AE formulation below is necessary in order to analyze the<br />
load-dependent acoustic properties of these tissues.<br />
2<br />
is tissue strain.<br />
[(1 R0<br />
) /(1 R0)<br />
] T 2 R 0 and T are the reflection coefficient and travel time for<br />
{<br />
[ ] } 1<br />
2<br />
[(1 R(<br />
)) /(1 R(<br />
))] t<br />
the unstretched state.<br />
R() and t are the reflection coefficient and travel time for<br />
the stretched state.<br />
Six digital flexor tendons from pigs were collected and placed in the testing machine (MTS 858 BIONIX<br />
Test System; 2000 N load cell) containing a hydration bath. Each tendon was held by a specially designed<br />
cryogrip and its boney insertion and the bath was filled with phosphate-buffered saline (PBS). An<br />
ultrasonic transducer (2.25 MHz) was held perpendicular to the axis of the tendon in the bath. Each<br />
tendon was then tested at varying levels of strain. Reflection waves were recorded approximately 4 sec.<br />
after the peak strain.<br />
Results:<br />
Figure 1:<br />
Reflection coefficients from a typical<br />
specimen are plotted at different levels of<br />
applied strain (grip to grip).<br />
(◦): Experimental data points<br />
Solid line: Least squares fit<br />
Results clearly show strain dependence of<br />
reflection coefficients.<br />
This behavior (i.e. strong strain dependence)<br />
was consistent among all six specimens.<br />
Conclusions: This study shows that reflection coefficients of ultrasonic waves off the surface of the<br />
tendon change with applied strain. These reflection coefficients, when incorporated into AE analysis, can<br />
then be used to compute tissue strains (via the above formula) and transverse stiffness properties of the<br />
tissues.<br />
References:<br />
[1] Hughes DS and Kelly JL, Phys.Rev. 92, 1145-1149 (1953).<br />
[2] Crisco JJ, et al., J. Biomech. Engr. 120, 321-326 (1998).<br />
[3] Töyräs J, et al., Ultrasound in Medicine & Biology 29(3), 447-454 (2003).<br />
<br />
indicates Presenter<br />
127
011 ACOUSTOELASTICTY IN BIOLOGICAL TISSUES: ULTRASOUND WAVE VELOCITY CHANGE IN<br />
COMPRESSED TISSUES.<br />
Hirohito Kobayashi 1 , Ashish Oza 1 , Michael S. Cooper 2 , Ray Vanderby 1 .<br />
1 Department of Orthopedics and Rehabilitation, University of Wisconsin-Madison, 600 Highland<br />
Ave., Madison, WI, USA; 2 Portage Veterinary Clinic, 1803 New Pinery Rd., Portage, WI, USA.<br />
Aims: Acoustoelasticity (AE) is a phenomenon that relates alterations of acoustic characteristics in elastic<br />
media to deformation. Hence, any analysis regarding wave propagation in a deformed medium should be<br />
conducted within the framework of AE. In this study, dilatational wave velocities are measured through<br />
compressed biological tissues, and AE is used to identify the mechanical properties of the tissues.<br />
Background: The theory of AE was initiated by Hughes and Kelly [1] and has been intensively studied in<br />
engineering materials like steel [2], yet it had never been applied to nearly incompressible materials like<br />
rubber or biological tissues. Recently, Kobayashi and Vanderby [3] applied AE to nearly incompressible<br />
materials like rubber with the introduction of a new strain energy function. Crisco et al. [4] and Töyräs, et<br />
al. [5] reported changes of acoustic characteristics in deformed biological tissues, but neither used AE to<br />
describe the phenomena. Herein, we investigate the deformation dependence of acoustic dilatational<br />
waves in a number of different tumor tissues, indicating the need to use AE theory for analysis.<br />
Methods: Sections of different types of biological tissues were placed in a mechanical test system (MTS<br />
858 BIONIX Test System; 5000 N load cell). Target tissues were sandwiched between 2 ultrasonic<br />
transducers. Known strains were applied to the tissues and dilatational waves (at 2.25 MHz) from the top<br />
to the bottom surface of the tissue were recorded to calculate wave travel time. These data were used to<br />
compute the travel velocities.<br />
Results:<br />
Canine peri-anal adenoma (LS)<br />
Rat fibro-carcinoma (LS)<br />
Canine testicular tumor (LS)<br />
Figure 1: Wave velocity changes are plotted as a<br />
function of applied engineering strain.<br />
Circle (◦): Canine peri-anal adenoma<br />
Cross (H): Canine testicular tumor<br />
Diamond (): Rat fibro-carcinoma<br />
Square (): Poultry breast meat (muscle)<br />
Solid, dash and dash-dot line represents the<br />
nonlinear least square fitting (LS) of three<br />
different tumors.<br />
Results indicate that the various tumor tissues<br />
are substantially strain dependent in their<br />
acoustic behavior. In contrast, muscle shows<br />
little deformation dependence.<br />
Discussion and Conclusions: Except in muscle, acoustic characteristics of all other tissues are clearly<br />
dependent on applied strain. Different tissue types show different rate changes in their wave velocities.<br />
These patterns may be characteristic of the tumors and may have diagnostic value. The observed strain<br />
dependence suggests that AE should be used for analysis. In AE the dilatational wave velocity for this<br />
problem setting can be derived as:<br />
V e C<br />
e t e <br />
D<br />
<br />
<br />
<br />
11 11<br />
/<br />
In the above relation, strain dependent stiffness function, applied stress and material density are<br />
represented by C 11 e<br />
, t 11<br />
e and respectively. This relation indicates that the stiffness function for each<br />
material can be evaluated from measured velocities, known applied stresses and material density.<br />
References:<br />
[1] Hughes, D.S. and Kelly, J.L., Phys. Rev., 92, pp.1145-1149, (1953).<br />
[2] Pao Y. H, Sache W. and Fukuoka H, Physical Acoustics, Vol. XVII, Chap.2, (1984).<br />
[3] H. Kobayashi and R. Vanderby, Accepted J. of Applied Mechanics (<strong>2005</strong>).<br />
[4] J.J. Crsico et al., J. of BioMech. Eng. 120, pp. 321-326, (1998).<br />
[5] J. Töyräs, et al., Ultrasound Med. Bio. , pp.447-454, (2004).<br />
<br />
indicates Presenter<br />
128
034 NONCONTACT ULTRASOUND INDENTATION SYSTEM FOR ASSESSING BONE-TENDON<br />
JUNCTION TISSUES: PRELIMINARY RESULTS.<br />
Minhua Lu 1 , Yongping Zheng 1 , Hongbin Lu 2 , Qinghua Huang 1 , Ling Qin 2 .<br />
1 Department of Health Technology and Informatics, The Hong Kong Polytechnic University, Hong Kong, CHINA;<br />
2 Department of Orthopaedics and Traumatology, Chinese University of Hong Kong, Hong Kong, CHINA.<br />
Aims: The aim of this study is to use a novel water jet ultrasound indentation system [1] to measure the<br />
thickness and stiffness of healing bone-tendon junction (BTJ) of a rabbit model with and without low<br />
intensity ultrasound stimulation (LIUS) [2].<br />
Background: Many trauma surgeries and reconstructive surgeries involve re-establishment of the BTJ.<br />
Experimental and clinical findings show that a direct BTJ repair requires a longer period of immobilization<br />
which may be associated a postoperative weak knee. BTJ, such as patellar tendon-patella junction, is<br />
characterized with a unique transitional fibrocartilage zone, with calcified fibrocartilage connecting to bone<br />
and non-calcified fibrocartilage connecting to tendon. BTJ healing is slow due to the poor regenerative<br />
capacity of the fibrocartilage zone between bone and tendon. To enhance the tissue healing, researchers use<br />
postoperative mechanical stimulation, such as LIUS, to accelerate the BTJ repair and its restoration of<br />
fibrocatilage zone. It is necessary to assess the mechanical property and thickness of the transition zone<br />
during the healing process to monitor the formation of a fibrocatilage layer.<br />
Methods: Mature female New Zealand White rabbits (18 weeks old) were used for the experiments. One of<br />
the rabbit knees was approached and the distal 1/3 of the patella was removed. The patellar tendon was<br />
then directly sutured to the proximal patella followed by immobilization for 12 weeks. The opposite knee<br />
was served as a control. The ultrasound water indentation system was comprised of a focused high<br />
frequency ultrasound transducer, a water beam ejector, and a pressure sensor. The water beam with a<br />
diameter of 1.9 mm served as a compressor as well as a medium for ultrasound propagation. The tissue<br />
deformation was estimated from the ultrasound echoes reflected from the tissue. During water<br />
indentation, the knee joint was fixed with the patella tendon facing up to the water jet perpendicularly.<br />
The system then scanned along the patella tendon direction at one pressure level. The scan was repeated<br />
under different pressure levels. The variation of the tissue structure and stiffness was obtained by<br />
comparing the sequential ultrasound signals collected under different compression levels.<br />
Results: Figures 1 and 2 show the thickness and stiffness distributions of the transition zone from patella<br />
to tendon of the intact and postoperative samples. There was little formation of new bone of the knee with<br />
surgery due to limited time, so only the distal patella and tendon with scars were assessed as the<br />
postoperative sample. It was found that, although the thickness of the distal of the patella was not<br />
significantly changed, its stiffness decreased. This decrease may be due to the degeneration of the articular<br />
cartilage caused by the surgery. The thickness of the tendon increased due to the formation of scar.<br />
Conclusions: It is still a challenge to measure the mechanical properties of small specimens. Our<br />
ultrasound indentation system using water jet indentation can load on the tissues nondestructively to<br />
measure the thickness and stiffness. Preliminary results show its potential to monitor the new formation<br />
of cartilage layer during the healing process of BTJ.<br />
Acknowledgements: This project was partially supported by the Research Grant Coucil of Hong Kong (PolyU<br />
5245/03E) and The Hong Kong Polytechnic University.<br />
References:<br />
[1] Lu MH, et al. Water jet ultrasound indentation. Ultrasound Med Biol 31: 817-26, <strong>2005</strong>.<br />
[2] Qin L, et al. Partial patellectomy rabbit model. Med Sci Sports Exer 31:502-6, 1999.<br />
Thickness (mm)<br />
5 Intact sample<br />
4 Postoperative sample<br />
3<br />
2<br />
1<br />
0<br />
Patella Distal Junction Tendon<br />
Figure 1: The Thickness Distribution of the BTJ Tissues.<br />
Stiffness (N/mm)<br />
35<br />
30<br />
25<br />
Intact sample<br />
Postoperative sample<br />
20<br />
15<br />
10<br />
5<br />
0<br />
Patella Distal Junction Tendon<br />
Figure 2: The Stiffness Distribution of the BTJ Tissues.<br />
<br />
indicates Presenter<br />
129
062 MECHANICAL MEASUREMENT OF ELASTIC PROPERTIES OF BOVINE LIVER AND HUMAN<br />
PROSTATE UNDER COMPRESSION.<br />
Man Zhang 1 , Zhe C. Wu 1 , Deborah J. Rubens 2 , Kevin J. Parker 1 .<br />
1 Electrical and Computer Engineering, 2 Radiology Departments, University of Rochester,<br />
Rochester, NY, USA.<br />
Aims: The goal of this study is twofold: first, to establish a reliable and accurate technique for measuring<br />
the elastic properties of soft tissues; and second, to compare mechanical measurement results with those<br />
obtained from the sonoelastography shear wave interference method.<br />
Background: Over the past two decades, ultrasound elasticity imaging has been continuously developed<br />
for imaging soft tissue elasticity. However, fundamental knowledge of mechanical properties of soft tissue<br />
is lacking. In this study, we proposed the tissue stress-relaxation experiment and the Kelvin-Voigt<br />
fractional derivative (KVFD) model to clarify the frequency-dependent elastic properties of bovine liver<br />
(normal and high-intensity focused ultrasound (HIFU) ablated) and human prostate (normal and cancer).<br />
Methods: Cylindrical samples (10 mm diameter, 8 mm thickness) were acquired from normal and HIFU<br />
ablated liver tissues. During the experiment, a 3% compressional strain was applied to measure the<br />
stress-relaxation data over 1000 seconds. After that, the stress-relaxation curve of each sample was fit to<br />
the KVFD model, in which α and η are the two important parameters. Finally, the complex elastic<br />
modulus at any frequency was obtained by the Fourier transform of the time domain response. The same<br />
procedure was also applied to the human prostate samples. Sonoelastography was used to visualize<br />
shear wave interference patterns. Shear wave velocity, and thus shear stiffness can be estimated from<br />
those patterns. A piece of fresh bovine liver was placed in between a pair of shear wave sources and the<br />
shear wave interference was recorded and analyzed to estimate the liver’s shear stiffness.<br />
Results: The α ratio and the η ratio (Table 1) between the HIFU lesion and the normal liver are about 2:1<br />
and 9:1, respectively. The η ratio reflects the stiffness contrast between the two tissues. Figure 1 shows<br />
the frequency-dependent elastic properties of three types of liver tissues. The complex elastic modulus<br />
slightly increases with frequency. The shear wave interference method estimated that the Young’s<br />
modulus of a bovine liver sample was 2.7 kPa at 50 Hz while it was 2.9 kPa from the mechanical testing.<br />
Shear wave interference experiments at more frequencies are scheduled. We have also tested over<br />
30 samples from 11 different human prostates. For normal prostate samples, we have found that an<br />
average value for the elastic constant is 17.5 ± 2.1 kPa at 100 Hz. Cancerous prostate samples were<br />
tested as well. In particular, 3 samples were acquired from one gland, each containing 90%, 70% and 0%<br />
cancerous tissue, respectively. The stiffness contrasts of these samples are 2.7:2:1.<br />
Conclusions: The stress-relaxation test produces repeatable results which fit well to the KVFD model.<br />
Sonoelastography shear wave interference method provides preliminary estimation of shear stiffness of<br />
the bovine liver, which agrees with the mechanical measurement results. Elastic properties of normal and<br />
cancerous human prostates are systematically tested and the preliminary results are provided.<br />
Acknowledgements: This study was partly supported by NIH grant 5 RO1 AG016317-05.<br />
Normal<br />
(n=8)<br />
4’ HIFU<br />
(n=8)<br />
2’ HIFU<br />
(n=3)<br />
η<br />
(kPa sec α )<br />
α R 2<br />
7.127 0.108 0.956<br />
66.760 0.208 0.985<br />
27.049 0.190 0.987<br />
Complex Young's Modulus (Pa)<br />
10 6 |E*| from time domain curve fitting<br />
10 5<br />
10 4<br />
10 3<br />
Frequency (Hz)<br />
4' HIFU<br />
Normal<br />
2' HIFU<br />
10 2<br />
10 -1 10 0 10 1 10 2 10 3<br />
Table 1: The parameters of the KVFD<br />
model from the curve fitting.<br />
Figure 1: Frequency dependent elastic<br />
moduli of bovine liver.<br />
<br />
indicates Presenter<br />
130
069 VISCOELASTIC AND ULTRASONIC PROPERTIES OF THE UTERUS.<br />
M.Z. Kiss 1 , T. Varghese 1,2 , M.A. Hobson 1 , M.A. Kliewer 3 , J. Harter 4 , E.M. Hartenbach 5 .<br />
1 Medical Physics, 2 Biomedical Engineering, 3 Radiology, 4 Pathology, 5 Obstetrics and Gynecology<br />
Departments, 1300 University Ave., Room 1530, University of Wisconsin-Madison, Madison, WI, USA.<br />
Aims: The viscoelastic properties of uterine and cervical tissue have been investigated. Leiomyomas (fibroids)<br />
and adenomyosis, a condition where soft endometrial tissue invades the myometrium if the uterus,, have<br />
similar appearances on conventional ultrasound images, so the mechanical properties of normal and<br />
pathological tissues are of interest in order to develop elastographic methods for differentiating between these<br />
two conditions, since the clinical treatments for the two conditions is very different.<br />
Background: Dysfunctional uterine bleeding is a common indicator of uterine abnormalities. Benign<br />
endometrial atrophy and fibroids are among the common causes, especially in postmenopausal women.<br />
However, approximately 10% to 30% of women will be found to have endometrial cancer. Dysfunctional<br />
uterine bleeding in premenopausal women is usually the result of benign conditions, such as<br />
leiomyomas, endometrial polyps and adenomyosis. However, treatment of each condition is different, so<br />
differentiation is clinically important because treatment for the two conditions is very different. Currently<br />
MRI is the only imaging modality capable of distinguishing between these two conditions, leiomyomas<br />
and adenomyosis.<br />
Methods: Uterine and cervical specimens from 14 patients were excised from bulk tissue and cut to a<br />
useful geometry (typically rectangular on the order of 10 15×5 mm) and placed in Bose/Enduratec<br />
ELF 3220, a dynamic testing device. The complex modulus was determined by applying a periodic strain<br />
amplitude of 1 or 2% (with a precompression strain of 1 or 2%, respectively), and a frequency from<br />
0.1 - 100 Hz, and measuring the force response at the load cell. Additionally, tests were conducted where<br />
the sample was strained periodically at a frequency of 1Hz at amplitudes ranging from 1 to 10% (at a<br />
precompression strain of 2 or 5%). For ultrasonic testing, samples were subjected to simple through<br />
transmission tests to determine the ultrasonic attenuation in the frequency range of 5 – 10 MHz using an<br />
unfocused broadband transducer with central frequency of 7.5 MHz.<br />
Results: Experiments show that the complex modulus for both the cervix and the uterus generally<br />
increased with increasing frequency from 25 kPa at 0.1 Hz up to 60 kPa at 100 Hz. The uterus and cervix<br />
have similar moduli at low frequencies, and the uterus is slightly stiffer at higher frequencies. The phase<br />
of the modulus generally increased from 0.25 to 0.40 over the same frequency range for both the cervix<br />
and the uterus. When the age of the patient is considered, it is revealed that the uterine modulus is<br />
inversely proportional to age, while the cervix modulus is proportional to age. The ultrasonic attenuation<br />
experiments show that the cervix is far more attenuating than the uterus as a function of ultrasound<br />
frequency, with the cervix following a power law exponent of 2.1 and the uterus going as 1.6. Attenuation<br />
of both the cervix and the uterus also tends to increase with patient age. Uterine fibroids tended to<br />
attenuate ultrasound at a rate similar to that of the cervix, but there was no major distinction between<br />
the leiomyomas and normal uterus.<br />
Conclusions: Characterization of the viscoelastic properties of in vitro uterine and cervical specimens<br />
may eventually lead to improved elastographic methods of diagnosing certain pathologies. Fibroids tend<br />
to be stiffer than surrounding normal tissue, implying that elastographic image contrast may be improved<br />
when certain patient attributes are considered, such as age, number of children and history of illness.<br />
Acknowledgements: This research is supported in part by NIH grant T32CA09206.<br />
<br />
indicates Presenter<br />
131
105 EVALUATION OF ANISOTROPY IN THE NORMAL PLANTAR SOFT TISSUES: SHEAR<br />
MODULUS FOR SHEARING DEFORMATION AND COMPRESSIVE DEFORMATION.<br />
JB Weaver 1 , TB Miller 2 , MM Doyley 1 , PR Perrinez 2 , H Wang 2 , YY Cheung 1 , JS Wrobel 3,4 ,<br />
FE Kennedy 2 , KD Paulsen 2 .<br />
1 Department of Radiology, Dartmouth-Hitchcock Medical Center, Lebanon, NH, USA; 2 Thayer<br />
School of Engineering, Dartmouth College, Hanover, NH, USA; 3 VA Medical Center, WRJ, VT, USA;<br />
4 Department of Community and Family Medicine, Dartmouth Medical School, Hanover, NH, USA.<br />
Introduction: Magnetic resonance elastography (MRE) [1] is capable of imaging the intrinsic mechanical<br />
properties of plantar soft tissues such as the shear modulus () [2] and damping coefficient [3, 4]. The<br />
intrinsic mechanical properties of the plantar soft tissues are important in the context of evaluating the<br />
weight bearing structures of the foot that are at high risk for ulcers and amputation in diabetic patients.<br />
At least three benefits are possible:<br />
a) Following and evaluating the progression of diabetic patho-physiologic deterioration of the weight<br />
bearing structures.<br />
b) Optimizing the development of prostheses for deformed diabetic feet that are susceptible to<br />
ulceration and amputation at large cost to both the patient and to the health care system.<br />
c) Understanding how the weight bearing structures in the foot function in weight distribution.<br />
The key question we are using MRE to address is: Are the plantar tissues more rigid during shearing<br />
deformation or during compressive deformation? The question is relevant to our understanding of how<br />
pressures are generated during normal and abnormal gates which is crucial to understanding the<br />
formation of ulcers that lead to amputation.<br />
Methods: We used steady-state dynamic MRE [1] to measure the in the heel fat pad twice in each of<br />
three healthy subjects. The two measurements, c and s , were acquired using different patterns of<br />
vibration: moving the plate on which the heel was resting 1) superior-inferior and 2) anterior-posterior.<br />
The heel remained fixed in the same position during both acquisitions. The direction of motion as well as<br />
the was found for all points within the heel. The induced motion is a complicated function of the<br />
intrinsic properties of the soft tissue as well as the geometry of the soft tissue and bones. The points<br />
which vibrated along the direction of weight bearing in one vibration pattern and in the plane normal to<br />
the direction of weight bearing in the other vibration pattern were found. The change in at those points<br />
represents magnitude of the anisotropy. Two controls were used: the reproducibility of MRE<br />
measurements (3.5%) and the variation in at points where no change in direction was observed between<br />
the two acquisitions. In addition, we imaged gel phantoms to evaluate accuracy and resolution.<br />
Results: The MRE is accurate to within 10% to 20% and reproducible to 3.5%. In two subjects, aged 26<br />
and 30, the difference between c and s was less than that in control points. In the third subject, aged<br />
36, the difference between c and s was twice the difference in control points. In two subjects, the mean<br />
c and s for all control points were significantly different. The effect was probably produced by a change<br />
in the pressure applied by the subject between the two acquisitions; in any event the bias was removed<br />
from the comparison.<br />
Conclusions: MRE can quantitatively image the mechanical properties of plantar soft tissues in vivo with<br />
excellent accuracy and reproducibility. The shear modulus of normal heel fat pads for deformation<br />
perpendicular to the direction of weight bearing is essentially the same as that determined for<br />
deformation along the weight bearing axis. However, there is some indication that aging might introduce<br />
a difference suggesting that diseases mimicking aging such as diabetes might also introduce differences.<br />
Acknowledgements: Supported by R01-DK-063013, R01-NS-33900 and P01-CA-80139.<br />
References:<br />
[1] JB Weaver, EEW Van Houten, MI Miga, FE Kennedy, KD Paulsen, Med Phys, 28(8):1620-1628, 2001.<br />
[2] MM Doyley, JB Weaver, EW Van Houten, FE Kennedy, KD Paulsen, Med Phys, 30(4):495-504, 2003.<br />
[3] K.D. Paulsen, E.E.W. Van Houten, M.M. Doyley, J.B. Weaver: IEEE NIBIE, July, p. 157-160, 2002.<br />
[4] R Sinkus, et. al., Mag. Reson. Med. 53:372–387, <strong>2005</strong>.<br />
<br />
indicates Presenter<br />
132
Session MIP-3: Methods for Imaging Elastic Tissue Properties – III<br />
Wednesday, October 19 2:15P – 3:00P<br />
085 DIRECT INVERSION METHOD IN SHEAR WAVE SPEED RECONSTRUCTION IN ELASTOGRAPHY.<br />
K. Lin 1 , J. R. McLaughlin 1 .<br />
1 Rensselaer Polytechnic Institute, Troy, NY, USA.<br />
Aims: The goal of this work is to apply and justify stable probabilistically based numerical differentiation<br />
schemes in our elastography inverse problem to reconstruct high quality images of tissue stiffness<br />
properties in isotropic media and anisotropic media. The data we use are time-dependent displacement<br />
data generated in the laboratory of Mathias Fink’s group from phantoms. Further investigation is taken<br />
in in vivo data.<br />
Background: Probabilistically based difference schemes to compute numerical derivatives.<br />
Methods: Direct Inversion Method based on wave equation in isotropic and anisotropic, linearly elastic<br />
media, stable hybridization of averaging scheme and median scheme, and total variation de-noising<br />
technique.<br />
Results: First order accuracy is achieved by all numerical differentiation schemes in the Gaussian noise<br />
case, while the hybrid method shows robustness to extreme noise in data. An image of shear wave speed<br />
reconstruction recovers the position and shape of the stiff inclusion in an isotropic phantom accurately.<br />
An image of longitudinal shear modulus also recovers the shape and position of the fiber-strengthened<br />
transversely isotropic inclusion in anisotropic phantom.<br />
Conclusions: We have presented the results of the order of accuracy and stability of probabilistic<br />
numerical differentiation methods. A single numerical scheme works well in a specific noise case, while<br />
combination of different methods tends to be more accurate and robust to outliers in the case of<br />
unknown noise. Application of those methods has produced high quality images that capture the<br />
inclusions in phantoms much more accurately compared with standard ultrasound images with the same<br />
experimental settings.<br />
Acknowledgements: We thank Mathias Fink’s group for providing phantom data and Ernest Madsen for<br />
building a new anisotropic phantom. We also want to acknowledge discussion with Daniel Renzi,<br />
Jeong-Rock Yoon and Jens Klein.<br />
References:<br />
[1] Lin Ji, Joyce R. McLaughlin, Daniel Renzi and Jeong-Rock Yoon, “Interior Elastodynamics Inverse Problem:<br />
Shear Wave Speed Reconstruction in Transient Elastography”, Inverse Problem 19 (2003) S1-S29.<br />
[2] Robert S. Anderssen, Markus Hegland, “For Numerical Differentiation, Dimensionality Can Be a<br />
Blessing”, Mathematics of Computation, Vol.68, No.227, Pages 1121-1141.<br />
[3] Rudin L I, Osher S and Fatemi E 1992, “Nonlinear Total Variation Based Noise Removal Algorithm”,<br />
Physica D 60, 259-268.<br />
[4] Stainley Osher, Martin Burger, Donald Goldfrab, Jinjun Xu, and Wotao Yin, “Using Geometry and<br />
Iterated Refinement for Inverse Problem (1): Total Variation Based Image Restoration”, Journal of<br />
Computational Physics, v77, 1988, pp.439-471.<br />
[5] Sandrin L, Tanter M, Catheline S and Fink M 2002, “Shear Modulus Imaging with 2-D Transient<br />
Elastography”, IEEE Trans. Ultrason. Ferroelectr. Freq. Control, 49, 426-435.<br />
[6] J Bercoff, M Tanter and Mathias Fink, “Supersonic Shear Imaging: A New Technique for Soft Tissue<br />
Elasticity Mapping”, IEEE Transactions on Ultrasonics, Ferroelectrics, and Frequency Control,<br />
Vol.51, No.4, April 2004.<br />
[7] David C. Hoaglin, Frederick Mosteller, John W. Tukey, “Understanding Robust and Exploratory Data<br />
Analysis”, Wiley, c1983.<br />
[8] James F. Greenleaf, Mostafa Fatemi and Michael Insana, “Selected Methods for Imaging Elastic<br />
Properties of Biological Tissues”, IEEE Trans. Ultrason. Freq. Control, 49, 1363-1374.<br />
<br />
indicates Presenter<br />
133
015 ISSUES IN REAL-TIME ACOUSTIC RADIATION FORCE IMPULSE IMAGING.<br />
GE Trahey 1 , GF Pinton 1 , ML Palmeri 1 , RR Bouchard 1 , JJ Dahl 1 .<br />
1 Duke University, Durham, NC, USA.<br />
Aims: Acoustic Radiation Force Impulse (ARFI) imaging is useful for characterizing localized mechanical<br />
properties of tissue [1]. In effort to generate an ARFI imaging system capable of displaying tissue<br />
displacement in real-time, several considerations must be addressed in order to improve the frame rate of<br />
the ARFI imaging system. The four main issues in ARFI frame rate are patient safety, observation time<br />
along a line of sight, number of "push" locations, and processing/flow of data.<br />
Background: In ARFI imaging, a localized, long-duration (~30 μs) radiation force (pushing pulse) is used<br />
to generate small displacements (1-10 μm) in tissue. The response of tissue is measured using imaging<br />
pulses to track these displacements. The pushing pulses used by ARFI imaging generate heat in the<br />
tissue as the acoustical wave is absorbed. As the ARFI frame rate increases, so does the amount of heat<br />
generated [2]. Tissue heating can be controlled by the amount of observation time (i.e. the length of time<br />
for tracking the displacement at a given location), however as this time increases, ARFI frame rate suffers.<br />
The size of the field of view (FOV) affects both heating and data acquisition time. Frame rate will also<br />
depend on the computational algorithms and data flow.<br />
Methods: We propose two methods for improving the frame rate in ARFI imaging without compromising<br />
patient safety. These methods include parallel receive beamforming to reduce the number of pushing<br />
pulses (and therefore decrease the heat generated in tissue) without decreasing the FOV, and interleaving<br />
tracking pulses to decrease the data acquisition time without compromising the observation time. We<br />
have created custom beam sequences on a Siemens Antares TM scanner to implement these parallel and<br />
interleaved tracking methods in phantom and ex vivo experiments and compare with FEM simulations.<br />
Simulations were also used to compare the jitter, bias, and computational cost of several displacement<br />
tracking algorithms. These tracking methods include normalized cross-correlation, one-dimensional<br />
autocorrelation, and two-dimensional autocorrelation.<br />
Results: Displacement images produced by parallel tracking ARFI methods were compared to those<br />
produced by standard ARFI methods. Displacements varied between the two methods immediately after<br />
cessation of the pushing pulse, however, as the shear wave induced by the pushing pulse propagated<br />
from the initial pushing position, the displacements became uniform across the parallel beams. Given<br />
this delay, the two images appear nearly identical. Interleaving the tracking pulses decreased the amount<br />
of time necessary to acquire an ARFI frame. The magnitude of artifacts observed using the interleave<br />
method was dependent on the number and spacing of locations for which tracking was interleaved. The<br />
artifacts result from shear wave propagation between push locations.<br />
Normalized cross-correlation yielded the least jitter and bias for estimating tissue displacement, however,<br />
it required the most computational time. One-dimensional autocorrelation yielded the most jitter and bias<br />
for its estimates, but required little computational effort. Two-dimensional autocorrelation showed jitter<br />
levels near that of cross-correlation but had greater bias. We present phantom and ex vivo ARFI images<br />
using parallel receive beamforming, pulse interleaving, and several tracking schemes. We discuss the<br />
frame rates achievable using these methods and the resultant tissue heating levels.<br />
Conclusions: The proposed tracking methods improve ARFI frame rate without compromising patient<br />
safety. Parallel tracking provides near identical results to standard ARFI methods, however, the amount<br />
of time necessary for the shear wave to propagate far enough to even the displacement across the parallel<br />
tracking beams depends on the stiffness of the tissue and the F/# of the pushing pulse. Interleaving the<br />
tracking pulses improves ARFI frame rate, but can introduce image artifacts if the shear waves from<br />
adjacent pushing locations overlap during the observation time.<br />
Acknowledgements: This work is supported by NIH grants R01- HL075485-02 and R01-EB002132-04.<br />
Technical support was provided by Siemens Medical Solutions USA, Inc. in Issaquah, WA.<br />
References:<br />
[1] K. Nightingale, M. Soo, R. Nightingale, and G. Trahey, Acoustic radiation force impulse imaging:<br />
In vivo demonstration of clinical feasibility. Ultrasound Med. Biol., vol. 28, no. 2, pp. 227-235, 2002.<br />
[2] M. Palmeri and K. Nightingale, On the thermal effects associated with radiation force imaging of soft<br />
tissue. IEEE Trans. Ultrason., Ferroelect., Freq. Contr., vol. 51, no. 5, pp. 551-565, 2004.<br />
<br />
indicates Presenter<br />
134
073 IN VITRO MEASUREMENT AND IMAGING OF THE STRAIN AT THE BOVINE ACL-BONE INSERTION.<br />
Elisa E Konofagou 1 , Jeff P Spalazzi 1 , Simon D Fung-kee-Fung 1 , Helen L Lu 1 .<br />
1 Columbia University, Department of Biomedical Engineering, 1210 Amsterdam Avenue,<br />
New York, NY 10027, USA.<br />
Aims: The anterior cruciate ligament (ACL) functions as a mechanical stabilizer in the tibiofemoral joint.<br />
Over 250,000 Americans each year suffer ACL ruptures and tears, making the ACL the most commonly<br />
injured ligament of the knee. A long term goal in tissue engineering has been to regenerate the ACL-bone<br />
interface. To this end, an in-depth understanding of the structural and mechanical properties of the<br />
transition zone is needed in order to define relevant design parameters.<br />
Background: Song et al. [1], using a Finite-Element Modeling (FEM) model of ACL, predicted that stress<br />
was transferred from the ligament to bone at the femoral insertion, and the magnitude of the stress was<br />
reduced near the tibial insertion compared to the ACL proper. However, experimental determination of<br />
the mechanical properties at the interface has been difficult due the small area (
096 FFT ANALYSIS OF THE PERIODIC STRUCTURES IN HAVERSIAN BONE BASED ON<br />
SCANNING ACOUSTIC MICROSCOPY (SAM).<br />
J. Lawrence Katz 1,2 , Anil Misra 2 , Orestes Marangos 2 , Yong Wang 1 , Paulette Spencer 1 .<br />
1 University of Missouri-Kansas City, 3161 SOD, 650 East 25 th Street, Kansas City, MO 64108,<br />
USA; 2 University of Missouri-Kansas City, SCE, Flarsheim Hall, 5100 Rockhill Road, Kansas City,<br />
MO 64110, USA.<br />
Aims: To apply fast Fourier transform (FFT) analysis to the pseudo-periodic variations, observed in<br />
elastic properties in both haversian (osteonal) and interstitial lamellae in human cortical bone, using<br />
scanning acoustic microscopy (SAM) at high frequencies (400-600MHz).<br />
Background: Both the Olympus UH3 SAM (Olympus Co., Japan) and the Krämer KSI 2000 SAM (Krämer<br />
Scientific Instuments, Germany) have been used to study human femoral cortical bone at 400 and 600<br />
MHz. The Olympus UH3 SAM was used to study specimens of haversian (osteonal) bone from a 60+ male<br />
cadaver. The Krämer KSI 2000 SAM was used in a study of both female and male haversian (osteonal)<br />
bone as a function of age, (20s, 60s and 70s) at different orientations relative to their femur’s long axis.<br />
Both the osteonic lamellae and the interstitial lamellae of cortical bone exhibit uniform variations in their<br />
elastic properties from lamella to lamella, i.e. the material properties of adjacent lamellae vary<br />
systematically from stiff to less stiff. This appears on the SAM images as systematic pseudo periodic<br />
variations in gray levels, lighter to darker to lighter and so on, in both the osteonic and interstitial<br />
lamellae reflecting the variations in their elastic properties. These pseudo-periodic variations permit the<br />
application of fast Fourier transform (FFT) analysis to the SAM images.<br />
Methods: Using one of the available math packages, such FFT images have been computed for all the<br />
SAM images of interest. Points on the FFT images corresponding to the principal directions of periodicity<br />
were then selected for the application of the back FFT analysis. Each back FFT calculation provided the<br />
image of the lamellae orientations related to the point used. These back images were then superimposed<br />
to reconstruct the FFT counterpart of the original SAM image in each case.<br />
Results: The reconstructed image often provided more details than seen on the original SAM image, as it<br />
eliminates much of the artifacts imposed on the SAM image by the specimen, e.g. asperities not removed<br />
during surface preparation, regions out of the focal plane, preparation cracks, etc. The FFT technique<br />
also has provided a rapid method of obtaining average thicknesses of both the osteonal and interstitial<br />
lamellae.<br />
Conclusions: Application of FFT analysis to SAM measurements of cortical bone properties has provided<br />
the means for obtaining more details inherent in the micrographs by eliminating or reducing preparation<br />
artifacts. The analysis is now being applied to SAM studies of similar systematic pseudo periodic<br />
variations in gray levels observed in human femoral trabecular bone in order to compare lamellar average<br />
thicknesses between the two types.<br />
Acknowledgements: A contribution of the University of Missouri-Kansas City Center for Research on<br />
Interfacial Structure and Properties (UMKC-CRISP). This research was supported in part by RO1<br />
DE14392 (PS), K25 DE015281 (YW) from the National Institute of Dental and Craniofacial Research, NIH,<br />
and NIH High-End Instrumentation Grant S10 RR16710 (PS).<br />
<br />
indicates Presenter<br />
136
108 SHEAR STIFFNESS IDENTIFICATION USING MOVING INTERFERENCE PATTERNS IN<br />
SONOELASTOGRAPHY.<br />
Joyce R. McLaughlin 1 , Daniel Renzi 1 .<br />
1 Rensselaer Polytechnic Institute, Troy, NY, USA.<br />
Aims: The target of this work is to produce an image of tissue where the imaging function is a measure of<br />
shear stiffness. It is motivated by the fact that shear stiffness is the tissue elastic property that is felt in a<br />
palpation exam. Recently two new experiments have been proposed to characterize the elasticity of soft<br />
tissue using sonoelastography. In both experiments, a moving interference pattern is observed because of<br />
the interactions of the two oscillations at nearby frequencies. The goal of this work is to devise and test<br />
algorithms to calculate the shear wave speed, or an imaging functional closely related to the shear wave<br />
speed, using the arrival times of the moving interference patterns.<br />
Background: Recently two new experiments have been proposed to characterize the elasticity of soft<br />
tissue using sonoelastography. The first experiment, the crawling wave experiment, uses two vibration<br />
sources oscillating at nearby but different frequencies, each of which create a shear wave that travels<br />
through the tissue. The second experiment, the holographic wave experiment, uses one vibration source<br />
together with an oscillation of the ultrasound transducers that record the measurements. The vibration<br />
source and the transducers are oscillated at nearby but different frequencies. In both experiments:<br />
(1) one component of the vibration amplitude is measured using sonoelastography; and<br />
(2) a moving interference pattern is observed because of the interactions of the two oscillations at<br />
nearby frequencies.<br />
By making the two vibration frequencies close enough, the interference pattern can be made to move at a<br />
very small fraction of the shear wave speed. This allows the moving interference pattern to be imaged with<br />
a high effective frame rate (frame rate divided by interference pattern speed) in real time with a standard<br />
Doppler ultrasound machine. In the holographic wave experiment, the shear wave speed can be directly<br />
calculated from the moving interference pattern speed, and in the crawling wave experiment, the moving<br />
interference pattern speed will be used as an imaging functional for the shear wave speed.<br />
Methods: To generate our images, we first derive formulas relating the moving interference pattern speed<br />
and the shear wave speed under the assumption that a geometric optics expansion is valid. Then we find<br />
the arrival times of the moving interference pattern using a cross-correlation procedure. These arrival<br />
times are related to the moving interference pattern speed via a first order nonlinear partial differential<br />
equation called the Eikonal equation. The moving interference pattern speed is calculated using an<br />
inverse Eikonal solver we have previously developed named the level curve method.<br />
Results: We test our algorithm on data obtained from a phantom experiment performed at the University<br />
of Rochester Center for Ultrasound. We were able to accurately recover a stiff circular inclusion one<br />
centimeter in diameter.<br />
Conclusions: We have developed a new algorithm to image the speed of moving interference patterns.<br />
This algorithm is composed of two sub-algorithms. The first sub-algorithm finds the arrival times of one<br />
of the stripes of the moving interference pattern. The second sub-algorithm takes as input the arrival<br />
times found by the first sub-algorithm, and finds the moving interference speed by solving the inverse<br />
Eikonal equation using the inverse level curve method for the Arrival Time Algorithm. With data from a<br />
crawling wave experiment, a multiple of the speed of the moving interference pattern is used as an<br />
imaging functional for the shear stiffness because the relationship between the moving interference<br />
pattern speed and the shear stiffness is quite complicated. For the holographic wave experiment, there is<br />
a simple linear relationship between the moving interference speed and the shear wave speed, so in that<br />
case we image the shear wave speed. We have tested our algorithm with data obtained by Zhe Clark Wu<br />
in the laboratory of Kevin Parker, in the Rochester Center for Biomedical Ultrasound at the University of<br />
Rochester. They performed both the one and two frequency experiments using a tissue mimicking Zirdine<br />
phantom containing a 1cm diameter circular inclusion. We have obtained very good shear stiffness<br />
images with both sets of experimental data.<br />
Acknowledgements: We would like to thank Zhe Clark Wu and Kevin Parker for providing us with<br />
phantom data to test our algorithms.<br />
<br />
indicates Presenter<br />
137
014 ASSESSMENT OF MECHANICAL PROPERTIES OF PVA-C WITH FOUR DIFFERENT<br />
ELASTOGRAPHIC METHODS.<br />
Jean-Luc Gennisson 1 , Jérémie Fromageau 1 , Cédric Schmitt 1 , Roch L. Maurice 1 , Rosaire Mongrain 2<br />
and Guy Cloutier 1 .<br />
1 Laboratory of Biorheology and Medical Ultrasonics, University of Montreal Hospital, Pavilion J.A<br />
de Sève (Rm Y-1619), 2099 Alexandre de Sève, Montréal, Québec, H2L 2W5, CANADA;<br />
2 Mechanical Engineering Department, McGill University (Rm 369), 817 Sherbrooke Street West,<br />
Montréal, Québec, H3A 2K6, CANADA.<br />
Aims: In the field of elastography, tissue mimicking phantoms are very useful and essential to establish<br />
the validity of a given technique. Usually, these are made of agar, gelatin, or Polyvinyl Alcohol Cryogel<br />
(PVA-C). This study is first dedicated to mechanically characterize PVA-C for elastographic applications<br />
through two parameters: the Young’s modulus (E) and the Poisson’s ratio (). The second purpose is to<br />
compare different ultrasound elastographic methods to mechanical indentation instruments, considered<br />
to be the gold standard.<br />
Methods: The PVA-C mechanical properties were studied as a function of the number of freeze-thaw<br />
cycles imposed to the material to control the sample stiffness. The 24h cycles were performed in a<br />
temperature controlled chamber. A cycle was constituted of two maximum/minimum thresholds, at<br />
+20°C and -20°C during 8h 40min each and two periods of change from the extremes lasting 3h 20min<br />
(slope of ±0.2°C/min). The influence of the number of cycles (from 1 to 10 cycles) and of the scatterer<br />
concentrations added (Sigmacell particles from 1% to 4%) were investigated. To make the assessment<br />
easier, the phantom geometry has been defined as a cylinder of 60mm diameter and of 15mm thick. For<br />
each experiment, the speed of sound, speed of shear waves and density were also assessed.<br />
Four different elastographic methods were used: three static elastography techniques based on a scaling<br />
factor estimation [1], a Lagrangian estimator (1) [2] and an adapted Lagrangian estimator (2) [3]; and a<br />
dynamic method, the transient elastography [4] based on shear wave propagation. Specific inverse<br />
problems applied to each method allowed to recover the Young’s modulus. The elastographic assessments<br />
were compared to mechanical tests, with a commercial (Enduratec, ELF 3200, Minnetonka, MN, USA)<br />
and a homemade compression device. For the Enduratec, the tests were done in compression and<br />
stretching. All the measurements have been performed under small strain ( 0.4999)<br />
with a Young’s modulus very close to those found in biological soft tissues (25kPa < E < 650kPa). A<br />
covariance statistical analysis was used to compare each method with the tensile test performed on the<br />
Enduratec to confirm that each method is relevant to quantify elastic Young’s modulus.<br />
Figure 1:<br />
Young's moduli (kPa)<br />
700<br />
600<br />
500<br />
400<br />
300<br />
200<br />
100<br />
0<br />
Enduratech Compression<br />
Homemade instrument<br />
Enduratech Tensile<br />
a) Transient<br />
b)<br />
Lagrangian1<br />
Lagrangian2<br />
Scaling factor<br />
1 2 3 4 5 6 7 8 9 10<br />
1 2 3 4 5 6 7 8 9 10<br />
Number of freeze-thaw cycles<br />
Number of freeze-thaw cycles<br />
Mean Young’s moduli estimated with different methods as a function of the number of freeze-thaw cycles,<br />
a) mechanical tests and b) elastographic methods.<br />
References:<br />
[1] Fromageau J. et al., “Estimation of Small Time-Scaling Factor using the Hilbert Transform”, Submitted to IEEE-<br />
Signal Processing, <strong>2005</strong>.<br />
[2] Maurice R.L. et al., “Lagrangian speckle model and tissue-motion estimation – Theory”, IEEE-Trans. Med. Imag.,<br />
18(7), pp. 593-603, 1999.<br />
[3] Schmitt C. et al., “Development of non-invasive vascular elastography for carotid artery plaque assessment”,<br />
Proc. IEEE-Ultrasonics Symposium, <strong>2005</strong>.<br />
[4] Sandrin L. et al., “Shear elasticity probe for soft tissues with 1D transient elastography.”, IEEE-Trans. Ultra.<br />
Ferro. Freq. Cont., 49(4), pp. 436-446, 2002.<br />
<br />
indicates Presenter<br />
138
139
140<br />
Lakeway Inn Floor Plan
Please Fill Out Both Sides<br />
Conference Evaluation and Questionnaire<br />
OVERALL CONFERENCE:<br />
SCORING: Very Poor Mid Excellent<br />
Overall Conference Evaluation 1 2 3 4 5<br />
Additional comments:<br />
SCIENTIFIC PROGRAM<br />
SCORING: Very Poor Mid Excellent<br />
Quality of the Presentations 1 2 3 4 5<br />
Relevance of Presentations to the Conference’s Theme 1 2 3 4 5<br />
Time Allotted for Presentations 1 2 3 4 5<br />
Time Allotted for Discussion 1 2 3 4 5<br />
Poster Session 1 2 3 4 5<br />
Dinner Guest Lecturer 1 2 3 4 5<br />
Tutorials 1 2 3 4 5<br />
Equipment Exhibit 1 2 3 4 5<br />
Student Participation 1 2 3 4 5<br />
Additional comments:<br />
CONFERENCE MATERIALS:<br />
SCORING: Very Poor Mid Excellent<br />
Printed <strong>Proceedings</strong> Book 1 2 3 4 5<br />
CD <strong>Proceedings</strong> 1 2 3 4 5<br />
Other Registration Materials 1 2 3 4 5<br />
I would like future abstracts to be expanded up to 2 pages each Yes No<br />
I would like to submit my full ppt presentation to appear on the Conference website Yes No<br />
Additional comments:<br />
CONFERENCE FACILITIES<br />
SCORING: Very Poor Mid Excellent<br />
Lecture Hall 1 2 3 4 5<br />
Registration Desk 1 2 3 4 5<br />
Meals: Overall 1 2 3 4 5<br />
Conference Breakfasts and Lunches 1 2 3 4 5<br />
Conference Dinner 1 2 3 4 5<br />
Coffee Breaks<br />
Opening Reception 1 2 3 4 5<br />
Audio-Visual 1 2 3 4 5<br />
Additional comments:<br />
141
Please Fill Out Both Sides<br />
Conference Evaluation and Questionnaire<br />
VENUE AND HOTEL<br />
SCORING: Very Poor Mid Excellent<br />
Venue – Lake Travis, Austin and Environs 1 2 3 4 5<br />
Would you return to this city? Yes Perhaps No<br />
Area Attractions 1 2 3 4 5<br />
Hotel: Overall 1 2 3 4 5<br />
Reservations 1 2 3 4 5<br />
Transportation and Accessibility 1 2 3 4 5<br />
Reception and Check – In 1 2 3 4 5<br />
Accommodations 1 2 3 4 5<br />
Facilities<br />
Parking 1 2 3 4 5<br />
Would you return to this hotel? Yes Perhaps No<br />
Additional comments:<br />
CONFERENCE ADMINISTRATION<br />
SCORING: Very Poor Mid Excellent<br />
Website 1 2 3 4 5<br />
Registration off-site 1 2 3 4 5<br />
Registration on-site 1 2 3 4 5<br />
Administrative staff 1 2 3 4 5<br />
Correspondence 1 2 3 4 5<br />
Additional comments:<br />
GENERAL INFORMATION<br />
I am a Returning Delegate Yes No<br />
I plan to attend the next conference Yes Perhaps No<br />
and present a paper(s) / poster(s) Yes Perhaps No<br />
Other(s) from my lab would attend the next conference Yes Perhaps No<br />
and he/she / they would present a paper(s) / poster(s) Yes Perhaps No<br />
How did you learn of this conference? (Check all that apply) Email Announcement<br />
Internet Website<br />
Other Colleague<br />
Tutorial Topic Suggestions for next year:<br />
Additional Comments, Improvements or Suggestions:<br />
If you would be willing to host the Conference in your city, please give your name to the Conference Staff.<br />
Questions or comments are welcome at any time at <br />
142