Fundamentally Active - Wilshire Associates
Fundamentally Active - Wilshire Associates
Fundamentally Active - Wilshire Associates

Create successful ePaper yourself
Turn your PDF publications into a flip-book with our unique Google optimized e-Paper software.
<strong>Fundamentally</strong> <strong>Active</strong><br />
Robert J. Waid<br />
Vice President & Principal<br />
July 2007<br />
The release of the paper “Fundamental Indexation” 1 and the subsequent promotion by its authors of their<br />
Fundamental Index TM (RAFI) has sparked a wave of renewed interest in alternatively-weighted indexes.<br />
Equal weighted, dividend weighted, and fundamental weighted are just a few of the current alternatively<br />
weighted implementation strategies. With investor demands for high returns in a low expected returns<br />
market, the message of “passive” outperformance strikes a resounding chord.<br />
Alternative to What<br />
When investors think of indexes they think of capitalization-weighted indexes, which came out of modern<br />
portfolio theory developed in the 1950s. Simply stated, the size of the company and consequently its<br />
weight in the index is the product of the company’s price and its shares outstanding. Capitalization<br />
weighting has become the de-facto standard for indexing such that any index that is not capitalization<br />
weighted is alternatively weighted.<br />
Implementations<br />
S&P Equal Weighted<br />
In January 2003, Standard and Poor’s (S&P) introduced an equal-weighted version of their S&P 500<br />
large-cap index. Rydex launched a corresponding ETF shortly thereafter. According to Rydex, the<br />
potential advantages of this strategy are “(i) smaller, faster-growing companies get a fair shake at<br />
competing with industry giants; (ii) equal weighting forces disciplined rebalancing and dollar cost<br />
averaging; and (iii) there’s more internal diversification, as the larger companies stand shoulder-toshoulder<br />
with their smaller siblings.” 2 Price movements create significant tracking issues so this index is<br />
rebalanced once a quarter.<br />
Dow Jones Select Dividend<br />
In November 2003, Dow Jones Indexes released the Dow Jones U.S. Select Dividend Index. This index<br />
initially represented 50 but now represents the top 100 U.S. stocks by dividend yield. Stocks are screened<br />
by dividend-per-share growth rate, dividend payout ratio, and average daily dollar trading volume before<br />
1 Arnott, Robert, Jason Hsu and Phillip Moore, “Fundamental Indexation,” Financial Analysts Journal (March/April<br />
2005).<br />
2 John Mulvey, “Essential Portfolio Theory,” A Rydex Investments White Paper (July 2006, originally published<br />
April 2005).<br />
___________________________________________________________________________________________<br />
Copyright © 2007, <strong>Wilshire</strong> <strong>Associates</strong> Incorporated. All rights reserved.
eing selected based on dividend yield. Weighting is by indicated annual dividend with a cap of ten<br />
percent.<br />
RAFI<br />
Fundamental Indexation outlined a methodology that weights the size of companies by “value” factors<br />
other than market capitalization. The marketing line is that market capitalization is “Wall Street’s”<br />
definition of size while fundamental indexes use “Main Street” measures. The Research Affiliates<br />
Fundamental 1000 Index (RAFI) consists of the top 1000 companies measured by the combined size<br />
metrics of book equity value, cash flow, sales, and gross dividends. Back tests on the RAFI between<br />
1962 and 2004 are reported to outperform the S&P 500 by approximately 215 basis points annually with<br />
comparable volatility. 3<br />
WisdomTree<br />
In June 2006, WisdomTree Investments, Inc. (formerly Index Development Partners, Inc.), using Wharton<br />
professor Jeremy Siegel as its spokesperson, released a collection of dividend-weighted indexes and<br />
ETFs. Most of the six domestic and 14 international dividend indexes are gross-dividend weighted but<br />
the remaining are yield weighted. Jeremy Siegel points out that “from 1926 [through] 2004, reinvestment<br />
of dividends accounted for 96% of the stock market's total return after inflation.” 4 In February of 2007,<br />
WisdomTree launched six domestic earnings-weighted indexes that mirror the rules of the six domestic<br />
dividend indexes except that they use core earnings for the weights.<br />
The Claims and the Myths<br />
There are a number of claims and myths made by proponents of alternatively-weighted indexes which<br />
include fundamentally-weighted indexes:<br />
The RAFI offers a better risk-adjusted return so it must be a better benchmark<br />
Just because an enhanced index strategy can be created using factors that are “more efficient” than a<br />
target index with higher returns and similar volatility, does not mean that the resulting product should be<br />
considered a benchmark or an alternative measure of beta. RAFI does not meet the industry-accepted<br />
benchmark guidelines which include being representative of the mandate and reflecting the neutral<br />
position. 5 The sum of the performance of all investors is capitalization weighted and thus a cap-weighted<br />
index reflects the performance of the average investor of the measured mandate or beta. If every investor<br />
invested fundamentally then capitalization-weighting would still reflect the performance of the average<br />
investor.<br />
The market is not efficient and fundamental measures are a better way to value a company<br />
It is argued that since stocks are not priced correctly then some stocks are overvalued and others are<br />
undervalued. If this is the case, then capitalization-weighting over-weights the overvalued stocks and<br />
under-weights the undervalued stocks. A weighting scheme that eliminates prices as a component of its<br />
index weights should not have this problem. Cap-weighting proponents will concede that stocks may be<br />
3 Arnott.<br />
4 Jeremy Siegel, The Future for Investors, 2005<br />
5 “Benchmarks and Performance Attribution Subcommittee Report,” CFA Institute (August 1998).<br />
<strong>Fundamentally</strong> <strong>Active</strong><br />
Copyright © 2007, <strong>Wilshire</strong> <strong>Associates</strong> Incorporated. All rights reserved.<br />
Page 2
overvalued or undervalued but add that this is most likely negligible as nobody really knows which is<br />
which. <strong>Active</strong> investors argue that they can find mispriced securities. Many fundamental weighting<br />
proponents argue that they have a better estimation of the relative value of a company using a “small” set<br />
of factors rather than the combined market intelligence of all participants using all available information,<br />
which the market reflects in the security’s price.<br />
Alternatively weighted is a way to exploit the flaws in capitalization weighting<br />
Research Affiliates makes the point that fundamental outperformance is not entirely fundamental’s style<br />
tilt but rather a flaw in capitalization-weighting. Jack Treynor’s discussion on market-valuationindifferent<br />
concludes with, “[One can] avoid the problem with cap-weighted index funds…by investing<br />
randomly with respect to the market’s pricing errors.” 6 Andre Perold counters that the error in the<br />
calculation flaw logic is that fundamental researchers anchor on fair value and thus “contradict the going<br />
in assumption of the noisy market hypothesis that we do not know fair value.” 7 After providing<br />
mathematical proof, Perold concludes: “The notion that capitalization weighting imposes an intrinsic<br />
drag on performance is accordingly false.” 8 Empirical evidence supports Perold’s findings. If there are<br />
“calculation flaws” in capitalization weighting they must be small. <strong>Active</strong> managers are alternatively if<br />
not randomly weighted, yet multiple empirical studies show that less than half outperform the capweighted<br />
benchmark. 9 Put another way, the median performance (before fees) of equal weighted money<br />
managers is approximately less than or equal to the cap-weighted benchmark. If there were an intrinsic,<br />
significant flaw in cap weighting, active managers unwittingly would have the aforementioned reported<br />
annual tailwind of more than two percent. 10 With a tailwind of this magnitude more than half of active<br />
managers should easily outpace the cap-weighted benchmark.<br />
Fundamental weighting protects investors from market bubbles<br />
One consistent theme with fundamentally-weighted indexes is that they fully participate in typical bull<br />
markets, slightly lag bubble periods, and have superior performance in bear markets. The recent tech<br />
bubble is held up as a perfect example. RAFI had a five-year annualized return of 6.5% ending 2004<br />
compared to the S&P 500’s -2.3%. 11<br />
Touting protection from bear markets has been a marketing staple of value investing for decades. This<br />
raises the question of the appropriateness of using the S&P 500, or any core index, as the performance<br />
benchmark for these fundamental indexes. Proponents of fundamental indexes freely admit to having a<br />
value and small-cap tilt compared to a cap-weighted index. Table 1 shows the five-year annualized<br />
performance of Dow Jones <strong>Wilshire</strong> U.S. size and style indexes. 12 The S&P 500 is a large-cap core index<br />
and thus should be compared to the DJ <strong>Wilshire</strong> Large-Cap return of -2.4% for the five-year period<br />
ending 2004. Because fundamental indexes invest in small-cap and over-weight in value, a large-cap core<br />
index is not an appropriate benchmark. A fundamental index’s benchmark should either be compared to a<br />
single index that includes comparable size and style tilts such as the DJ <strong>Wilshire</strong> Top 2500 Value<br />
Index SM , or a custom index that recognizes the ratio of investments in various style categories such as<br />
6<br />
Treynor, Jack, “Why Market-Valuation-Indifferent Indexing Works,” Financial Analysts Journal<br />
(September/October 2005).<br />
7 Andre F. Perold, “<strong>Fundamentally</strong> Flawed Indexing,” Draft: January 18, 2007.<br />
8 Andre F. Perold.<br />
9 Example: “Standard & Poor’s Indices Versus <strong>Active</strong> Funds Scorecard, Second Quarter 2006,” July 19, 2006.<br />
10 Arnott.<br />
11 Steven A. Schoenfeld, “Insights on Alternatively Weighted Indexes,” April 2006.<br />
12 Steven A. Schoenfeld. <strong>Wilshire</strong> <strong>Associates</strong> Incorporated, http://www.wilshire.com/Indexes/calculator/.<br />
<strong>Fundamentally</strong> <strong>Active</strong><br />
Copyright © 2007, <strong>Wilshire</strong> <strong>Associates</strong> Incorporated. All rights reserved.<br />
Page 3
50% large-value plus 15% large-growth plus 35% small-value. (The simple five-year composite return<br />
ending 2004 was 6.6%).<br />
Table 1: Five-Year Annualized Returns Ending 2004<br />
Value Core Growth<br />
DJ <strong>Wilshire</strong> Large-Cap 5.0% -2.4% -9.2%<br />
DJ <strong>Wilshire</strong> Mid-Cap 13.6% 6.1% -3.3%<br />
DJ <strong>Wilshire</strong> Small-Cap 15.7% 6.2% -3.1%<br />
DJ <strong>Wilshire</strong> Top 2500 6.1% -1.5% -8.5%<br />
S&P 500 -2.3%<br />
RAFI 6.5%<br />
Source: <strong>Wilshire</strong> <strong>Associates</strong> and NorthernTrust<br />
The naïve or simple approach avoids data mining and back-testing concerns<br />
Another problem with these comparisons is that they were done with back-tested data, using rules that<br />
kept out the “young” large-cap technology companies—those with no dividends and/or no earnings<br />
history. This raises the question of data mining. Most of these tech companies were added to capweighted<br />
indexes towards the end of, or even after, the late-1990s bull market. This was too late to add to<br />
the bull market returns but these companies were clearly contributors when the bubble burst. Table 2<br />
contains the ten largest of 23 technology companies that were added to the S&P 500 in 2000 as well as<br />
their subsequent 2001 returns. 13<br />
Table 2: Ten Largest Technology Companies Added to the S&P 500 in 2000<br />
Company Name IPO Date Date Added 2001 Return<br />
Linear Technology Co 05/30/1986 03/31/2000 -15.3%<br />
Siebel Sys Inc 06/28/1996 05/04/2000 -58.6%<br />
Maxim Integrated Products 03/04/1988 05/09/2000 9.8%<br />
Agilent Technologies 11/18/1999 06/02/2000 -47.9%<br />
Veritas Software Co 12/09/1993 06/20/2000 -48.8%<br />
Broadcom Corp 04/17/1998 06/30/2000 -51.4%<br />
Qwest Communications 06/24/1997 07/05/2000 -65.4%<br />
JDS Uniphase Corp 11/17/1993 07/26/2000 -79.2%<br />
Palm Inc 03/02/2000 07/27/2000 -86.3%<br />
Applied Micro Circuits 11/25/1997 12/29/2000 -84.9%<br />
S&P 500 -11.9%<br />
RAFI 0.1%<br />
Source: <strong>Wilshire</strong> <strong>Associates</strong> and NorthernTrust<br />
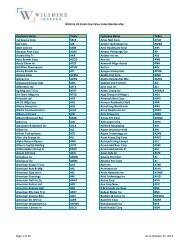
Was S&P under pressure to “quickly” add these young tech companies? It’s a rhetorical question but<br />
Microsoft was added eight years after its IPO date and four years after it was larger than the 100th largest<br />
S&P 500 company. 14 Russell changed its index addition rules to accommodate Google’s August 2004<br />
IPO. 15 Would a live fundamental index have made adjustments for dot.com companies during the tech<br />
13 Steven A. Schoenfeld. <strong>Wilshire</strong> Atlas.<br />
14 <strong>Wilshire</strong> Atlas: Microsoft IPO was March 14, 1986, market cap greater than 100 th company March 1990, and<br />
entered the S&P 500 on June 7, 1994.<br />
15 “Russell Indexes to Add IPOs on a Quarterly Basis,” Russell Press Release, August 31, 2004. “Russell Indexes to<br />
Add 48 IPOs on Sept. 30,” Russell Press Release, September 15, 2004.<br />
<strong>Fundamentally</strong> <strong>Active</strong><br />
Copyright © 2007, <strong>Wilshire</strong> <strong>Associates</strong> Incorporated. All rights reserved.<br />
Page 4
ubble? It would have been easy to relax the five-year requirement of fundamentals to three years or<br />
even one year in order to allow some of these companies to enter the index. The metrics for combining<br />
fundamentals could have been changed to favor sales. These are examples of “minor” adjustments that<br />
would not compromise the intent of the index but could create differences between live- and back-tested<br />
index returns.<br />
Fundamental indexes are a more reliable, conservative measure of a company’s value<br />
Good or bad, market prices do respond quicker to changes in company valuations than fundamental<br />
measures. This is because prices reflect the expectations of all investors at that moment while<br />
fundamental measures use the past reporting of the company’s financials after their release. Stock<br />
manipulation is difficult and illegal. Fundamental measures are susceptible to both legal and illegal<br />
distortions. For example, a company’s management controls the size and frequency of dividend payments.<br />
These payments affect the company’s weight in many alternatively-weighted indexes. The market<br />
evaluates all news including changes in dividend payouts and adjusts the stock price, if necessary.<br />
A transparent, rules-based index is a passive index<br />
A non-judgmental buy/sell methodology does not make the investment process passive. Passive indexes<br />
theoretically require little to no maintenance—invest in it and forget about it. Low turnover is the appeal<br />
of a passive index and a major selling point for capitalization-weighted investing. In practice, capweighted<br />
indexes require maintenance because of corporate actions and membership changes. 16 If there<br />
were no corporate actions or membership changes, cap-weighted indexes would have zero turnover and<br />
thus zero maintenance. In addition to the turnover created by corporate actions and membership changes,<br />
alternatively weighted indexes have turnover built into the construction methodology. Table 3 identifies<br />
some of the sources of turnover.<br />
Table 3: Potential Sources of Turnover<br />
Sources for Turnover Cap-Weighting S&P Eq Wt RAFI WisdomTree<br />
Membership changes Yes Yes Yes Yes<br />
Dividend payments Yes Yes Yes Yes<br />
Shares outstanding changes (dividend payers) Yes No Yes Yes<br />
Shares outstanding changes (non-dividend payers) Yes No No No<br />
Price changes No Yes No No<br />
Sales changes No No Yes No<br />
Cash flow changes No No Yes No<br />
Book value changes No No Yes No<br />
It is important to point out that cap-weighting an index does not make it passive. Cap-weighted style<br />
benchmark indexes have imbedded, active style bets similar to fundamental indexes. The difference is<br />
that cap-weighted style benchmarks attempt to reflect the sum of all investors of the targeted style or the<br />
style’s beta. Turnover is a result of making the style index more representative of the targeted style.<br />
Fundamental index goals, like those of any active manager, are to outperform. Research Affiliates’ Jason<br />
Hsu, when asked to clarify if the RAFI was active or passive during a May 1, 2007 roundtable sponsored<br />
by Global Pensions, replied: “I’m leaning towards active, low turnover, rules-based.” 17<br />
16 Membership changes include mergers and acquisitions, IPOs, delistings, as well as size, style, industry and<br />
country changes for sub-indexes.<br />
17 “The age of investment strategy indices,” Global Pensions, June 2007: page 40.<br />
<strong>Fundamentally</strong> <strong>Active</strong><br />
Copyright © 2007, <strong>Wilshire</strong> <strong>Associates</strong> Incorporated. All rights reserved.<br />
Page 5
Fundamental indexes are a core investment<br />
Dividend weighting schemes that eliminate approximately 60% of the non-dividend paying universe<br />
cannot be considered core investments but many fundamental methods invest in all sizes and styles of<br />
stocks. It is clear that most fundamental indexes have a strong value and/or small-cap tilt compared to a<br />
cap-weighted index. In fact, the factors chosen for RAFI and WisdomTree inclusion as well as portfolio<br />
weights are traditional value metrics. Steven Schoenfeld summed up this style tilt well: “RAFI’s<br />
composite-weighted index is, in fact, a naïve approach to a multi-factor model with well-documented<br />
value factors (and therefore exposures) that have performed very well since the 1960s.” 18<br />
Fundamental investing is a no-skill method for outperformance<br />
Eugene Fama and Ken French documented the persistent return attribute to value and small-cap going<br />
back to the 1960s. 19 The question is: Does fundamental investing deliver outperformance versus an<br />
investment strategy with the specific goal of capturing a value and size premium? William Bernstein’s<br />
answer was that “slightly less than two-thirds of the ‘excess return’ of the RAFI over the S&P [500] is<br />
due to naïve factor exposure, and slightly more than one-third seems to be inherent to the technique.<br />
Unfortunately, this latter effect is not statistically significant, raising the issue of data mining.” 20<br />
RAFI’s outperformance in other markets proves that cap-weighting is flawed<br />
Alternatively weighted supporters claim that since fundamental indexes outperform cap-weighted indexes<br />
in every market and every size category, then the cap-weighted methodology must be flawed. The<br />
reported outperformance is the value premium, which has been documented as a global phenomenon by<br />
Fama and French in 1998 21 and updated by the Brandes Institute in 2006. 22<br />
Fundamental indexes offer higher returns at similar or lower risk levels<br />
As the adage goes: If an investment offers higher returns with similar to lower risk, then invest in it. Most<br />
risk measures begin or end with the standard deviation of returns. Table 4 shows that the standard<br />
deviation of the RAFI compared to the Dow Jones <strong>Wilshire</strong> Large-Cap Index SM implies that the RAFI has<br />
lower risk. When comparing the RAFI to a more representative value benchmark such as the DJ <strong>Wilshire</strong><br />
Large-Cap Value Index SM or DJ <strong>Wilshire</strong> 2500 Value Index SM , the “similar or lower risk” statement no<br />
longer holds.<br />
18 Steven A. Schoenfeld.<br />
19 Fama, Eugene and Ken French, “The Cross-Section of Expected Stock Returns,” Journal of Finance (June 1992).<br />
20 William J. Bernstein, “Fundamental Indexing and the Three-Factor Model,” EfficientFrontier.com (May 2006).<br />
21 Fama, Eugene F. and Kenneth R. French, “Value versus Growth: The International Evidence,” Journal of<br />
Finance 53 (December 1998): page 1976-1999.<br />
22 “Value vs. Glamour: The Value Premium in Non-U.S. Markets,” www.brandes.com/institue, December 2006.<br />
<strong>Fundamentally</strong> <strong>Active</strong><br />
Copyright © 2007, <strong>Wilshire</strong> <strong>Associates</strong> Incorporated. All rights reserved.<br />
Page 6
Table 4: Annualized Standard Deviations Ending December 2004<br />
DJ <strong>Wilshire</strong> DJ <strong>Wilshire</strong> DJ <strong>Wilshire</strong><br />
RAFI Large-Cap Large-Cap Value Top 2500 Value<br />
1 year 7.20% 7.50% 7.28% 7.73%<br />
3 years 14.94% 14.65% 14.52% 14.49%<br />
5 years 15.53% 16.54% 13.93% 13.81%<br />
7 years 15.79% 17.22% 14.23% 14.21%<br />
10 years 14.50% 15.86% 13.25% 13.17%<br />
Source: NorthernTrust and <strong>Wilshire</strong> <strong>Associates</strong><br />
Research from Brandes Institute has shown that lower standard-deviations for value companies versus<br />
growth (glamour) companies are a global phenomenon. 23<br />
Quantitative Value Investing<br />
Moving beyond the myths, the remaining question for fundamental indexing is: Is this an appropriate,<br />
attractive [fill in the adjective of choice] investment strategy? These are clean, simple ways to construct<br />
active value portfolios. RAFI’s implementation deals with capacity well and claims to have turnover<br />
approaching that of a cap-weighted core index. Fees are generally between those of an active fund and a<br />
cap-weighted index fund. It could be argued that fundamental indexes are a near-passive means of<br />
capturing the value and small-cap attributes popularized by Fama and French.<br />
A problem with investment strategy indexes is the inclusion of the word “index.” It is fair to say that if<br />
the portfolio was not published ahead of time that the word “index” would not apply leaving only<br />
investment strategy or a quantitative, structured portfolio. The classic question when evaluating a<br />
quantitative manager is, “How often do you tinker with your model?” If the investment strategy becomes<br />
an index, the answer is never. Is this any different from investing in a value or small-cap index fund? If<br />
the goal is outperformance, how does an investment strategy index offer a better chance for persistent<br />
outperformance over an index fund versus a quant manager?<br />
Shortcomings of Static, Structured Portfolios<br />
If we assume that a market anomaly exists and is harvestable, the investment question becomes: Will it<br />
persist? Structured portfolio managers and hedge fund managers look for market anomalies to construct<br />
model portfolios and capture anomalies until they are gone. If we assume that the fundamental<br />
methodology does harvest a market anomaly, what will happen when it is gone? The “anomaly” has been<br />
made public. Investors are investing in the strategy using a number of alternative methods including<br />
those of RAFI and WisdomTree. Hedge funds are set up to capture the spread between fundamental<br />
weights and cap-weights. As with any perceived market anomaly, it will be exploited until it is found<br />
either to have never existed or it goes away leaving the investor with, at best, expensive beta.<br />
Conclusion<br />
Calling a transparent, structured portfolio an index does not make it passive. Alternatively-weighted<br />
indexes, such as fundamental indexes, are structured portfolios where the active bets are part of the index<br />
construction. These are portfolios built with the intention of beating the market--the true nature of active<br />
23 “Value vs. Glamour: The Value Premium in Non-U.S. Markets,” www.brandes.com/institue, December 2006.<br />
<strong>Fundamentally</strong> <strong>Active</strong><br />
Copyright © 2007, <strong>Wilshire</strong> <strong>Associates</strong> Incorporated. All rights reserved.<br />
Page 7
investing. The value and small-cap tilts are performance bets that have been documented for nearly 20<br />
years, and, consequently, the response to the investment question should be the standard line, “Past<br />
performance does not guarantee future results.” These alternatively-weighted strategies should be<br />
evaluated the same as those of a computer driven investment process not as a replacement for core beta<br />
investing. The problem with investing in these structured portfolios as an active index strategy is that the<br />
process to improve them ceases once the index is released. Eugene Fama may have said it best: “It’s a<br />
triumph of marketing, and not of new ideas.” 24<br />
The Dow Jones <strong>Wilshire</strong> Indexes SM are calculated and distributed by Dow Jones Indexes pursuant to an<br />
agreement between Dow Jones & Company, Inc., and <strong>Wilshire</strong> <strong>Associates</strong> Incorporated. “Dow Jones”<br />
and “<strong>Wilshire</strong>” are the respective service marks of Dow Jones and <strong>Wilshire</strong> <strong>Associates</strong> Incorporated.<br />
Fundamental Index is a registered trademark of Research Affiliates.<br />
This material contains confidential and proprietary information of <strong>Wilshire</strong> <strong>Associates</strong> Incorporated, and<br />
is intended for the exclusive use of the person to whom it is provided. It may not be modified, sold or<br />
otherwise provided, in whole or in part, to any other person or entity without prior written permission<br />
from <strong>Wilshire</strong> <strong>Associates</strong> Incorporated.<br />
The information contained herein has been obtained from sources believed to be reliable. <strong>Wilshire</strong><br />
<strong>Associates</strong> Incorporated gives no representations or warranties as to the accuracy of such information, and<br />
accepts no responsibility or liability (including for indirect, consequential or incidental damages) for any<br />
error, omission or inaccuracy in such information and for results obtained from its use. Information and<br />
opinions are as of the date indicated, and are subject to change without notice.<br />
This material is intended for informational purposes only and should not be construed as legal,<br />
accounting, tax, investment, or other professional advice.<br />
24 “Straight Talk: Fama and French,” Journal of Indexes, March/April 2007: page 11.<br />
<strong>Fundamentally</strong> <strong>Active</strong><br />
Copyright © 2007, <strong>Wilshire</strong> <strong>Associates</strong> Incorporated. All rights reserved.<br />
Page 8