Making permanent savings through Active ... - Schneider Electric
Making permanent savings through Active ... - Schneider Electric
Making permanent savings through Active ... - Schneider Electric

Create successful ePaper yourself
Turn your PDF publications into a flip-book with our unique Google optimized e-Paper software.
<strong>Making</strong> <strong>permanent</strong> <strong>savings</strong> <strong>through</strong> <strong>Active</strong> Energy Efficiency<br />
Reducing greenhouse gas emissions was a global target set at the<br />
Kyoto Earth Summit in 1997 that was fi nally ratifi ed by 169 countries<br />
in December 2006.<br />
Under the Kyoto Protocol, industrialized countries have agreed to<br />
reduce their collective emissions of greenhouse gases by 5,2 per cent<br />
by 2012 compared to the year 1990. (Compared to the emissions<br />
levels expected by 2012 prior to the Protocol, this limitation represents<br />
a 29 per cent cut.) The target in Europe is an 8 per cent reduction<br />
overall with a target for CO 2<br />
emissions to fall by 20 per cent by 2020.<br />
This white paper looks at the approaches to <strong>Active</strong> Energy Effi ciency<br />
that can be applied within new and existing buildings – in commerce,<br />
industry, private, public, and residential – as well as in manufacturing,<br />
industry, and the transportation infrastructure.<br />
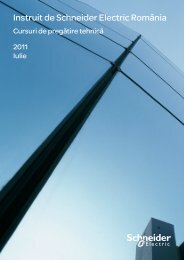
World energy-related CO 2<br />
emission <strong>savings</strong> by region in the 450 Scenerio<br />
45<br />
40<br />
35<br />
30<br />
Current Policies<br />
Scenario<br />
43 Gt<br />
25<br />
450 Scenario<br />
20<br />
22 Gt<br />
2008 2015 2020 2025 2030 2035<br />
China<br />
United States<br />
India<br />
European Union<br />
Middle East<br />
Russia<br />
Rest of world<br />
Total (Gt CO 2<br />
)<br />
Abatement<br />
2020 2035<br />
27% 35%<br />
11% 14%<br />
8% 8%<br />
13% 8%<br />
5% 5%<br />
2% 4%<br />
34% 26%<br />
3.5 20.9<br />
World energy-related CO 2<br />
emission <strong>savings</strong> by policy measure in the 450 Scenerio<br />
45<br />
40<br />
35<br />
30<br />
25<br />
Current Policies<br />
Scenario<br />
450 Scenario<br />
20<br />
2008 2015 2020 2025 2030 2035<br />
Abatement<br />
2020 2030 2035<br />
Efficiency<br />
End-use (direct)<br />
71%<br />
34%<br />
49%<br />
24%<br />
48%<br />
24%<br />
End-use (indirect) 33% 23% 23%<br />
Power plants<br />
Renewables<br />
Biofuels<br />
Nuclear<br />
CCS<br />
3%<br />
18%<br />
1%<br />
7%<br />
2%<br />
2%<br />
21%<br />
3%<br />
9%<br />
17%<br />
1%<br />
21%<br />
3%<br />
8%<br />
19%<br />
Total (Gt CO 2<br />
) 3.5 15.1 20.9<br />
Source: IEA – World Energy Outlook 2010<br />
White paper on Energy Efficiency - 5