

PDF: 533 KB - Bureau of Infrastructure, Transport and Regional ...
PDF: 533 KB - Bureau of Infrastructure, Transport and Regional ...
PDF: 533 KB - Bureau of Infrastructure, Transport and Regional ...

Create successful ePaper yourself
Turn your PDF publications into a flip-book with our unique Google optimized e-Paper software.
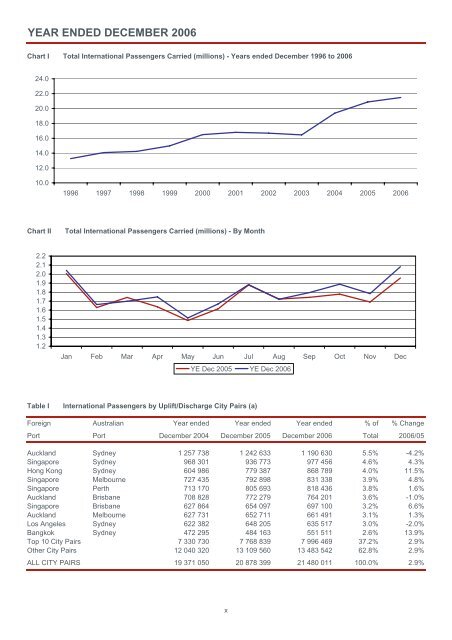
YEAR ENDED DECEMBER 2006<br />
Chart I Total International Passengers Carried (millions) - Years ended December 1996 to 2006<br />
24.0<br />
22.0<br />
20.0<br />
18.0<br />
16.0<br />
14.0<br />
12.0<br />
10.0<br />
1996 1997 1998 1999 2000 2001 2002 2003 2004 2005 2006<br />
Chart II<br />
Total International Passengers Carried (millions) - By Month<br />
2.2<br />
2.1<br />
2.0<br />
1.9<br />
1.8<br />
1.7<br />
1.6<br />
1.5<br />
1.4<br />
1.3<br />
1.2<br />
Jan Feb Mar Apr May Jun Jul Aug Sep Oct Nov Dec<br />
YE Dec 2005 YE Dec 2006<br />
Table I<br />
International Passengers by Uplift/Discharge City Pairs (a)<br />
Foreign Australian Year ended Year ended Year ended % <strong>of</strong> % Change<br />
Port Port December 2004 December 2005 December 2006 Total 2006/05<br />
Auckl<strong>and</strong> Sydney 1 257 738 1 242 633 1 190 630 5.5% -4.2%<br />
Singapore Sydney 968 301 936 773 977 456 4.6% 4.3%<br />
Hong Kong Sydney 604 986 779 387 868 789 4.0% 11.5%<br />
Singapore Melbourne 727 435 792 898 831 338 3.9% 4.8%<br />
Singapore Perth 713 170 805 693 818 436 3.8% 1.6%<br />
Auckl<strong>and</strong> Brisbane 708 828 772 279 764 201 3.6% -1.0%<br />
Singapore Brisbane 627 864 654 097 697 100 3.2% 6.6%<br />
Auckl<strong>and</strong> Melbourne 627 731 652 711 661 491 3.1% 1.3%<br />
Los Angeles Sydney 622 382 648 205 635 517 3.0% -2.0%<br />
Bangkok Sydney 472 295 484 163 551 511 2.6% 13.9%<br />
Top 10 City Pairs 7 330 730 7 768 839 7 996 469 37.2% 2.9%<br />
Other City Pairs 12 040 320 13 109 560 13 483 542 62.8% 2.9%<br />
ALL CITY PAIRS 19 371 050 20 878 399 21 480 011 100.0% 2.9%<br />
x


