

PDF: 533 KB - Bureau of Infrastructure, Transport and Regional ...
PDF: 533 KB - Bureau of Infrastructure, Transport and Regional ...
PDF: 533 KB - Bureau of Infrastructure, Transport and Regional ...

Create successful ePaper yourself
Turn your PDF publications into a flip-book with our unique Google optimized e-Paper software.
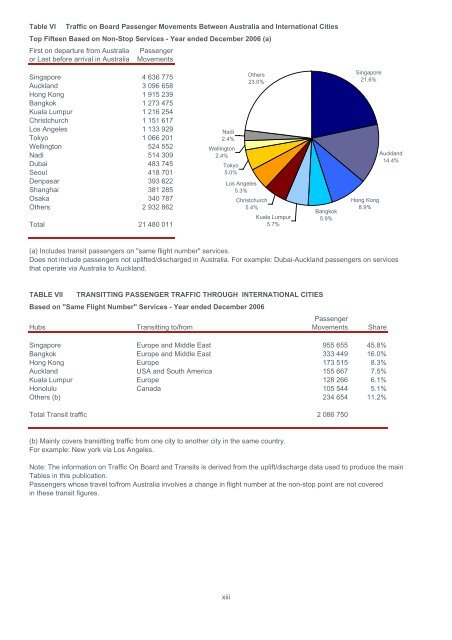
Table VI Traffic on Board Passenger Movements Between Australia <strong>and</strong> International Cities<br />
Top Fifteen Based on Non-Stop Services - Year ended December 2006 (a)<br />
First on departure from Australia Passenger<br />
or Last before arrival in Australia Movements<br />
Singapore 4 636 775<br />
Auckl<strong>and</strong> 3 096 658<br />
Hong Kong 1 915 239<br />
Bangkok 1 273 475<br />
Kuala Lumpur 1 216 254<br />
Christchurch 1 151 617<br />
Los Angeles 1 133 929<br />
Tokyo 1 066 201<br />
Wellington 524 552<br />
Nadi 514 309<br />
Dubai 483 745<br />
Seoul 418 701<br />
Denpasar 393 622<br />
Shanghai 381 285<br />
Osaka 340 787<br />
Others 2 932 862<br />
Total 21 480 011<br />
Nadi<br />
2.4%<br />
Wellington<br />
2.4%<br />
Tokyo<br />
5.0%<br />
Others<br />
23.0%<br />
Los Angeles<br />
5.3%<br />
Christchurch<br />
5.4%<br />
Kuala Lumpur<br />
5.7%<br />
Bangkok<br />
5.9%<br />
Singapore<br />
21.6%<br />
Hong Kong<br />
8.9%<br />
Auckl<strong>and</strong><br />
14.4%<br />
(a) Includes transit passengers on "same flight number" services.<br />
Does not include passengers not uplifted/discharged in Australia. For example: Dubai-Auckl<strong>and</strong> passengers on services<br />
that operate via Australia to Auckl<strong>and</strong>.<br />
TABLE VII TRANSITTING PASSENGER TRAFFIC THROUGH INTERNATIONAL CITIES<br />
Based on "Same Flight Number" Services - Year ended December 2006<br />
Passenger<br />
Hubs Transitting to/from Movements Share<br />
Singapore Europe <strong>and</strong> Middle East 955 655 45.8%<br />
Bangkok Europe <strong>and</strong> Middle East 333 449 16.0%<br />
Hong Kong Europe 173 515 8.3%<br />
Auckl<strong>and</strong> USA <strong>and</strong> South America 155 667 7.5%<br />
Kuala Lumpur Europe 128 266 6.1%<br />
Honolulu Canada 105 544 5.1%<br />
Others (b) 234 654 11.2%<br />
Total Transit traffic 2 086 750<br />
(b) Mainly covers transitting traffic from one city to another city in the same country.<br />
For example: New york via Los Angeles.<br />
Note: The information on Traffic On Board <strong>and</strong> Transits is derived from the uplift/discharge data used to produce the main<br />
Tables in this publication.<br />
Passengers whose travel to/from Australia involves a change in flight number at the non-stop point are not covered<br />
in these transit figures.<br />
xiii


