Annual plan 2010.pdf - Hutt City Council
Annual plan 2010.pdf - Hutt City Council
Annual plan 2010.pdf - Hutt City Council

Create successful ePaper yourself
Turn your PDF publications into a flip-book with our unique Google optimized e-Paper software.
<strong>Hutt</strong> <strong>City</strong> <strong>Council</strong><br />
<strong>Annual</strong> Plan<br />
2010-2011
Contents<br />
Message from the Mayor and Chief Executive. ...................................................................... 1<br />
Welcome to <strong>Hutt</strong> <strong>City</strong> <strong>Council</strong>’s <strong>Annual</strong> Plan 2010–2011 . ..................................................... 2<br />
Changes from the draft annual <strong>plan</strong> 2010-2011. ........................................................................ 3<br />
LTCCP 2009-2019 ....................................................................................................................... 3<br />
Selling 8 Kensington Avenue, Petone. ..................................................................................... 3<br />
Waiving fees for significant developments in the CBD ............................................................ 4<br />
Remainder of the LTCCP 2009-2019 ...................................................................................... 4<br />
Draft annual <strong>plan</strong> 2010-2011 questionnaire results .................................................................... 4<br />
Managing our finances ............................................................................................................. 4<br />
Transforming the CBD .............................................................................................................. 5<br />
<strong>Council</strong>’s vision for the city ....................................................................................................... 5<br />
Selling 8 Kensington Avenue, Petone. ..................................................................................... 5<br />
Amending the city’s gambling policy. ....................................................................................... 5<br />
Individual written submissions. ..................................................................................................... 6<br />
Targeted rates. .............................................................................................................................. 6<br />
Information Updates .................................................................................................................. 7<br />
Achieving our Goals ................................................................................................................... 9<br />
Key performance indicators ....................................................................................................... 10<br />
Our targets and performance measures for the next year. ....................................................... 12<br />
Financing our Work .................................................................................................................. 25<br />
Income for the whole of <strong>Council</strong> ................................................................................................ 26<br />
Prospective income statements and funding requirements for each activity. .......................... 27<br />
Capital and operating project lists for each activity . ................................................................. 36<br />
Forecast financial statements 2010/11 to 2018/19 .................................................................. 48<br />
Summary of significant accounting policies. .............................................................................. 56<br />
Funding impact statement. ......................................................................................................... 64<br />
Rates for 2010/11. ...................................................................................................................... 67<br />
Fees and charges for 2010/11. .................................................................................................. 70<br />
Contact Details ......................................................................................................................... 84<br />
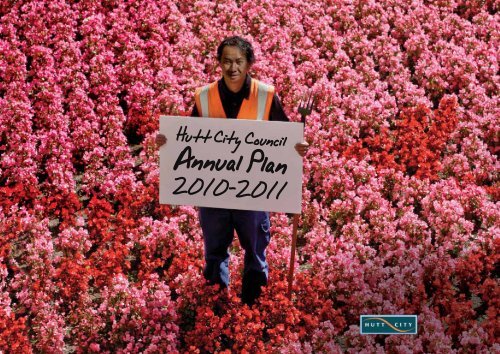
Cover Photo: Eng, Gardener, Civic Gardens<br />
ISSN 1171-8390
Message from the Mayor and Chief Executive<br />
Thank you to everyone who took the time to<br />
make a submission on this year’s draft <strong>plan</strong>.<br />
As a result of your input, we have made a<br />
number of changes to the original proposals.<br />
We have brought forward funding for several<br />
projects, including the McKenzie Pool<br />
redevelopment, the Tutukiwi Living Gallery<br />
landscaping, Black Creek flood protection,<br />
and the Wainuiomata Bush Fire Force<br />
headquarters. We have also added funding<br />
for the upgrade of the Taita netball courts,<br />
local marae, the Eastern Bays cycleway/<br />
walkway development, graffiti removal, the<br />
Sculpture Trust, Stokes Valley shopping<br />
centre, and the maintenance of our wharves.<br />
We have endeavoured to balance the need to<br />
continue to provide quality services, facilities<br />
and infrastructure with our commitment to<br />
keep rates down. In 2010/11, <strong>Council</strong>’s rates<br />
revenue will increase by 2.6% and this is likely<br />
to mean a rates increase of just 2% for the<br />
average ratepayer. We are also reviewing our<br />
operational budget to reduce it by $200,000<br />
each year and we have deferred a small<br />
number of projects.<br />
We are confident this <strong>plan</strong> will deliver positive<br />
benefits for our city and look forward to<br />
implementing it with the support of the<br />
community.<br />
Welcome to<br />
<strong>Hutt</strong> <strong>City</strong> <strong>Council</strong>’s<br />
annual <strong>plan</strong> for<br />
2010/11,<br />
which outlines our<br />
<strong>plan</strong> for delivering<br />
‘a better city,<br />
every day’<br />
David Ogden<br />
Mayor<br />
Tony Stallinger<br />
Chief Executive<br />
Mayor David Ogden
Welcome to<br />
<strong>Hutt</strong> <strong>City</strong> <strong>Council</strong> ’s<br />
<strong>Annual</strong> Plan<br />
2010-2011<br />
Kaumatua Sam Jackson on Petone Foreshore
Most councils produce<br />
a long term council<br />
community <strong>plan</strong> (LTCCP)<br />
every three years and<br />
an annual <strong>plan</strong> in the<br />
intervening years. This year<br />
<strong>Council</strong> has produced an<br />
annual <strong>plan</strong>. This covers<br />
the period 2010-2011 with<br />
additional information<br />
covering the period to 2019.<br />
The document has been<br />
developed in consultation<br />
with the community and<br />
sets the strategic direction<br />
of the city over the next<br />
nine years with a particular<br />
focus on the 2010/11<br />
financial year.<br />
Changes from the draft annual<br />
<strong>plan</strong> 2010-2011<br />
Following the public consultation on the<br />
draft annual <strong>plan</strong>, which attracted over 750<br />
submissions, a number of projects have been<br />
brought forward or added to the budget. The<br />
main changes are:<br />
• McKenzie Pool redevelopment - $250,000<br />
brought forward to begin this project in<br />
2010/11<br />
• Taita netball courts – $85,000 added in<br />
2010/11<br />
• Tutukiwi Living Gallery – $50,000 brought<br />
forward for landscaping in 2010/11<br />
• Marae funding scheme – an additional<br />
$35,000 per year added from 2010/11<br />
• Eastern Bays cycleway/walkway –<br />
$250,000 added in 2010/11 and<br />
$30,000pa from 2012/13<br />
• Black Creek Stage 3 – $800,000 brought<br />
forward to begin this upgrade in 2010/11<br />
• Wainuiomata Bush Fire Force<br />
headquarters - $250,000 brought forward<br />
to 2010/11<br />
• Rapid response anti-graffiti service – an<br />
additional $60,000 per year added from<br />
2010/11<br />
• Stokes Valley shopping centre – $60,000<br />
added to complete this upgrade in<br />
2010/11<br />
• E Tu Sculpture Trust – $50,000 added in<br />
2011/12.<br />
The timing of some existing projects<br />
has been altered to accommodate this,<br />
including a one or two year deferral of<br />
sportsground artificial training areas,<br />
Trafalgar Park new toilets and fence,<br />
Pavilion building improvements, two water<br />
supply projects, Taita Reservoir seismic<br />
upgrade, Wainuiomata catchment sewer<br />
renewals, Victoria/Hume Street stormwater<br />
upgrade and the Wainuiomata Bush Fire<br />
Force vehicle. In addition the spread of<br />
funding across two years for the Making<br />
Places project to establish a square<br />
outside TheNewDowse from 2010/11 has<br />
been adjusted, with $750,000 deferred to<br />
2011/12.<br />
Other financial changes from the draft annual<br />
<strong>plan</strong> include annual provision of $90,000<br />
to cover extra electricity costs associated<br />
with the emissions trading scheme, and<br />
approximately $1.8m added between<br />
2010/11 and 2015/16 to maintain the city’s<br />
wharves. The schedule of fees and charges<br />
has also been amended to make provision<br />
for the increase in Goods and Services Tax<br />
(GST) to 15% from 1 October 2010.<br />
The updated project listings are included<br />
from page 36 and the schedule of fees and<br />
charges is published from page 70.<br />
LTCCP 2009-2019<br />
As part of its consultation on the draft<br />
annual <strong>plan</strong>, <strong>Council</strong> consulted on two<br />
amendments to the LTCCP 2009-2019.<br />
The revised text as a result of these two<br />
amendments is included on the <strong>Council</strong>’s<br />
website: www.huttcity.govt.nz/publications-<br />
forms/Community-Plan/2009-Long-Term-<br />
<strong>Council</strong>-Community-Plan/<br />
Selling 8 Kensington Avenue, Petone<br />
<strong>Council</strong> received a proposal from its<br />
Land Review Working Group to sell the<br />
endowment property at 8 Kensington<br />
Avenue, Petone. The property was gifted to<br />
the former Petone Borough <strong>Council</strong> by Walter<br />
Patrick Page in May 1929 for use as a rest<br />
room and Plunket rooms or similar charitable<br />
purposes. The Plunket Society owns and<br />
uses a house on part of the property. The<br />
house is now an earthquake prone building<br />
and needs to be strengthened or removed.<br />
Plunket has agreed in principle to being<br />
relocated to a <strong>Council</strong> owned house at 12<br />
Kirks Avenue, subject to <strong>Council</strong> upgrading<br />
the house to meet Plunket’s needs, suitable<br />
lease terms being agreed and demolition of<br />
the existing Plunket building by <strong>Council</strong> at<br />
<strong>Council</strong>’s cost. There is also a small public<br />
hall on the property and <strong>Council</strong> has asked<br />
for further investigations into the possible use<br />
and relocation of the hall.<br />
<strong>Council</strong> received 452 submissions on<br />
the proposal to consider disposing of the<br />
property, of which 291 were in favour,<br />
51 were opposed and 110 didn’t know.<br />
<strong>Council</strong> also received a request from the<br />
successors of the donor of the property that<br />
the proceeds of the sale be forwarded to the<br />
Plunket Society.<br />
<strong>Hutt</strong> <strong>City</strong> <strong>Council</strong> <strong>Annual</strong> Plan 2010-2011<br />
3
4<br />
Following the consideration of submissions<br />
and the views of the successors, <strong>Council</strong><br />
has agreed to the proposal to sell the<br />
property. This requires an amendment to<br />
the LTCCP 2009-2019. The only effect of<br />
the amendment is to increase expenditure<br />
in the 2010/11 year by $150,000 in order<br />
to upgrade the house at 12 Kirks Avenue<br />
to accommodate Plunket. The LTCCP<br />
2009-2019 already anticipates receipt of<br />
the proceeds from the sale and the use of<br />
approximately $250,000 for the upgrading or<br />
replacement of public toilets in the area.<br />
Waiving fees for significant developments<br />
in the CBD<br />
To help revitalise the CBD, <strong>Council</strong><br />
consulted on a proposal to consider<br />
waiving a range of fees for new commercial<br />
and apartment developments in the CBD<br />
that meet certain criteria. These fees<br />
include rates, development contributions,<br />
reserve financial contributions, resource<br />
consents charges and building consents<br />
charges. To be eligible for a remission of<br />
<strong>Council</strong> charges a development must be<br />
either a new apartment development of<br />
at least eight attached residential dwelling<br />
units or of at least 600m 2 (whichever is the<br />
lesser), a new commercial development of<br />
at least 600m 2 , or a new development with<br />
a mix of apartment and commercial space<br />
of at least 600m 2 in total. The development<br />
must also be within the <strong>Hutt</strong> CBD, be<br />
subject to the Central Commercial Activity<br />
Area design guide and have applied for<br />
resource and building consent between<br />
the start and end dates of the CBD<br />
Development Remissions Policy.<br />
<strong>Council</strong> received 31 submissions on the<br />
proposal, of which nine were in favour, five<br />
had mixed views and 17 were opposed.<br />
Following the consideration of submissions<br />
<strong>Council</strong> has made a number of changes<br />
to the policy, and agreed to a CBD<br />
Development Remissions Policy that includes<br />
the following:<br />
• The start date has been amended to<br />
1 July 2011.<br />
• The end date has been extended to<br />
30 June 2015.<br />
• A review of the policy will take place as at<br />
30 June 2013.<br />
• An additional sentence is included to<br />
make it clearer that the rates remission<br />
part of the policy is only on the improved<br />
value of a property and does not affect<br />
existing rates on a site.<br />
• The following developments are included<br />
within the meaning of “commercial<br />
development” – hotel, motel, hostel or<br />
similar accommodation services; venue<br />
hire and conference use; carparking<br />
buildings.<br />
The adoption of the policy requires an<br />
amendment to the LTCCP 2009-2019,<br />
primarily to add the text of the new policy<br />
next to the existing Rates Remission Policy<br />
text on page 293 of the LTCCP. Parts of the<br />
policy also change aspects of the existing<br />
Development and Financial Contributions<br />
Policy, requiring additional text on page 259<br />
addressing CBD commercial and apartment<br />
developments, and on page 265 addressing<br />
development contribution remissions for<br />
CBD development. A budget allocation<br />
of $100,000pa is also added for the four<br />
years of the scheme beginning in 2011/12.<br />
The LTCCP 2009-2019 already anticipates<br />
growth in the rating base.<br />
Remainder of the LTCCP 2009-2019<br />
<strong>Council</strong> is due to produce its next long term<br />
<strong>plan</strong> in 2012 covering the period 2012-2022.<br />
In the meantime the following sections of the<br />
2009-2019 LTCCP have been omitted from<br />
this annual <strong>plan</strong> but are still current and may<br />
be accessed on <strong>Council</strong>’s website:<br />
www.huttcity.govt.nz/publications-forms/<br />
Community-Plan/2009-Long-Term-<strong>Council</strong>-<br />
Community-Plan/<br />
• Introduction – how the pieces fit together<br />
• The foundations of our work – our<br />
strategies, policies and <strong>plan</strong>s to promote<br />
social, economic, environmental and<br />
cultural wellbeing<br />
• Our community goals – community<br />
outcomes to achieve our vision<br />
• Achieving our community outcomes:<br />
measuring progress<br />
• Our community<br />
• Legislation affecting local government<br />
• Appendices: sustainable development<br />
<strong>plan</strong>ning<br />
• Policies (apart from the Rates Remission<br />
Policy and Development and Financial<br />
Contributions Policy which have been<br />
amended as previously outlined)<br />
• Definitions<br />
Draft annual <strong>plan</strong> 2010-2011<br />
questionnaire results<br />
Consultation was carried out on<br />
management of our finances, transforming<br />
the CBD, <strong>Council</strong>’s vision for the city, selling<br />
8 Kensington Avenue and amending the<br />
city’s gambling policy. The results of the<br />
questionnaire on these issues are printed<br />
below. The full results are available on the<br />
<strong>Council</strong>’s website:<br />
www.huttcity.govt.nz/<strong>Council</strong>/Global-<br />
Calendar/Meetings/Community-Plan-<br />
Committee-Meetings/910-June-2010/<br />
Managing our finances<br />
43% of people who submitted the written<br />
questionnaire made wide-ranging comments<br />
covering a broad cross-section of opinion.<br />
The main areas of comment referred to:<br />
• Debt levels (may need to rise to fund/<strong>plan</strong>/<br />
create a more vibrant city) – 6%<br />
• Sustain prudent management; keep rates/<br />
fees/debt down – 6%<br />
• Other comments about rates – 3%<br />
• Don’t defer McKenzie Pool upgrade – 4%<br />
• Don’t increase parking fees – 4%<br />
• Don’t delay Wainuiomata Hill Summit<br />
pedestrian bridge – 2%<br />
• Broadly in favour of <strong>plan</strong>/support most<br />
things – 2%<br />
• Hard to comment without knowing<br />
specific amounts – 2%<br />
• Other individual comments – 20%<br />
The first three items above will be considered<br />
further when the <strong>Council</strong>’s Financial Strategy<br />
is reviewed in 2010/11. The remaining items<br />
were considered as part of the <strong>Council</strong>’s<br />
prioritisation of projects.
Transforming the CBD<br />
People were asked whether they agree<br />
with the proposal to allocate money for<br />
the Making Places priority projects that are<br />
currently unfunded so they can start within<br />
the next few years. Opinion was divided<br />
among the community as follows:<br />
• Agree – 50%<br />
• Disagree – 38%<br />
• Don’t know – 12%<br />
Approximately half the people who responded<br />
included a comment. Some residents see the<br />
benefits of progressing the CBD development<br />
in the near future. Others would prefer that<br />
already funded and/or <strong>plan</strong>ned projects be<br />
given priority. Another group would prefer the<br />
<strong>Council</strong> to stick to delivering core services in<br />
the current economic environment and wait<br />
until the funding is available to progress the<br />
CBD development.<br />
<strong>Council</strong> has agreed to proceed with one<br />
major Making Places project, the square<br />
outside TheNewDowse, in 2010/11 and this<br />
project is spread across two financial years.<br />
The questionnaire also asked if people agree<br />
that around $250,000 should be added to<br />
the budget to improve the attractiveness of<br />
the <strong>Hutt</strong> Road/Railway Avenue entrance to<br />
the city. The results were as follows:<br />
• Agree – 27%<br />
• Disagree – 52%<br />
• Don’t know – 21%<br />
This project has not been included in the<br />
annual <strong>plan</strong>.<br />
<strong>Council</strong>’s vision for the city<br />
The questionnaire asked if the <strong>Council</strong>’s<br />
vision statement for the city, outlined below,<br />
described what a great place to live, work<br />
and play would look like.<br />
The vision statement is: <strong>Hutt</strong> <strong>City</strong> will be a<br />
great place to live, work and play.<br />
This means:<br />
People are proud to live here<br />
<strong>Hutt</strong> <strong>City</strong> is compact, vibrant and diverse,<br />
offering the best of city living while being<br />
safe, friendly and easy to get around.<br />
There is quality education and healthcare,<br />
with a choice of housing options from<br />
apartments to family homes on the<br />
hillsides, in the valleys or near the coast.<br />
Working or investing here is a smart<br />
choice<br />
Our vibrant economy offers a range of<br />
job opportunities close to home. We’ve<br />
built on our traditional industries, created<br />
export opportunities, and cemented<br />
our reputation as a science centre. This<br />
is a place of new ideas, creativity and<br />
innovation, bringing together the best of<br />
the arts, industry and science.<br />
There’s always something for the family<br />
to explore<br />
Experience our culture and heritage, visit<br />
our museums and libraries, or enjoy our<br />
cafes, restaurants and boutique stores.<br />
Head outdoors to a park or beach, walk<br />
along the river, take the boat out, hit the<br />
hills or a mountain bike trail, or enjoy a<br />
game of golf.<br />
Of those people who commented on the<br />
Vision Statement the results were:<br />
• Agree – 54%<br />
• Disagree – 23%<br />
• Don’t know – 23%<br />
Those who supported their rating with a<br />
comment generally indicated that they liked<br />
the vision, but many stressed that this is a<br />
concept that needs to be actively worked on<br />
to achieve the desired outcome.<br />
Those who disagreed with the vision<br />
statement felt that it could either be improved,<br />
or the resource required to make it happen<br />
was not warranted at the present time.<br />
Selling 8 Kensington Avenue, Petone<br />
Approximately two-thirds of those who<br />
completed the questionnaire agreed with the<br />
proposal to sell the property at 8 Kensington<br />
Avenue, Petone. The results were:<br />
• Agree – 65%<br />
• Disagree – 11%<br />
• Don’t know – 24%<br />
A number of people qualified their opinion<br />
by stating that they agreed with the decision<br />
to sell, provided that Plunket is adequately<br />
consulted, re-housed and the intent of the<br />
bequest is retained. Many also stressed<br />
that it would be important for the <strong>Council</strong> to<br />
consult with the benefactor’s family, as well<br />
as Plunket and the local community, before a<br />
final decision is made. This has been done.<br />
<strong>Council</strong>’s decision is outlined on pages 3-4<br />
as this amends the LTCCP 2019-2019.<br />
Amending the city’s gambling policy<br />
Five options were presented regarding a<br />
change in policy on the number of gaming<br />
machine venues and the number of<br />
machines. Opinion was divided as to which<br />
option was favoured:<br />
• Option 1 – status quo – 17%<br />
• Option 2 – reduced cap – 18%<br />
• Option 3 – sinking lid – 27%<br />
• Option 4 – partial sinking lid – 7%<br />
• Option 5 – reducing the cap by population<br />
ratio – 15%<br />
• Other – 4%<br />
• Don’t know/none selected – 12%<br />
Amending the city’s gambling policy will<br />
be further considered by the <strong>Council</strong>’s<br />
Strategy and Policy Committee on 14 July<br />
2010 and a final decision made by <strong>Council</strong><br />
on 29 July 2010.<br />
<strong>Hutt</strong> <strong>City</strong> <strong>Council</strong> <strong>Annual</strong> Plan 2010-2011<br />
5
Individual written submissions<br />
The 282 written submissions that were not<br />
presented in the questionnaire format were<br />
analysed separately. Over half of these<br />
written submissions related to the gambling<br />
policy, but there was also a wide range of<br />
other issues for consideration, with the main<br />
topics being:<br />
• Gambling policy – 56%<br />
• Support for the Envirohouse/Percy’s<br />
Reserve – 12%<br />
• Anti-fluoridation in water – 9%<br />
• CBD development – 5%<br />
• Don’t defer the McKenzie Pool upgrade<br />
– 5%<br />
• Roading development<br />
(including Cross Valley Link) – 4%<br />
• Walking and cycling strategy/network<br />
– 4%<br />
• Sport and recreation – 4%<br />
See the <strong>Council</strong>’s website for further<br />
information:<br />
www.huttcity.govt.nz/<strong>Council</strong>/Global-<br />
Calendar/Meetings/Community-Plan-<br />
Committee-Meetings/910-June-2010/<br />
Targeted rates<br />
Business <strong>Hutt</strong> Valley asked the <strong>Council</strong><br />
to introduce a targeted rate on business<br />
properties in the Lower <strong>Hutt</strong> CBD to<br />
raise around $350,000 for CBD business<br />
promotion. The Jackson Street Programme<br />
in Petone asked for a $30,000 increase in<br />
its targeted rate. Both of these proposals<br />
were included in the draft annual <strong>plan</strong>, and<br />
business ratepayers in the areas affected<br />
were surveyed to determine their support<br />
for the targeted rate proposals. The results<br />
of the consultation are available on the<br />
<strong>Council</strong>’s website:<br />
www.huttcity.govt.nz/<strong>Council</strong>/Global-<br />
Calendar/Meetings/Community-Plan-<br />
Committee-Meetings/910-June-2010/Report<br />
on CBD Funding and Jackson St Targeted<br />
Rate Survey.<br />
Following the consideration of submissions,<br />
<strong>Council</strong> has not accepted the CBD targeted<br />
rate proposal. It has accepted the Jackson<br />
Street Programme proposal to increase the<br />
targeted rate by $30,000 to $110,000pa,<br />
and has agreed to adjust the Jackson<br />
Street targeted rate on an annual basis to<br />
allow for inflation.<br />
6
Wendy from Cultured, Jackson St, Petone<br />
Information<br />
Updates
8<br />
This section updates the<br />
information included in<br />
our long term <strong>plan</strong> about<br />
<strong>Council</strong> activities, transport<br />
projects and Wellington<br />
region broadband.<br />
COUNCIL PROJECTS<br />
As well as the major capital and operating<br />
projects listed from page 36, we are involved<br />
in many other activities and initiatives.<br />
Activities occurring during the 2010/11<br />
financial year include:<br />
• Ongoing work to develop an Ageing<br />
Together Strategy, reflecting our desire<br />
to understand the issues that affect older<br />
people in the city, and to work with the<br />
community in creating or supporting<br />
projects or actions to address the issues.<br />
• Increasing our very successful youth<br />
development and youth transition work.<br />
Our existing services such as Nga Ara<br />
Kete - <strong>Hutt</strong> <strong>City</strong>’s youth worker team -<br />
TradeStart and the Secret Level youth<br />
centre support young people to positively<br />
engage in education, employment and the<br />
community, and a new youth service - the<br />
Naenae Computer Clubhouse - has been<br />
launched and will have its first full year of<br />
operation in 2010/11.<br />
• Continuing to work in partnership with<br />
other councils in the region to deliver<br />
shared services including procurement<br />
of goods and services, and investigating<br />
other possibilities for shared services such<br />
as waste management, rates billing and<br />
building control.<br />
• Continuing the <strong>Council</strong>’s Land Review<br />
Project involving land managed as reserve<br />
to formally classify the reserve status<br />
of land with high reserve value, and to<br />
investigate and, where suitable, sell land<br />
identified for possible disposal.<br />
• Continuing with the asset sales<br />
programme to dispose of other land that<br />
is no longer required by <strong>Council</strong>.<br />
TRANSPORT PROJECTS<br />
In March and April 2009, Greater Wellington<br />
Regional <strong>Council</strong> consulted on the Regional<br />
Land Transport Programme for the<br />
Wellington region for 2009/10 to 2011/12.<br />
This programme establishes the regional<br />
priority for many of our transport activities<br />
including state highway activities, local road<br />
improvements, walking and cycling, and<br />
community road safety activities.<br />
The NZ Transport Agency undertook the<br />
detailed design of the proposed grade<br />
separated State Highway 2/State Highway<br />
58 intersection in 2009/10. This project<br />
will address safety and capacity issues at<br />
the Haywards intersection. Construction<br />
is currently programmed for 2010/11 and<br />
2011/12 subject to funding approval (this<br />
timeline is to be further considered by NZTA<br />
in the third quarter of 2010).<br />
The NZ Transport Agency is also<br />
investigating the proposed upgrade of<br />
State Highway 2 between Melling and<br />
Haywards including both the Melling Bridge<br />
and Kennedy Good Bridge intersections.<br />
The subsequent detailed design for the<br />
State Highway 2/Melling intersection is<br />
programmed for 2011/12.<br />
The Ngauranga Triangle (Grenada to<br />
Gracefield) Strategy Study has been<br />
completed. This study was jointly funded by<br />
<strong>Hutt</strong> <strong>City</strong> <strong>Council</strong>, Wellington <strong>City</strong> <strong>Council</strong><br />
and the NZ Transport Agency. The key<br />
components of the study are investigations<br />
into a potential Petone to Grenada link,<br />
the State Highway 2 to Gracefield Cross<br />
Valley Link, improvements to pedestrian<br />
and cycling facilities on State Highway 2<br />
from Petone to Ngauranga, and improved<br />
pedestrian and cyclist access between the<br />
Petone Foreshore and the Belmont Regional<br />
Park. The completed study forms a technical<br />
input to Greater Wellington Regional <strong>Council</strong>’s<br />
forthcoming review of the <strong>Hutt</strong> Corridor Plan.<br />
Full public consultation will be undertaken as<br />
part of this review later in 2010.<br />
<strong>Hutt</strong> <strong>City</strong> <strong>Council</strong> has a funding allocation<br />
of $22 million in 2015/16 for improvements<br />
to local road networks which may arise<br />
from the transport studies and investigation<br />
noted previously. This funding allocation is<br />
the anticipated net cost to <strong>Council</strong> of these<br />
improvement projects, if they proceed.<br />
The remaining major projects proposed over<br />
the 10 year period are expected to be fully<br />
funded by the NZ Transport Agency.<br />
More information is available on Greater<br />
Wellington’s website: www.gw.govt.nz<br />
WELLINGTON REGION BROADBAND<br />
The Government is investing $1.5 billion to<br />
accelerate the roll out of ultrafast broadband to<br />
75% of New Zealanders. In the first six years<br />
there will be a focus on priority broadband users<br />
such as businesses, schools and health services,<br />
plus greenfield developments and certain<br />
residential areas. Later this year the Government<br />
is expected to announce which commercial<br />
partners it will be working with in each region.<br />
As part of the identified workstreams in the<br />
Wellington Regional Strategy, councils in the<br />
region are working together to determine their<br />
potential role and practical steps to expedite the<br />
Government’s initiative in the region. Possible ways<br />
in which the <strong>Council</strong> could assist this include:<br />
• streamlining of consent processes<br />
• coordination of road openings<br />
• consideration and permitting of new<br />
deployment technologies<br />
• leveraging the use of <strong>Council</strong> assets,<br />
eg use of existing ducts.
<strong>Council</strong> staff, Town Hall<br />
Achieving our Goals
The organisation is divided into five groups and<br />
18 key activities:<br />
• Group People is responsible for Libraries,<br />
Museums, Aquatics and Recreation, Parks<br />
and Reserves, Community Support, and<br />
Property.<br />
• Group Utility Services is responsible<br />
for Roading and Traffic, Water Supply,<br />
Wastewater, Stormwater, and Solid Waste.<br />
• Group Environment is responsible for<br />
Environmental Management and Emergency<br />
Management.<br />
• Group Economy is responsible for<br />
Local Urban Environment and Economic<br />
Development.<br />
• Group Organisation is responsible for<br />
Elected Members, Advice and Support, and<br />
Managing Services.<br />
From page 12 you’ll find descriptions of<br />
our 18 activities, along with targets for their<br />
performance and the ways in which we’ll<br />
measure progress.<br />
Key performance indicators<br />
We’ve also developed five ‘key performance<br />
indicators’ so we can track and assess our<br />
performance. They are:<br />
• Budget management<br />
• Customer satisfaction<br />
• Staff perceptions<br />
• Project completion<br />
• Compliance with the law, contracts,<br />
consents, employment agreements,<br />
health and safety requirements and<br />
<strong>Council</strong> policy.<br />
Budget management<br />
This key performance indicator compares<br />
our results with the budget.<br />
As you can see in the graph, we’ve<br />
delivered operating and capital surpluses<br />
compared with budget every year since<br />
1998. However, these favourable results are<br />
typically the result of timing differences on<br />
project completion.<br />
Customer satisfaction<br />
We monitor customer satisfaction levels<br />
through an independent annual survey.<br />
This graph shows that we’ve achieved<br />
steady results that are above the<br />
average of our peer councils, and we’re<br />
committed to continuing to improve.<br />
favourable variance $m<br />
%<br />
100<br />
10<br />
9<br />
8<br />
7<br />
6<br />
5<br />
4<br />
3<br />
2<br />
1<br />
90<br />
80<br />
70<br />
60<br />
Budget Management<br />
1998 1999 2000 2001 2002 2003 2004 2005 2006 2007 2008 2009<br />
Customer Satisfaction<br />
Operating<br />
Capital<br />
1995 1996 1997 1998 1999 2000 2001 2002 2003 2004 2005 2006 2007 2008 2009<br />
Best<br />
practice<br />
Peer<br />
average<br />
10
Staff perceptions<br />
We measure staff perceptions using the<br />
John Robertson & Associates’ `Best<br />
Places to Work’ survey.<br />
The graph indicates that our staff<br />
perceive <strong>Hutt</strong> <strong>City</strong> <strong>Council</strong> to be a<br />
better place to work than the average<br />
local authority. Emphasis is placed on<br />
Organisation Development initiatives that<br />
support making <strong>Hutt</strong> <strong>City</strong> a great place to<br />
work. These initiatives include improving<br />
our leadership capability, a strong internal<br />
communications strategy, training and<br />
development opportunities that support<br />
our values and vision, and opportunities<br />
for flexible work wherever possible.<br />
%<br />
Staff Perceptions<br />
75<br />
73<br />
71<br />
69<br />
67<br />
65<br />
63<br />
61<br />
59<br />
57<br />
55<br />
2005 2006 2007 2008 2009<br />
<strong>Hutt</strong> <strong>City</strong> <strong>Council</strong> Local Government Benchmark<br />
Compliance<br />
As we are a significant and complex business<br />
operating in a wide variety of areas, it’s vital<br />
that our staff, contractors and other business<br />
associates comply with the law, contracts,<br />
consents, employment agreements, health<br />
and safety requirements and <strong>Council</strong> policy.<br />
We monitor this compliance on a monthly<br />
basis, with a target of having no significant<br />
non-compliance instances. We’ve achieved<br />
this every year since 2004. While there have<br />
been some minor breaches, these have been<br />
remedied with no significant impact on our<br />
operations.<br />
Year<br />
Insignificant<br />
Non-compliance instances<br />
Significant<br />
2004 9 –<br />
2005 6 –<br />
Project completion<br />
Every year we commit to up to 300<br />
projects through our <strong>Annual</strong> Plan.<br />
Inevitably, some of these projects can’t<br />
be completed during the year for various<br />
reasons such as unseasonal weather,<br />
so we usually carry them into the next<br />
financial year and complete them then. For<br />
this reason we have a target of completing<br />
at least 90% of projects scheduled for the<br />
financial year.<br />
350<br />
300<br />
250<br />
200<br />
150<br />
100<br />
Project Completion<br />
Target: above 90%<br />
100%<br />
90%<br />
80%<br />
70%<br />
60%<br />
50%<br />
40%<br />
30%<br />
2006 1 –<br />
2007 3 –<br />
2008 1 –<br />
2009 1 –<br />
50<br />
20%<br />
10%<br />
0<br />
1999 2000 2001 2002 2003 2004 2005 2006 2007 2008 2009<br />
0%<br />
Number of <strong>plan</strong>ned projects (LHS)<br />
Percentage complete (RHS)<br />
<strong>Hutt</strong> <strong>City</strong> <strong>Council</strong> <strong>Annual</strong> Plan 2010-2011<br />
11
Our Targets and Performance Measures for the Next Year<br />
Group People<br />
Group People is responsible for managing the community’s<br />
cultural, social and recreational assets in the form of the<br />
library network, TheNewDowse and Petone Settlers<br />
Museums including their collections, swimming pools and<br />
the network of parks and reserves to the agreed service<br />
levels described in our asset management <strong>plan</strong>s.<br />
Activity 1: Libraries<br />
What we do<br />
We provide, maintain and manage eight libraries across the city. Run as a single citywide<br />
service, their primary role is to provide written and recorded material such as books,<br />
audiovisual resources and access to electronic information.<br />
Why we do it<br />
People use library services for many purposes, including learning, research and entertainment.<br />
By providing libraries, we enable all citizens to access information, knowledge and learning<br />
opportunities. The services and facilities are a collective resource that is greater than any<br />
individual or family could afford or accommodate. They support community learning, literacy<br />
and recreation.<br />
How we measure the service provided<br />
MEASURE<br />
ACHIEVED<br />
2006/07<br />
ACHIEVED<br />
2007/08<br />
ACHIEVED<br />
2008/09<br />
TARGET<br />
2009/10*<br />
TARGET<br />
2010/11<br />
Percentage of residents who have<br />
used library services during the year<br />
(measured by independent survey)<br />
Residents’ satisfaction with library<br />
services (measured by independent<br />
survey)<br />
Number of physical visits per year<br />
(measured by management reports)<br />
Number of visits via the Internet per<br />
year (measured by management<br />
reports)<br />
Library stock turnover (measured<br />
by New Zealand Public Library<br />
Statistics) Note: a number greater<br />
than or equal to the national<br />
mean shows that our library stock<br />
turnover is at least equal to or<br />
better than is achieved nationally.<br />
81% 78% 82% ≥ 80% ≥ 80%<br />
97% 98% 98% ≥ 97% ≥ 97%<br />
1,124,969 1,042,825 1,102,124 1,200,000 1,200,000<br />
683,320 83,647<br />
online<br />
catalogue<br />
transactions<br />
426,921<br />
website visits<br />
5.85 5.69<br />
(national<br />
mean 3.82)<br />
(average<br />
annual<br />
circulation<br />
per item)<br />
(national<br />
mean 4.3)<br />
(average<br />
annual<br />
circulation<br />
per item)<br />
314,419 120,000<br />
online<br />
catalogue<br />
transactions<br />
5.69<br />
(national<br />
mean 3.54)<br />
(average<br />
annual<br />
circulation<br />
per item)<br />
230,000<br />
website visits<br />
≥ national<br />
mean<br />
Note: Survey percentages exclude those who responded ‘Don’t Know’.<br />
*Results for 2009/2010 will be published in <strong>Council</strong>’s <strong>Annual</strong> Report for the year ending 30 June 2010.<br />
200,000<br />
Libraries<br />
Online visits<br />
85,000 pay<br />
sessions on<br />
Connect<br />
≥ national<br />
mean<br />
12
Activity 2: Museums<br />
What we do<br />
We operate two museums, which are open to the public at no charge other than for special<br />
exhibitions:<br />
• TheNewDowse collects and displays fine art as well as decorative and applied arts, and is<br />
a conduit for community engagement and participation in the creative arts, underpinned by<br />
innovative exhibitions, education and associated community programmes.<br />
• The Petone Settlers Museum specialises in showcasing the social history of the early Maori<br />
and European settlement of the lower <strong>Hutt</strong> Valley and Petone area.<br />
Why we do it<br />
By providing museums we enable people to freely access arts and cultural facilities which<br />
enrich, inspire and offer a range of lifelong learning opportunities. The museums act as a<br />
focal point for the community, enhance cultural life and diversity, and promote civic pride and<br />
community values.<br />
How we measure the service provided<br />
MEASURE<br />
Number of museum visits per year<br />
(measured by management reports)<br />
Residents’ satisfaction with<br />
TheNewDowse museum (measured<br />
by independent survey)<br />
Residents’ satisfaction with Petone<br />
Settlers Museum (measured by<br />
independent survey)<br />
Education programmes delivered<br />
that meet the needs and<br />
expectations of school groups<br />
(measured by management reports<br />
and participant evaluation forms)<br />
ACHIEVED<br />
2006/07<br />
ACHIEVED<br />
2007/08<br />
ACHIEVED<br />
2008/09<br />
TARGET<br />
2009/10*<br />
TARGET<br />
2010/11<br />
107,799 271,801 198,391 200,000 200,000<br />
91% 93% 94% ≥ 93% ≥ 93%<br />
89% 95% 98% ≥ 93% ≥ 93%<br />
New<br />
measure for<br />
2008/09<br />
New<br />
measure for<br />
2008/09<br />
Education<br />
programmes<br />
delivered<br />
to 13,254<br />
students<br />
91%<br />
satisfaction<br />
Education<br />
programmes<br />
delivered<br />
to 11,000<br />
students<br />
90%<br />
satisfaction<br />
Note: Survey percentages quoted exclude those who responded ‘Don’t Know’.<br />
*Results for 2009/2010 will be published in <strong>Council</strong>’s <strong>Annual</strong> Report for the year ending 30 June 2010.<br />
<strong>Hutt</strong> <strong>City</strong> <strong>Council</strong> <strong>Annual</strong> Plan 2010-2011<br />
Education<br />
programmes<br />
delivered<br />
to 11,000<br />
students<br />
90%<br />
satisfaction<br />
Activity 3: Aquatics and Recreation<br />
What we do<br />
We provide and maintain six swimming pools in <strong>Hutt</strong> <strong>City</strong>, and provide quality and accessible<br />
tuition in essential water safety and life skills. Our recreational programmes are community<br />
based and designed to encourage residents to engage in a range of recreational activities.<br />
Why we do it<br />
People’s lives are positively affected by participation in recreation, sports, fitness and cultural<br />
activities – and providing these high-quality services at a low user cost makes them available<br />
to the whole community. Aquatics and recreational programmes also make an important<br />
contribution to creating an attractive area for people and businesses considering moving to<br />
<strong>Hutt</strong> <strong>City</strong>.<br />
How we measure the service provided<br />
MEASURE<br />
Residents’ satisfaction with pools<br />
(measured by independent survey)<br />
Residents’ use of pools (measured<br />
by independent survey)<br />
Out of School Care and Recreation<br />
(OSCAR) accreditation of quality<br />
standards for holiday programmes<br />
(measured by external audit)<br />
POOLSAFE accreditation for<br />
swimming pool operation, including<br />
quality standards for health and<br />
safety, water quality, supervision,<br />
pool building and operation,<br />
signage and other standards<br />
(measured by external audit)<br />
Cost per visit to <strong>Council</strong> of aquatic<br />
services provided (measured by<br />
management reports)<br />
User satisfaction with ‘Leisure<br />
Active’ programmes and events<br />
(measured by independent survey)<br />
Residents’ use of ‘Leisure Active’<br />
programmes and events (measured<br />
by independent survey)<br />
ACHIEVED<br />
2006/07<br />
ACHIEVED<br />
2007/08<br />
ACHIEVED<br />
2008/09<br />
TARGET<br />
2009/10*<br />
TARGET<br />
2010/11<br />
93% 95% 94% ≥ 93% ≥ 93%<br />
65% 67% 69% ≥ 65% ≥ 65%<br />
Accreditation<br />
maintained<br />
Accreditation<br />
maintained<br />
Accreditation<br />
maintained<br />
Accreditation<br />
maintained<br />
Accreditation<br />
maintained<br />
Accreditation<br />
maintained<br />
Accreditation<br />
maintained<br />
Accreditation<br />
maintained<br />
$3.70 $3.84 $4.02 $4.07 $4.18<br />
New<br />
measure for<br />
2009/10<br />
New<br />
measure for<br />
2009/10<br />
New<br />
measure for<br />
2009/10<br />
New<br />
measure for<br />
2009/10<br />
New<br />
measure for<br />
2009/10<br />
New<br />
measure for<br />
2009/10<br />
Accreditation<br />
maintained<br />
Accreditation<br />
maintained<br />
≥ 92% ≥ 92%<br />
≥ 30% ≥ 30%<br />
Note: Survey percentages quoted exclude those who responded ‘Don’t Know’.<br />
*Results for 2009/2010 will be published in <strong>Council</strong>’s <strong>Annual</strong> Report for the year ending 30 June 2010.<br />
13
14<br />
Activity 4: Parks and Reserves<br />
What we do<br />
We provide and maintain active and passive recreational facilities in <strong>Hutt</strong> <strong>City</strong> for public<br />
enjoyment and wellbeing. With access largely free of charge, our recreation areas are both<br />
natural and developed. Most of our work is targeted at maintaining developed areas and<br />
retaining bush land in its natural state. ‘Parks and Reserves’ also includes <strong>Council</strong> cemeteries.<br />
Why we do it<br />
In providing and maintaining parks, reserves and street gardens, we help to create a pleasant<br />
environment in which people can live, work and play. Providing and maintaining these areas at<br />
high quality and low user cost makes them available to the whole community.<br />
How we measure the service provided<br />
MEASURE<br />
Residents’ satisfaction with:<br />
• sportsgrounds<br />
• parks, reserves and gardens<br />
• cemeteries<br />
(measured by independent survey)<br />
Sports fields meet the standard<br />
agreed with sports codes<br />
(measured by audits and<br />
complaints received)<br />
Area of parks and reserves per<br />
1000 of population<br />
Percentage of households that<br />
have used or visited parks, reserves<br />
or gardens in the previous 12<br />
months (measured by independent<br />
survey)<br />
Maintain a high standard of<br />
maintenance and development<br />
of playgrounds, parks, reserves,<br />
gardens and cemeteries (measured<br />
by audits)<br />
ACHIEVED<br />
2006/07<br />
98%<br />
98%<br />
95%<br />
ACHIEVED<br />
2007/08<br />
98%<br />
98%<br />
93%<br />
ACHIEVED<br />
2008/09<br />
97%<br />
96%<br />
96%<br />
TARGET<br />
2009/10*<br />
≥ 95%<br />
≥ 95%<br />
≥ 90%<br />
TARGET<br />
2010/11<br />
≥ 95%<br />
≥ 95%<br />
≥ 90%<br />
98% 98% 97% ≥ 95% ≥ 95%<br />
53 hectares 54 hectares 54 hectares ≥ 24.9<br />
hectares<br />
≥ 24.9<br />
hectares<br />
89% 87% 88% ≥ 89% ≥ 89%<br />
95% 95% 95% 95% of<br />
contract<br />
and asset<br />
management<br />
<strong>plan</strong><br />
requirements<br />
met<br />
Note: Survey percentages quoted exclude those who responded ‘Don’t Know’.<br />
*Results for 2009/2010 will be published in <strong>Council</strong>’s <strong>Annual</strong> Report for the year ending 30 June 2010.<br />
95% of<br />
contract<br />
and asset<br />
management<br />
<strong>plan</strong><br />
requirements<br />
met<br />
Activity 5: Community Support<br />
What we do<br />
We support our community through services such as facilitation, advocacy and consultation<br />
and through providing grants to community organisations and groups. These services are<br />
provided through our Community Development and Youth Development teams or private<br />
contracts. We’ve also increased our focus on working with government agencies and using<br />
funding from externally sourced contracts to provide services to our community.<br />
Why we do it<br />
We’ve always been committed to identifying and understanding our communities so that we<br />
can respond appropriately to issues affecting them. Our support helps community groups to<br />
achieve their goals where they can’t do it themselves because of a lack of resources.<br />
How we measure the service provided<br />
MEASURE<br />
Community satisfaction with<br />
support programmes delivered<br />
by Community and Youth<br />
Development teams (measured by<br />
independent survey)<br />
Community organisations’<br />
satisfaction with the availability and<br />
quality of our support, advice and<br />
funding (measured by survey of<br />
community organisations)<br />
Residents’ perceptions of <strong>Hutt</strong> <strong>City</strong><br />
in terms of<br />
• their sense of community in their<br />
local neighbourhood<br />
• their sense of safety at home, in<br />
their neighbourhood and in the<br />
city centre<br />
• their sense of the positive<br />
impacts of our population’s<br />
diversity<br />
(measured by various surveys)<br />
ACHIEVED<br />
2006/07<br />
New<br />
measure for<br />
2009/10<br />
New<br />
measure for<br />
2009/10<br />
New<br />
measure for<br />
2009/10<br />
ACHIEVED<br />
2007/08<br />
New<br />
measure for<br />
2009/10<br />
New<br />
measure for<br />
2009/10<br />
ACHIEVED<br />
2008/09<br />
New<br />
measure for<br />
2009/10<br />
New<br />
measure for<br />
2009/10<br />
TARGET<br />
2009/10*<br />
TARGET<br />
2010/11<br />
≥ 90% ≥ 90%<br />
≥ 90% ≥ 90%<br />
New<br />
measure for<br />
60%<br />
2009/10<br />
≥ 60% ≥ 60%<br />
79% ≥ 79% ≥ 79%<br />
59% ≥ 59% ≥ 59%<br />
(Source:<br />
Quality of Life<br />
2007 Survey<br />
of New<br />
Zealand’s 12<br />
largest cities)<br />
Note: Survey percentages quoted exclude those who responded ‘Don’t Know’.<br />
*Results for 2009/2010 will be published in <strong>Council</strong>’s <strong>Annual</strong> Report for the year ending 30 June 2010.
Activity 6: Property<br />
What we do<br />
We have a 100% shareholding in Urban Plus Limited (trading as UrbanPlus), a <strong>Council</strong>controlled<br />
trading organisation that owns and manages housing units on our behalf – mainly<br />
for the elderly and socially disadvantaged.<br />
UrbanPlus aims over time to increase the number of rental properties available to residents,<br />
and is also involved in developing and selling land within the city, both on its own account and<br />
on our behalf, to meet the city’s growing and changing needs.<br />
UrbanPlus also manages a variety of properties for our community’s use – mainly community<br />
and civic halls and venues, public toilets, community houses and the <strong>Council</strong> Administration<br />
Building. We review these facilities regularly for their efficiency and ability to meet changing<br />
public requirements.<br />
Why we do it<br />
We provide community and civic halls and venues because they offer an environment for a<br />
diverse range of social, cultural and community-based activities, including clubs, indoor sports,<br />
band practices, arts and theatre. We provide public toilets to safeguard public health – and<br />
ensure they are physically accessible, appropriately located, designed and built, and cleaned<br />
and maintained to appropriate standards.<br />
Regular assessments of the property we own and occupy can result in property upgrades and<br />
sales of surplus assets.<br />
How we measure the service provided<br />
MEASURE<br />
ACHIEVED<br />
2006/07<br />
ACHIEVED<br />
2007/08<br />
ACHIEVED<br />
2008/09<br />
TARGET<br />
2009/10*<br />
TARGET<br />
2010/11<br />
Tenants’ satisfaction with <strong>Council</strong><br />
accommodation (measured by<br />
internal survey)<br />
Residents’ satisfaction with:<br />
• public halls<br />
• public toilets<br />
(measured by independent survey)<br />
Occupancy rate of <strong>Council</strong><br />
rental housing (measured by<br />
management reports)<br />
Not<br />
measured<br />
94%<br />
58%<br />
93% 91% 90% 90%<br />
95%<br />
69%<br />
92%<br />
68%<br />
≥ 94%<br />
≥ 58%<br />
≥ 94%<br />
≥ 70%<br />
94% 97% 97% 90% 90%<br />
Note: Survey percentages quoted exclude those who responded ‘Don’t Know’. We work to meet these measures<br />
through UrbanPlus.<br />
*Results for 2009/2010 will be published in <strong>Council</strong>’s <strong>Annual</strong> Report for the year ending 30 June 2010.<br />
<strong>Hutt</strong> <strong>City</strong> <strong>Council</strong> <strong>Annual</strong> Plan 2010-2011<br />
15
Group Utility Services<br />
Group Utility Services is responsible for managing the<br />
community’s infrastructural assets in the form of the<br />
roading, water supply, wastewater and stormwater<br />
networks, the wastewater treatment system and the city’s<br />
landfills. These assets are maintained to agreed levels of<br />
service set out in our asset management <strong>plan</strong>s.<br />
No. Reported injury Crashes<br />
300<br />
250<br />
200<br />
150<br />
100<br />
50<br />
0<br />
Injury Crashes within Lower <strong>Hutt</strong> excluding State Highways<br />
178<br />
141 144 149 153<br />
1999 2000 2001 2002 2003 2004 2005 2006 2007 2008<br />
163<br />
Number of Injury Crashes Reported<br />
119<br />
151<br />
242<br />
215<br />
Trend of Reported Crashes<br />
Activity 7: Roading and Traffic<br />
What we do<br />
Our ‘Roading and Traffic’ Activity includes:<br />
• the professional and technical work involved in managing the city’s roading network<br />
• the improvement and day-to-day operation and maintenance of footpaths, road pavement/<br />
reconstruction/upgrades, traffic signals, signs, street lighting, parking services, bridge<br />
maintenance and various road safety activities.<br />
We support this work through policy development, forward <strong>plan</strong>ning, road safety co-ordination,<br />
and various quality and safety management systems.<br />
Why we do it<br />
Having the road corridor in public ownership ensures that all our residents have appropriate<br />
access to property and freedom of travel throughout <strong>Hutt</strong> <strong>City</strong>. We provide sealed roads, footpaths<br />
and street lights so that motor vehicles, bicycles and pedestrians can travel efficiently and safely.<br />
How we measure the service provided<br />
MEASURE<br />
Residents’ satisfaction with:<br />
• street lighting<br />
• roads and gutters being free of litter<br />
• traffic control<br />
• footpaths<br />
• roads<br />
• parking in and around <strong>Hutt</strong> <strong>City</strong><br />
• the safety and convenience of movement<br />
around city streets<br />
(measured by independent survey)<br />
‘Road Condition Index’, which measures<br />
the condition of the road surface (measured<br />
by the NZ Transport Agency) Note: a lower<br />
number indicates an improved rating.<br />
ACHIEVED<br />
2006/07<br />
87%<br />
86%<br />
82%<br />
81%<br />
74%<br />
71%<br />
82%<br />
ACHIEVED<br />
2007/08<br />
90%<br />
89%<br />
87%<br />
81%<br />
80%<br />
80%<br />
87%<br />
ACHIEVED<br />
2008/09<br />
88%<br />
91%<br />
87%<br />
81%<br />
75%<br />
80%<br />
87%<br />
TARGET<br />
2009/10*<br />
≥ 87%<br />
≥ 86%<br />
≥ 82%<br />
≥ 81%<br />
≥ 74%<br />
≥ 71%<br />
≥ 82%<br />
2.7 2.7 1.4 Hold or<br />
improve<br />
rating<br />
TARGET<br />
2010/11<br />
≥ 87%<br />
≥ 86%<br />
≥ 82%<br />
≥ 81%<br />
≥ 74%<br />
≥ 78%<br />
≥ 82%<br />
Hold or<br />
improve<br />
rating<br />
‘Smooth Travel Exposure’, which is a<br />
nationally accepted measure of road<br />
roughness (measured by the NZ Transport<br />
Agency) Note: a higher percentage indicates<br />
an improved rating.<br />
75% 76% 80% Hold or<br />
improve<br />
rating<br />
Hold or<br />
improve<br />
rating<br />
16<br />
Accident trend (measured by the NZ<br />
Transport Agency)<br />
See graph See graph See graph Contribute<br />
to a<br />
reducing<br />
trend over<br />
10 years<br />
Note: Survey percentages quoted exclude those who responded ‘Don’t Know’.<br />
*Results for 2009/2010 will be published in <strong>Council</strong>’s <strong>Annual</strong> Report for the year ending 30 June 2010.<br />
Contribute<br />
to a<br />
reducing<br />
trend over<br />
10 years
Activity 8: Water Supply<br />
What we do<br />
We provide a sustainable and high-quality water supply to our community for domestic and<br />
commercial use. We buy bulk water from Greater Wellington Regional <strong>Council</strong>, and then<br />
distribute it to the community through our water supply system. We regularly monitor the water<br />
quality and <strong>plan</strong> for the city’s future water supply, including any maintenance and upgrades<br />
needed to maintain the required service.<br />
Why we do it<br />
In supplying high-quality, affordable water, we contribute to:<br />
• our community’s health<br />
• community safety (through the water supply system’s fire-fighting capability)<br />
• industrial and residential development.<br />
How we measure the service provided<br />
MEASURE<br />
Residents’ satisfaction with the<br />
city water supply (measured by<br />
independent survey)<br />
Compliance with New Zealand<br />
Drinking Water Standards<br />
ACHIEVED<br />
2006/07<br />
ACHIEVED<br />
2007/08<br />
ACHIEVED<br />
2008/09<br />
TARGET<br />
2009/10*<br />
TARGET<br />
2010/11<br />
97% 96% 95% ≥ 95% ≥ 95%<br />
Achieved full<br />
compliance<br />
with<br />
New Zealand<br />
Drinking<br />
Water<br />
Standards<br />
Achieved full<br />
compliance<br />
with<br />
New Zealand<br />
Drinking<br />
Water<br />
Standards<br />
Achieved full<br />
compliance<br />
with 1,587<br />
of the 1,590<br />
tests carried<br />
out<br />
Full<br />
compliance<br />
with<br />
New Zealand<br />
Drinking<br />
Water<br />
Standards<br />
Full<br />
compliance<br />
with<br />
New Zealand<br />
Drinking<br />
Water<br />
Standards<br />
Quality of water (measured by<br />
Ministry of Health)<br />
Note: ‘b’ grading means a<br />
satisfactory, low level of risk.<br />
Most of <strong>Hutt</strong> <strong>City</strong> water supply is<br />
un-chlorinated. Chlorination of the<br />
water supply would be required to<br />
achieve an `a’ grading.<br />
Achieved a<br />
‘b’ grading<br />
for the <strong>Hutt</strong><br />
<strong>City</strong> water<br />
supply<br />
Achieved a<br />
‘b’ grading<br />
for the <strong>Hutt</strong><br />
<strong>City</strong> water<br />
supply<br />
Achieved a<br />
‘b’ grading<br />
from the<br />
Ministry of<br />
Health for<br />
the <strong>Hutt</strong> <strong>City</strong><br />
water supply<br />
distribution<br />
Achieve ‘b’<br />
grading from<br />
the Ministry<br />
of Health for<br />
the <strong>Hutt</strong> <strong>City</strong><br />
water supply<br />
Achieve ‘b’<br />
grading from<br />
the Ministry<br />
of Health for<br />
the <strong>Hutt</strong> <strong>City</strong><br />
water supply<br />
Provide a reliable water supply<br />
service (measured by contract<br />
reports)<br />
Achieved<br />
fewer<br />
than 0.2<br />
un<strong>plan</strong>ned<br />
supply cuts<br />
per 1000<br />
connections<br />
Achieved<br />
fewer<br />
than 1.48<br />
un<strong>plan</strong>ned<br />
supply cuts<br />
per 1000<br />
connections<br />
Achieved<br />
1.99<br />
un<strong>plan</strong>ned<br />
supply cuts<br />
per 1000<br />
connections<br />
Fewer<br />
than four<br />
un<strong>plan</strong>ned<br />
supply cuts<br />
per 1000<br />
connections<br />
Fewer<br />
than four<br />
un<strong>plan</strong>ned<br />
supply cuts<br />
per 1000<br />
connections<br />
Respond promptly to water supply<br />
disruptions (measured by contract<br />
reports)<br />
Maintain the average un-metered<br />
water consumption in <strong>Hutt</strong> <strong>City</strong><br />
99% 99% 98% 97% of<br />
requests<br />
responded<br />
to within<br />
one hour of<br />
notification<br />
Achieved<br />
less than<br />
325 litres<br />
per head per<br />
day<br />
Achieved<br />
less than<br />
339 litres<br />
per head per<br />
day<br />
Not<br />
measured in<br />
2008/09<br />
Less than<br />
350 litres<br />
per head per<br />
day<br />
97% of<br />
requests<br />
responded<br />
to within<br />
one hour of<br />
notification<br />
Less than<br />
350 litres<br />
per head per<br />
day<br />
Note: Survey percentages quoted exclude those who responded ‘Don’t Know’. We work to meet these measures<br />
through Capacity.<br />
*Results for 2009/2010 will be published in <strong>Council</strong>’s <strong>Annual</strong> Report for the year ending 30 June 2010.<br />
17<br />
<strong>Hutt</strong> <strong>City</strong> <strong>Council</strong> <strong>Annual</strong> Plan 2010-2011
18<br />
Activity 9: Wastewater<br />
What we do<br />
We provide a piping network that takes household and commercial effluent to the Seaview<br />
Wastewater Treatment Plant, which treats it to public health and environmental standards.<br />
Opened in November 2001, the resource consents under which the Treatment Plant now<br />
operates ensure that all relevant standards are adhered to, and that full compliance with the<br />
Resource Management Act 1991 is achieved. The Plant’s operation has led to a significant<br />
improvement to the environment. We regularly undertake maintenance and upgrades to<br />
maintain the required service levels.<br />
Why we do it<br />
By collecting, treating and disposing of wastewater, we provide a service to residents and<br />
businesses that supports development in the city and protects the physical environment and<br />
our community’s health.<br />
How we measure the service provided<br />
MEASURE<br />
Residents’ satisfaction with the city<br />
wastewater service (measured by<br />
independent survey)<br />
No resource consent-related<br />
infringement notices received from<br />
Regional <strong>Council</strong><br />
Provide a reliable wastewater<br />
service (measured by contract<br />
reports)<br />
Respond promptly to wastewater<br />
disruptions (measured by contract<br />
reports)<br />
ACHIEVED<br />
2006/07<br />
ACHIEVED<br />
2007/08<br />
ACHIEVED<br />
2008/09<br />
TARGET<br />
2009/10*<br />
TARGET<br />
2010/11<br />
96% 97% 97% ≥ 95% ≥ 95%<br />
100%<br />
compliance<br />
Achieved 0.7<br />
incidents<br />
100%<br />
compliance<br />
Achieved<br />
1.01<br />
incidents<br />
100%<br />
compliance<br />
Achieved<br />
0.7975<br />
incidents<br />
No<br />
infringement<br />
notices<br />
Fewer<br />
than 1.2<br />
wastewater<br />
incidents<br />
reported per<br />
kilometre of<br />
wastewater<br />
reticulation<br />
pipeline<br />
99% 99% 98% 97% of<br />
requests<br />
responded<br />
to within<br />
one hour of<br />
notification<br />
No<br />
infringement<br />
notices<br />
Fewer<br />
than 1.2<br />
wastewater<br />
incidents<br />
reported per<br />
kilometre of<br />
wastewater<br />
reticulation<br />
pipeline<br />
97% of<br />
requests<br />
responded<br />
to within<br />
one hour of<br />
notification<br />
Note: Survey percentages quoted exclude those who responded ‘Don’t Know’. We work to meet these measures<br />
through Capacity.<br />
*Results for 2009/2010 will be published in <strong>Council</strong>’s <strong>Annual</strong> Report for the year ending 30 June 2010.<br />
Activity 10: Stormwater<br />
What we do<br />
We provide a stormwater drainage system to manage the surface water run-off from urban<br />
catchments. Our objective is to achieve the best possible balance between the level of<br />
protection and the cost to our community. This includes maintaining and upgrading assets to<br />
maintain the required service levels.<br />
Why we do it<br />
Most of the development in <strong>Hutt</strong> <strong>City</strong> is concentrated on flat valley plains with the potential for<br />
flooding. We need to control stormwater to protect our community’s health and safety and<br />
minimise property damage. A comprehensive stormwater system is the most efficient way to<br />
do this.<br />
How we measure the service provided<br />
MEASURE<br />
Residents’ satisfaction with the city<br />
stormwater service (measured by<br />
independent survey)<br />
Provide a reliable stormwater<br />
service (measured by contract<br />
reports)<br />
Achieve water quality at main<br />
recreational beaches (measured by<br />
contract reports)<br />
Respond promptly to stormwater<br />
disruptions (measured by contract<br />
reports)<br />
ACHIEVED<br />
2006/07<br />
ACHIEVED<br />
2007/08<br />
ACHIEVED<br />
2008/09<br />
TARGET<br />
2009/10*<br />
TARGET<br />
2010/11<br />
80% 86% 81% ≥ 80% ≥ 80%<br />
Achieved<br />
0.12<br />
incidents<br />
Achieved<br />
Recreational<br />
Water<br />
Quality<br />
Standards<br />
Achieved<br />
0.075<br />
incidents<br />
Achieved<br />
Recreational<br />
Water<br />
Quality<br />
Standards<br />
Achieved<br />
0.1287<br />
incidents<br />
Achieved<br />
Recreational<br />
Water<br />
Quality<br />
Standards<br />
Fewer<br />
than 0.5<br />
stormwater<br />
incident<br />
reported per<br />
kilometre of<br />
stormwater<br />
pipeline<br />
90% of<br />
sampling<br />
days when<br />
water quality<br />
meets<br />
Ministry<br />
for the<br />
Environment<br />
guidelines<br />
99% 98% 99% 97% of<br />
requests<br />
responded<br />
to within<br />
one hour of<br />
notification<br />
Fewer<br />
than 0.5<br />
stormwater<br />
incident<br />
reported per<br />
kilometre of<br />
stormwater<br />
pipeline<br />
90% of<br />
sampling<br />
days when<br />
water quality<br />
meets<br />
Ministry<br />
for the<br />
Environment<br />
guidelines<br />
97% of<br />
requests<br />
responded<br />
to within<br />
one hour of<br />
notification<br />
Note: Survey percentages quoted exclude those who responded ‘Don’t Know’. We work to meet these measures<br />
through Capacity.<br />
*Results for 2009/2010 will be published in <strong>Council</strong>’s <strong>Annual</strong> Report for the year ending 30 June 2010.
Activity 11: Solid Waste<br />
What we do<br />
We manage contracts for the collection of the city’s refuse and recycling, and own and operate<br />
two landfills where people and businesses can dispose of residual waste. We’re working on<br />
‘Silverstream Stage Two’, which will enable us to maintain current service levels when the area<br />
currently being used at Silverstream is full.<br />
Why we do it<br />
Solid waste management is necessary for the health and quality of life of the community, the<br />
local economy and the environment.<br />
How we measure the service provided<br />
MEASURE<br />
Residents’ satisfaction with:<br />
• rubbish collection<br />
• refuse disposal<br />
(measured by independent survey)<br />
No resource consent-related<br />
infringement notices received from<br />
Regional <strong>Council</strong><br />
ACHIEVED<br />
2006/07<br />
93%<br />
87%<br />
100%<br />
compliance<br />
ACHIEVED<br />
2007/08<br />
94%<br />
92%<br />
100%<br />
compliance<br />
ACHIEVED<br />
2008/09<br />
91%<br />
90%<br />
100%<br />
compliance<br />
TARGET<br />
2009/10*<br />
≥ 93%<br />
≥ 87%<br />
100%<br />
compliance<br />
Note: Survey percentages quoted exclude those who responded ‘Don’t Know’.<br />
*Results for 2009/2010 will be published in <strong>Council</strong>’s <strong>Annual</strong> Report for the year ending 30 June 2010.<br />
TARGET<br />
2010/11<br />
≥ 93%<br />
≥ 87%<br />
100%<br />
compliance<br />
Group Environment<br />
Activity 12: Environmental Management<br />
What we do<br />
This activity includes:<br />
• developing, implementing and monitoring the District Plan, relevant bylaws and other<br />
environmental policies and <strong>plan</strong>s for <strong>Hutt</strong> <strong>City</strong>’s sustainable development<br />
• providing resource management and building consents and inspections, and environmental<br />
health and animal services<br />
• regular monitoring to ensure compliance with legislative requirements, the District Plan,<br />
resource and building consent conditions and bylaw requirements<br />
• inspections of business and food premises, certifications, liquor licensing law compliance<br />
and pollution and trade waste control, and monitoring beaches to promote and protect<br />
public health and safety<br />
• monitoring and controlling noise and hazardous substances.<br />
Why we do it<br />
This activity is fundamental to achieving a clean, healthy, attractive and sustainable<br />
environment. It’s also a legal requirement for <strong>Hutt</strong> <strong>City</strong> <strong>Council</strong>.<br />
How we measure the service provided<br />
MEASURE<br />
ACHIEVED<br />
2006/07<br />
ACHIEVED<br />
2007/08<br />
ACHIEVED<br />
2008/09<br />
TARGET<br />
2009/10*<br />
TARGET<br />
2010/11<br />
Residents’ satisfaction with:<br />
• animal services<br />
• inspection services (eg. licences)<br />
• requests for service<br />
(measured by independent surveys)<br />
82%<br />
78%<br />
88%<br />
87%<br />
75%<br />
84%<br />
88%<br />
81%<br />
87%<br />
≥ 82%<br />
≥ 78%<br />
≥ 88%<br />
≥ 82%<br />
≥ 78%<br />
≥ 88%<br />
Land Information Memoranda<br />
(LIMs) processed to comply with<br />
statutory requirements (measured<br />
by management reports)<br />
92%<br />
processed<br />
within<br />
nine working<br />
days<br />
96%<br />
processed<br />
within<br />
nine working<br />
days<br />
97%<br />
processed<br />
within<br />
nine working<br />
days<br />
90%<br />
processed<br />
within<br />
nine working<br />
days<br />
90%<br />
processed<br />
within<br />
nine working<br />
days<br />
<strong>Hutt</strong> <strong>City</strong> <strong>Council</strong> <strong>Annual</strong> Plan 2010-2011<br />
19
MEASURE<br />
ACHIEVED<br />
2006/07<br />
ACHIEVED<br />
2007/08<br />
ACHIEVED<br />
2008/09<br />
TARGET<br />
2009/10*<br />
TARGET<br />
2010/11<br />
MEASURE<br />
ACHIEVED<br />
2006/07<br />
ACHIEVED<br />
2007/08<br />
ACHIEVED<br />
2008/09<br />
TARGET<br />
2009/10*<br />
TARGET<br />
2010/11<br />
Building consent/project<br />
information and resource<br />
consents processed to comply<br />
with the Building Code, Resource<br />
Management Act (RMA) and District<br />
Plan requirements (measured by<br />
computer database records)<br />
Resource consents are monitored<br />
within five working days of being<br />
notified that development is<br />
commencing or within six months<br />
of the consent being granted,<br />
whichever is the sooner<br />
Requests for service referred to<br />
RMA Monitoring and Enforcement<br />
team responded to within<br />
required timeframes (measured<br />
by management and computer<br />
database reports)<br />
87% of<br />
building<br />
consents<br />
processed<br />
within<br />
15 working<br />
days<br />
85% of<br />
non-notified<br />
land use<br />
consents<br />
processed<br />
within 18<br />
working<br />
days<br />
New<br />
measure for<br />
2010/11<br />
New<br />
measure for<br />
2008/09<br />
88% of<br />
building<br />
consents<br />
and 78% of<br />
non-notified<br />
land use<br />
consents<br />
processed<br />
within<br />
18 working<br />
days<br />
New<br />
measure for<br />
2010/11<br />
New<br />
measure for<br />
2008/09<br />
72% of<br />
building<br />
consents<br />
and 88% of<br />
non-notified<br />
land use<br />
consents<br />
processed<br />
within<br />
18 working<br />
days<br />
New<br />
measure for<br />
2010/11<br />
80% of<br />
building and<br />
non-notified<br />
land use<br />
consents<br />
processed<br />
within 18<br />
working<br />
days<br />
New<br />
measure for<br />
2010/11<br />
80% of<br />
building and<br />
non-notified<br />
land use<br />
consents<br />
processed<br />
within 18<br />
working<br />
days<br />
90% of<br />
resource<br />
consents<br />
monitored<br />
within these<br />
timeframes<br />
99% 80% 100%<br />
acknowledged acknowledged acknowledged<br />
within 48<br />
hours<br />
within 48<br />
hours<br />
within 24<br />
hours<br />
Code compliance certificates<br />
issued within 20 working days to<br />
comply with statutory requirements<br />
in the Building Act (measured by<br />
computer database records)<br />
Dog pound open 300 days per year<br />
(measured by management reports)<br />
Dog complaints are responded to<br />
within 30 minutes for dog attacks<br />
and 24 hours for other complaints<br />
(measured by management reports)<br />
Noise complaints are responded<br />
to within 30 minutes (measured by<br />
management reports)<br />
98% 100% 84% 100% issued<br />
within<br />
20 working<br />
days<br />
80% issued<br />
within<br />
18 working<br />
days<br />
Six days per<br />
week except<br />
for public<br />
holidays<br />
100% 100%<br />
100% issued<br />
within<br />
20 working<br />
days<br />
80% issued<br />
within<br />
18 working<br />
days<br />
300 days 300 days 300 days 300 days<br />
99%<br />
98%<br />
95% 95%<br />
84% 85% 87% 85% 85%<br />
Note: Survey percentages quoted exclude those who responded ‘Don’t Know’.<br />
*Results for 2009/2010 will be published in <strong>Council</strong>’s <strong>Annual</strong> Report for the year ending 30 June 2010.<br />
Building consents for fireplaces<br />
are processed in a timely manner<br />
(measured by computer database<br />
records)<br />
New<br />
measure for<br />
2009/10<br />
New<br />
measure for<br />
2009/10<br />
New<br />
measure for<br />
2009/10<br />
100%<br />
processed<br />
within five<br />
working<br />
days<br />
100%<br />
processed<br />
within five<br />
working<br />
days<br />
Building consents for solar panels<br />
are processed in a timely manner<br />
(measured by computer database<br />
records)<br />
New<br />
measure for<br />
2009/10<br />
New<br />
measure for<br />
2009/10<br />
New<br />
measure for<br />
2009/10<br />
100%<br />
processed<br />
within five<br />
working<br />
days<br />
100%<br />
processed<br />
within five<br />
working<br />
days<br />
20<br />
Premises (eg, food outlets and<br />
liquor outlets) registered or licensed<br />
within 30 days of application<br />
(measured by computer database<br />
records)<br />
97% 98% 97% 90% 90%
Activity 13: Emergency Management<br />
What we do<br />
This activity includes:<br />
• developing, implementing and monitoring city-wide emergency management <strong>plan</strong>s<br />
• promoting community preparedness for emergencies<br />
• working with other authorities in the region to <strong>plan</strong> for and respond to hazards, risks<br />
and emergencies.<br />
We also have <strong>plan</strong>s for dealing with and preventing rural fires, and maintain an in-house<br />
capacity to co-ordinate responses to civil defence and rural fire emergencies.<br />
Why we do it<br />
This activity is fundamental to making sure our city is prepared for emergencies. We work<br />
according to the principles of ‘reduce, readiness, response and recovery’.<br />
How we measure the service provided<br />
MEASURE<br />
Percentage of households that<br />
are prepared for a civil defence<br />
emergency (measured by<br />
independent survey)<br />
We respond to emergencies in<br />
accordance with the Wellington<br />
Region Civil Defence Emergency<br />
Management Group Plan and<br />
the Civil Defence Emergency<br />
Management Act 2002 (measured<br />
by management reports and<br />
debrief notes)<br />
We respond to rural fires in<br />
accordance with the <strong>Hutt</strong> <strong>City</strong><br />
Rural Fire Plan and the Forest and<br />
Rural Fires Act 1977 and the Forest<br />
and Rural Fires Regulations 2005<br />
(measured by Wellington Regional<br />
Rural Fire Committee)<br />
ACHIEVED<br />
2006/07<br />
ACHIEVED<br />
2007/08<br />
ACHIEVED<br />
2008/09<br />
TARGET<br />
2009/10*<br />
TARGET<br />
2010/11<br />
56% 56% 58% 60% 60%<br />
100% 100% 100% 100% 100%<br />
100% 100% 100% 100% 100%<br />
Note: Survey percentages quoted exclude those who responded ‘Don’t Know’.<br />
*Results for 2009/2010 will be published in <strong>Council</strong>’s <strong>Annual</strong> Report for the year ending 30 June 2010.<br />
Group Economy<br />
Activity 14: Local Urban Environment<br />
What we do<br />
We work to develop an urban environment that will enhance the city’s image, attracting<br />
people, businesses and investment, and meet our community’s needs and aspirations, while<br />
recognising the important role of our heritage and features.<br />
We:<br />
• implement environmental policies and <strong>plan</strong>s for <strong>Hutt</strong> <strong>City</strong>’s sustainable development,<br />
including environmental education and promotion<br />
• run an annual waste-minimisation programme to promote the concept of ‘reduce, reuse,<br />
recycle’ to businesses and residents.<br />
Why we do it<br />
We recognise that our urban design and infrastructure must support our changing business<br />
and community environment. We manage and develop <strong>Hutt</strong> <strong>City</strong>’s public spaces and preserve<br />
our heritage buildings because this benefits both businesses and our community. It contributes<br />
to our point of difference from other cities, supporting local cultures and enhancing how we<br />
identify ourselves. We manage our waste (through promoting recycling and waste reduction) to<br />
maintain our community’s health and quality of life.<br />
How we measure the service provided<br />
MEASURE<br />
Residents feel a sense of pride in<br />
the way the city looks and feels<br />
(measured by independent survey)<br />
Businesses feel a sense of pride<br />
in the way the city looks and feels<br />
(measured by independent survey)<br />
Residents’ satisfaction with:<br />
• litter control<br />
• recycling<br />
• graffiti levels<br />
(measured by independent survey)<br />
ACHIEVED<br />
2006/07<br />
ACHIEVED<br />
2007/08<br />
ACHIEVED<br />
2008/09<br />
TARGET<br />
2009/10*<br />
86% 90% 91% ≥ previous<br />
results<br />
76% 67% 67% ≥ previous<br />
results<br />
86%<br />
86%<br />
84%<br />
89%<br />
91%<br />
82%<br />
91%<br />
87%<br />
87%<br />
≥ 86%<br />
≥ 86%<br />
≥ 84%<br />
TARGET<br />
2010/11<br />
≥ previous<br />
results<br />
≥ previous<br />
results<br />
≥ 86%<br />
≥ 86%<br />
≥ 84%<br />
<strong>Hutt</strong> <strong>City</strong> <strong>Council</strong> <strong>Annual</strong> Plan 2010-2011<br />
21
MEASURE<br />
Percentage of households that<br />
have used the recycling service in<br />
the previous 12 months (measured<br />
by independent survey)<br />
All residents have access to<br />
community recycling facilities<br />
(measured by management reports)<br />
Tonnes of recycling per annum<br />
(measured by management reports)<br />
ACHIEVED<br />
2006/07<br />
ACHIEVED<br />
2007/08<br />
ACHIEVED<br />
2008/09<br />
TARGET<br />
2009/10*<br />
TARGET<br />
2010/11<br />
79% 86% 85% ≥ 86% ≥ 86%<br />
100% 100% 100% 100% 100%<br />
7129 7479 7349 Increasing Increasing<br />
Note: Survey percentages quoted exclude those who responded ‘Don’t Know’.<br />
*Results for 2009/2010 will be published in <strong>Council</strong>’s <strong>Annual</strong> Report for the year ending 30 June 2010.<br />
Activity 15: Economic Development<br />
What we do<br />
We take a lead role in encouraging <strong>Hutt</strong> <strong>City</strong>’s growth through:<br />
• creating a business-friendly environment<br />
• facilitating the expansion and creation of local businesses and employment<br />
• increasing tourism and events in <strong>Hutt</strong> <strong>City</strong><br />
• contributing to regional growth through regional economic development.<br />
Why we do it<br />
We know that individual businesses generally lack incentives to explore opportunities that<br />
benefit <strong>Hutt</strong> <strong>City</strong> as a whole, as well as themselves. By supporting the business sector and<br />
promoting <strong>Hutt</strong> <strong>City</strong> as a business location and vibrant city, we generate benefits for local<br />
enterprises and our residents.<br />
How we measure the service provided<br />
MEASURE<br />
Businesses’ satisfaction<br />
with economic development<br />
programmes (measured by<br />
business survey)<br />
Residents’ satisfaction with<br />
the Visitor Information Centre<br />
(measured by independent survey)<br />
ACHIEVED<br />
2006/07<br />
ACHIEVED<br />
2007/08<br />
ACHIEVED<br />
2008/09<br />
TARGET<br />
2009/10*<br />
TARGET<br />
2010/11<br />
85% 90% 90% ≥ 85% ≥ 85%<br />
91% Not<br />
measured<br />
<strong>Hutt</strong> <strong>City</strong>’s economic performance<br />
according to the annual Economic<br />
Development Strategy report to<br />
<strong>Council</strong>, which includes measures<br />
such as:<br />
• number of businesses + 1.9% + 1.9% (peer<br />
councils<br />
2.3%)<br />
• number of full-time equivalents<br />
(FTEs) in the workforce<br />
+ 2.0% + 2.7% (peer<br />
councils<br />
1.8%)<br />
• Gross Domestic Product (GDP) + 3.6% + 4.1% (peer<br />
councils<br />
1.8%)<br />
• GDP per capita<br />
• Export Sector as proportion<br />
of GDP<br />
• High Value sectors as<br />
percentage of all sectors<br />
(by GDP)<br />
(GDP measured by Business<br />
Economic Research Ltd)<br />
New<br />
measure<br />
New<br />
measure<br />
New<br />
measure<br />
New<br />
measure<br />
New<br />
measure<br />
New<br />
measure<br />
99% ≥ 91% ≥ 91%<br />
+ 1.2% (peer<br />
councils<br />
2.5%)<br />
+ 0.1% (peer<br />
councils<br />
0.8%)<br />
+ 0.5% (peer<br />
councils<br />
3.1%)<br />
New<br />
measure<br />
New<br />
measure<br />
New<br />
measure<br />
Improvement<br />
in relative<br />
ranking with<br />
other cities<br />
measured.<br />
Working<br />
towards a<br />
10-15%<br />
increase in<br />
number of<br />
businesses,<br />
number of<br />
FTEs and<br />
GDP by<br />
2014, and<br />
a 30%<br />
increase by<br />
2019.<br />
Improvement<br />
in relative<br />
ranking with<br />
other cities<br />
measured.<br />
Working<br />
towards a<br />
10-15%<br />
increase in<br />
number of<br />
businesses,<br />
number of<br />
FTEs and<br />
GDP by<br />
2014, and<br />
a 30%<br />
increase by<br />
2019.<br />
Note: Survey percentages quoted exclude those who responded ‘Don’t Know’.<br />
*Results for 2009/2010 will be published in <strong>Council</strong>’s <strong>Annual</strong> Report for the year ending 30 June 2010.<br />
22
Group Organisation<br />
Activity 16: Elected Members<br />
What we do<br />
Elected members of <strong>Hutt</strong> <strong>City</strong> <strong>Council</strong> have an important role in the community. They:<br />
• provide a governance role for the city<br />
• set <strong>Council</strong>’s strategic direction, including determining the activities we undertake (within<br />
legal parameters)<br />
• monitor our performance on behalf of the city’s residents and ratepayers.<br />
Our governance structure includes community boards and community committees, which<br />
provide local input into our decision-making.<br />
Why we do it<br />
The Elected Members Activity ensures sound governance and robust decision-making within<br />
<strong>Hutt</strong> <strong>City</strong>.<br />
How we measure the service provided<br />
MEASURE<br />
Residents’ satisfaction with<br />
the Mayor’s and councillors’<br />
performance (measured by<br />
independent survey)<br />
Residents’ satisfaction with the way<br />
we spend their rates (measured by<br />
independent survey)<br />
Residents’ satisfaction with our<br />
public consultation (measured by<br />
independent survey)<br />
ACHIEVED<br />
2006/07<br />
ACHIEVED<br />
2007/08<br />
ACHIEVED<br />
2008/09<br />
TARGET<br />
2009/10*<br />
TARGET<br />
2010/11<br />
88% 94% 91% ≥ 90% ≥ 90%<br />
81% 86% 82% ≥ 83% ≥ 83%<br />
New<br />
measure for<br />
2009/10<br />
New<br />
measure for<br />
2009/10<br />
New<br />
measure for<br />
2009/10<br />
Improvement<br />
Note: Survey percentages quoted exclude those who responded ‘Don’t Know’.<br />
*Results for 2009/2010 will be published in <strong>Council</strong>’s <strong>Annual</strong> Report for the year ending 30 June 2010.<br />
Improvement<br />
Activity 17: Advice and Support<br />
What we do<br />
This activity comprises the processes that support our decision-making, such as strategic<br />
<strong>plan</strong>ning, policy development and monitoring and reporting.<br />
Why we do it<br />
Professional advice and support are necessary to help us and community boards and<br />
committees to make informed decisions on behalf of our community.<br />
How we measure the service provided<br />
MEASURE<br />
<strong>Council</strong>lors are satisfied or more<br />
than satisfied with the formal<br />
advice they receive from officers<br />
(measured by internal survey)<br />
<strong>Council</strong>lors are satisfied or more<br />
than satisfied with responses to<br />
requests for help from officers<br />
(measured by internal survey)<br />
Community board and community<br />
committee members are satisfied<br />
or more than satisfied with the<br />
formal advice they receive from<br />
officers (measured by internal<br />
survey)<br />
Community board and community<br />
committee members are satisfied<br />
or more than satisfied with<br />
responses to requests for help<br />
from officers (measured by internal<br />
survey)<br />
ACHIEVED<br />
2006/07<br />
ACHIEVED<br />
2007/08<br />
ACHIEVED<br />
2008/09<br />
TARGET<br />
2009/10*<br />
TARGET<br />
2010/11<br />
100% 100% 90% 80% 80%<br />
New<br />
measure for<br />
2008/09<br />
New<br />
measure for<br />
2008/09<br />
72.5% 75% Insufficient<br />
numbers<br />
of survey<br />
forms were<br />
returned to<br />
ensure a<br />
statistically<br />
robust<br />
analysis<br />
New<br />
measure for<br />
2008/09<br />
New<br />
measure for<br />
2008/09<br />
100% 80% 80%<br />
Insufficient<br />
numbers<br />
of survey<br />
forms were<br />
returned to<br />
ensure a<br />
statistically<br />
robust<br />
analysis<br />
80% 80%<br />
80% 80%<br />
Note: Survey percentages quoted exclude those who responded ‘Don’t Know’.<br />
*Results for 2009/2010 will be published in <strong>Council</strong>’s <strong>Annual</strong> Report for the year ending 30 June 2010.<br />
<strong>Hutt</strong> <strong>City</strong> <strong>Council</strong> <strong>Annual</strong> Plan 2010-2011<br />
23
Activity 18: Managing Services<br />
What we do<br />
‘Managing Services’ incorporates the organisational support functions that help us to provide<br />
our other activities efficiently and effectively.<br />
Why we do it<br />
The Managing Services Activity supports all our activities by providing business, legal and<br />
support services and tools.<br />
How we measure the service provided<br />
MEASURE<br />
ACHIEVED<br />
2006/07<br />
ACHIEVED<br />
2007/08<br />
ACHIEVED<br />
2008/09<br />
TARGET<br />
2009/10*<br />
TARGET<br />
2010/11<br />
Staff turnover (measured by<br />
management reports)<br />
12% 13.7% 10% Less than<br />
14%<br />
Less than<br />
12%<br />
Legal and policy requirements<br />
(measured by management reports)<br />
Work-related accidents<br />
(measured by management reports)<br />
No<br />
significant<br />
instances<br />
of noncompliance<br />
Five workrelated<br />
accidents<br />
resulted in<br />
time off work<br />
No<br />
significant<br />
instances<br />
of noncompliance<br />
Four workrelated<br />
accidents<br />
resulted in<br />
time off work<br />
No<br />
significant<br />
instances<br />
of noncompliance<br />
Six workrelated<br />
accidents<br />
resulted in<br />
time off work<br />
No<br />
significant<br />
instances<br />
of noncompliance<br />
Fewer than<br />
six resulting<br />
in time off<br />
work<br />
No<br />
significant<br />
instances<br />
of noncompliance<br />
Fewer than<br />
six resulting<br />
in time off<br />
work<br />
*Results for 2009/2010 will be published in <strong>Council</strong>’s <strong>Annual</strong> Report for the year ending 30 June 2010.<br />
24
Quentin, rugby league player, Wainuiomata<br />
Financing<br />
Our Work
This section of the annual<br />
<strong>plan</strong> shows you how<br />
<strong>Council</strong> <strong>plan</strong>s to manage<br />
ratepayers’ money<br />
according to each <strong>Council</strong><br />
group and the 18 key<br />
activities for which they<br />
are responsible. It covers<br />
the estimated income and<br />
expenditure, the costs<br />
5% Operating subsidies<br />
and sources of funds, and<br />
44% Rates - based on capital value<br />
23% User charges<br />
4% Capital subsidies<br />
our capital and operating<br />
21% Rates - fixed charges<br />
3% Other revenue<br />
projects.<br />
We have two types of spending:<br />
• capital expenditure, which is spending<br />
that will increase the value of the city’s<br />
assets<br />
• operating expenditure, which goes on<br />
significant projects that don’t result<br />
in either the creation of new <strong>Council</strong><br />
assets or an increase in the values of<br />
existing assets.<br />
The projects funded by these two types of<br />
expenditure (capital projects and operating<br />
projects) are listed from page 36.<br />
Where does council spend money?<br />
58% Roading and traffic, water<br />
supply, wastewater,<br />
stormwater and solid waste<br />
30% Libraries, museums, aquatics<br />
and recreation, parks and reserves,<br />
community support and property<br />
Where does council income come from?<br />
9% Environmental management<br />
and emergency management<br />
3% Local urban environment<br />
and economic development<br />
Income: For The Whole Of <strong>Council</strong><br />
Whole Of <strong>Council</strong> - Prospective Income Statement<br />
For the year ending 30 June<br />
REVENUE<br />
Estimate<br />
2010<br />
$000s<br />
Budget<br />
2011<br />
$000s<br />
Forecast<br />
2012<br />
$000s<br />
Forecast<br />
2013<br />
$000s<br />
General rates & other rate charges 80,587 82,712 85,359 88,090<br />
User charges 33,502 28,990 30,268 30,881<br />
Operating contributions 3,569 3,450 3,568 3,643<br />
Capital contributions 4,312 4,425 4,835 13,157<br />
UHCC operating contribution 2,443 2,495 2,559 2,576<br />
Interest earned 270 150 - -<br />
Vested Assets 9,590 600 619 644<br />
Other revenue 3,032 2,972 2,925 3,034<br />
Total revenue 137,305 125,794 130,133 142,025<br />
EXPENDITURE<br />
Employee costs 26,597 27,543 28,146 28,569<br />
Operating costs 70,272 62,458 65,019 66,500<br />
Interest expenditure 5,038 4,500 4,447 3,977<br />
Depreciation 27,118 26,591 26,279 26,528<br />
Total expenditure 129,025 121,092 123,891 125,574<br />
SURPLUS BEFORE REVALUATION GAINS 8,280 4,702 6,242 16,451<br />
Revaluation Gains 800 800 1,000 300<br />
SURPLUS BEFORE TAX 9,080 5,502 7,242 16,751<br />
Taxation - - - -<br />
SURPLUS AFTER TAX 9,080 5,502 7,242 16,751<br />
26<br />
44% Rates - based on capital value<br />
23% User charges<br />
21% Rates - fixed charges<br />
5% Operating subsidies<br />
4% Capital subsidies<br />
3% Other revenue<br />
58% Roading and traffic, water<br />
supply, wastewater,<br />
stormwater and solid waste<br />
30% Libraries, museums, aquatics<br />
and recreation, parks and reserves,<br />
community support and property<br />
9% Environmental management<br />
and emergency management<br />
3% Local urban environment<br />
and economic development
Group People<br />
1. Libraries<br />
Libraries - Prospective Income Statement<br />
For the year ending 30 June<br />
REVENUE<br />
Estimate<br />
2010<br />
$000s<br />
Budget<br />
2011<br />
$000s<br />
Forecast<br />
2012<br />
$000s<br />
Forecast<br />
2013<br />
$000s<br />
User charges 532 641 662 690<br />
Other revenue 35 35 36 38<br />
Total revenue 567 676 698 728<br />
EXPENDITURE<br />
Employee costs 3,800 3,796 3,883 3,971<br />
Support costs/internal charges 2,075 2,044 2,122 2,162<br />
Operating costs 907 929 939 978<br />
Interest expenditure 38 39 38 35<br />
Depreciation 736 613 602 624<br />
Total expenditure 7,556 7,421 7,584 7,770<br />
DEFICIT BEFORE TAX (6,989) (6,745) (6,886) (7,042)<br />
Libraries - Prospective Funding Requirement<br />
RATES FUNDING REQUIREMENT<br />
Surplus/(deficit) (6,989) (6,745) (6,886) (7,042)<br />
Total rates funding requirement (6,989) (6,745) (6,886) (7,042)<br />
LOAN FUNDING REQUIREMENT<br />
Capital expenditure - maintaining services (748) (882) (849) (884)<br />
Capital expenditure - improving services (105) (178) (65) (56)<br />
Less depreciation 736 613 602 624<br />
Total loan (funding)/repayment (117) (447) (312) (316)<br />
2. Museums<br />
Museums - Prospective Income Statement<br />
For the year ending 30 June<br />
REVENUE<br />
Estimate<br />
2010<br />
$000s<br />
Budget<br />
2011<br />
$000s<br />
Forecast<br />
2012<br />
$000s<br />
Forecast<br />
2013<br />
$000s<br />
User charges 219 167 173 180<br />
Other revenue 160 250 258 269<br />
Total revenue 379 417 431 449<br />
EXPENDITURE<br />
Employee costs 1,069 1,164 1,191 1,218<br />
Support costs/internal charges 628 587 610 622<br />
Operating costs 937 914 882 919<br />
Interest expenditure 58 59 58 52<br />
Depreciation 228 229 227 226<br />
Total expenditure 2,920 2,953 2,968 3,037<br />
DEFICIT BEFORE TAX (2,541) (2,536) (2,537) (2,588)<br />
Museums - Prospective Funding Requirement<br />
RATES FUNDING REQUIREMENT<br />
Surplus/(deficit) (2,541) (2,536) (2,537) (2,588)<br />
Total rates funding requirement (2,541) (2,536) (2,537) (2,588)<br />
LOAN FUNDING REQUIREMENT<br />
Capital expenditure - maintaining services (2) (259) (97) (113)<br />
Capital expenditure - improving services (18) (40) (67) (43)<br />
Less depreciation 229 229 227 226<br />
Total loan (funding)/ repayment 209 (70) 63 70<br />
TOTAL FUNDING REQUIREMENT (2,332) (2,606) (2,474) (2,518)<br />
TOTAL FUNDING REQUIREMENT (7,106) (7,192) (7,198) (7,358)<br />
<strong>Hutt</strong> <strong>City</strong> <strong>Council</strong> <strong>Annual</strong> Plan 2010-2011<br />
27
3. Aquatics And Recreation<br />
Aquatics And Recreation - Prospective Income Statement<br />
4. Parks And Reserves<br />
Parks And Reserves - Prospective Income Statement<br />
For the year ending 30 June<br />
Estimate<br />
2010<br />
$000s<br />
Budget<br />
2011<br />
$000s<br />
Forecast<br />
2012<br />
$000s<br />
Forecast<br />
2013<br />
$000s<br />
For the year ending 30 June<br />
Estimate<br />
2010<br />
$000s<br />
Budget<br />
2011<br />
$000s<br />
Forecast<br />
2012<br />
$000s<br />
Forecast<br />
2013<br />
$000s<br />
REVENUE<br />
User charges 2,422 2,482 2,564 2,671<br />
Capital contributions - - - 7,640<br />
Other revenue 724 671 693 722<br />
Total revenue 3,146 3,153 3,257 11,033<br />
EXPENDITURE<br />
Employee costs 3,116 3,079 3,150 3,220<br />
Support costs/internal charges 644 569 592 602<br />
Operating costs 2,823 2,898 2,994 3,118<br />
Interest expenditure 60 60 60 53<br />
Depreciation 776 767 772 932<br />
Total expenditure 7,419 7,373 7,568 7,925<br />
DEFICIT BEFORE TAX (4,273) (4,220) (4,311) (3,108)<br />
Aquatics And Recreation - Prospective Funding Requirement<br />
RATES FUNDING REQUIREMENT<br />
Surplus/(deficit) (4,273) (4,220) (4,311) 3,108<br />
Add capital contributions - - - (7,640)<br />
Total rates funding requirement (4,273) (4,220) (4,311) (4,532)<br />
LOAN FUNDING REQUIREMENT<br />
Capital expenditure - maintaining<br />
services (384) (818) (542) (819)<br />
Capital expenditure - improving services - (450) (1,281) (7,147)<br />
Less capital contributions - - - 7,640<br />
Less depreciation 776 766 772 932<br />
Total loan (funding)/repayment 392 (502) (1,051) 606<br />
REVENUE<br />
User charges 1,221 1,578 1,630 1,698<br />
Vested Assets - 100 103 108<br />
Other revenue 19 9 9 10<br />
Total revenue 1,240 1,687 1,742 1,816<br />
EXPENDITURE<br />
Employee costs 940 916 937 749<br />
Support costs/internal charges 545 550 572 582<br />
Operating costs 8,328 8,216 8,425 8,164<br />
Interest expenditure 469 475 470 420<br />
Depreciation 728 726 731 739<br />
Total expenditure 11,010 10,883 11,135 10,654<br />
DEFICIT BEFORE TAX (9,770) (9,196) (9,393) (8,838)<br />
Parks And Reserves - Prospective Funding Requirement<br />
RATES FUNDING REQUIREMENT<br />
Surplus/(deficit) (9,770) (9,196) (9,393) (8,838)<br />
Total rates funding requirement (9,770) (9,196) (9,393) (8,838)<br />
LOAN FUNDING REQUIREMENT<br />
Capital expenditure - maintaining<br />
services (773) (951) (1,696) (626)<br />
Capital expenditure - improving services (1,049) (555) (1,654) (408)<br />
Less depreciation 727 726 731 739<br />
Total loan (funding)/repayment (1,095) (780) (2,619) (295)<br />
TOTAL FUNDING REQUIREMENT (10,865) (9,976) (12,012) (9,133)<br />
TOTAL FUNDING REQUIREMENT (3,881) (4,722) (5,362) (3,926)<br />
28
5. Community Support<br />
Community Support - Prospective Income Statement<br />
6. Property<br />
Property - Prospective Income Statement<br />
For the year ending 30 June<br />
Estimate<br />
2010<br />
$000s<br />
Budget<br />
2011<br />
$000s<br />
Forecast<br />
2012<br />
$000s<br />
Forecast<br />
2013<br />
$000s<br />
For the year ending 30 June<br />
Estimate<br />
2010<br />
$000s<br />
Budget<br />
2011<br />
$000s<br />
Forecast<br />
2012<br />
$000s<br />
Forecast<br />
2013<br />
$000s<br />
REVENUE<br />
User charges 20 18 19 19<br />
Other revenue 603 243 251 261<br />
Total revenue 623 261 270 280<br />
EXPENDITURE<br />
Employee costs 809 737 754 771<br />
Support costs/internal charges 586 481 500 509<br />
Operating costs 1,462 1,412 1,458 1,519<br />
Total expenditure 2,857 2,630 2,712 2,799<br />
DEFICIT BEFORE TAX (2,234) (2,369) (2,442) (2,519)<br />
Community Support - Prospective Funding Requirement<br />
RATES FUNDING REQUIREMENT<br />
Surplus/(deficit) (2,234) (2,369) (2,442) (2,519)<br />
Total rates funding requirement (2,234) (2,369) (2,442) (2,519)<br />
LOAN REFUNDING REQUIREMENT<br />
Capital Expenditure - improving services (260) - - -<br />
Total loan (funding)/repayment (260) - - -<br />
TOTAL FUNDING REQUIREMENT (2,494) (2,369) (2,442) (2,519)<br />
REVENUE<br />
User charges 959 1,009 1,043 1,086<br />
Capital contributions 225 - - -<br />
Total revenue 1,184 1,009 1,043 1,086<br />
EXPENDITURE<br />
Employee costs - 6 6 6<br />
Support costs/internal charges (1,303) (1,262) (1,312) (1,335)<br />
Operating costs 2,676 2,743 2,834 2,952<br />
Interest expenditure 283 285 282 252<br />
Depreciation 1,765 1,766 1,686 1,657<br />
Total expenditure 3,421 3,538 3,496 3,532<br />
DEFICIT BEFORE TAX (2,237) (2,529) (2,453) (2,446)<br />
Property - Prospective Funding Requirement<br />
RATES FUNDING REQUIREMENT<br />
Surplus/(deficit) (2,237) (2,529) (2,453) (2,446)<br />
Add capital contributions (225) - - -<br />
Total rates funding requirement (2,462) (2,529) (2,453) (2,446)<br />
LOAN FUNDING REQUIREMENT<br />
Capital expenditure - maintaining services (417) (455) (410) (492)<br />
Capital expenditure - improving services (1,897) (1,214) (993) (712)<br />
Less capital contributions 225 - - -<br />
Less depreciation 1,765 1,766 1,686 1,657<br />
Less asset sales 1,345 7,816 2,433 1,000<br />
Total loan (funding)/repayment 1,021 7,913 2,716 1,453<br />
TOTAL FUNDING REQUIREMENT (1,441) 5,384 263 (993)<br />
<strong>Hutt</strong> <strong>City</strong> <strong>Council</strong> <strong>Annual</strong> Plan 2010-2011<br />
29
Group Utility Services<br />
7. Roading And Traffic<br />
Roading And Traffic - Prospective Income Statement<br />
For the year ending 30 June<br />
REVENUE<br />
Estimate<br />
2010<br />
$000s<br />
Budget<br />
2011<br />
$000s<br />
Forecast<br />
2012<br />
$000s<br />
Forecast<br />
2013<br />
$000s<br />
User charges 3,074 3,430 3,547 3,619<br />
Operating contributions 3,377 3,288 3,400 3,469<br />
Capital contributions 3,879 4,168 4,571 5,247<br />
Vested Assets 9,450 200 207 215<br />
Other revenue 478 542 560 572<br />
Total revenue 20,258 11,628 12,285 13,122<br />
EXPENDITURE<br />
Employee costs 1,089 1,138 1,165 1,191<br />
Support costs/internal charges 2,214 2,128 2,211 2,251<br />
Operating costs 10,105 9,936 10,274 10,482<br />
Interest expenditure 1,490 1,509 1,491 1,334<br />
Depreciation 9,227 9,057 8,981 8,999<br />
Total expenditure 24,125 23,768 24,122 24,257<br />
DEFICIT BEFORE TAX (3,867) (12,140) (11,837) (11,135)<br />
Roading And Traffic - Prospective Funding Requirement<br />
RATES FUNDING REQUIREMENT<br />
Surplus/(deficit) (3,867) (12,140) (11,837) (11,135)<br />
Add capital contributions (3,879) (4,168) (4,571) (5,247)<br />
Total rates funding requirement (7,746) (16,308) (16,408) (16,382)<br />
LOAN FUNDING REQUIREMENT<br />
Capital expenditure - maintaining services (7,100) (6,885) (7,538) (8,035)<br />
Capital expenditure - improving services (1,469) (1,853) (1,927) (2,462)<br />
Less capital contributions 3,879 4,168 4,571 5,247<br />
Less depreciation 9,227 9,056 8,981 8,999<br />
Total loan (funding)/repayment 4,537 4,486 4,087 3,749<br />
8. Water Supply<br />
Water Supply - Prospective Income Statement<br />
For the year ending 30 June<br />
REVENUE<br />
Estimate<br />
2010<br />
$000s<br />
Budget<br />
2011<br />
$000s<br />
Forecast<br />
2012<br />
$000s<br />
Forecast<br />
2013<br />
$000s<br />
User charges 2,060 2,110 2,163 2,217<br />
Capital contributions 15 15 15 16<br />
Vested Assets 60 100 103 108<br />
Total revenue 2,135 2,225 2,281 2,341<br />
EXPENDITURE<br />
Support costs/internal charges 306 320 332 338<br />
Operating costs 9,157 9,458 9,950 10,471<br />
Interest expenditure 515 521 515 461<br />
Depreciation 2,986 2,988 2,941 2,932<br />
Total expenditure 12,964 13,287 13,738 14,202<br />
DEFICIT BEFORE TAX (10,829) (11,062) (11,457) (11,861)<br />
Water Supply - Prospective Funding Requirement<br />
RATES FUNDING REQUIREMENT<br />
Surplus/(deficit) (10,829) (11,062) (11,457) (11,861)<br />
Add capital contributions (15) (15) (15) (16)<br />
Total rates funding requirement (10,844) (11,077) (11,472) (11,877)<br />
LOAN FUNDING REQUIREMENT<br />
Capital expenditure - maintaining services (1,315) (1,396) (2,107) (2,053)<br />
Capital expenditure - improving services - (200) (666) (452)<br />
Less capital contributions 15 15 15 16<br />
Less depreciation 2,987 2,989 2,941 2,932<br />
Total loan (funding)/repayment 1,687 1,408 183 443<br />
TOTAL FUNDING REQUIREMENT (9,157) (9,669) (11,289) (11,434)<br />
30<br />
TOTAL FUNDING REQUIREMENT (3,209) (11,822) (12,321) (12,633)
9. Wastewater<br />
Wastewater - Prospective Income Statement<br />
10. Stormwater<br />
Stormwater - Prospective Income Statement<br />
For the year ending 30 June<br />
Estimate<br />
2010<br />
$000s<br />
Budget<br />
2011<br />
$000s<br />
Forecast<br />
2012<br />
$000s<br />
Forecast<br />
2013<br />
$000s<br />
For the year ending 30 June<br />
Estimate<br />
2010<br />
$000s<br />
Budget<br />
2011<br />
$000s<br />
Forecast<br />
2012<br />
$000s<br />
Forecast<br />
2013<br />
$000s<br />
REVENUE<br />
User charges 828 800 820 841<br />
Capital contributions 140 160 164 168<br />
UHCC operating contribution 2,135 2,197 2,252 2,256<br />
Vested Assets 40 100 103 108<br />
Total revenue 3,143 3,257 3,339 3,373<br />
EXPENDITURE<br />
Support costs/internal charges 520 562 584 594<br />
Operating costs 9,889 10,212 10,467 10,571<br />
Interest expenditure 962 975 963 861<br />
Depreciation 6,436 6,375 6,263 6,226<br />
Total expenditure 17,807 18,124 18,277 18,252<br />
DEFICIT BEFORE TAX (14,664) (14,867) (14,938) (14,879)<br />
Wastewater - Prospective Funding Requirement<br />
RATES FUNDING REQUIREMENT<br />
Surplus/(deficit) (14,664) (14,867) (14,938) (14,879)<br />
Add capital contributions (140) (160) (164) (168)<br />
Total rates funding requirement (14,804) (15,027) (15,102) (15,047)<br />
LOAN FUNDING REQUIREMENT<br />
Capital expenditure - maintaining<br />
services (3,113) (2,969) (4,748) (4,187)<br />
Capital expenditure - improving services (1,905) (566) (615) (473)<br />
Less capital contributions 140 160 164 168<br />
Less UHCC capital contribution 578 511 611 622<br />
Less depreciation 6,436 6,376 6,263 6,226<br />
Total loan (funding)/repayment 2,136 3,512 1,675 2,356<br />
TOTAL FUNDING REQUIREMENT (12,668) (11,515) (13,427) (12,691)<br />
REVENUE<br />
User charges 2 2 2 2<br />
Operating contributions 7 7 7 7<br />
Capital contributions 46 66 68 69<br />
Vested Assets 40 100 103 105<br />
Total revenue 95 175 180 183<br />
EXPENDITURE<br />
Support costs/internal charges 296 313 325 331<br />
Operating costs 10,460 2,007 2,673 2,739<br />
Interest expenditure 576 584 577 516<br />
Depreciation 2,587 2,588 2,580 2,589<br />
Total expenditure 13,919 5,492 6,155 6,175<br />
DEFICIT BEFORE TAX (13,824) (5,317) (5,975) (5,992)<br />
Stormwater - Prospective Funding Requirement<br />
RATES FUNDING REQUIREMENT<br />
Surplus/(deficit) (13,824) (5,317) (5,975) (5,992)<br />
Add capital contributions (46) (66) (68) (69)<br />
Total rates funding requirement (13,870) (5,383) (6,043) (6,061)<br />
LOAN FUNDING REQUIREMENT<br />
Capital expenditure - maintaining<br />
services (566) (575) (598) (638)<br />
Capital expenditure - improving services (736) (1,340) (3,485) (1,628)<br />
Less capital contributions 46 66 68 69<br />
Less depreciation 2,587 2,588 2,580 2,589<br />
Total loan (funding)/repayment 1,331 739 (1,435) 392<br />
TOTAL FUNDING REQUIREMENT (12,539) (4,644) (7,478) (5,669)<br />
<strong>Hutt</strong> <strong>City</strong> <strong>Council</strong> <strong>Annual</strong> Plan 2010-2011<br />
31
11. Solid Waste<br />
Solid Waste - Prospective Income Statement<br />
For the year ending 30 June<br />
REVENUE<br />
Estimate<br />
2010<br />
$000s<br />
Budget<br />
2011<br />
$000s<br />
Forecast<br />
2012<br />
$000s<br />
Forecast<br />
2013<br />
$000s<br />
User charges 18,101 11,985 12,513 12,513<br />
Total revenue 18,101 11,985 12,513 12,513<br />
EXPENDITURE<br />
Support costs/internal charges 125 157 163 166<br />
Operating costs 6,761 6,322 6,531 6,803<br />
Depreciation 218 217 237 276<br />
Total expenditure 7,104 6,696 6,931 7,245<br />
SURPLUS BEFORE TAX 10,997 5,289 5,582 5,268<br />
Solid Waste - Prospective Funding Requirement<br />
RATES FUNDING REQUIREMENT<br />
Surplus/(deficit) 10,997 5,289 5,582 5,268<br />
Total rates funding requirement 10,997 5,289 5,582 5,268<br />
LOAN FUNDING REQUIREMENT<br />
Capital expenditure - improving services (620) (1,275) (2,376) (2,190)<br />
Less depreciation 218 218 237 276<br />
Total loan (funding)/repayment (402) (1,057) (2,139) (1,914)<br />
TOTAL FUNDING REQUIREMENT 10,595 4,232 3,443 3,354<br />
Group Environment<br />
12. Environmental Management<br />
Environmental Management - Prospective Income Statement<br />
For the year ending 30 June<br />
REVENUE<br />
Estimate<br />
2010<br />
$000s<br />
Budget<br />
2011<br />
$000s<br />
Forecast<br />
2012<br />
$000s<br />
Forecast<br />
2013<br />
$000s<br />
User charges 3,202 3,880 4,215 4,390<br />
Other revenue 178 184 190 197<br />
Total revenue 3,380 4,064 4,405 4,587<br />
EXPENDITURE<br />
Employee costs 4,923 5,176 5,295 5,415<br />
Support costs/internal charges 1,724 1,670 1,736 1,767<br />
Operating costs 1,727 2,018 2,188 2,279<br />
Depreciation 1 - - -<br />
Total expenditure 8,375 8,864 9,219 9,461<br />
DEFICIT BEFORE TAX (4,995) (4,800) (4,814) (4,874)<br />
Environmental Management - Prospective Funding Requirement<br />
RATES FUNDING REQUIREMENT<br />
Surplus/(deficit) (4,995) (4,800) (4,814) (4,874)<br />
Total rates funding requirement (4,995) (4,800) (4,814) (4,874)<br />
LOAN FUNDING REQUIREMENT<br />
Less depreciation 1 - - -<br />
Total loan (funding)/repayment 1 - - -<br />
TOTAL FUNDING REQUIREMENT (4.994) (4,800) (4,814) (4,874)<br />
32
13. Emergency Management<br />
Emergency Management - Prospective Income Statement<br />
For the year ending 30 June<br />
REVENUE<br />
Estimate<br />
2010<br />
$000s<br />
Budget<br />
2011<br />
$000s<br />
Forecast<br />
2012<br />
$000s<br />
Forecast<br />
2013<br />
$000s<br />
Operating contributions 40 52 54 56<br />
UHCC operating contribution 308 298 307 320<br />
Total revenue 348 350 361 376<br />
EXPENDITURE<br />
Employee costs 422 417 427 436<br />
Support costs/internal charges 226 226 235 239<br />
Operating costs 352 377 389 405<br />
Depreciation 24 24 25 29<br />
Total expenditure 1,024 1,044 1,076 1,109<br />
DEFICIT BEFORE TAX (676) (694) (715) (733)<br />
Emergency Management - Prospective Funding Requirement<br />
RATES FUNDING REQUIREMENT<br />
Surplus/(deficit) (676) (694) (715) (733)<br />
Total rates funding requirement (676) (694) (715) (733)<br />
LOAN FUNDING REQUIREMENT<br />
Capital expenditure - maintaining<br />
services - - (93) (97)<br />
Capital expenditure - improving services - (250) - -<br />
Less depreciation 24 24 25 29<br />
Total loan (funding)/repayment 24 (226) (68) (68)<br />
TOTAL FUNDING REQUIREMENT (652) (920) (783) (801)<br />
Group Economy<br />
14. Local Urban Environment<br />
Local Urban Environment - Prospective Income Statement<br />
For the year ending 30 June<br />
Estimate<br />
2010<br />
$000s<br />
Budget<br />
2011<br />
$000s<br />
Forecast<br />
2012<br />
$000s<br />
Forecast<br />
2013<br />
$000s<br />
REVENUE<br />
Capital contributions 7 16 17 17<br />
Other revenue 300 360 372 387<br />
Total revenue 307 376 389 404<br />
EXPENDITURE<br />
Employee costs 450 465 476 486<br />
Support costs/internal charges 178 285 296 302<br />
Operating costs 568 706 780 759<br />
Interest expenditure 4 5 5 4<br />
Depreciation 105 104 117 129<br />
Total expenditure 1,305 1,565 1,674 1,680<br />
DEFICIT BEFORE TAX (998) (1,189) (1,285) (1,276)<br />
Local Urban Environment - Prospective Funding Requirement<br />
RATES FUNDING REQUIREMENT<br />
Surplus/(deficit) (998) (1,189) (1,285) (1,276)<br />
Add capital contributions (7) (16) (17) (17)<br />
Total rates funding requirement (1,005) (1,205) (1,302) (1,293)<br />
LOAN FUNDING REQUIREMENT<br />
Capital expenditure - maintaining<br />
services (31) (32) (33) (34)<br />
Capital expenditure - improving services (683) (1,739) (1,725) -<br />
Less capital contributions 7 16 17 17<br />
Less depreciation 104 104 117 129<br />
Total loan (funding)/repayment (603) (1,651) (1,624) 112<br />
TOTAL FUNDING REQUIREMENT (1,608) (2,856) (2,926) (1,181)<br />
<strong>Hutt</strong> <strong>City</strong> <strong>Council</strong> <strong>Annual</strong> Plan 2010-2011<br />
33
15. Economic Development<br />
Economic Development - Prospective Income Statement<br />
For the year ending 30 June<br />
REVENUE<br />
Estimate<br />
2010<br />
$000s<br />
Budget<br />
2011<br />
$000s<br />
Forecast<br />
2012<br />
$000s<br />
Forecast<br />
2013<br />
$000s<br />
Operating contributions 139 97 101 105<br />
Other revenue 406 414 428 445<br />
Total revenue 545 511 529 550<br />
EXPENDITURE<br />
Employee costs 572 548 560 573<br />
Support costs/internal charges 408 394 409 417<br />
Operating costs 1,217 1,218 1,258 1,224<br />
Interest expenditure 13 13 13 11<br />
Depreciation 10 9 9 9<br />
Total expenditure 2,220 2,182 2,249 2,234<br />
DEFICIT BEFORE TAX (1,675) (1,671) (1,720) (1,684)<br />
Economic Development - Prospective Funding Requirement<br />
RATES FUNDING REQUIREMENT<br />
Surplus/(deficit) (1,675) (1,671) (1,720) (1,684)<br />
Total rates funding requirement (1,675) (1,671) (1,720) (1,684)<br />
LOAN FUNDING REQUIREMENT<br />
Less depreciation 10 10 9 9<br />
Total loan (funding)/repayment 10 10 9 9<br />
Group Organisation<br />
16. Elected Members<br />
Elected Members - Prospective Income Statement<br />
For the year ending 30 June<br />
REVENUE<br />
Estimate<br />
2010<br />
$000s<br />
Budget<br />
2011<br />
$000s<br />
Forecast<br />
2012<br />
$000s<br />
Forecast<br />
2013<br />
$000s<br />
User charges 4 4 4 4<br />
Total revenue 4 4 4 4<br />
EXPENDITURE<br />
Employee costs 954 1,015 1,038 1,061<br />
Support costs/internal charges 704 727 755 769<br />
Operating costs 157 166 171 313<br />
Total expenditure 1,815 1,908 1,964 2,143<br />
DEFICIT BEFORE TAX (1,811) (1,904) (1,960) (2,139)<br />
Elected Members - Prospective Funding Requirement<br />
RATES FUNDING REQUIREMENT<br />
Surplus/(deficit) (1,811) (1,904) (1,960) (2,139)<br />
Total rates funding requirement (1,811) (1,904) (1,960) (2,139)<br />
TOTAL FUNDING REQUIREMENT (1,811) (1,904) (1,960) (2,139)<br />
TOTAL FUNDING REQUIREMENT (1,665) (1,661) (1,711) (1,675)<br />
34
17. Advice And Support<br />
Advice And Support - Prospective Income Statement<br />
18. Managing Services<br />
Managing Services - Prospective Income Statement<br />
For the year ending 30 June<br />
Estimate<br />
2010<br />
$000s<br />
Budget<br />
2011<br />
$000s<br />
Forecast<br />
2012<br />
$000s<br />
Forecast<br />
2013<br />
$000s<br />
For the year ending 30 June<br />
Estimate<br />
2010<br />
$000s<br />
Budget<br />
2011<br />
$000s<br />
Forecast<br />
2012<br />
$000s<br />
Forecast<br />
2013<br />
$000s<br />
REVENUE<br />
Operating contributions 6 6 6 6<br />
Other revenue 140 - -<br />
Total revenue 6 146 6 6<br />
EXPENDITURE<br />
Employee costs - 30 - -<br />
Support costs/internal charges 3,868 4,128 4,289 4,367<br />
Operating costs 35 302 33 34<br />
Total expenditure 3,903 4,460 4,322 4,401<br />
DEFICIT BEFORE TAX (3,897) (4,314) (4,316) (4,395)<br />
Advice And Support - Prospective Funding Requirement<br />
RATES FUNDING REQUIREMENT<br />
Surplus/(deficit) (3,897) (4,314) (4,316) (4,395)<br />
Total rates funding requirement (3,897) (4,314) (4,316) (4,395)<br />
TOTAL FUNDING REQUIREMENT (3,897) (4,314) (4,316) (4,395)<br />
REVENUE<br />
General rates & other rate charges 80,587 82,712 85,359 88,090<br />
User charges 858 884 913 951<br />
Interest earned 270 150 - -<br />
Other revenue 129 124 128 133<br />
Total revenue 81,844 83,870 86,400 89,174<br />
EXPENDITURE<br />
Employee costs 8,453 9,056 9,264 9,472<br />
Support costs/internal charges (13,744) (13,878) (14,420) (14,680)<br />
Operating costs 2,711 2,624 2,773 2,770<br />
Interest expenditure 570 (25) (25) (22)<br />
Depreciation 1,291 1,128 1,108 1,161<br />
Total expenditure (719) (1,095) (1,300) (1,299)<br />
SURPLUS BEFORE TAX (INCL RATES) 82,563 84,965 87,700 90,473<br />
Managing Services - Prospective Funding Requirement<br />
RATES FUNDING REQUIREMENT<br />
Surplus/(deficit) 82,563 84,965 87,700 90,473<br />
Rate funded debt repayment (3,967) (247) (178) (1,372)<br />
Total rates funding requirement 78,596 84,718 87,522 89,101<br />
LOAN FUNDING REQUIREMENT<br />
Capital expenditure - maintaining services (1,158) (1,235) (1,338) (1,567)<br />
Capital expenditure - improving services (1,325) (1,513) (414) (220)<br />
Less depreciation 1,290 1,128 1,108 1,161<br />
Less rate funded debt repayment 3,967 247 178 1,372<br />
Total loan (funding)/repayment 2,774 (1,373) (466) 746<br />
TOTAL FUNDING REQUIREMENT 81,370 83,345 87,056 89,847<br />
<strong>Hutt</strong> <strong>City</strong> <strong>Council</strong> <strong>Annual</strong> Plan 2010-2011<br />
35
Capital and Operating Project Lists<br />
Budget<br />
<strong>Annual</strong><br />
Plan<br />
2010/2011<br />
$000s<br />
Forecast<br />
2011/2012<br />
$000s<br />
Forecast<br />
2012/2013<br />
$000s<br />
Forecast<br />
2013/2014<br />
$000s<br />
Forecast<br />
2014/2015<br />
$000s<br />
Forecast<br />
2015/2016<br />
$000s<br />
Forecast<br />
2016/2017<br />
$000s<br />
Forecast<br />
2017/2018<br />
$000s<br />
Forecast<br />
2018/2019<br />
$000s<br />
Group People<br />
1. Libraries<br />
Capital Projects<br />
Maintenance<br />
Eastbourne Library Refurbishment 60<br />
Library Stock Replacement 760 785 818 845 872 898 921 944 965<br />
Replace Furniture And Equipment Programme All Libraries 42 43 45 46 48 49 50 52 53<br />
Replace Library Shelving 20 21 22 22 23 24 24 25 25<br />
New/Improvements<br />
Digitisation 11 11<br />
Eastbourne Library Refurbishment (Counter/Increasing Customer Space) 10<br />
Merge Bibliographic Data Managed Services 55<br />
Security Systems For Community Libraries 52 54 56<br />
Upgrade Buildings Security Systems 50<br />
2. Museums<br />
Capital Projects<br />
Maintenance<br />
Dowse Building And Plant Maintenance 20 52 97 23 63 59 61 62 64<br />
Dowse Carpets And Soft Furnishings Gallery And Office 26 17 18 18 19 19<br />
Dowse Chiller Replacement 180<br />
Dowse Gallery Lighting 10 11 11 12 13<br />
Dowse Office Furniture And Equipment 3 3 2 6<br />
Petone Settlers Museum Building And Plant Maintenance 31 45 5 6 103 6 6 99 6<br />
Petone Settlers Museum Exhibition Furniture And Fittings 15 17 19<br />
New/Improvements<br />
Dowse Collection Development 40 41 43 44 46 47 48 50 51<br />
Petone Settlers Museum New Gallery Lighting 26 30<br />
36
Budget<br />
<strong>Annual</strong><br />
Plan<br />
2010/2011<br />
$000s<br />
Forecast<br />
2011/2012<br />
$000s<br />
Forecast<br />
2012/2013<br />
$000s<br />
Forecast<br />
2013/2014<br />
$000s<br />
Forecast<br />
2014/2015<br />
$000s<br />
Forecast<br />
2015/2016<br />
$000s<br />
Forecast<br />
2016/2017<br />
$000s<br />
Forecast<br />
2017/2018<br />
$000s<br />
Forecast<br />
2018/2019<br />
$000s<br />
3. Aquatics AND Recreation<br />
Capital Projects<br />
Maintenance<br />
Huia Pool Replace Boiler 50<br />
Naenae Pool Replace Filters 346<br />
Other Projects 407 333 405 424 443 462 551 571 597<br />
Stokes Valley Pool Energy Efficiency Project 220<br />
Stokes Valley Pool Replace Heat Coil, Ducting And Supply Fan 47<br />
Wainuiomata Pool Replace Filters 269<br />
Walter Nash Stadium Maintenance 34 210 145 95 109 137 67 175 66<br />
Walter Nash Stadium Resurface Floor And Seating 60<br />
New/Improvements<br />
Huia Pool Learn-To-Swim Learners Pool 1,076<br />
Huia Pool Replace Movable Floor 621<br />
McKenzie Pool Redevelopment 250 981<br />
Naenae Pool Refurbish Reception And Entrance 207<br />
Other Pools Projects 93 99 105 111 117 154 165 177<br />
Walter Nash Stadium Upgrade (Subsidy 63%) 200 5,972 6,172<br />
Operating Projects<br />
Events Funding 299<br />
<strong>Hutt</strong> <strong>City</strong> <strong>Council</strong> <strong>Annual</strong> Plan 2010-2011<br />
37
Budget<br />
<strong>Annual</strong><br />
Plan<br />
2010/2011<br />
$000s<br />
Forecast<br />
2011/2012<br />
$000s<br />
Forecast<br />
2012/2013<br />
$000s<br />
Forecast<br />
2013/2014<br />
$000s<br />
Forecast<br />
2014/2015<br />
$000s<br />
Forecast<br />
2015/2016<br />
$000s<br />
Forecast<br />
2016/2017<br />
$000s<br />
Forecast<br />
2017/2018<br />
$000s<br />
Forecast<br />
2018/2019<br />
$000s<br />
4. Parks AND Reserves<br />
38<br />
Capital Projects<br />
Maintenance<br />
Building Maintenance (Sportsgrounds) 150 154 157 161 164 168 172 176 180<br />
Korokoro Gateway Landscape Renovation 107<br />
Parks Hard Surfaces Maintenance 50 154 157 161 164 168 172 176 180<br />
Playgrounds 110 123 126 129 131 134 149 152 156<br />
Seats And Bins 26 28 28 30 31 32 33 34 35<br />
Signage And Interpretation 22 22 24 25 27 28 31 32 36<br />
Street Tree Infrastructural Repairs 35 189 37 37 38 39 40 41 42<br />
Street Tree Maintenance (Urban Forest Plan) 63 65 66 67 69 71 72 74 75<br />
Taita Courts 85<br />
Track Maintenance 30 31 31 32 33 34 34 35 36<br />
Wharves Maintenance 380 932 616<br />
New/Improvements<br />
Avalon Park Development [Funded from Reserve Fund] 224<br />
Bollards To Prevent Vehicle Access To Reserves 5 5 5 5 5 6 6 6 6<br />
Days Bay Wharf Entrance Development [Funded from Reserve Fund] 108<br />
Holborn Drive Reserve Drainage [Funded from Reserve Fund] 168<br />
<strong>Hutt</strong> Park Development [Funded from Reserve Fund] 290<br />
Kelson Reserve Development [Funded from Reserve Fund] 205<br />
Memorial Park Synthetic Turf [Funded from Reserve Fund] 512<br />
Mountain Bike Park [Funded from Reserve Fund] 30 31 31 32 33 34 34 35 36<br />
New Cemetery Development, Akatarawa Road 92<br />
New Tracks/Track Upgrades [Funded from Reserve Fund] 102 105 107 110<br />
Otonga School Site Development [Funded from Reserve Fund] 205<br />
Percy Scenic Reserve Development [Funded from Reserve Fund] 107<br />
Petone Foreshore Improvements [Funded from Reserve Fund] 336 344<br />
Petone Recreation Ground House Improvements 150<br />
Poto Road Reserve Development [Funded from Reserve Fund] 205<br />
Sportsgrounds Artificial Training Areas [Funded from Reserve Fund] 448<br />
Street Tree Replacements 30 31 31 32 33 34 34 35 36<br />
Te Whiti Park New Changing Rooms [Funded from Reserve Fund] 57 1,170<br />
Trafalgar Park New Toilets/Fence [Funded from Reserve Fund] 72 168<br />
Tutukiwi House Exterior Landscaping 50<br />
Wainuiomata Garden Of Remembrance Development 246
Operating Projects<br />
Budget<br />
<strong>Annual</strong><br />
Plan<br />
2010/2011<br />
$000s<br />
Forecast<br />
2011/2012<br />
$000s<br />
Forecast<br />
2012/2013<br />
$000s<br />
Walter Mildenhall Park Upgrade [Funded from Reserve Fund] 102 105<br />
Forecast<br />
2013/2014<br />
$000s<br />
Forecast<br />
2014/2015<br />
$000s<br />
Forecast<br />
2015/2016<br />
$000s<br />
Forecast<br />
2016/2017<br />
$000s<br />
Walter Nash Reserve Upgrade [Funded from Reserve Fund] 22 344<br />
Whiorau Reserve Development [Funded from Reserve Fund] 77 131<br />
Canopy Weed Control 38<br />
<strong>Hutt</strong> River Trail 13<br />
North Island Brown Kiwi 5<br />
Problem Tree Removal 135<br />
Forecast<br />
2017/2018<br />
$000s<br />
Forecast<br />
2018/2019<br />
$000s<br />
5. Community Support<br />
Operating Projects<br />
Arts And Culture Funding 89<br />
CAB Funding 64<br />
Community Grants Contestable Fund 176<br />
Community Houses Funding 255<br />
Heritage Project Fund 25<br />
Marae Funding 155<br />
Safety Initiatives 197<br />
Scholarships 10<br />
Social Development Projects 50<br />
Youth Centre 158<br />
Youth Infusion 10<br />
<strong>Hutt</strong> <strong>City</strong> <strong>Council</strong> <strong>Annual</strong> Plan 2010-2011<br />
39
Budget<br />
<strong>Annual</strong><br />
Plan<br />
2010/2011<br />
$000s<br />
Forecast<br />
2011/2012<br />
$000s<br />
Forecast<br />
2012/2013<br />
$000s<br />
Forecast<br />
2013/2014<br />
$000s<br />
Forecast<br />
2014/2015<br />
$000s<br />
Forecast<br />
2015/2016<br />
$000s<br />
Forecast<br />
2016/2017<br />
$000s<br />
Forecast<br />
2017/2018<br />
$000s<br />
Forecast<br />
2018/2019<br />
$000s<br />
6. Property<br />
Capital Projects<br />
Maintenance<br />
Administration Building Maintenance 30 102 105<br />
Avalon Park Pavilion Maintenance 50 88 92 96<br />
CBD Community Resource Centre 49 103 60<br />
Community Halls Maintenance 135 205 262 209 66 168 211 240<br />
Community Houses Maintenance 15 32 56 70 180<br />
Horticultural Hall Maintenance 105 26 150 110 22 115 59<br />
Korohiwa Bus Barn Maintenance 164<br />
Libraries Building Maintenance 40 41 32 157 82 180<br />
Little Theatre Maintenance 30 10 157 59<br />
Minoh Friendship House Maintenance 10 54 90 92<br />
Miscellaneous Rentals Maintenance 20 61 26 66 46 144<br />
Single Houses (Reserves) Maintenance 20 63 112 70 108<br />
New/Improvements<br />
Administration Building Strengthening 11,450 11,700<br />
CBD Community Resource Centre – Exterior Courtyard Upgrade 24<br />
Community Halls Exterior and Interior Maintenance 40<br />
Community Halls Improvements 280 307 42 107 110 34 92 117 120<br />
Community Resource Centre 20 54 94<br />
Halls Upgrade Men’s Shed 10<br />
Horticultural Hall Improvements 102 66 67<br />
Korohiwa Bus Barn Development 300<br />
Library Buildings Improvements 40 63 86 44 57 59 84<br />
Little Theatre Improvements 120 31 72<br />
Little Theatre Sound And Lighting Improvements 31<br />
Minoh Friendship House Improvements 123<br />
The Pavilion Improvements 168<br />
Toilets Upgrade 350 410 419 112<br />
Toilets Upgrade - New Public Toilet For Naenae CBD 50<br />
Town Hall Improvements 123 157 94<br />
40
Budget<br />
<strong>Annual</strong><br />
Plan<br />
2010/2011<br />
$000s<br />
Forecast<br />
2011/2012<br />
$000s<br />
Forecast<br />
2012/2013<br />
$000s<br />
Forecast<br />
2013/2014<br />
$000s<br />
Forecast<br />
2014/2015<br />
$000s<br />
Forecast<br />
2015/2016<br />
$000s<br />
Forecast<br />
2016/2017<br />
$000s<br />
Forecast<br />
2017/2018<br />
$000s<br />
Forecast<br />
2018/2019<br />
$000s<br />
Group Utility Services<br />
7. Roading AND Traffic<br />
Capital Projects<br />
Maintenance<br />
Carpark Resurfacing 51 53 54 55 57 58 60 62 64<br />
Footpath Resurfacing And Replacement 205 212 216 222 228 234 240 248 256<br />
Minor Road And Footpath Construction 72 74 76 78 80 82 84 87 90<br />
Minor Safety Works (Subsidy 58%) 51 53 54 55 57 58 60 62 64<br />
Pavement Surfacing (Subsidy 48%) 3,420 3,536 3,555 3,646 3,741 3,842 3,953 4,078 4,213<br />
Pavements - Area Wide Pavement Treatment (Subsidy 48%) 1,981 2,048 2,374 2,435 2,498 2,565 2,639 2,723 2,813<br />
Pavements - Road Smoothing (Subsidy 58%) 263 272 839 860 882 906 933 962 994<br />
Pavements - Wainuiomata Hill Road Safety Seal (Subsidy 48%) 570 589 580 595 611 627 645 666 688<br />
Pay And Display Extension 333 342 352<br />
Pedestrian Crossing Renewal (Subsidy 58%) 31 32 33 34 34 35 36 38 39<br />
Road Reconstruction (Heretaunga Street) (Subsidy 18%) 420<br />
Road Reconstruction (Outyears) (Subsidy 18%) 459 452 464 477 492<br />
Street Name Sign Replacement (Subsidy 48%) 20 21 21 22 22 23 23 24 25<br />
Streetlight Lantern Replacement Programme (Subsidy 48%) 51 53 54 55 57 58 60 62 64<br />
Streetlight Standard Replacement (Subsidy 48%) 20 21 21 22 22 23 23 24 25<br />
Traffic Signal Replacement (Subsidy 48%) 150 155 158 179 189 194 199 206 213<br />
New/Improvements<br />
Bridge Seismic Strengthening (<strong>Hutt</strong> Road Overbridge)<br />
(Subsidy 58%) 587<br />
Bridge Seismic Strengthening (Wingate/Wainui Road/Seaview Road) (Subsidy 58%) 393<br />
Broadband Ducting 21 22 22 23 23 24 25 25 26<br />
CBD Metered Parking 54 65<br />
Connolly Street Stopbank Project (Subsidy 100%) 250 465 317<br />
Cycleway Network Development (Subsidy 58%) 351 363 370 380 390 400 412 425 439<br />
Eastern Bays Cycleway/walkway (Subsidy 58%) 250 465 106 108 111 114 117 121 125<br />
Land Purchase For Roads 10 10 11 11 11 11 12 12 13<br />
Local Area Traffic Management (Subsidy 58%) 51 53 54 55 57 58 60 62 64<br />
New Pedestrian Crossings (Subsidy 58%) 51 53 54 55 57 58 60 62 64<br />
Reconstruction Improvements 83 87 89 91 94 97<br />
Roading Network Improvements (Subsidy 11%) 22,184<br />
Substandard Road Upgrading (Subsidy 13%) 415 264 271 278 285 293 303 313<br />
<strong>Hutt</strong> <strong>City</strong> <strong>Council</strong> <strong>Annual</strong> Plan 2010-2011<br />
41
Budget<br />
<strong>Annual</strong><br />
Plan<br />
2010/2011<br />
$000s<br />
Forecast<br />
2011/2012<br />
$000s<br />
Traffic Safety Improvements (Subsidy 58%) 400 414 422 433 444 456 469 484 500<br />
Forecast<br />
2012/2013<br />
$000s<br />
Wainuiomata Hill Summit Bridge (Subsidy 58%) 844<br />
Forecast<br />
2013/2014<br />
$000s<br />
Forecast<br />
2014/2015<br />
$000s<br />
Forecast<br />
2015/2016<br />
$000s<br />
Forecast<br />
2016/2017<br />
$000s<br />
Witako/Waterloo Road Intersection Improvements (Subsidy 58%) 300<br />
Forecast<br />
2017/2018<br />
$000s<br />
Forecast<br />
2018/2019<br />
$000s<br />
8. Water Supply<br />
42<br />
Capital Projects<br />
Maintenance<br />
Kelson Pumping Station Renewal 158 162<br />
Korokoro Pumping Station Switchboard Renewal 60<br />
Main Road Watermain And Services Renewal Stage 4, Wainuiomata 380<br />
Network Minor Works 150<br />
Miromiro Road - Main/Services - Stage 1 308<br />
Moores Valley Road - Main/Services 206<br />
Network Renewals 1,672 1,779 1,882 1,984 2,033 2,087 2,140 2,664<br />
Pharazyn Street Pumping Station Renewal - Stage 2 150<br />
Pumping Station Minor Works 50 51 53 54 55 57 58 59 61<br />
Reservoir Hatch Security 25<br />
Reservoir Minor Works 50 51 38 211 125 53 43 48 61<br />
Scada Renewals 25 26 26 27 28 28 174 30 37<br />
Stokes Valley Road Pumping Station Switchboard Renewal 57<br />
Thirlmere Street - Rider/Services 140<br />
Walker Grove - Main/Rider/Services 160<br />
New/Improvements<br />
Eastern Bays Reservoir Upgrade Design/Consents 178<br />
Emergency Supply Point (Valving) 84<br />
Emergency Water Storage Tanks 162<br />
Kelson/Fairway Drive Link Main 368<br />
Main Road Watermain And Services Renewal Stage 3, Wainuiomata 200<br />
Normandale Reservoir Upgrade 151 357 1,584<br />
Petone/<strong>Hutt</strong> Link Mains (Tama North) 566<br />
Reservoir Seismic Upgrade - Delaney Reservoir 735<br />
Reservoir Seismic Upgrade - Kingsley Reservoir 580<br />
Reservoir Seismic Upgrade - Konini Reservoir 666<br />
Reservoir Seismic Upgrade - Taita Reservoir 735<br />
Sweetacres Reservoir Upgrade 1,171<br />
Sweetacres Watermain Upgrade 606
Budget<br />
<strong>Annual</strong><br />
Plan<br />
2010/2011<br />
$000s<br />
Forecast<br />
2011/2012<br />
$000s<br />
Forecast<br />
2012/2013<br />
$000s<br />
Forecast<br />
2013/2014<br />
$000s<br />
Forecast<br />
2014/2015<br />
$000s<br />
Forecast<br />
2015/2016<br />
$000s<br />
Forecast<br />
2016/2017<br />
$000s<br />
Forecast<br />
2017/2018<br />
$000s<br />
Forecast<br />
2018/2019<br />
$000s<br />
9. Wastewater<br />
Capital Projects<br />
Maintenance<br />
Local Pumping Station – Minor Works 80 82 84 86 88 91 93 95 97<br />
Network Minor Works 170<br />
Network Renewals 2,269 2,381 2,569 2,867 3,313 3,898 4,290 4,397<br />
Pressure Testing Of Sewers 300<br />
Scada Renewals 26 27 27 28 29 29 232 31 32<br />
Trunk DBO Asset Replacement Fund (Subsidy 25%) 1,163 1,192 1,222 1,252 1,250 894 916 939 963<br />
Trunk DBO Network Cyclic Replacement (Subsidy 31%) 300 308 315 323 331 339 696 366<br />
Trunk Main Outfall Pipeline Renewal (Subsidy 29%) 244<br />
Trunk Non DBO Minor Works (Subsidy 30%) 10<br />
Trunk Resource Consent Renewals (Subsidy 25%) 51 158 122<br />
Vista Grove Sewer Renewal 300<br />
Wainuiomata Catchment Sewer Renewals 620 820<br />
New/Improvements<br />
Leighton Avenue Sewer Renewals 180<br />
Trunk Non-DBO Mahina Bay Pumping Station Flowmeter 18<br />
Trunk Non-DBO Te Marua Pumping Station Flowmeter (Subsidy 31%) 18<br />
Trunk Type A Asset Development (Subsidy 32%) 350 615 210 215 221 226 232 297 792<br />
Trunk Type B Network Development (Subsidy 32%) 263 700 497 3,225 232 238 244<br />
Operating Projects<br />
DBO Main Outfall Leak Investigation And Repairs 150<br />
Wastewater Flow Monitoring Wainuiomata 120<br />
<strong>Hutt</strong> <strong>City</strong> <strong>Council</strong> <strong>Annual</strong> Plan 2010-2011<br />
43
Budget<br />
<strong>Annual</strong><br />
Plan<br />
2010/2011<br />
$000s<br />
Forecast<br />
2011/2012<br />
$000s<br />
Forecast<br />
2012/2013<br />
$000s<br />
Forecast<br />
2013/2014<br />
$000s<br />
Forecast<br />
2014/2015<br />
$000s<br />
Forecast<br />
2015/2016<br />
$000s<br />
Forecast<br />
2016/2017<br />
$000s<br />
Forecast<br />
2017/2018<br />
$000s<br />
Forecast<br />
2018/2019<br />
$000s<br />
10. Stormwater<br />
Capital Projects<br />
Maintenance<br />
Jackson Street (William Street to Jessie Street) 345<br />
Network Minor Works 120<br />
Network Renewals 495 533 577 629 689 762 781 747<br />
Pumping Station Minor Works 75 77 79 81 83 85 87 89 91<br />
Scada Renewals 35 26 26 27 28 28 174 30 30<br />
New/Improvements<br />
Adelaide Street Stormwater Upgrade 467<br />
Ariki Street Stormwater Upgrade 317<br />
Awamutu Stream Stormwater Upgrade 100 666 630 538 552 566 2,087 1,426 1,097<br />
Beach Stormwater Outlets Upgrade 475<br />
Black Creek Stage 3 Upgrade 860 1,640<br />
Boulcott Stopbank Project – HCC Contribution 250 256 263<br />
Dowse Drive Stormwater Improvement Project 308 580 594<br />
East Street, Petone, Stormwater Upgrade 102<br />
Es<strong>plan</strong>ade Stormwater Upgrade 406<br />
Heketara Street/Pukatea Street Stormwater Upgrade 726<br />
<strong>Hutt</strong> River Backflow Electrical Stormwater Upgrade 215 226 238<br />
<strong>Hutt</strong> River Floodplain Stormwater Outlets Upgrade 130 269 283 333 341<br />
Manuka Street Stormwater Upgrade 615<br />
Melling Road Pumping Station Installation 609<br />
Moera Street Stormwater Upgrade 416<br />
Percy Cameron Street Stormwater Upgrade 406<br />
Queen Street Stormwater Upgrade 735<br />
Rutherford Street Pumping Station Installation 609<br />
Victoria Street/Hume Street Stormwater Upgrade 645<br />
Walter Road Stormwater Upgrade 349<br />
Operating Projects<br />
Waiwhetu Stream Flood Management Plan 50<br />
44
Budget<br />
<strong>Annual</strong><br />
Plan<br />
2010/2011<br />
$000s<br />
Forecast<br />
2011/2012<br />
$000s<br />
Forecast<br />
2012/2013<br />
$000s<br />
Forecast<br />
2013/2014<br />
$000s<br />
Forecast<br />
2014/2015<br />
$000s<br />
Forecast<br />
2015/2016<br />
$000s<br />
Forecast<br />
2016/2017<br />
$000s<br />
Forecast<br />
2017/2018<br />
$000s<br />
Forecast<br />
2018/2019<br />
$000s<br />
11. Solid Waste<br />
Capital Projects<br />
New/Improvements<br />
Cleanfill Site Development 20 21<br />
Silverstream Landfill Stage Two 1,255 2,355 1,813 773 1,428 951 1,582 2,056 1,588<br />
Wainuiomata Landfill - Closure Costs 377<br />
Group Environment<br />
13. Emergency Management<br />
Capital Projects<br />
Maintenance<br />
Wainuiomata Bush Fire Force Vehicle 93 97 106<br />
New/Improvements<br />
Wainuiomata Bush Fire Force Headquarters 250<br />
14. Local Urban Environment<br />
Capital Projects<br />
Maintenance<br />
Seaview/Gracefield Banners 32 33 34 36 37 38 39 40 41<br />
New/Improvements<br />
CCTV Mast 25<br />
CCTV Upgrades Central Area And Installation Wainuiomata 52 53<br />
CBD Making Places Projects 1,055 1,451<br />
Suburban Shopping Centre Improvements 400 220 334 354 373<br />
Suburban Shopping Centre Improvements Stokes Valley 60<br />
Wingate Development Plan 147<br />
Operating Projects<br />
Business Programmes 36<br />
Environmental Sustainability Projects 98<br />
Heritage Incentives 130<br />
Rapid Response Anti-Graffiti Service 210<br />
School Programmes 38<br />
Urban Form 10<br />
Waste Minimisation Projects 59<br />
<strong>Hutt</strong> <strong>City</strong> <strong>Council</strong> <strong>Annual</strong> Plan 2010-2011<br />
45
Budget<br />
<strong>Annual</strong><br />
Plan<br />
2010/2011<br />
$000s<br />
Forecast<br />
2011/2012<br />
$000s<br />
Forecast<br />
2012/2013<br />
$000s<br />
Forecast<br />
2013/2014<br />
$000s<br />
Forecast<br />
2014/2015<br />
$000s<br />
Forecast<br />
2015/2016<br />
$000s<br />
Forecast<br />
2016/2017<br />
$000s<br />
Forecast<br />
2017/2018<br />
$000s<br />
Forecast<br />
2018/2019<br />
$000s<br />
Group Economy<br />
15. Economic Development<br />
Operating Projects<br />
Business <strong>Hutt</strong> Valley 284<br />
CBD Co-ordinator 40<br />
Economic Development Strategy 140<br />
<strong>Hutt</strong>city.com Web Hosting 15<br />
International Co-operating Cities 30<br />
Jackson Street Programme 130<br />
Retail Co-ordinator 55<br />
Group Organisation<br />
18. Managing Services<br />
Capital Projects<br />
Maintenance<br />
Archives Accommodation Changes 155 242<br />
Core Financial And Regulatory System Replacement/Upgrade 290 186 151 111 92 272 339 99 38<br />
Corporate Application/Hardware Replacement 282 398 764 428 430 384 497 416 343<br />
Desktop Operating System Upgrade 150 172 186<br />
General Office Expenditure 30 31 32 33 34 35 36 37 38<br />
Land Information Services Aerial Photos Renewal 30 140 156 34 327 32<br />
Network Replacement 30 5 5 6 63 24 24 25 25<br />
Online Service Delivery To <strong>Council</strong> Staff 25 26 27 28 29 30 30 31 32<br />
Other Information Services Projects 115 118 182 224 229<br />
Personal Computer Replacement Programme 240 269 258 267 275 307 291 298 305<br />
Printer Replacement Programme 28 69 44 32 79<br />
Replace/Upgrade Library System 29 236 61<br />
Server Replacement, Information Technology Storage And Disaster Recovery 140 103 86 89 92 189 97 99 102<br />
Software Purchases 60 41 43 67 69 71 73 75 76<br />
Telecommunications 20 124 32 22 11 24 158 25 13<br />
46
Budget<br />
<strong>Annual</strong><br />
Plan<br />
2010/2011<br />
$000s<br />
New/Improvements<br />
Additional Network Requirements 10 10 11 11 11 12 12 12 13<br />
Core Business Applications Enhancements 580 351 145 378 270 419 467 354 464<br />
Digitisation Of <strong>Council</strong> Core Information 561 5 11 33 63 4 4 4 95<br />
Internet - OnLine Services 130 5 11 34 35 36 37 178<br />
Mobile Devices 170 42 42 116 138 59 61 102 30<br />
Other Projects 44 46 83 85 87 89<br />
Operating Projects<br />
Internet Design 20<br />
Quality Of Life Study 25<br />
Research - Monitoring And Evaluation Of Outcomes 20<br />
Forecast<br />
2011/2012<br />
$000s<br />
Forecast<br />
2012/2013<br />
$000s<br />
Forecast<br />
2013/2014<br />
$000s<br />
Forecast<br />
2014/2015<br />
$000s<br />
Forecast<br />
2015/2016<br />
$000s<br />
Forecast<br />
2016/2017<br />
$000s<br />
Forecast<br />
2017/2018<br />
$000s<br />
Forecast<br />
2018/2019<br />
$000s<br />
<strong>Hutt</strong> <strong>City</strong> <strong>Council</strong> <strong>Annual</strong> Plan 2010-2011<br />
47
Forecast Financial Statements 2010/11 to 2018/19<br />
The following financial information consists of the Forecast Financial Statements which<br />
<strong>Council</strong> adopted on 24 June 2010 to meet the requirements of clause 12 of schedule 10 of<br />
the Local Government Act 2002.<br />
The Forecast Financial Statements have been prepared in accordance with New Zealand<br />
generally accepted accounting practice (GAAP), as required by Section 111 of that Act.<br />
<strong>Council</strong> is designated as a public benefit entity for purposes of complying with generally<br />
accepted accounting practice. The Forecast Financial Statements comply with Financial<br />
Reporting Standard No. 42 – Prospective Financial Statements and New Zealand GAAP.<br />
Every three years <strong>Council</strong> is required to present Forecast Financial Statements that span<br />
10 years in the Long Term <strong>Council</strong> Community Plan (LTCCP). <strong>Hutt</strong> <strong>City</strong> <strong>Council</strong> is next<br />
required to prepare an LTCCP in 2012. For each year in between, <strong>Council</strong> has the option<br />
to either update its LTCCP or present an <strong>Annual</strong> Plan. For 2010/11 <strong>Hutt</strong> <strong>City</strong> <strong>Council</strong> has<br />
produced an <strong>Annual</strong> Plan.<br />
The <strong>Annual</strong> Plan Financial Statements provide budget information for the year ahead as well<br />
as financial forecasts for the following two years. This year <strong>Council</strong> has provided updated<br />
forecasts for an additional six years. This provides an opportunity for ratepayers and residents<br />
to assess the appropriateness of the financial actions <strong>plan</strong>ned by <strong>Council</strong>.<br />
The Forecast Financial Statements outline how <strong>Council</strong> will be funded for the next nine years<br />
and how that money will be spent. <strong>Council</strong> has prepared and agreed to Asset Management<br />
Plans for its assets. These <strong>plan</strong>s provide the basis for the development of the Forecast<br />
Financial Statements.<br />
The Forecast Financial Statements include:<br />
• An “Estimate” of the results of the current financial year based on the budget adjusted for<br />
expected variances.<br />
• The “Budget” <strong>Council</strong> proposes adopting for the coming financial year.<br />
• “Forecast” results for the remaining years based on extrapolated estimates adjusted for<br />
asset management <strong>plan</strong> requirements.<br />
The Forecast Financial Statements are based on estimates of costs and revenues into the<br />
future. The degree of uncertainty surrounding these estimates increases as the Forecast<br />
Financial Statements look out further into the future. Key assumptions and risks are outlined<br />
in this section.<br />
SIGNIFICANT ASSUMPTIONS<br />
The following assumptions have been adopted by <strong>Council</strong> in preparing the Forecast<br />
Financial Statements:<br />
• Service levels are generally assumed to remain the same for the period covered by the<br />
Forecast Financial Statements. Minor service level improvements are <strong>plan</strong>ned in relation<br />
to certain areas of <strong>Council</strong> activity as a result of capital projects.<br />
• Population is assumed to remain static, or change only marginally (0.1% per annum).<br />
Residential and commercial development is assumed to occur at the equivalent of 200<br />
additional household units each year. Capital expenditure <strong>plan</strong>s in some areas include<br />
an allowance for modest future capacity increases to help ensure that service standards<br />
remain sustainable.<br />
• Provision has been made for inflation based on projections provided by Business and<br />
Economic Research Limited (BERL) for the input cost indices used by <strong>Council</strong>, and<br />
the Treasury in relation to the Consumer Price Index. The average interest rate on debt<br />
is assumed to be 6.4%. This is based on the pattern of existing commitments and<br />
judgments about future trends.<br />
• Asset sale proceeds will be used to repay debt or fund asset purchases.<br />
• Net debt will be below $60 million in June 2011 and $30 million in 2015.<br />
• Depreciation and interest costs will be fully funded from rates and other operating<br />
revenue.<br />
• Capital expenditure will be funded by loans, capital contributions, transfers from reserves<br />
and asset sales. More detail is provided in the Funding Impact Statement.<br />
• The five-yearly property, <strong>plan</strong>t and equipment revaluations due in 2012 and 2017 will<br />
result in valuation increases in line with current trends and forecast inflation.<br />
• The Government will continue to pay NZ Transport Agency subsidies at current levels.<br />
The amount is determined by <strong>Council</strong>’s expenditure that attracts subsidies.<br />
48
COMPARISON WITH COUNCIL’S FORECAST FINANCIAL STATEMENTS 2009-2019<br />
These Forecast Financial Statements are similar to the 2009-2019 Forecast Financial<br />
Statements with the following exceptions:<br />
• Projections of future operating revenues and costs, and capital expenditure, have been<br />
revised to reflect more accurate estimates, more likely project completion dates and recent<br />
<strong>Council</strong> decisions.<br />
• Some capital projects have been deferred beyond 2011 but remain <strong>plan</strong>ned for completion<br />
prior to 2015. Provisions have been made for the Emissions Trading Scheme and for<br />
maintenance and upgrade of HCC wharves. These provisions have been accommodated<br />
by the deferral of several other projects, including the Taita Reservoir seismic upgrade,<br />
sports grounds artificial training areas and a portion of the stormwater works in Victoria St/<br />
Hume St.<br />
• Projections prior to 2010/11 showed the Waiwhetu Stream clean-up project as a capital<br />
project for 2009/10 and 2010/11. The project is now reflected as an operating project in<br />
2009/10. While this increases the operational expenditure in 2009/10, it also decreases the<br />
2010/11 capital expenditure.<br />
• New provision has been made to fund the proposed square outside TheNewDowse as part<br />
of the CBD Making Places project.<br />
• Projections of future operating revenues and costs, and capital expenditure, have been<br />
further adjusted to reflect current inflation forecasts.<br />
• The proceeds from projected asset sales are continuously under review and have been<br />
adjusted to align with current expectations.<br />
<strong>Council</strong> intends to update these Forecast Financial Statements annually.<br />
SIGNIFICANT RISKS<br />
Actual results achieved for each reporting period are likely to vary from the forecasts<br />
presented, and the variations may be material. In particular, there are several significant risks<br />
that could have a material impact on whether <strong>Council</strong> is able to achieve the financial results<br />
indicated in the Forecast Financial Statements.<br />
• <strong>Council</strong> has estimated the likely proceeds from the sale of assets. The estimates are based<br />
on estimated values of <strong>Council</strong> land identified as suitable for sale. There is a risk that<br />
the values indicated in the Statement of Prospective Movements in Net Debt will not be<br />
realised.<br />
• Expenditure items relating to major projects have been estimated. These include timing and<br />
amounts for capital expenditure and operating costs. The outcome of tender evaluation<br />
and negotiation processes on these projects may have a material impact on the Forecast<br />
Financial Statements.<br />
• In particular, provisions for capital expenditure on certain major projects that are being<br />
considered by <strong>Council</strong> have been included in these Forecast Financial Statements. It is not<br />
possible to reliably estimate the timing and the amount of <strong>Council</strong>’s share of the related<br />
costs. The rate of inflation and interest rates may differ significantly from the assumptions<br />
used in preparing these Forecast Financial Statements. These differences could materially<br />
alter the actual results achieved in future years.<br />
COMMITMENTS AND CONTINGENCIES<br />
The Forecast Financial Statements provide for all the material capital and operating<br />
commitments known to <strong>Council</strong>. Prudent provisions have also been made in these Forecast<br />
Financial Statements for probable future obligations of <strong>Council</strong>.<br />
<strong>Hutt</strong> <strong>City</strong> <strong>Council</strong> <strong>Annual</strong> Plan 2010-2011<br />
49
COUNCIL NET DEBT<br />
The graph shows the projected level of net debt in the Forecast Financial Statements.<br />
<strong>Council</strong> <strong>plan</strong>s to achieve a significant reduction in net debt.<br />
COUNCIL RATES INCOME<br />
The graph shows the projected level of rates income in the Forecast Financial Statements.<br />
<strong>Council</strong> <strong>plan</strong>s to increase rates income by no more than 0.5% above the rate of inflation each<br />
year. Rates per capita increase in a similar manner.<br />
Net Debt as at 30 June each Year<br />
<strong>Annual</strong> Rates<br />
100<br />
120<br />
1,100<br />
Amount ($ millions)<br />
80<br />
60<br />
40<br />
20<br />
Total Amount ($ millions)<br />
100<br />
80<br />
60<br />
40<br />
20<br />
900<br />
700<br />
500<br />
300<br />
100<br />
Rates per Capita ($)<br />
0<br />
2010 2011 2012 2013 2014 2015 2016 2017 2018 2019<br />
0<br />
2010 2011 2012 2013 2014 2015 2016 2017 2018 2019<br />
-100<br />
Total Rates Revenue<br />
Rates Per Capita<br />
AUTHORISATION<br />
These Forecast Financial Statements were authorised for issue by <strong>Hutt</strong> <strong>City</strong> <strong>Council</strong><br />
on 24 June 2010.<br />
<strong>Hutt</strong> <strong>City</strong> <strong>Council</strong> is responsible for these Forecast Financial Statements, including the<br />
appropriateness of the assumptions underlying the Forecast Financial Statements and all<br />
other disclosures.<br />
50
Forecast Financial Statements – Prospective Statement of Comprehensive Income<br />
For the year ending 30 June Estimate<br />
2010<br />
$000s<br />
Budget<br />
2011<br />
$000s<br />
Forecast<br />
2012<br />
$000s<br />
Forecast<br />
2013<br />
$000s<br />
Forecast<br />
2014<br />
$000s<br />
Forecast<br />
2015<br />
$000s<br />
Forecast<br />
2016<br />
$000s<br />
Forecast<br />
2017<br />
$000s<br />
Forecast<br />
2018<br />
$000s<br />
Forecast<br />
2019<br />
$000s<br />
REVENUE<br />
Rates funding 80,587 82,712 85,359 88,090 90,909 93,818 96,820 99,919 103,116 106,416<br />
User charges 33,502 28,990 30,268 30,881 31,996 32,218 33,005 33,546 34,322 34,860<br />
Operating contributions 6,012 5,945 6,127 6,219 6,381 6,547 6,719 6,904 7,101 7,310<br />
Capital contributions 4,312 4,425 4,835 13,157 4,922 5,052 7,582 6,082 5,503 5,586<br />
Vested Assets 9,590 600 619 644 663 684 703 721 739 757<br />
Other revenue 3,302 3,122 2,925 3,034 3,287 3,226 3,321 3,579 3,499 3,584<br />
Total revenue 137,305 125,794 130,133 142,025 138,158 141,545 148,150 150,751 154,280 158,513<br />
EXPENDITURE<br />
Employee costs 26,597 27,543 28,146 28,569 29,259 29,879 30,535 31,280 31,928 32,640<br />
Operating costs 70,272 62,458 65,019 66,500 69,201 71,192 73,215 75,823 77,963 80,337<br />
Interest expenditure 5,038 4,500 4,447 3,977 3,471 2,950 2,747 3,296 3,687 3,595<br />
Depreciation and amortisation 27,118 26,591 26,279 26,528 28,500 30,253 30,455 31,208 32,144 34,590<br />
Total expenditure 129,025 121,092 123,891 125,574 130,431 134,274 136,952 141,607 145,722 151,162<br />
OPERATING SURPLUS BEFORE REVALUATION GAINS<br />
AND LOSSES 8,280 4,702 6,242 16,451 7,727 7,271 11,198 9,144 8,558 7,351<br />
Gain/(loss) on revaluation of financial instruments 800 800 1,000 300 300 300 500 - - -<br />
SURPLUS BEFORE TAX 9,080 5,502 7,242 16,751 8,027 7,571 11,698 9,144 8,558 7,351<br />
Tax expense - - - - - - - - - -<br />
SURPLUS AFTER TAX 9,080 5,502 7,242 16,751 8,027 7,571 11,698 9,144 8,558 7,351<br />
Gains on Asset Revaluation - - - - 213,008 - - - - 276,910<br />
Total Other Comprehensive Income - - - - 213,008 - - - - 276,910<br />
TOTAL COMPREHENSIVE INCOME 9,080 5,502 7,242 16,751 221,035 7,571 11,698 9,144 8,558 284,261<br />
<strong>Hutt</strong> <strong>City</strong> <strong>Council</strong> <strong>Annual</strong> Plan 2010-2011<br />
51
Forecast Financial Statements – Prospective Statement of Changes in Equity<br />
For the year ending 30 June Estimate 2010<br />
$000s<br />
Budget 2011<br />
$000<br />
Forecast 2012<br />
$000s<br />
Forecast 2013<br />
$000s<br />
Forecast 2014<br />
$000s<br />
Forecast 2015<br />
$000s<br />
Forecast 2016<br />
$000s<br />
Forecast 2017<br />
$000s<br />
Forecast 2018<br />
$000s<br />
Forecast 2019<br />
$000s<br />
Surplus after tax 9,080 5,502 7,242 16,751 8,027 7,571 11,698 9,144 8,558 7,351<br />
OTHER RECOGNISED REVENUES AND EXPENSES<br />
Change in asset revaluation reserves - - - - 213,008 - - - - 276,910<br />
Total Comprehensive Income 9,080 5,502 7,242 16,751 221,035 7,571 11,698 9,144 8,558 284,261<br />
Equity at beginning of the year 1,139,809 1,148,889 1,154,391 1,161,633 1,178,384 1,399,419 1,406,990 1,418,688 1,427,832 1,436,390<br />
EQUITY AT END OF THE YEAR 1,148,889 1,154,391 1,161,633 1,178,384 1,399,419 1,406,990 1,418,688 1,427,832 1,436,390 1,720,651<br />
Accumulated funds 739,050 744,552 751,794 768,545 776,572 784,143 795,841 804,985 813,543 820,894<br />
Restricted reserves 83 83 83 83 83 83 83 83 83 83<br />
<strong>Council</strong> created reserves 21,100 21,100 21,100 21,100 21,100 21,100 21,100 21,100 21,100 21,100<br />
Revaluation reserves 388,656 388,656 388,656 388,656 601,664 601,664 601,664 601,664 601,664 878,574<br />
TOTAL EQUITY 1,148,889 1,154,391 1,161,633 1,178,384 1,399,419 1,406,990 1,418,688 1,427,832 1,436,390 1,720,651<br />
52
Forecast Financial Statements – Prospective Statement of Financial Position<br />
As at 30 June Estimate 2010<br />
$000s<br />
Budget 2011<br />
$000s<br />
Forecast 2012<br />
$000s<br />
Forecast 2013<br />
$000s<br />
Forecast 2014<br />
$000s<br />
Forecast 2015<br />
$000s<br />
Forecast 2016<br />
$000s<br />
Forecast 2017<br />
$000s<br />
Forecast 2018<br />
$000s<br />
Forecast 2019<br />
$000s<br />
EQUITY<br />
Accumulated funds 739, 050 744,552 751,794 768,545 776,572 784,143 795,841 804,985 813,543 820,894<br />
Restricted reserves 83 83 83 83 83 83 83 83 83 83<br />
<strong>Council</strong> created reserves 21,100 21,100 21,100 21,100 21,100 21,100 21,100 21,100 21,100 21,100<br />
Revaluation reserves 388,656 388,656 388,656 388,656 601,664 601,664 601,664 601,664 601,664 878,574<br />
TOTAL EQUITY 1,148,889 1,154,391 1,161,633 1,178,384 1,399,419 1,406,990 1,418,688 1,427,832 1,436,390 1,720,651<br />
Represented by:<br />
CURRENT ASSETS<br />
Cash and cash equivalents 8,959 12,388 11,071 10,041 10,089 11,022 9,964 9,446 7,868 6,045<br />
Debtors and other receivables 10,013 7,613 6,160 6,416 6,631 6,840 7,042 7,227 7,406 7,573<br />
Derivative financial instruments 2,542 3,342 4,342 4,642 4,942 5,242 5,742 5,742 5,742 5,742<br />
Non-current assets held for sale 7,816 2,433 1,000 1,000 1,117 - - - - -<br />
Other assets 398 398 398 398 398 398 398 398 398 398<br />
Total current assets 29,728 26,174 22,971 22,497 23,177 23,502 23,146 22,813 21,414 19,758<br />
NON-CURRENT ASSETS<br />
Property, <strong>plan</strong>t and equipment 1,197,902 1,193,933 1,201,289 1,209,227 1,425,465 1,422,660 1,446,262 1,464,548 1,480,454 1,759,137<br />
Assets under construction 21,167 21,167 21,167 21,167 21,167 21,167 21,167 21,167 21,167 21,167<br />
Intangible assets 2,123 2,123 2,123 2,123 2,123 2,123 2,123 2,123 2,123 2,123<br />
Investment in subsidiaries 14,545 14,545 14,545 14,545 14,545 14,545 14,545 14,545 14,545 14,545<br />
Investment in associates 224 224 224 224 224 224 224 224 224 224<br />
Other financial assets 678 678 678 678 678 678 678 678 678 678<br />
Total non-current assets 1,236,639 1,232,670 1,240,026 1,247,964 1,464,202 1,461,397 1,484,999 1,503,285 1,519,191 1,797,874<br />
Total assets 1,266,367 1,258,844 1,262,997 1,270,461 1,487,379 1,484,899 1,508,145 1,526,098 1,540,605 1,817,632<br />
CURRENT LIABILITIES<br />
Cash and cash equivalents - - - - - - - - - -<br />
Borrowings - current 42,545 41,520 37,430 26,840 21,629 10,517 21,032 28,902 33,940 25,855<br />
Derivative financial instruments 2,596 2,596 2,596 2,596 2,596 2,596 2,596 2,596 2,596 2,596<br />
Creditors and other payables 17,954 20,954 21,645 22,547 23,301 24,034 24,747 25,396 26,025 26,612<br />
Employee entitlements 2,214 2,214 2,287 2,382 2,462 2,539 2,615 2,683 2,750 2,812<br />
Other liabilities 2,910 2,910 3,006 3,131 3,236 3,338 3,437 3,527 3,614 3,696<br />
Total current liabilities 68,219 70,194 66,964 57,496 53,224 43,024 54,427 63,104 68,925 61,571<br />
NON-CURRENT LIABILITIES<br />
Borrowings - non current 45,000 30,000 30,000 30,000 30,000 30,000 30,000 30,000 30,000 30,000<br />
Provisions 3,571 3,571 3,689 3,842 3,971 4,096 4,217 4,328 4,435 4,535<br />
Employee entitlements 688 688 711 740 765 789 813 834 854 874<br />
Total non-current liabilities 49,259 34,259 34,400 34,582 34,736 34,885 35,030 35,162 35,289 35,409<br />
Total liabilities 117,478 104,453 101,364 92,078 87,960 77,909 89,457 98,266 104,214 96,980<br />
NET ASSETS 1,148,889 1,154,391 1,161,633 1,178,383 1,399,419 1,406,990 1,418,688 1,427,832 1,436,391 1,720,652<br />
<strong>Hutt</strong> <strong>City</strong> <strong>Council</strong> <strong>Annual</strong> Plan 2010-2011<br />
53
Forecast Financial Statements – Prospective Cash Flow Statement<br />
For the year ending 30 June Estimate 2010<br />
$000s<br />
Budget 2011<br />
$000s<br />
Forecast 2012<br />
$000s<br />
Forecast 2013<br />
$000s<br />
Forecast 2014<br />
$000s<br />
Forecast 2015<br />
$000s<br />
Forecast 2016<br />
$000s<br />
Forecast 2017<br />
$000s<br />
Forecast 2018<br />
$000s<br />
Forecast 2019<br />
$000s<br />
CASH FLOWS FROM OPERATING ACTIVITIES<br />
Cash was provided from:<br />
Receipts from rates and levies - <strong>Council</strong> 80,587 82,712 85,359 88,090 90,909 93,818 96,820 99,919 103,116 106,416<br />
User charges and other income 46,858 44,732 45,608 53,035 46,371 46,834 50,425 49,926 50,246 51,173<br />
Interest received 270 150 - - - - - - - -<br />
Tax received - - - - - - - - - -<br />
Receipts from rates and levies - GWRC* 13,000 13,000 13,000 13,000 13,000 13,000 13,000 13,000 13,000 13,000<br />
140,715 140,594 143,967 154,125 150,280 153,652 160,245 162,845 166,362 170,589<br />
Cash was applied to:<br />
Payments to suppliers and employees 96,869 87,001 92,164 93,765 97,367 100,010 102,717 106,164 108,981 112,126<br />
Interest paid 5,038 4,500 4,447 3,977 3,471 2,950 2,747 3,296 3,687 3,595<br />
Rates and levies passed to GWRC* 13,000 13,000 13,000 13,000 13,000 13,000 13,000 13,000 13,000 13,000<br />
Net GST paid to Inland Revenue - - - - - - - - - -<br />
114,907 104,501 109,611 110,742 113,838 115,960 118,464 122,460 125,668 128,721<br />
Net cash inflows from operating activities 25,808 36,093 34,356 43,383 36,442 37,692 41,781 40,385 40,694 41,868<br />
CASH FLOWS FROM INVESTING ACTIVITIES<br />
Cash was provided from:<br />
Sale of property, <strong>plan</strong>t and equipment 1,345 7,816 2,433 1,000 1,000 1,117 - - - -<br />
Other receipts and investments - - - - - - - - - -<br />
Dividends received - - - - - - - - - -<br />
1,345 7,816 2,433 1,000 1,000 1, 117 - - - -<br />
Cash was applied to:<br />
Purchase and construction of property, <strong>plan</strong>t and equipment 25,674 24,967 34,626 35,444 32,918 27,436 54,807 49,357 47,717 36,421<br />
Less UHCC capital contribution (578) (511) (611) (622) (735) (672) (1,453) (584) (406) (815)<br />
Other investments and payments - - - - - - - - - -<br />
25,096 24,456 34,015 34,822 32,183 26,764 53,354 48,773 47,311 35,606<br />
Net cash outflows from investing activities (23,751) (16,640) (31,582) (33,822) (31,183) (25,647) (53,354) (48,773) (47,311) (35,606)<br />
* GWRC is the Greater Wellington Regional <strong>Council</strong> for which the <strong>Hutt</strong> <strong>City</strong> <strong>Council</strong> acts as a collection agency by including additional rates in its own billing processes. Once collected the monies are passed to GWRC.<br />
54
Estimate 2010<br />
$000s<br />
Budget 2011<br />
000s<br />
Forecast 2012<br />
$000s<br />
Forecast 2013<br />
$000s<br />
Forecast 2014<br />
$000s<br />
Forecast 2015<br />
$000s<br />
Forecast 2016<br />
$000s<br />
Forecast 2017<br />
$000s<br />
Forecast 2018<br />
$000s<br />
Forecast 2019<br />
$000s<br />
CASH FLOWS FROM FINANCING ACTIVITIES<br />
Cash was provided from:<br />
Proceeds from borrowing 175,568 154,154 161,994 139,130 102,147 75,403 52,584 91,997 120,645 127,675<br />
175,568 154,154 161,994 139,130 102,147 75,403 52,584 91,997 120,645 127,675<br />
Cash was applied to:<br />
Repayment of borrowing 177,624 170,178 166,085 149,721 107,358 86,515 42,069 84,127 115,606 135,760<br />
177,624 170,178 166,085 149,721 107,358 86,515 42,069 84,127 115,606 135,760<br />
Net cash inflows/(outflows) from financing activities (2,056) (16,024) (4,091) (10,591) (5,211) (11,112) 10,515 7,870 5,039 (8,085)<br />
Net increase/(decrease) in cash, cash equivalents and bank overdraft 1 3,429 (1,317) (1,030) 48 933 (1,058) (518) (1,578) (1,823)<br />
Cash, cash equivalents and bank overdraft at beginning of the year 8,958 8,959 12,388 11,071 10,041 10,089 11,022 9,964 9,446 7,868<br />
Cash, cash equivalents and bank overdraft at end of the year 8,959 12,388 11,071 10,041 10,089 11,022 9,964 9,446 7,868 6,045<br />
Cash balance at end of the year comprises:<br />
Cash and on call deposits 8,959 12,388 11,071 10,041 10,089 11,022 9,964 9,446 7,868 6,045<br />
Short term deposits - - - - - - - - - -<br />
Bank overdraft - - - - - - - - - -<br />
Cash, cash equivalents and bank overdraft at end of the year 8,959 12,388 11,071 10,041 10,089 11,022 9,964 9,446 7,868 6,045<br />
<strong>Hutt</strong> <strong>City</strong> <strong>Council</strong> <strong>Annual</strong> Plan 2010-2011<br />
55
Summary of Significant Accounting Policies<br />
This Summary of Significant Accounting Policies supports the Forecast Financial Statements<br />
and other budgetary information included in the <strong>Annual</strong> Plan.<br />
REPORTING ENTITY<br />
The <strong>Hutt</strong> <strong>City</strong> <strong>Council</strong> (referred to as ‘<strong>Council</strong>’) is a territorial local authority governed by<br />
the Local Government Act 2002. <strong>Council</strong> was first formed as Lower <strong>Hutt</strong> <strong>City</strong> <strong>Council</strong> on 1<br />
November 1989 by the amalgamation of five local authorities. The name was changed to The<br />
<strong>Hutt</strong> <strong>City</strong> <strong>Council</strong> by a special Act of Parliament on 8 October 1991.<br />
Group prospective financial statements have not been presented as they would not differ<br />
significantly from the Financial Statements presented to <strong>Council</strong>.<br />
The primary objective of <strong>Council</strong> is to provide goods or services for the community or social<br />
benefit rather than making a financial return. Accordingly, <strong>Council</strong> has designated itself as a<br />
public benefit entity.<br />
BASIS OF PREPARATION<br />
Measurement base<br />
The Financial Statements have been prepared on a historical cost basis, modified by the<br />
revaluation of land and buildings, certain infrastructural assets, investment property and<br />
financial instruments (including derivative instruments).<br />
Functional and presentation currency<br />
The Financial Statements are presented in New Zealand dollars and all values are rounded to<br />
the nearest thousand dollars ($’000). The functional currency of <strong>Council</strong> is New Zealand dollars.<br />
Changes in accounting policies<br />
There have been no significant changes in accounting policies. The accounting policies set out<br />
below have been applied consistently to all periods presented in these Financial Statements.<br />
SIGNIFICANT ACCOUNTING POLICIES<br />
Revenue<br />
Revenue is measured at the fair value of consideration received or receivable.<br />
Rates revenue<br />
Rates are set annually by a resolution from <strong>Council</strong> and relate to a financial year. All ratepayers<br />
are invoiced within the financial year for which the rates have been set. Rates revenue is<br />
recognised when payable.<br />
Rates collected on behalf of the Greater Wellington Regional <strong>Council</strong> (GWRC) are not<br />
recognised in the financial statements (except for in the Statement of Cash Flows) as the<br />
<strong>Council</strong> is acting as an agent for the GWRC.<br />
Revenue from water rates by meter is recognised on an accrual basis. Unbilled usage, as a<br />
result of unread meters at year end, is accrued on an average usage basis.<br />
Government grants<br />
<strong>Council</strong> receives government grants from the NZ Transport Agency, which subsidises part of<br />
the <strong>Council</strong>’s costs in maintaining the local roading infrastructure. The subsidies are recognised<br />
as revenue upon entitlement as conditions pertaining to eligible expenditure have been fulfilled.<br />
Provision of services<br />
Revenue from the rendering of services is recognised by reference to the stage of completion<br />
of the transaction at balance date, based on the actual service provided as a percentage of<br />
the total services to be provided.<br />
Vested assets<br />
Where a physical asset is acquired for nil or nominal consideration the fair value of the asset<br />
received is recognised as revenue. Assets vested in <strong>Council</strong> are recognised as revenue when<br />
control over the asset is obtained.<br />
Sale of goods<br />
Sales of goods are recognised when a product is sold to the customer. The recorded revenue<br />
is the gross amount of the sale, including credit card fees payable for the transaction. Such<br />
fees are included in other expenses.<br />
Traffic and parking infringements<br />
Traffic and parking infringements are recognised when tickets are issued.<br />
Interest and dividends<br />
Interest income is recognised using the effective interest method.<br />
Dividends are recognised when the right to receive payment has been established.<br />
56
Development contributions<br />
The revenue recognition point for development and financial contributions is at the later of the<br />
point when <strong>Council</strong> is ready to provide the service for which the contribution was levied, or the<br />
event that will give rise to a requirement for a development or financial contribution under the<br />
legislation.<br />
Construction contracts<br />
Contract costs are recognised as expenses by reference to the stage of completion of the<br />
contract at balance date. The stage of completion is measured by reference to the contract<br />
costs incurred up to balance date as a percentage of total estimated costs for each contract.<br />
Contract costs include all costs directly related to specific contracts, and costs that are<br />
specifically chargeable to the customer under the terms of the contract.<br />
Where the outcome of a contract cannot be reliably estimated, contract costs are recognised<br />
as an expense as incurred.<br />
Construction work in progress is stated as the aggregate of contract costs incurred to date.<br />
Borrowing costs<br />
Borrowing costs are recognised as an expense in the period in which they are incurred.<br />
Grant expenditure<br />
Non-discretionary grants are those grants that are awarded if the grant application meets<br />
the specified criteria and are recognised as expenditure when an application that meets the<br />
specified criteria for the grant has been received.<br />
Discretionary grants are those grants where <strong>Council</strong> has no obligation to award on receipt of<br />
the grant application and are recognised as expenditure when a successful applicant has been<br />
notified of <strong>Council</strong>’s decision.<br />
Income tax<br />
Income tax expense comprises both current tax and deferred tax, and is calculated using tax<br />
rates that have been enacted or substantively enacted by balance date.<br />
Current tax is the amount of income tax payable based on the taxable profit for the current<br />
year, plus any adjustments to income tax payable in respect of prior years.<br />
Deferred tax is the amount of income tax payable or recoverable in future periods in respect of<br />
temporary differences and unused tax losses. Temporary differences are differences between<br />
the carrying amount of assets and liabilities in the financial statements and the corresponding<br />
tax bases used in the computation of taxable profit.<br />
The measurement of deferred tax reflects the tax consequences that would follow from the<br />
manner in which the entity expects to recover or settle the carrying amount of its assets<br />
and liabilities.<br />
Deferred tax liabilities are generally recognised for all taxable temporary differences. Deferred<br />
tax assets are recognised to the extent that it is probable that taxable profits will be available<br />
against which the deductible temporary differences or tax losses can be utilised.<br />
Deferred tax is not recognised if the temporary difference arises from the initial recognition<br />
of goodwill or from the initial recognition of an asset and liability in a transaction that is not a<br />
business combination, and at the time of the transaction, affects neither accounting profit nor<br />
taxable profit.<br />
Deferred tax is recognised on taxable temporary differences arising on investments in<br />
subsidiaries and associates, and interests in joint ventures, except where the company can<br />
control the reversal of the temporary difference and it is probable that the temporary difference<br />
will not reverse in the foreseeable future.<br />
Current tax and deferred tax is charged or credited to the Statement of Comprehensive<br />
Income, except when it relates to items charged or credited directly to equity, in which case<br />
the tax is dealt with in equity.<br />
Leases<br />
Finance leases<br />
A finance lease is a lease that transfers to the lessee substantially all the risks and rewards<br />
incidental to ownership of an asset, whether or not title is eventually transferred.<br />
At the commencement of the lease term, the <strong>Council</strong> recognises finance leases as assets and<br />
liabilities in the Statement of Financial Position at the lower of the fair value of the leased item<br />
or the present value of the minimum lease payments.<br />
The finance charge is charged to the Statement of Financial Performance over the lease period<br />
so as to produce a constant periodic rate of interest on the remaining balance of the liability.<br />
The amount recognised as an asset is depreciated over its useful life. If there is no certainty<br />
as to whether <strong>Council</strong> will obtain ownership at the end of the lease term, the asset is fully<br />
depreciated over the shorter of the lease term and its useful life.<br />
Operating leases<br />
An operating lease is a lease that does not transfer substantially all the risks and rewards<br />
incidental to ownership of an asset. Lease payments under an operating lease are recognised<br />
as an expense on a straight-line basis over the lease term.<br />
Cash and cash equivalents<br />
Cash and cash equivalents includes cash in hand, deposits held at call with banks, other<br />
short-term highly liquid investments with original maturities of three months or less, and bank<br />
overdrafts.<br />
Bank overdrafts are shown in current liabilities in the Statement of Financial Position.<br />
<strong>Hutt</strong> <strong>City</strong> <strong>Council</strong> <strong>Annual</strong> Plan 2010-2011<br />
57
58<br />
Trade and other receivables<br />
Trade and other receivables are initially measured at fair value and subsequently measured at<br />
amortised cost using the effective interest method, less any provision for impairment.<br />
Financial assets<br />
Financial assets and liabilities are initially measured at fair value plus transaction costs unless<br />
they are carried at fair value through profit or loss in which case the transaction costs are<br />
recognised in the Statement of Comprehensive Income.<br />
Purchases and sales of investments are recognised on trade-date, the date on which <strong>Council</strong><br />
commits to purchase or sell the asset. Financial assets are derecognised when the rights to<br />
receive cash flows from the financial assets have expired or have been transferred and the<br />
<strong>Council</strong> has transferred substantially all the risks and rewards of ownership.<br />
<strong>Council</strong> classifies its financial assets into the following categories: fair value through profit or<br />
loss, held-to-maturity investments, loans and receivables and fair value through equity. The<br />
classification depends on the purpose for which the investments were acquired. Management<br />
determines the classification of its investments at initial recognition.<br />
Financial assets fair value through profit or loss<br />
Financial assets fair value through profit or loss include financial assets held for trading. A<br />
financial asset is classified in this category if acquired principally for the purpose of selling in the<br />
short-term. Derivatives (e.g. interest rate swaps and options) are also categorised as held for<br />
trading unless they are designated as hedges. Assets in this category are classified as current<br />
assets if they are either held for trading or are expected to be realised within 12 months of the<br />
Statement of Financial Position date.<br />
After initial recognition they are measured at their fair values with gains or losses on<br />
remeasurement recognised in the Statement of Comprehensive Income.<br />
Loans and receivables<br />
Loans and receivables are non-derivative financial assets with fixed or determinable payments<br />
that are not quoted in an active market. They are included in current assets, except for<br />
maturities greater than 12 months after balance date, which are included in non-current<br />
assets. The <strong>Council</strong>’s loans and receivables comprise cash and cash equivalents, trade and<br />
other receivables, term deposits, community and related party loans.<br />
After initial recognition they are measured at amortised cost using the effective interest method<br />
less impairment. Gains and losses when the asset is impaired or derecognised are recognised<br />
in the Statement of Comprehensive Income.<br />
Loans, including loans to community organisations made by <strong>Council</strong> at nil or below-market<br />
interest rates are initially recognised at the present value of their expected future cash flows,<br />
discounted at the current market rate of return for a similar financial instrument. The loans are<br />
subsequently measured at amortised cost using the effective interest method. The difference<br />
between the face value and present value of expected future cash flows of the loan is<br />
recognised in the Statement of Comprehensive Income as a grant.<br />
Held to maturity investments<br />
Held to maturity investments are non-derivative financial assets with fixed or determinable<br />
payments and fixed maturities that <strong>Council</strong> has the positive intention and ability to hold to<br />
maturity. They are included in current assets, except for maturities greater than 12 months<br />
after balance date, which are included in non-current assets.<br />
After initial recognition they are measured at amortised cost using the effective interest method<br />
less impairment. Gains and losses when the asset is impaired or derecognised are recognised<br />
in the Statement of Comprehensive Income.<br />
Financial assets at fair value through equity<br />
Financial assets at fair value through equity are those that are designated as fair value through<br />
equity or are not classified in any of the other categories above. They include non-current<br />
assets unless management intends to dispose of the investment within 12 months of the<br />
balance date.<br />
The <strong>Council</strong> includes in this category:<br />
• Investments that it intends to hold long-term but which may be realised before maturity;<br />
and<br />
• Shareholdings that <strong>Council</strong> holds for strategic purposes.<br />
<strong>Council</strong>’s investments in its subsidiary and associate companies are not included in this<br />
category as they are held at cost (as allowed by NZ IAS 27 Consolidated and Separate<br />
Financial Statements and NZ IAS 28 Investments in Associates) whereas this category is to be<br />
measured at fair value.<br />
After initial recognition these investments are measured at their fair value, with gains and<br />
losses recognised directly in equity except for impairment losses, which are recognised in the<br />
Statement of Comprehensive Income.<br />
On de-recognition the cumulative gain or loss previously recognised in equity is recognised in<br />
the Statement of Comprehensive Income.<br />
Fair value<br />
The fair value of financial instruments traded in active markets is based on quoted market<br />
prices at the Statement of Financial Position date. The quoted market price used is the current<br />
bid price.<br />
The fair value of financial instruments that are not traded in an active market is determined<br />
using valuation techniques. <strong>Council</strong> uses a variety of methods and makes assumptions that<br />
are based on market conditions existing at each balance date. Quoted market prices or dealer<br />
quotes for similar instruments are used for long-term debt instruments held. Other techniques,<br />
such as estimated discounted cash flows, are used to determine fair value for the remaining<br />
financial instruments.
Impairment of financial assets<br />
At each Statement of Financial Position date <strong>Council</strong> assesses whether there is any objective<br />
evidence that a financial asset or group of financial assets is impaired. Any impairment losses<br />
are recognised in the Statement of Comprehensive Income.<br />
Loans, receivables and term deposits<br />
Impairment of a loan, receivable or term deposit is established when there is objective<br />
evidence that <strong>Council</strong> will not be able to collect all amounts due according to the original<br />
terms. Significant financial difficulties of the debtor/issuer, probability that the debtor/issuer<br />
will enter into bankruptcy, and default payments are considered indicators that the asset<br />
is impaired. The amount of the impairment is the difference between the asset’s carrying<br />
amount and the present value of estimated future cash flows, discounted using the original<br />
effective interest rate. For trade and other receivables, the carrying amount of the asset is<br />
reduced through the use of a provision account, and the amount of the loss is recognised in<br />
the Statement of Comprehensive Income. When the receivable is uncollectable, it is written<br />
off against the provision account. Overdue receivables that have been renegotiated are<br />
reclassified as current (i.e. not past due). For term deposits impairment losses are recognised<br />
directly against the instrument’s carrying amount.<br />
Quoted and unquoted equity investments<br />
For each equity investment classified as fair value through equity, a significant or prolonged<br />
decline in the fair value of the investment below its cost is considered an indicator of<br />
impairment. If such evidence exists for investments at fair value through equity, the<br />
cumulative loss (measured as the difference between the acquisition costs and the current<br />
fair value, less any impairment loss on that financial asset previously recognised in the<br />
Statement of Comprehensive Income) is removed from equity and recognised in the<br />
Statement of Comprehensive Income. Impairment losses recognised in the Statement of<br />
Comprehensive Income on equity investments are not reversed through the Statement of<br />
Comprehensive Income.<br />
Derivative financial instruments and hedging activities<br />
<strong>Council</strong> uses derivative financial instruments to hedge exposure to foreign exchange and<br />
interest rate risks arising from financing activities. In accordance with its treasury policy, <strong>Council</strong><br />
does not hold or issue derivative financial instruments for trading purposes.<br />
Foreign currency transactions are translated into the functional currency using the<br />
exchange rates prevailing at the dates of the transactions. Foreign exchange gains and<br />
losses resulting from the settlement of such transactions are recognised in the Statement of<br />
Comprehensive Income.<br />
The <strong>Council</strong>’s derivative financial instruments are not designated as hedging instruments for<br />
accounting purposes. Accordingly, derivative financial instruments are reported as financial<br />
instruments at fair value through profit or loss.<br />
Inventories<br />
Inventories (such as spare parts and other items) held for distribution or consumption in the<br />
provision of services that are not supplied on a commercial basis are measured at the lower<br />
of cost, adjusted when applicable, for any loss of service potential. Where inventories are<br />
acquired at no cost or for nominal consideration, the cost is the current replacement cost at<br />
the date of acquisition.<br />
Inventories held for use in the production of goods and services on a commercial basis<br />
are valued at the lower of cost and net realisable value. The cost of purchased inventory is<br />
determined using the First In First Out (FIFO) method.<br />
The amount of any write-down for the loss of service potential or from cost to net realisable<br />
value is recognised in the Statement of Comprehensive Income in the period of the write-down.<br />
Non-current assets held for sale<br />
Non-current assets held for sale are classified as held for sale if their carrying amount will be<br />
recovered principally through a sale transaction, not through continuing use. Non-current<br />
assets held for sale are measured at the lower of their carrying amount and fair value less<br />
costs to sell.<br />
Any impairment losses for write-downs of non-current assets held for sale are recognised in<br />
the Statement of Comprehensive Income. Any increases in fair value (less costs to sell) are<br />
recognised up to the level of any impairment losses that have been previously recognised.<br />
Non-current assets (including those that are part of a disposal group) are not depreciated or<br />
amortised while they are classified as held for sale.<br />
Property, <strong>plan</strong>t and equipment<br />
Property, <strong>plan</strong>t and equipment consist of:<br />
• Infrastructure assets; the fixed utility systems owned by <strong>Council</strong> and include resource<br />
consents. Each asset type includes all items that are required for the network to function.<br />
For example, sewerage reticulation includes reticulation piping and sewer pump stations.<br />
• Operational assets; these include land, buildings, improvements, library books, <strong>plan</strong>t and<br />
equipment and collection items.<br />
• Restricted assets; parks and reserves owned by <strong>Council</strong> which provide a benefit or service<br />
to the community and cannot be disposed of because of legal or other restrictions.<br />
Property, <strong>plan</strong>t and equipment are shown at cost or valuation, less accumulated depreciation<br />
and impairment losses.<br />
<strong>Hutt</strong> <strong>City</strong> <strong>Council</strong> <strong>Annual</strong> Plan 2010-2011<br />
59
60<br />
Additions<br />
The cost of an item of property, <strong>plan</strong>t and equipment is recognised as an asset if, and only if, it<br />
is probable that future economic benefits or service potential associated with the item will flow<br />
to <strong>Council</strong> and the cost of the item can be measured reliably. In most instances, an item of<br />
property, <strong>plan</strong>t and equipment is recognised at its cost. Where an asset is acquired at no cost,<br />
or for a nominal cost, it is recognised at fair value as at the date of acquisition.<br />
Assets under construction are included at cost. The total cost of a project is transferred to<br />
the relevant capital class on its completion and then depreciated. Borrowing costs are not<br />
capitalised.<br />
Costs incurred in obtaining any resource consents are capitalised as part of the asset to which<br />
they relate. If a resource consent application is declined then all capitalised costs are written off.<br />
Costs incurred subsequent to initial acquisition are capitalised only when it is probable that<br />
future economic benefits or service potential associated with the item will flow to <strong>Council</strong> and<br />
the cost of the item can be measured reliably.<br />
Costs that do not meet the criteria for capitalisation, or are below the thresholds of $1,000<br />
for information technology hardware and $2,500 for other items, are charged to operating<br />
expenditure.<br />
Disposal<br />
Gains and losses on disposals are determined by comparing the proceeds with the carrying<br />
amount of the asset. Gains and losses on disposals are reported net in the Statement of<br />
Comprehensive Income. When revalued assets are sold, the amounts included in asset<br />
revaluation reserves in respect of those assets are transferred to accumulated funds.<br />
Depreciation<br />
Depreciation is provided on a straight-line basis on all property, <strong>plan</strong>t and equipment at rates<br />
that will write off the cost (or valuation) of the assets to their estimated residual values over<br />
their useful lives, except that art, museum collections and land are not depreciated.<br />
The expected useful economic lives have been estimated as follows:<br />
Estimated economic lives Years Percentages<br />
Operational assets<br />
Buildings:<br />
- Structure 30 - 100 1 - 3.33<br />
- Roof 40 - 55 1.82 - 2.5<br />
- Services 35 - 55 1.82 - 2.86<br />
- Internal fitout 15 - 45 2.22 - 6.67<br />
- Plant 30 - 35 2.86 - 3.33<br />
Landfill building assets 50 - 100 1 - 2<br />
Library books 2 - 14 7.14 - 50<br />
Plant and equipment:<br />
- Office furniture 5 - 20 5 - 20<br />
- Plant 3 - 25 4 - 33.33<br />
- Computer equipment 3 - 5 20 - 33.33<br />
- Playground equipment 5 - 30 3.33 - 20<br />
- Recycling depots 10 10<br />
Wharves 15 - 40 2.5 - 6.67<br />
Landfill <strong>plan</strong>t 20 - 35 2.86 - 5<br />
Breakwaters 100 1<br />
Parking meters 10 - 25 4 - 10<br />
Other collection items 10 10<br />
Infrastructure assets<br />
Storm, supply and waste water utility assets:<br />
- Pumping stations 12 - 80 1.25 - 8.33<br />
- Pencarrow outfall tunnels 500 0.2<br />
- Pencarrow outfall other assets 25 - 62 1.61 - 4<br />
- Resource consents Life of the consent<br />
- Silverstream river crossing structure 60 1.67<br />
- Storage tanks 15 - 50 2 - 6.67<br />
- Treatment <strong>plan</strong>t 5 - 100 1 - 20<br />
Landfill storm water 100 1<br />
Landfill roading 20 - 100 1 - 5<br />
Roading network:<br />
- Berms 20 5<br />
- Bridges 80 - 100 1 - 1.25<br />
- Bus shelters 30 - 50 2 - 3.33<br />
- Car parking 8 - 80 1.25 - 12.5<br />
- Culvert and subways 100 1<br />
- Debris fences 25 4<br />
- Footpath walkway 15 - 50 2 - 6.67<br />
- Kerbs and channel 15 - 80 1.25 - 6.67<br />
- Pedestrian crossings 40 - 50 2 - 2.5
Estimated economic lives Years Percentages<br />
- Retaining walls 15 - 100 1 - 6.67<br />
- Roading carriageway 7 - 120 0.83 - 14.29<br />
- Seawalls 60 - 90 1.11 - 1.67<br />
- Speed humps 12 - 50 2 - 8.33<br />
- Street light support 50 2<br />
- Street lights 25 4<br />
- Sumps and leads 80 1.25<br />
- Traffic barriers 10 - 30 3.33 - 10<br />
- Traffic islands 60 1.67<br />
- Traffic signals and signs 5 - 30 3.33 - 20<br />
- Vehicle crossings 80 1.25<br />
Revaluation<br />
The <strong>Council</strong> assesses the carrying values of its revalued assets annually to ensure that they<br />
do not differ materially from the assets’ fair values. If there is a material difference, then the offcycle<br />
asset class is revalued.<br />
Land, buildings (operational and restricted), library books, and infrastructural assets (except<br />
land under roads) are revalued with sufficient regularity to ensure that their carrying amount<br />
does not differ materially from fair value and at least every five years, on the basis described<br />
below. All other asset classes are carried at depreciated historical cost.<br />
• Land and buildings have been valued at either optimised depreciated replacement cost or<br />
fair value.<br />
• Infrastructure assets have been valued at optimised depreciated replacement cost. The<br />
exceptions are:<br />
– wharves, which are valued at indemnity value, reflecting their minimum residual value<br />
– traffic signs, which are stated at cost<br />
– land under roads, which is valued at 45% of the average market value of adjacent land.<br />
• Landfill assets are valued at depreciated replacement cost.<br />
• Library literary assets are valued at depreciated replacement cost in accordance with draft<br />
guidelines released by the New Zealand Library Association and the National Library of<br />
New Zealand.<br />
• Collections items are classified into relevant asset classes and are revalued on a cyclical<br />
basis.<br />
All revaluations are carried out by independent valuers who specialise in the asset classes<br />
listed above. The exception is library literary assets, which are valued by staff with specialist<br />
knowledge in this area.<br />
The results of revaluing are credited or debited to an asset revaluation reserve for that<br />
class of asset. Where this results in a debit balance in the asset revaluation reserve, this<br />
balance is expensed in the Statement of Comprehensive Income. Any subsequent increase<br />
<strong>Hutt</strong> <strong>City</strong> <strong>Council</strong> <strong>Annual</strong> Plan 2010-2011<br />
on revaluation that off-sets a previous decrease in value recognised in the Statement of<br />
Comprehensive Income will be recognised first in the Statement of Comprehensive Income up<br />
to the amount previously expensed, and then credited to the revaluation reserve for that class<br />
of asset.<br />
Upper <strong>Hutt</strong> <strong>City</strong> <strong>Council</strong>’s interest in the bulk wastewater system<br />
The <strong>Hutt</strong> Valley and Wainuiomata bulk wastewater system is managed by <strong>Council</strong>. Upper <strong>Hutt</strong><br />
<strong>City</strong> <strong>Council</strong> pays an annual levy to the <strong>Hutt</strong> <strong>City</strong> <strong>Council</strong> based on an apportionment formula<br />
equating to between 26% and 31% of the funding requirements. While Upper <strong>Hutt</strong> <strong>City</strong><br />
<strong>Council</strong> does not have legal ownership of the bulk wastewater system, it is entitled to a share<br />
of the proceeds from any sale of the assets.<br />
Upper <strong>Hutt</strong> <strong>City</strong> <strong>Council</strong>’s interest in the bulk wastewater system assets is deducted from<br />
the value of property, <strong>plan</strong>t and equipment recognised in the Statement of Financial Position.<br />
Funding contributions from Upper <strong>Hutt</strong> <strong>City</strong> <strong>Council</strong> are recognised as revenue in the<br />
Statement of Comprehensive Income if the contributions are for the operation of the bulk<br />
wastewater system. Funding contributions for capital work are recognised as an increase in<br />
Upper <strong>Hutt</strong> <strong>City</strong> <strong>Council</strong>’s interest in the bulk wastewater system assets.<br />
Intangible assets<br />
Software acquisition and development<br />
Acquired computer software licences are capitalised on the basis of the costs incurred to<br />
acquire and bring to use the specific software. Costs that are directly associated with the<br />
development of software for internal use by <strong>Council</strong> are recognised as an intangible asset.<br />
Staff training costs are recognised as an expense when incurred.<br />
Costs associated with maintaining computer software are recognised as an expense<br />
when incurred.<br />
Easements<br />
Easements are recognised at cost, being the costs directly attributable to bringing the asset<br />
to its intended use. Easements have an indefinite useful life and are not amortised, but are<br />
instead tested for impairment annually.<br />
Amortisation<br />
The carrying value of an intangible asset with a finite life is amortised on a straight-line basis<br />
over its useful life. Amortisation begins when the asset is available for use and ceases at the<br />
date that the asset is derecognised. The amortisation charge for each period is recognised in<br />
the Statement of Comprehensive Income.<br />
The useful lives and associated amortisation rates of major classes of intangible assets have<br />
been estimated as follows:<br />
Computer software 3 - 5 years 33.33% – 20%<br />
61
62<br />
Impairment of property, <strong>plan</strong>t and equipment and intangible assets<br />
Assets that have an indefinite useful life, or are not yet available for use, are not subject to<br />
amortisation and are tested annually for impairment. Assets that have a finite useful life are<br />
reviewed for indicators of impairment at each balance date. When there is an indicator of<br />
impairment the asset’s recoverable amount is estimated. An impairment loss is recognised<br />
for the amount by which the asset’s carrying amount exceeds its recoverable amount. The<br />
recoverable amount is the higher of an asset’s fair value less costs to sell and value in use.<br />
Value in use is depreciated replacement cost for an asset where the future economic benefits<br />
or service potential of the asset are not primarily dependent on the asset’s ability to generate<br />
net cash inflows and where the entity would, if deprived of the asset, replace its remaining<br />
future economic benefits or service potential.<br />
The value in use for cash-generating assets and cash-generating units is the present value of<br />
expected future cash flows.<br />
If an asset’s carrying amount exceeds its recoverable amount the asset is impaired and<br />
the carrying amount is written down to the recoverable amount. For revalued assets the<br />
impairment loss is recognised against the revaluation reserve for that class of asset. Where<br />
that results in a debit balance in the revaluation reserve, the balance is recognised in the<br />
Statement of Comprehensive Income. For assets not carried at a revalued amount, the total<br />
impairment loss is recognised in the Statement of Comprehensive Income.<br />
The reversal of an impairment loss on a revalued asset is credited to the revaluation reserve.<br />
However, to the extent that an impairment loss for that class of asset was previously<br />
recognised in Statement of Comprehensive Income, a reversal of the impairment loss is also<br />
recognised in the Statement of Comprehensive Income.<br />
For assets not carried at a revalued amount (other than goodwill) the reversal of an impairment<br />
loss is recognised in the Statement of Comprehensive Income.<br />
Creditors and other payables<br />
Creditors and other payables are initially measured at fair value and subsequently measured at<br />
amortised cost using the effective interest method.<br />
Borrowings<br />
Borrowings are initially recognised at their fair value net of transaction costs incurred. After initial<br />
recognition, all borrowings are measured at amortised cost using the effective interest method.<br />
Borrowings are classified as current liabilities unless <strong>Council</strong> has an unconditional right to defer<br />
settlement of the liability for at least 12 months after the balance date.<br />
Employee entitlements<br />
Short-term benefits<br />
Employee benefits that <strong>Council</strong> expects to be settled within 12 months of balance date are<br />
measured at nominal values based on accrued entitlements at current rates of pay. These<br />
include salaries and wages accrued up to balance date, annual leave earned to, but not yet<br />
taken at balance date, retiring and long service leave entitlements expected to be settled within<br />
12 months, and sick leave.<br />
<strong>Council</strong> recognises a liability for sick leave to the extent that absences in the coming year are<br />
expected to be greater than the sick leave entitlements earned in the coming year. The amount<br />
is calculated based on the unused sick leave entitlement that can be carried forward at balance<br />
date, to the extent that <strong>Council</strong> anticipates it will be used by staff to cover those future absences.<br />
<strong>Council</strong> recognises a liability and an expense for bonuses where contractually obliged or where<br />
there is a past practice that has created a constructive obligation.<br />
Long-term benefits<br />
Entitlements that are payable beyond 12 months, such as long service leave and retiring leave,<br />
have been calculated on an actuarial basis. The calculations are based on:<br />
• likely future entitlements accruing to staff, based on years of service, years to entitlement,<br />
the likelihood that staff will reach the point of entitlement and contractual entitlements<br />
information; and<br />
• the present value of the estimated future cash flows.<br />
The discount rate used is the current New Zealand Government long-term bond rate as<br />
at 30 June each year, and the inflation rate used is the annual Consumer Price Index. The<br />
discount rate is based on <strong>Council</strong>’s long-term cost of funds. The inflation factor is based on the<br />
expected long-term increase in remuneration for employees.<br />
Superannuation schemes<br />
Defined contribution schemes<br />
Obligations for contributions to defined contribution superannuation schemes are recognised<br />
as an expense in the Statement of Financial Performance as incurred.<br />
Defined benefit schemes<br />
<strong>Council</strong> belongs to the Defined Benefit Plan Contributors Scheme (the scheme), which is<br />
managed by the Board of Trustees of the National Provident Fund. The scheme is a multiemployer<br />
defined benefit scheme.<br />
Insufficient information is available to use defined benefit accounting, as it is not possible to<br />
determine from the terms of the scheme, the extent to which the surplus/deficit will affect<br />
future contributions by individual employers, as there is no prescribed basis for allocation.<br />
The scheme is therefore accounted for as a defined contribution scheme.<br />
Provisions<br />
<strong>Council</strong> recognises a provision for future expenditure of uncertain amount or timing when there<br />
is a present obligation (either legal or constructive) as a result of a past event, it is probable<br />
that expenditures will be required to settle the obligation and a reliable estimate can be made<br />
of the amount of the obligation.
Provisions are measured at the present value of the expenditures expected to be required to<br />
settle the obligation using a pre-tax discount rate that reflects current market assessments of the<br />
time value of money and the risks specific to the obligation. The increase in the provision due to<br />
the passage of time is recognised as an interest expense and is included in finance costs.<br />
Financial guarantee contracts<br />
A financial guarantee contract is a contract that requires <strong>Council</strong> to make specified payments<br />
to reimburse the holder for a loss it incurs because a specified debtor fails to make payment<br />
when due.<br />
Financial guarantee contracts are initially recognised at fair value. If a financial guarantee<br />
contract was issued in a stand-alone arms length transaction to an unrelated party, its fair<br />
value at inception is equal to the consideration received. When no consideration is received a<br />
provision is recognised based on the probability <strong>Council</strong> will be required to reimburse a holder<br />
for a loss incurred, discounted to present value. The portion of the guarantee that remains<br />
unrecognised, prior to discounting to fair value, is disclosed as a contingent liability.<br />
Financial guarantees are subsequently measured at the initial recognition amount less any<br />
amortisation. However, if <strong>Council</strong> assesses that it is probable that expenditure will be required<br />
to settle a guarantee, then the provision for the guarantee is measured at the present value of<br />
the future expenditure.<br />
Landfill post closure costs<br />
As operator of the Silverstream and Wainuiomata landfill sites, <strong>Council</strong> has an obligation to<br />
ensure the ongoing maintenance and monitoring services at these landfill sites after closure.<br />
<strong>Council</strong> also has an obligation to monitor closed landfill sites previously operated by local<br />
authorities subsequently amalgamated to form the <strong>Hutt</strong> <strong>City</strong> <strong>Council</strong>.<br />
A site restoration and aftercare provision has been recognised as a liability in the Statement of<br />
Financial Position. Provision is made for the present value of closure and post closure costs<br />
when the obligation for post closure arises. The calculated cost is based on estimates of<br />
closure costs and future site trade waste charges and monitoring costs. The estimated length<br />
of time needed for post closure care is Silverstream 30 years, and Wainuiomata 28 years.<br />
The calculations assume no change in the legislative requirements or technological changes<br />
for closure and post closure treatment. The discount rate used is a pre-tax rate that reflects<br />
current market assessments of the time value of money and the risks specific to <strong>Council</strong>.<br />
Amounts provided for closure and post closure costs are capitalised to the landfill asset where<br />
they give rise to future economic benefits, or if they are incurred to enable future economic<br />
benefits to be obtained. The capitalised landfill asset is depreciated over the life of the landfill<br />
based on the capacity used.<br />
Equity<br />
Equity is the community’s interest in <strong>Council</strong> as measured by total assets less total liabilities.<br />
Equity is classified into a number of reserves to enable clearer identification of the specified<br />
uses that <strong>Council</strong> makes of their accumulated surpluses. The components of equity are:<br />
<strong>Hutt</strong> <strong>City</strong> <strong>Council</strong> <strong>Annual</strong> Plan 2010-2011<br />
Accumulated funds<br />
• <strong>Council</strong> created reserves<br />
• Restricted reserves<br />
• Asset revaluation reserves.<br />
Reserves represent a particular use to which various parts of equity have been assigned.<br />
Reserves may be legally restricted or created by <strong>Council</strong>.<br />
<strong>Council</strong> created reserves are established by <strong>Council</strong>. They may be altered without reference to any<br />
third party or the courts. Transfers to and from these reserves are at the discretion of <strong>Council</strong>.<br />
Restricted reserves are subject to specific conditions accepted as binding by <strong>Council</strong>, which<br />
may not be revised by <strong>Council</strong> without reference to the courts or third party. Transfers from<br />
these reserves may be made only for specified purposes or when certain conditions are met.<br />
Goods and services tax (GST)<br />
All items in the financial statements are stated exclusive of GST, except for receivables and<br />
payables, which are stated on a GST inclusive basis at the prevailing rate. Where GST is not<br />
recoverable as input tax then it is recognised as part of the related asset or expense.<br />
The net amount of GST recoverable from, or payable to, the Inland Revenue Department (IRD)<br />
is included as part of receivables or payables in the Statement of Financial Position.<br />
The net GST paid to, or received from the IRD, including the GST relating to investing and<br />
financing activities, is classified as an operating cash flow in the Statement of Cash Flows.<br />
Commitments and contingencies are disclosed exclusive of GST.<br />
Operating statements included in the Statement of Service Performance<br />
The operating statements report the net cost of services for significant activities of <strong>Council</strong>.<br />
<strong>Council</strong> has derived the net cost of services for each significant activity using the cost<br />
allocation system outlined below.<br />
• Direct costs are charged directly to significant activities. Indirect costs are charged to the<br />
significant activities based on cost drivers and related activity or usage information.<br />
• Each significant activity has been charged an internal interest cost. The net interest cost<br />
incurred by <strong>Council</strong> is allocated to each significant activity based on the net book value of<br />
property, <strong>plan</strong>t and equipment used by the activity.<br />
Cost allocation<br />
The <strong>Council</strong> has derived the cost of service for each significant activity (as reported within the<br />
Statements of Service Performance) using the following cost allocation methodology: Direct<br />
costs are expensed directly to the activity. Indirect costs relate to the overall costs of running<br />
the organisation and include staff time, office space and information technology costs. These<br />
indirect costs are allocated as overheads across all activities.<br />
63
Funding Impact Statement<br />
Introduction<br />
In terms of the Local Government (Rating) Act 2002, and the Local Government Act 2002,<br />
each council is required to prepare a Funding Impact Statement disclosing the revenue and<br />
financing mechanisms it intends to use.<br />
The information in the following sections is intended to achieve compliance with this legislation<br />
by, among other things, giving ratepayers full details of how rates are calculated.<br />
This statement should be read in conjunction with <strong>Council</strong>’s Revenue and Financing Policy,<br />
which sets out <strong>Council</strong>’s policies in respect of each source of funding of operating expenses.<br />
Summary of Funding Mechanisms and Indication of Level of Funds to be<br />
Produced by each Mechanism<br />
The following table sets out the revenue and financing mechanisms to be used for the 2010/11<br />
year, and the revenue forecast to be produced by each mechanism compared to the forecast<br />
shown in the Long Term <strong>Council</strong> Community Plan (LTCCP).<br />
Details of user charges and other funding sources, and the proportion applicable to each<br />
activity, are shown in more detail in the Revenue and Financing Policy contained within the<br />
<strong>Council</strong>’s 2009-2019 LTCCP.<br />
PROSPECTIVE FUNDING IMPACT STATEMENT<br />
For the year ending 30 June<br />
Budget<br />
2010<br />
$<br />
LTCCP<br />
Forecast<br />
2011<br />
$<br />
Budget<br />
2011<br />
$<br />
FUNDING FOR OPERATING EXPENDITURE<br />
General rate 53,484 54,921 56,213<br />
Targeted rates 26,603 27,339 26,499<br />
User charges 30,100 29,858 28,990<br />
Operating contributions 6,036 6,204 5,945<br />
Other revenue 2,497 2,164 3,122<br />
(Surplus)/deficit applied to borrowing 2,000 739 323<br />
TOTAL FUNDING FOR OPERATING EXPENDITURE 120,720 121,225 121,092<br />
FUNDING FOR CAPITAL EXPENDITURE<br />
Capital contributions 5,460 5,672 4,425<br />
Funding from non-cash expenses 27,459 27,182 26,591<br />
Asset sales 6,870 12,403 7,816<br />
Operating surpluses/(deficits) (2,000) (739) (323)<br />
Borrowing/(debt repayment) (10,843) (13,680) (16,024)<br />
TOTAL FUNDING FOR CAPITAL EXPENDITURE 26,946 30,838 22,485<br />
Rates for Year<br />
For the 2010/11 year, and for subsequent years, it is intended that <strong>Council</strong> will set the<br />
following rates:<br />
a) Water Supply Rate<br />
A separate targeted rate will be set to meet 100% of the costs of water supply and<br />
reticulation in the city. Lump sums will not be invited in respect of this rate.<br />
<strong>Council</strong> has set the targeted rate for water supply on the basis of the following factors:<br />
• A charge per separately used or inhabited part of a rating unit which is connected<br />
to the water reticulation system.<br />
• A charge of 50% of the above charge per separately used or inhabited part of a rating unit<br />
that is not connected to, but is able to be connected to, the water reticulation system.<br />
64
Provided that:<br />
• Rating units situated within 100 metres from any part of the water reticulation network<br />
are considered to be able to be connected (ie. serviceable).<br />
• Rating units that are not connected to the system, and that are not able to be<br />
connected, will not be liable for this rate.<br />
• The owner of a rating unit with more than one separately used or inhabited part, may opt<br />
to install a water meter to measure the total water consumed. In such a case only one<br />
charge will be made for the entire rating unit, but the owner will be liable to pay for water<br />
consumed as measured by the meter.<br />
b) Wastewater Rate<br />
A separate targeted rate will be set to meet 100% of the costs of wastewater collection,<br />
treatment and disposal within the city. Lump sums will not be invited in respect of this rate.<br />
<strong>Council</strong> proposes to set the targeted rate for the wastewater function on the basis of the<br />
following factors:<br />
• A charge for the first water closet or urinal connected to the wastewater system from<br />
each rating unit.<br />
• A charge of 50% of the above charge for the second and each subsequent water closet<br />
or urinal connected to the wastewater system from each rating unit.<br />
Provided that:<br />
• Each household is charged for no more than one water closet, regardless of the<br />
actual number.<br />
• No charge is made to any rating unit not connected to the wastewater system.<br />
• In the case of urinals each 900 mm or part thereof will be treated as being equivalent<br />
to one water closet.<br />
c) Recycling Charge<br />
A separate targeted rate will be set to meet 100% of the costs of the recycling collection<br />
service from residential properties. Lump sums will not be invited in respect of this rate.<br />
The targeted rate will be set as a fixed amount per separately used or inhabited part (SUIP)<br />
of each rating unit in the Residential differential category.<br />
d) Jackson Street Programme Rate<br />
A separate targeted rate, based on the capital value of each rating unit, will be set to raise<br />
revenue from rating units being operated as businesses and with a frontage to Jackson<br />
Street, Petone between <strong>Hutt</strong> Road and Cuba Street. The revenue raised from this rate will<br />
be applied to meet the costs of the Jackson Street Programme, which is a communitybased<br />
initiative to help reorganise and revitalise commercial activities in Jackson Street.<br />
Lump sums will not be invited in respect of this rate.<br />
e) Private Drains Rate<br />
A separate targeted rate will be set to recover the cost of the work undertaken by the<br />
<strong>Council</strong> to upgrade substandard private drains situated within the boundaries of rating<br />
units. The cost of the work is to be recovered over a five-year period from the ratepayers for<br />
these rating units as a uniform rate per dollar based on the costs incurred by the <strong>Council</strong><br />
and not otherwise paid by the ratepayer. In future years further upgrading work of this<br />
nature will be undertaken and the costs may be recovered in the same way. Lump sums are<br />
invited in respect of this rate.<br />
f) General Rate<br />
A general rate will be set:<br />
• To meet the costs of <strong>Council</strong> activities, other than those detailed above.<br />
• Based on the capital value of each rating unit in the city.<br />
• On a differential basis, based on the use to which the land is put.<br />
Uniform <strong>Annual</strong> General Charge<br />
<strong>Council</strong> does not propose to set a Uniform <strong>Annual</strong> General Charge (UAGC) for 2010/11, but in<br />
future years if a UAGC is set this will be calculated as one fixed amount per separately used or<br />
inhabited part (SUIP) of a rating unit.<br />
Definition of SUIP<br />
For the purposes of the UAGC or any targeted rate set as a fixed amount per separately used<br />
or inhabited part (SUIP) of a rating unit, a SUIP is defined as:<br />
• Any part of the rating unit separately used or inhabited by the owner or any other person<br />
who has the right to use or inhabit that part by virtue of a tenancy, lease, licence or other<br />
agreement.<br />
• At a minimum, the land or premises intended to form the separately used or inhabited<br />
part of the rating unit must be capable of actual habitation, or actual use by persons for<br />
purposes of conducting a business.<br />
• For the avoidance of doubt, a rating unit that has only one use (ie. it does not have separate<br />
parts or is vacant land) is treated as being one separately used or inhabited part.<br />
Differential Rating Details<br />
Each rating unit is allocated to a differential rating category (based on land use) for the purpose<br />
of calculating the general rate, or any specified targeted rate based on capital value.<br />
Set out below are the definitions used to allocate rating units to categories, together with<br />
details of the differential rating relationships between each category of rating unit for the<br />
purposes of setting and assessing the general rate. The relationships are calculated to<br />
produce, as near as is practicable, the correct proportion of general rate revenue from each<br />
group, as is indicated by <strong>Council</strong>’s Revenue and Financing Policy.<br />
<strong>Hutt</strong> <strong>City</strong> <strong>Council</strong> <strong>Annual</strong> Plan 2010-2011<br />
65
66<br />
For the 2010/11 rating year, only the general rate has been set using these differential<br />
categories and relationships.<br />
Definition of Rating Categories<br />
Category<br />
Residential (RE)<br />
Rural (RU)<br />
Business<br />
Accommodation (BA)<br />
Business Central<br />
(BC)<br />
Business Suburban<br />
(BS)<br />
Utility Networks (UN)<br />
Community Facilities<br />
1 (CF1)<br />
Community<br />
Facilities 2 (CF2)<br />
Community Facilities<br />
3 (CF3)<br />
Description<br />
All rating units in the city which are:<br />
• used primarily for residential purposes,<br />
• used or set aside for reserve or recreational purposes (other than East Harbour Regional<br />
Park), excluding properties categorised as rural.<br />
All rating units in the city which are:<br />
• used primarily for any purpose other than residential, commercial, industrial,<br />
recreational or reserve,<br />
• used primarily for residential purposes, having an area in excess of 3,000 m2, but not<br />
connected to either water and sewerage reticulation,<br />
• East Harbour Regional Park.<br />
All rating units in any part of the city which are used primarily for commercial<br />
accommodation.<br />
All rating units which are located within the Central Area Parking District and which are<br />
used primarily or predominantly for commercial and/or industrial purposes, excluding<br />
properties categorised as:<br />
• Utility Networks,<br />
• Business Accommodation.<br />
All rating units in any part of the city which are used primarily or predominantly for<br />
commercial and/or industrial purposes, excluding properties categorised as:<br />
• Community Facilities,<br />
• Business Central,<br />
• Utility Networks,<br />
• Business Accommodation.<br />
All rating units which comprise all or part of a utility network.<br />
All land in the city which is:<br />
• non-rateable in terms of the Local Government (Rating) Act 2002,<br />
• 50% non-rateable in terms of the Local Government (Rating) Act 2002.<br />
All rating units in the city occupied by charitable trusts and not-for-profit organisations<br />
which either:<br />
• use the land for non-trading purposes for the benefit of the community,<br />
• would qualify as land which is 50% non-rateable in accordance with Part 2 of<br />
Schedule 1 of the Local Government (Rating) Act 2002 if the organisation did not have<br />
a liquor licence, but excluding any rating unit used for residential purposes.<br />
All rating units in the city occupied by not-for-profit community groups or organisations<br />
whose primary purpose is to address the needs of adult members for entertainment<br />
or social interaction, and which engage in recreational, sporting, welfare or community<br />
services as a secondary purpose.<br />
For the purposes of these definitions:<br />
• Rating units which have no apparent land use (or where there is doubt as to the relevant<br />
use) will be placed in a category which best suits the activity area of the property under the<br />
District Plan.<br />
• Rating units which have more than one use (or where there is doubt as to the relevant<br />
primary use) will be placed in the category with the highest differential factor.<br />
• Central Area Parking District is as defined in the District Plan – <strong>City</strong> of Lower <strong>Hutt</strong>.<br />
• For the avoidance of doubt, “commercial purposes” includes rating units used:<br />
--<br />
As a hotel, motel, inn, hostel or boarding house.<br />
--<br />
Primarily as licensed premises.<br />
--<br />
As a camping ground.<br />
--<br />
As a convalescent home, nursing home, rest home or hospice operating for profit.<br />
--<br />
As a fire station.<br />
--<br />
By a government, quasi-government or local authority agency for administration or<br />
operational purposes.<br />
--<br />
As an establishment similar to any of the kinds referred to above, except to the extent<br />
that any such rating unit is non-rateable land in terms of the Local Government (Rating)<br />
Act 2002.<br />
• A “utility network” includes:<br />
--<br />
A gas, petroleum or geothermal energy distribution system.<br />
--<br />
An electricity distribution system.<br />
--<br />
A telecommunications or radio communications system.<br />
--<br />
A wastewater, stormwater or water supply reticulation system.<br />
• “Commercial accommodation” means the provision of accommodation for more than five<br />
persons (with or without any care, medical or other treatment or services) in the course of<br />
business, and to that extent includes:<br />
--<br />
A hotel, motel, inn, hostel or boarding house.<br />
--<br />
Any licensed premises where the provision of accommodation is the primary use.<br />
--<br />
A camping ground.<br />
--<br />
A convalescent home, nursing home, rest home or hospice operating for profit.<br />
• Subject to the right of objection set out in section 29 of the Local Government (Rating) Act<br />
2002, it shall be at the sole discretion of <strong>Council</strong> to determine the use or primary use of any<br />
rating unit in the city.
Relationships of Differential Categories<br />
The rate in the dollar set and assessed in respect of each specified category of rating units<br />
shall vary from the rate in the dollar in respect of any other specified category of property as<br />
set out below:<br />
Category<br />
Differential Factor<br />
Residential (RE) 1.00<br />
Rural (RU) 0.65<br />
Business Accommodation (BA) 3.00<br />
Business Central (BC) 3.70<br />
Business Suburban (BS) 3.40<br />
Utility Networks (UN) 2.50<br />
Community Facilities 1 (CF1) 1.00<br />
Community Facilities 2 (CF2) 0.50<br />
Community Facilities 3 (CF3) 2.50<br />
Rates for 2010/11<br />
1. Introduction<br />
The Funding Impact Statement (FIS) details the rates to be set, defines the differential<br />
categories, and shows the rating factors to be used for 2010/11.<br />
The table on page 64 shows a summary of all <strong>Council</strong> funding sources, including rates.<br />
The information set out below shows details of each individual rate forming part of the total<br />
rates. It shows an amount for each rate and charge, and which properties are liable for<br />
each rate. It also shows the change in the amount payable on a range of typical properties.<br />
It should be noted that all figures in this section are inclusive of GST at the prevailing rate,<br />
unless otherwise stated.<br />
2. Changes<br />
No changes have been made to the city-wide rating structure and differential factors to be<br />
used for the 2010/11 year.<br />
3. Schedule of Rates for 2010/11<br />
a) Water Supply Rate<br />
Type:<br />
Targeted rate<br />
Rating Factor: Separately used or inhabited part of a rating unit<br />
The charges for the 2010/11 rating year are as follows:<br />
Category<br />
Charge<br />
Connected $321 per part<br />
Serviceable but not connected $160.50 per part<br />
b) Wastewater Rate<br />
Type:<br />
Targeted rate<br />
Rating Factor: Number of water closets or urinals<br />
The charges for the 2010/11 rating year are as follows:<br />
Category<br />
Charge<br />
First WC or urinal per rating unit $408<br />
Second and each subsequent WC or urinal per rating unit $204 each<br />
<strong>Hutt</strong> <strong>City</strong> <strong>Council</strong> <strong>Annual</strong> Plan 2010-2011<br />
67
c) Recycling Charge<br />
Type:<br />
Targeted rate<br />
Rating Factor:<br />
Number of separately used or inhabited parts (SUIP) of the rating unit.<br />
The charge for the 2010/11 rating year is as follows:<br />
Category<br />
Charge<br />
Rating units in the Residential category to which the recycling collection service is<br />
provided, or available to be provided. $36<br />
d) Jackson Street Programme Rate<br />
Type:<br />
Targeted rate<br />
Rating Factor: Capital value<br />
The charge for the 2010/11 rating year is as follows:<br />
Category Rate<br />
Rating units in any business category having frontage to Jackson Street, Petone,<br />
between <strong>Hutt</strong> Road and Cuba Street.<br />
e) Private Drains Rate<br />
Type:<br />
Targeted rate<br />
Rating Factor: Cost of work to upgrade private drain<br />
The charges for the 2010/11 rating year are as follows:<br />
Category<br />
Per dollar of the cost of the work to upgrade private drain<br />
0.07287 cents<br />
per $ of Capital<br />
Value<br />
Charge<br />
24.30 cents per<br />
year for five years<br />
f) General Rate<br />
Type:<br />
General rate<br />
Rating Factor: Capital value<br />
The differential categories and charges for the 2010/11 rating year are as follows:<br />
Category Ratio Charge per $ of<br />
Capital Value<br />
Residential (RE) 1.00 0.24371 cents<br />
Rural (RU) 0.65 0.15841 cents<br />
Business Accommodation (BA) 3.00 0.73113 cents<br />
Business Central (BC) 3.70 0.90172 cents<br />
Business Suburban (BS) 3.40 0.82861 cents<br />
Utility Networks (UN) 2.50 0.60927 cents<br />
Community Facilities 1 (CF1) 1.00 0.24371 cents<br />
Community Facilities 2 (CF2) 0.50 0.12185 cents<br />
Community Facilities 3 (CF3) 2.50 0.60927 cents<br />
4. Summary of Revenue Required from Rates<br />
Rate<br />
Amount<br />
(Inclusive of GST)<br />
$000s<br />
Amount<br />
(Exclusive of GST)<br />
$000s<br />
General Rate 65,565 57,429<br />
Targeted Rates:<br />
Water Supply 12,760 11,177<br />
Wastewater 17,268 15,126<br />
Jackson Street 126 110<br />
Recycling 1,370 1,200<br />
Private Drains 89 78<br />
Total Rate Revenue 97,178 85,120<br />
Note: Total rate revenue includes rates charged on <strong>Council</strong>-owned properties.<br />
68
5. Summary of Revenue Required by Differential Group<br />
Differential Group Rates 2010/11$000s Total Rates<br />
by Category $000s<br />
Proportion of Total<br />
Rates<br />
Residential 61,345 63.1%<br />
Rural 477 0.5%<br />
Utility Networks 2,917 3.0%<br />
Business:<br />
Accommodation 554<br />
Central 9,398<br />
Suburban 21,421 31,373 32.3%<br />
Community Facilities:<br />
1 780<br />
2 144<br />
3 142 1,066 1.1%<br />
Total Rates Levied 97,178 100.00%<br />
6. Examples of rates on a range of typical properties<br />
The examples below show how a range of properties are affected by the rates for the<br />
new year.<br />
Category<br />
Rateable<br />
Values<br />
CV$<br />
2009/10 Rates 2010/11 Rates<br />
Current<br />
Rates<br />
$<br />
Rates<br />
$<br />
Change<br />
Amount<br />
$<br />
Change<br />
% age<br />
Residential – Average 386,000 1,642 1,706 64 3.9%<br />
Residential – High Value 800,000 2,618 2,715 97 3.7%<br />
Residential – 22 Flats 2,850,000 18,756 19,492 736 3.9%<br />
Residential – Low Value 240,000 1,298 1,350 52 4.0%<br />
Rural (No Services) 455,000 697 721 24 3.4%<br />
Rural (Full Services) 540,000 1,524 1,584 60 3.9%<br />
Bus. Accommodation 1,350,000 13,738 14,271 533 3.9%<br />
Business Central 9,800,000 87,096 90,118 3,022 3.5%<br />
Business Central 325,000 3,530 3,660 130 3.7%<br />
Business Suburban 1,700,000 23,067 23,995 928 4.0%<br />
Business Suburban – JSP 810,000 7,605 8,031 426 5.6%<br />
7. Rates instalment details<br />
The amount of the annual rates payable on each rating unit is payable by six equal<br />
instalments by the following dates:<br />
Instalment No.<br />
One<br />
Two<br />
Three<br />
Four<br />
Five<br />
Six<br />
Due Date<br />
20 August<br />
20 October<br />
20 December<br />
20 February<br />
20 April<br />
20 June<br />
Where the annual rates are not able to be set in time for the first instalment, the first<br />
instalment will be calculated and charged as one sixth of the previous year’s rates.<br />
The remaining five instalments will then be calculated as each being one fifth of the amount<br />
of the annual rates, after deducting the amount of instalment one.<br />
8. Penalties on unpaid rates<br />
If the rates instalment amount is not paid by the due date then the following penalty<br />
charges will be incurred:<br />
a) After the due date shown for each instalment, a penalty charge of 10% of the amount<br />
remaining unpaid for that instalment will be added to the rate account<br />
b) All rates levied in any previous financial year (including any penalty amounts already<br />
added for late payment) which remain unpaid after the due date for payment of the<br />
second instalment in the current year (20 October) will incur a further penalty charge<br />
of 10%<br />
c) All rates levied in any previous financial year (including any penalty amounts already<br />
added for late payment) which remain unpaid after the due date for payment of the fifth<br />
instalment in the current year (20 April) will incur a further penalty charge of 10%.<br />
Provided that no penalty shall be added to any rate account:<br />
a) Where a direct debit authority is in place for payment of the rates by regular weekly,<br />
fortnightly or monthly instalments, and payment in full is made by the end of the rating<br />
year; or<br />
b) Where any other satisfactory arrangement has been reached for payment of the current<br />
rates by regular instalments by the end of the rating year.<br />
<strong>Hutt</strong> <strong>City</strong> <strong>Council</strong> <strong>Annual</strong> Plan 2010-2011<br />
69
HCC Rates – Business/Residential split*<br />
Fees and Charges for 2010/11<br />
The following is a consolidated list of <strong>Hutt</strong> <strong>City</strong> <strong>Council</strong>’s fees and charges. All fees and<br />
charges include Goods and Services Tax (GST) at 12.5% from 1 July 2010 and at 15% from 1<br />
October 2010, with figures rounded where necessary.<br />
ANIMAL SERVICES<br />
From 1 Jul 2010 From 1 Oct 2010<br />
Dog<br />
Entire Dog $95.00 $98.00<br />
Neutered $85.00 $87.00<br />
All dogs not registered by 4 August $125.00 $128.00<br />
Classified “Dangerous” $123.00 $126.00<br />
Classified “Dangerous” and not registered by 4 August $184.50 $189.00<br />
Responsible owner status $55.00 $56.00<br />
Replacement registration tags $5.00 $5.00<br />
Euthanasia at owner’s request $30.00 $31.00<br />
Licence fee for keeping more than two dogs $30.00 $31.00<br />
Infringement fees set in the Dog Control Act 1996 apply<br />
Micro-chipping fee $30.00 $31.00<br />
16% Central business<br />
1% Eastern business<br />
1% Northern business<br />
1% Eastbourne business<br />
14% Petone business<br />
1% Wainuiomata business<br />
3% Western business<br />
13% Central residential<br />
8% Northern residential<br />
10% Eastern residential<br />
5% Eastbourne residential<br />
9% Petone residential<br />
9% Wainuiomata residential<br />
10% Western residential<br />
Impounding and Sustenance Fees<br />
First impounding during year of registration $75.00 $77.00<br />
Second impounding during year of registration $150.00 $154.00<br />
Sustenance fee per dog per day $16.00 $17.00<br />
Boarding fee per day $16.00 $17.00<br />
Seizure fee $75.00 $77.00<br />
ARCHIVES<br />
From 1 Jul 2010 From 1 Oct 2010<br />
There is no charge for inspecting items at the public reading room<br />
Search Fees<br />
1 Hour Free Free<br />
An initial charge for the first chargeable half hour $30.00 $31.00<br />
For each subsequent half hour $38.00 $39.00<br />
70<br />
* The figures total more than 100% as they have been rounded to the nearest percentage
From 1 Jul 2010 From 1 Oct 2010<br />
Research Questions - Fees apply*<br />
An initial charge for the first half hour $30.00 $31.00<br />
For each subsequent half hour $38.00 $39.00<br />
Note: * For Public Records Act access<br />
The full half-hour fee will be charged for each part-period used<br />
Fees are chargeable in advance<br />
Photocopy Fees<br />
Copying is subject to the physical condition and type of the item - in<br />
the interest of preserving the archive, and Copyright legislation<br />
All copying of archives will be carried out by Archive staff<br />
A4 Up to 20 pages Free Free<br />
Pages in excess of 20 20 cents per page* 20 cents per page*<br />
A3 $2.00 per page* $2.00 per page*<br />
* Fees to recover the cost of staff time may apply. After the first 10 minutes of copying, staff time will be added to<br />
the search/ research time.<br />
BOAT SHEDS<br />
Boat Shed<br />
CEMETERIES<br />
Independent valuation on a square<br />
metre basis<br />
From 1 Jul 2010 From 1 Oct 2010<br />
Plot Purchase and Maintenance In-perpetuity<br />
Adult $1,276.00 $1,305.00<br />
Child (1 to 12 Years) $507.00 $520.00<br />
Infant (Under 1 year) $507.00 $520.00<br />
Ashes $479.00 $490.00<br />
Ashes garden, Taita and Wainuiomata $775.50 $795.00<br />
Memorial tree plots, Block 18 $780.00 $798.00<br />
Ponga trail, Block 19 $623.00 $640.00<br />
From 1 Jul 2010 From 1 Oct 2010<br />
RSA Section<br />
Burial plot purchase Free Free<br />
Burial interment fee $675.00 $690.00<br />
Ashes plot purchase Free Free<br />
Ashes interment fee $87.50 $90.00<br />
Ashes interment (memorial wall) $87.50 $90.00<br />
Disinterments<br />
Burial (body) $1,860.00* $1,900.00*<br />
Ashes $170.00* $175.00*<br />
* Note: These figures are indicative only and the actual charge may differ depending on the nature of the disinterment<br />
Re-interments<br />
To be charged as for interment fees<br />
Special Fees and Charges<br />
Outside district fees* $868.00 $890.00<br />
Outside district fee* - children under 12 $764.00 $780.00<br />
Outside district fee* - RSA $868.00 $890.00<br />
Outside district fee* - ashes $628.00 $642.00<br />
Casket larger than standard $192.50 $198.00<br />
Triple depth burial interment $157.50 $161.00<br />
Outside standard hours of work Actual Cost Actual Cost<br />
Plaque/Memorial fees $65.00 $67.00<br />
Plot cancellation fee $43.00 $44.00<br />
Transfer of Exclusive Right $43.00 $44.00<br />
Breaking of concrete Actual Cost Actual Cost<br />
Search fee: Per entry (up to 30 minutes) $15.00 $16.00<br />
* Applies to all plot purchases where deceased has lived outside the city for the last five or more years.<br />
Reimbursement for unused plots is calculated at the rate originally paid for the plot.<br />
Interment Fees<br />
Adult $675.00 $690.00<br />
Child (1 to 12 Years) $433.00 $445.00<br />
Infant (Under 1 Year) $115.00 $118.00<br />
Ashes $87.50 $90.00<br />
<strong>Hutt</strong> <strong>City</strong> <strong>Council</strong> <strong>Annual</strong> Plan 2010-2011<br />
71
ENCROACHMENT ON HUTT CITY COUNCIL LAND<br />
From 1 Jul 2010 From 1 Oct 2010<br />
Application fee (new applications) $169.00 $173.00<br />
Application fee (alterations to existing use) $56.00 $58.00<br />
Gardens $113.00pa $115.00pa<br />
Single garage $125.00pa $128.00pa<br />
Double garage $250.00pa $256.00pa<br />
Commercial<br />
Assessed by <strong>Council</strong> at a market rate<br />
Note: These are indicative figures only and actual charges may differ depending on the nature of the<br />
encroachment.<br />
Other encroachment types will be assessed by <strong>Council</strong> on an individual basis.<br />
ENGINEERING RECORDS AND LAND INFORMATION SERVICES<br />
Print Size Plan Printer Transparency<br />
Plan Printer<br />
From 1 Jul 2010 From 1 Oct 2010<br />
Ink Jet Plots Plan Printer Transparency<br />
Plan Printer<br />
Ink Jet Plots<br />
Oversize - $50.00 - $52.00<br />
A0 - $30.00 - $31.00<br />
A1 $8.00 $5.00 $20.00 $8.50 $5.50 $21.00<br />
A2 $4.00 $3.00 $10.00 $4.50 $3.50 $11.00<br />
A3 $2.00 $7.00 $2.50 $7.50<br />
A4 - $5.00 - $5.50<br />
GIS Specialists time<br />
(per hour) $60.00 $62.00<br />
District Plan spatial data $1,000 or part thereof $1,025.00 or part thereof<br />
Otho-rectified Aerial Images<br />
(charges apply for full year) Year 1 Year 2 Year 3 Year 4 Year 5<br />
Georeferenced tiff files – per tile* $52 $46 $40 $35 $30<br />
Monthly subscription for Web Map<br />
Service $500 $438 $383 $335 $293<br />
*Bulk Discounts $1,000+ $10,000+ $20,000+<br />
Less 10% Less 20% Less 25%<br />
ENVIRONMENTAL CONSENTS<br />
All fees include GST and are payable under Section 36 of the Resource Management Act<br />
1991. Fees are not refundable if your application is declined or withdrawn. Additional charges<br />
may apply (see below).<br />
Application fees cover the cost of processing your application only. After you start building<br />
there are charges to cover the cost of <strong>Council</strong>’s monitoring costs, such as site visits, research,<br />
photos, communications and administration.<br />
Resource Consents<br />
Land Use Consents (Non-complying, Discretionary, Restricted Discretionary, Controlled) From 1 Jul 2010 From 1 Oct 2010<br />
Notified Application - Hearing required (includes up to 40 hours of<br />
processing and 1 monitoring inspection) If application is required to be<br />
notified in a daily newspaper an additional fee of $1,000.00 is required $4,715.00 $4,820.00<br />
Notified Application - No hearing required (includes up to 30 hours of<br />
processing and 1 monitoring inspection) $3,565.00 $3,645.00<br />
Limited Notification (includes up to 30 hours of processing and 1<br />
monitoring inspection) $3,565.00 $3,645.00<br />
Non-Notified Resource Consent (includes up to 7 hours of processing and<br />
1 monitoring inspection) $920.00 $940.00<br />
Non-Notified Resource Consent - Residential Additions and Alterations<br />
(includes up to 5 hours of processing and 1 monitoring inspection) $690.00 $705.00<br />
All additional processing (per hour) $115.00 $118.00<br />
Environmental Sustainability Initiatives<br />
Domestic solar hot water heating panels<br />
Solar water heating systems<br />
Free of charge for up to 5 hours of<br />
initial processing and 1 monitoring<br />
inspection, after which standard<br />
Hot water systems, ie. wetbacks associated with wood pellet stoves or low<br />
charges for the category of consent<br />
emission wood burners<br />
will apply<br />
Hot water heat pump systems<br />
Solar photo-voltaic systems<br />
Double glazing retrofits on buildings pre-2000<br />
Rainwater tanks<br />
All additional monitoring inspections (per visit) $115.00 $118.00<br />
Consultants Fees and Costs of Disbursements will also be additionally<br />
charged and invoiced when consent is completed<br />
Subdivisions (including Unit Title/Cross Lease)<br />
72<br />
Notified Application - Hearing required (includes up to 40 hours of<br />
processing and 1 monitoring inspection) If application is required to be<br />
notified in a daily newspaper an additional fee of $1,000.00 is required $4,715.00 $4,820.00<br />
Notified Application - No hearing required (includes up to 30 hours of<br />
processing and 1 monitoring inspection) $3,565.00 $3,645.00
Subdivision (including Unit Title/Cross Lease) From 1 Jul 2010 From 1 Oct 2010<br />
Limited Notification (includes up to 30 hours of processing and<br />
1 monitoring inspection) $3,565.00 $3,645.00<br />
Subdivision consent including land use consent (includes up to 10 hours of<br />
processing and 1 monitoring inspection) $1,265.00 $1,295.00<br />
Subdivision consent including Certificate under section 223 of the RMA<br />
(includes up to 8 hours of processing and 1 monitoring inspection)<br />
$1,035.00 plus<br />
$50 per lot over<br />
4 lots<br />
$1,058.00 plus<br />
$51 per lot over<br />
4 lots<br />
Certificate under section 224 of the RMA $230.00 $235.00<br />
Certificate under section 226 of the RMA<br />
(includes up to 3 hours of processing) $345.00 $353.00<br />
Section 241 and 243 RMA application $690.00 $705.00<br />
Rights of Way (includes 3 hours of processing) $345.00 $353.00<br />
Rights of Way sealing fee $150.00 $153.00<br />
Other Fees<br />
Section 139a Existing Use Certificate application $690.00 $705.00<br />
Certificate of Compliance (includes up to 6 hours of processing) $690.00 $705.00<br />
Outline Plan (includes up to 6 hours of processing and 1 monitoring inspection) $745.00 $762.00<br />
Outline Plan Waiver $745.00 $762.00<br />
Section 10 waiver, section 37 waiver, section 125 extension, section 126<br />
cancellation, section 127 and section 128 review (non-notified) RMA<br />
(includes up to 6 hours of processing) $690.00 $705.00<br />
Sections 357, 357A and 357B objection (non-notified) $690.00 $705.00<br />
Certificate of Use under Sale of Liquor Act $150.00 $153.00<br />
Any special inspections (per hour) $115.00 $118.00<br />
Sealing Fee (for urgent applications for registrable instruments) $80.00 $82.00<br />
Certificate under Overseas Investment Act 1973 $360.00 $368.00<br />
Cost of disbursements, i.e. venue hire, photocopying, catering, postage,<br />
public notification Actual Cost Actual Cost<br />
Independent consultants, advisors, specialists, Actual Cost Actual Cost<br />
All consents: additional processing hours (per hour) $115.00 $118.00<br />
Building Consents<br />
Project Information Memorandum, Building Consent & Certificate of Acceptance Fee<br />
Please note that the PIM and BC fees listed below are a Base Fee only and do not include any additional<br />
inspections, Consultants Fees or BRANZ and DBH levies. These will be charged extra as and if required.<br />
Total PIM and BC<br />
From 1 Jul 2010 From 1 Oct 2010<br />
Value of Work PIM BC Total Cost PIM BC Total Cost<br />
Minor Works Bldg/<br />
P & D Free Stand/<br />
Inbuilt Fire $65.00 $165.00 $230.00 $66.00 $169.00 $235.00<br />
To $5,000 $160.00 $285.00 $445.00 $164.00 $291.00 $455.00<br />
To $10,000 $160.00 $490.00 $650.00 $164.00 $500.00 $664.00<br />
To $19,999 $290.00 $695.00 $985.00 $296.00 $710.00 $1,006.00<br />
To $50,000 $290.00 $950.00 $1,240.00 $296.00 $971.00 $1,267.00<br />
To $100,000 $320.00 $1,505.00 $1,825.00 $327.00 $1,538.00 $1,865.00<br />
To $200,000 $320.00 $1,810.00 $2,130.00 $327.00 $1,850.00 $2,177.00<br />
To $300,000 $480.00 $2,215.00 $2,695.00 $491.00 $2,264.00 $2,755.00<br />
To $500,000 $540.00 $2,720.00 $3,260.00 $552.00 $2,780.00 $3,332.00<br />
To $700,000 $700.00 $3,325.00 $4,025.00 $716.00 $3,399.00 $4,115.00<br />
To $1,000,000 $950.00 $4,230.00 $5,180.00 $971.00 $4,324.00 $5,295.00<br />
Over $1,000,000 $950.00 +<br />
$100.00 per<br />
$200,000<br />
$4,235.00 +<br />
$360.00 per<br />
$200,000<br />
$5,185.00 +<br />
$460.00 per<br />
$200,000<br />
$971.00 +<br />
$102.00 per<br />
$200,000<br />
$4,329.00 +<br />
$368.00 per<br />
$200,000<br />
$5,300.00 +<br />
$470.00 per<br />
$200,000<br />
Once Building Consent has been granted, you will be notified of any further fees due, such as additional Inspection<br />
Fees, Consultants Fees, BRANZ and DBH levies.<br />
The Building Research Association of New Zealand (BRANZ) levy charge is $1.00 per $1,000 for works $20,000 and<br />
over, and the Dept of Building and Housing (DBH) levy charge is $1.97 per $1,000 for works $20,000 and over.<br />
Discharge or Withdrawal of Registrable Agreement<br />
Legal costs plus officer’s time at (per hour) $115.00 $118.00<br />
Processing request for Removal of Building Line (plus disbursements) $150.00 $153.00<br />
Adjustment or Revocation of Easements<br />
Legal costs plus officer’s time at (per hour) $115.00 $118.00<br />
Land Information Memoranda (‘LIM’)<br />
Residential Property LIM $300.00 $307.00<br />
Commercial Property LIM (deposit) $300.00 $307.00<br />
Additional processing hours (per hour) if more than 2 hours is required for<br />
commercial property LIMs $100.00 $102.00<br />
<strong>Hutt</strong> <strong>City</strong> <strong>Council</strong> <strong>Annual</strong> Plan 2010-2011<br />
73
Consultants Fees (e.g. Peer Review, NZ Fire Service, Legal or Professional advice) will be<br />
charged at actual cost plus disbursements.<br />
From 1 Jul 2010 From 1 Oct 2010<br />
Amendment Fee (includes half hour<br />
$150.00 $153.00<br />
processing time)<br />
All additional processing (per hour) $115.00 $118.00<br />
Inspection Fee $115.00 per inspection $118.00 per inspection<br />
Refundable Damage Deposit $500.00 $500.00<br />
Certificate for Public Use<br />
$165.00 when received with a<br />
Building Consent<br />
$225.00 when received<br />
independently<br />
$169.00 when received with a<br />
Building Consent<br />
$230.00 when received<br />
independently<br />
Service Connection Fee<br />
Sewer $30.00 $31.00<br />
Stormwater $30.00 $31.00<br />
Water $75.00 $77.00<br />
Certificate of Acceptance<br />
Works under $100,000<br />
Works $100,000 and over<br />
$700.00 deposit plus normal<br />
consent fees and levies for DBH<br />
$2,000.00 deposit plus normal<br />
consent fees and levies for DBH<br />
$716.00 deposit plus normal<br />
consent fees and levies for DBH<br />
$2,045.00 deposit plus normal<br />
consent fees and levies for DBH<br />
Environmental Sustainability Initiatives From 1 Jul 2010 From 1 Oct 2010<br />
Domestic solar hot water heating panels Free of charge Free of charge<br />
Solar water heating systems<br />
Hot water systems, ie. wetbacks associated with wood pellet stoves<br />
or low emission wood burners<br />
Hot water heat pump systems<br />
Solar photo-voltaic systems<br />
Double glazing retrofits on buildings pre-2000<br />
Rainwater tanks<br />
Other Fees<br />
Section 72 – Building on land subject to natural hazards Actual Cost Actual Cost<br />
Section 75 – Building on 2 or more allotments Actual Cost Actual Cost<br />
Street Crossing Inspection Actual Cost Actual Cost<br />
Structural Checking Fee Actual Cost Actual Cost<br />
Water Connection/Alterations application Actual Cost Actual Cost<br />
Sewer/Stormwater Connection/Disconnection Actual Cost Actual Cost<br />
Kerb and Channel Connections Actual Cost Actual Cost<br />
Backflow Prevention Device Actual Cost Actual Cost<br />
Sanitary Sewer TV Survey Actual Cost Actual Cost<br />
Stormwater TV Survey Actual Cost Actual Cost<br />
Compliance Schedule/Building WOF<br />
Building Warrant of Fitness $100.00 $102.00<br />
Building WOF/CS Inspection $115.00 per hour $118.00 per hour<br />
Amendment to Compliance Schedule $50.00 $51.00<br />
Commercial Cable Car $100.00 $102.00<br />
Residential Cable Car Free of charge Free of charge<br />
Development and Financial Contributions<br />
Development and financial contributions are payable in relation to the subdivision and<br />
development of land. The amounts payable are described in <strong>Council</strong>’s Policy on Development<br />
and Financial Contributions contained in the Long Term <strong>Council</strong> Community Plan.<br />
Property Information<br />
From 1 Jul 2010 From 1 Oct 2010<br />
Property information sent by email $10.00 $10.00<br />
Property information transferred to CD $15.00 $15.00<br />
Property information sent in hard copy<br />
$10.00 plus $0.50 per<br />
A4 black and white sheet<br />
$10.00 plus $0.50 per<br />
A4 black and white sheet<br />
$10.00 plus $1.00 per<br />
A3 black and white sheet<br />
$10.00 plus $1.00 per<br />
A4 colour sheet<br />
$10.00 plus $2.00 per<br />
A3 colour sheet<br />
$10.00 plus $1.00 per<br />
A3 black and white sheet<br />
$10.00 plus $1.00 per<br />
A4 colour sheet<br />
$10.00 plus $2.00 per<br />
A3 colour sheet<br />
A4 colour aerial photo $3.00 $3.00<br />
A3 colour aerial photo $7.00 $7.00<br />
Certificate of Title $15.00 $15.00<br />
Interests/document e.g. transfer, easement, covenant,<br />
lease $15.00 $15.00<br />
74
ENVIRONMENTAL HEALTH<br />
Premises meeting the required standard by 1 July are eligible for a discount, provided reregistration<br />
is applied for by 20 August.<br />
From 1 Jul 2010 From 1 Oct 2010<br />
Transfer/minimum fee $50.00 $51.00<br />
Non-complying inspection fee $80.00 $82.00<br />
Food Premises Fee Discount<br />
Fee<br />
From 1 Jul 2010 From 1 Oct 2010<br />
A Grade Fee Discount<br />
Fee<br />
A Grade<br />
Class One – Fruiterers, Pre-packaged<br />
only (low risk, pre-packaged) $312.00 $214.00 $171.00 $319.00 $219.00 $175.00<br />
Class Two – Dairies, Service Stations<br />
(small premises – ready made foods<br />
– some ice cream/pre-wrapped<br />
pies), Clubs (medium), Supply of low<br />
risk food $372.00 $259.00 $214.00 $380.00 $265.00 $219.00<br />
Class Three – Clubs (large), Rest<br />
Homes (50), Supermarkets<br />
(large), Supply of high risk food $876.00 $602.00 $493.00 $895.00 $615.00 $504.00<br />
Travelling Shop - Food $260.00 $177.00 $266.00 $181.00<br />
Food Stall $260.00 $177.00 $266.00 $181.00<br />
Clubs/Canteens (small) – type 16 – no<br />
food preparation $127.00 $88.00 $73.00 $130.00 $90.00 $75.00<br />
Other Licences From 1 Jul 2010 From 1 Oct 2010<br />
Fee<br />
Discount<br />
Fee<br />
A Grade Fee Discount<br />
Fee<br />
Travelling Shop – no food Set by statute Set by statute<br />
A Grade<br />
Hairdresser $257.00 $177.00 N/A $263.00 $181.00 N/A<br />
Camping Ground $434.00 $406.00 N/A $444.00 $415.00 N/A<br />
Hawker Set by statute Set by statute<br />
Amusement Device Set by statute Set by statute<br />
Mortuary $321.00 $219.00 N/A $328.00 $224.00 N/A<br />
Offensive Trade $369.00 $256.00 N/A $377.00 $262.00 N/A<br />
Note: Food premises operating under an Approved Food Control Plan will continue to be charged according to the listed<br />
risk category.<br />
Additional Charges From 1 Jul 2010 From 1 Oct 2010<br />
One off Food Stall $20.00 $20.00<br />
New Premises – Establishment fee $100.00 $102.00<br />
Initial Licence fee $80.00 $82.00<br />
Transfer Licence fee $50.00 $51.00<br />
Additional Inspections or Food Control Plan re-audit fee $80.00 per visit $82.00 per visit<br />
Street Musicians Licence $20.00 $20.00<br />
Amusement Devices (per site for 7 days) Set by statute Set by statute<br />
Noise Control From 1 Jul 2010 From 1 Oct 2010<br />
Seizure Fine (stereo equipment)<br />
$150.00 and $1 per day<br />
after the 1st month of<br />
storage<br />
$200.00 for 2nd seizure<br />
within a 6 mnth period<br />
$153.00 and $1 per day<br />
after the 1st month of<br />
storage<br />
$204.00 for 2nd seizure<br />
within a 6 mnth period<br />
Security Alarms – daytime attendances $80.00 $82.00<br />
Security Alarms – after hours attendances $150.00 $153.00<br />
Consultancy and survey fee $100.00 per hour $102.00 per hour<br />
<strong>Hutt</strong> <strong>City</strong> <strong>Council</strong> <strong>Annual</strong> Plan 2010-2011<br />
75
ENVIRONMENTAL POLICY<br />
From 1 Jul 2010 From 1 Oct 2010<br />
Requests for Change to District Plan (deposit): $5,000.00 $5,111.00<br />
All actual costs related to the proposed <strong>plan</strong> change, including council<br />
officers’ time, will be borne by the applicant as follows:<br />
• All work undertaken by the <strong>Council</strong> officers in connection with the<br />
request for the change shall be charged against the deposit at:<br />
• All work undertaken by independent consultants, advisors and/or<br />
specialists in connection with the request for the change shall be<br />
charged at the actual costs plus disbursements against the deposit.<br />
• Any hearing shall be charged against the deposit at:<br />
• If the proposed change is notified publicly, advertising charges will<br />
be actual costs payable by the applicant.<br />
• All information requested by the <strong>Council</strong> shall be supplied at the<br />
applicant’s cost.<br />
Notice of Requirement and Alterations to Notices of Requirement<br />
(deposit):<br />
All actual costs related to the requirement, including council officers’<br />
time, will be borne by the Requiring Authority as follows:<br />
• All work undertaken by the <strong>Council</strong> officers in connection with<br />
the requirement shall be charged against the deposit at:<br />
• All work undertaken by independent consultants, advisors and/or<br />
specialists in connection with the requirement shall be charged at<br />
the actual costs plus disbursements against the deposit.<br />
• Any hearing shall be charged against the deposit at:<br />
• If the requirement is notified publicly, advertising charges will be<br />
actual costs payable by the Requiring Authority.<br />
• All information requested by the <strong>Council</strong> shall be supplied at<br />
the Requiring Authority’s cost.<br />
$115.00 per hour $118.00 per hour<br />
$1,000.00 per<br />
day or part day<br />
$1,022.00 per<br />
day or part day<br />
$5,000.00 $5,111.00<br />
$115.00 per hour $118.00 per hour<br />
$1,000.00 per<br />
day or part day<br />
$1,022.00 per<br />
day or part day<br />
GAMBLING VENUE AND BOARD VENUE<br />
Class 4 Gambling Venue and Board Venue applications $300.00 $300.00<br />
HALLS<br />
Community rates of charges for hall hire are set out below.<br />
The commercial rates are set at the community rate, plus 50%, with a separate negotiable<br />
charge of up to 10% of the gross revenue of the commercial activity. A charity rate is also<br />
available by application.<br />
Community Halls<br />
Charge per hour<br />
All<br />
Facilities<br />
Mon - Fri<br />
From 1 Jul 2010 From 1 Oct 2010<br />
All<br />
Facilities<br />
Weekends<br />
& Holidays<br />
Meeting<br />
Room<br />
Mon - Fri<br />
Meeting<br />
Room<br />
Weekends<br />
& Holidays<br />
All<br />
Facilities<br />
Mon - Fri<br />
All<br />
Facilities<br />
Weekends<br />
& Holidays<br />
Meeting<br />
Room<br />
Mon - Fri<br />
Meeting<br />
Room<br />
Weekends<br />
& Holidays<br />
Moera, Eastbourne,<br />
Belmont, Stokes<br />
Valley $15.00 $20.00 N/A N/A $15.00 $20.00 N/A N/A<br />
Wainuiomata, Taita,<br />
Naenae $15.00 $20.00 $10.00 $12.00 $15.00 $20.00 $10.00 $12.00<br />
Hardwick-Smith<br />
Lounge $10.00 $15.00 N/A N/A $10.00 $15.00 N/A N/A<br />
Operative District Plan<br />
Complete set $250.00 $256.00<br />
Text Volume $125.00 $128.00<br />
Map Volume $125.00 $128.00<br />
76
Town Hall and Horticultural Hall<br />
Monday to Friday From 1 Jul 2010 From 1 Oct 2010<br />
Main Hall Supper Room Kitchen & Supper<br />
Room<br />
Main Hall &<br />
Kitchen<br />
All Facilities Main Hall Supper Room Kitchen & Supper<br />
Room<br />
8am – 12 noon $160.00 $40.00 $80.00 $210.00 $240.00 $164.00 $41.00 $82.00 $215.00 $245.00<br />
12 noon – 2pm $80.00 $35.00 $50.00 $115.00 $145.00 $82.00 $36.00 $51.00 $118.00 $148.00<br />
2pm – 6pm $160.00 $40.00 $80.00 $210.00 $240.00 $164.00 $41.00 $82.00 $215.00 $245.00<br />
6pm – 11pm $180.00 $50.00 $120.00 $240.00 $285.00 $184.00 $51.00 $122.00 $245.00 $291.00<br />
8am – 6pm $270.00 $85.00 $160.00 $350.00 $425.00 $276.00 $87.00 $164.00 $358.00 $434.00<br />
2pm – 11pm $270.00 $85.00 $160.00 $350.00 $425.00 $276.00 $87.00 $164.00 $358.00 $434.00<br />
8am – 11pm $350.00 $120.00 $240.00 $475.00 $585.00 $358.00 $123.00 $245.00 $486.00 $598.00<br />
After 11pm $70.00 $70.00 $70.00 $70.00 $70.00 $72.00 $72.00 $72.00 $72.00 $72.00<br />
Main Hall &<br />
Kitchen<br />
All Facilities<br />
Weekends & Public Holidays From 1 Jul 2010 From 1 Oct 2010<br />
Main Hall Supper Room Kitchen & Supper<br />
Room<br />
Main Hall &<br />
Kitchen<br />
All Facilities Main Hall Supper Room Kitchen & Supper<br />
Room<br />
8am – 12 noon $225.00 $70.00 $115.00 $270.00 $325.00 $230.00 $72.00 $118.00 $276.00 $332.00<br />
12 noon – 2pm $115.00 $45.00 $90.00 $160.00 $190.00 $118.00 $46.00 $92.00 $164.00 $194.00<br />
2pm – 6pm $225.00 $70.00 $115.00 $270.00 $325.00 $230.00 $72.00 $118.00 $276.00 $332.00<br />
6pm – 11pm $255.00 $90.00 $170.00 $335.00 $410.00 $261.00 $92.00 $174.00 $342.00 $419.00<br />
8am – 6pm $385.00 $115.00 $225.00 $490.00 $600.00 $394.00 $118.00 $230.00 $501.00 $613.00<br />
2pm – 11pm $385.00 $115.00 $225.00 $490.00 $600.00 $394.00 $118.00 $230.00 $501.00 $613.00<br />
8am – 11pm $490.00 $170.00 $335.00 $650.00 $805.00 $501.00 $174.00 $342.00 $664.00 $823.00<br />
After 11pm $100.00 $100.00 $100.00 $100.00 $100.00 $102.00 $102.00 $102.00 $102.00 $102.00<br />
Little Theatre<br />
From 1 Jul 2010 From 1 Oct 2010<br />
All Facilities<br />
Mon - Fri<br />
All Facilities<br />
Weekends &<br />
Holidays<br />
All Facilities<br />
Mon - Fri<br />
All Facilities<br />
Weekends &<br />
Holidays<br />
8am – 1pm $130.00 $190.00 $133.00 $195.00<br />
1pm – 6pm $130.00 $190.00 $133.00 $195.00<br />
6pm – 11pm $130.00 $190.00 $133.00 $195.00<br />
Two sessions in one day $210.00 $285.00 $215.00 $291.00<br />
Three sessions in one day $315.00 $430.00 $322.00 $440.00<br />
After 11pm $70.00 $100.00 $72.00 $102.00<br />
Main Hall &<br />
Kitchen<br />
All Facilities<br />
<strong>Hutt</strong> <strong>City</strong> <strong>Council</strong> <strong>Annual</strong> Plan 2010-2011<br />
77
LANDFILLS (all charges include a government waste levy)<br />
LITTERING INFRINGEMENT FEES<br />
78<br />
From 1 Jul 2010 From 1 Oct 2010<br />
Domestic Vehicles (cash only)<br />
Cars and station wagons $12.00 $12.50<br />
Vans, utilities, SUV (4-wheel drives), small trailers $24.00 $25.00<br />
(Max refuse dimensions: 2.5m long, 1m high, 1.5m wide)<br />
Note: Combinations of vehicles (vans, utilities, small trucks) and trailer<br />
will cost the sum of their respective charges.<br />
All Other Vehicles (per tonne) $95.25 $97.40<br />
Minimum Charge $47.62 $48.70<br />
Special Burials $131.25 $135.00<br />
Minimum Charge $65.62 $68.00<br />
Potentially Hazardous Wastes<br />
By negotiation, refer to the “<strong>Hutt</strong> <strong>City</strong> Landfill – Waste Disposal Guide”<br />
Car Bodies (per tonne) $95.25 $97.40<br />
Tyres<br />
Disposal of more than 4 tyres (per tonne) regardless of vehicle type $311.25 $320.00<br />
Minimum Charge $155.62 $160.00<br />
Refuse Bags including Govt Levy<br />
Plastic bags – packet of 5 $9.50 $9.70<br />
Plastic bags – packet of 10 $19.00 $19.40<br />
Plastic bags – packet of 50 $95.00 $97.00<br />
LIBRARIES<br />
From 1 Jul 2010 From 1 Oct 2010<br />
Interloans (non-urgent) per request $10.00 $10.00<br />
Interloans (urgent) At cost At cost<br />
Lost items Replacement cost plus $10<br />
processing fee on adult items<br />
Rental collections<br />
Vary according to format to a<br />
maximum of $10 per item<br />
Overdue charges<br />
Vary according to format from<br />
$0.20 to $2.00 per day to a<br />
maximum of $10.00 per item<br />
Replacement cost plus $10<br />
processing fee on adult items<br />
Vary according to format to a<br />
maximum of $10 per item<br />
Vary according to format from<br />
$0.20 to $2.00 per day to a<br />
maximum of $10.00 per item<br />
Borrower’s card replacement (per card) $2.00 $2.00<br />
Internet access and computer use $1.00 per half hour $1.00 per half hour<br />
From 1 Jul 2010 From 1 Oct 2010<br />
Minor Littering Infringement fee $100 Infringement fee $100<br />
Minor littering is defined as depositing in or on a public place or in or on private land without<br />
the consent of the occupier:<br />
Cigarette butts; Wrappers/paper; Chewing gum; Small food waste; Take-away food/drink<br />
containers; Fish & chip papers; Plastic drink bottle(s); and Aluminium can(s).<br />
Note: For cigarette butt littering, this is a two step enforcement process.<br />
First step: Educate/warning – offender advised this is not acceptable.<br />
Second step: If a person is found depositing cigarette butt litter having already been warned,<br />
an infringement fee of $100 will be issued.<br />
From 1 Jul 2010 From 1 Oct 2010<br />
Medium Littering Infringement fee $200 Infringement fee $200<br />
Medium littering is defined as depositing in or on a public place or in or on private land without<br />
the consent of the occupier:<br />
Single used disposable nappy or nappies; Small dumping (e.g. shopping bags) – domestic/<br />
commercial waste in, or by, public litter bins; Small dumping in or by commercial waste bins/<br />
clothing bins/recycling stations; Persistent use of unofficial (non-council) refuse bags; and small<br />
insecure load from truck or trailer.<br />
Note: Small dumping defined as up to four shopping bags or two refuse bags or single items.<br />
Small insecure load is defined as paper, single item, grass clippings, dust that has come off a<br />
truck or trailer.<br />
From 1 Jul 2010 From 1 Oct 2010<br />
Major Littering Infringement fee $400 Infringement fee $400<br />
Major littering is defined as depositing in or on a public place or in or on private land without<br />
the consent of the occupier:<br />
Household waste; Commercial waste; Green waste; Car parts; or any other litter as defined in<br />
the Litter Act 1997 not defined as a minor or medium littering above.<br />
Note: The Litter Act 1979 defines the depositing of glass or glass bottles (or broken glass<br />
or bottles) as a dangerous form of litter and thus considered by <strong>Council</strong> as a major littering<br />
offence. The decision whether to issue an infringement notice for major littering or to refer the<br />
matter to the District Court will be determined on a case by case basis, based on the severity<br />
and malicious intent of the alleged offence.
OFFICIAL INFORMATION<br />
From 1 Jul 2010 From 1 Oct 2010<br />
The following charges shall apply for requests made under the Local<br />
Government Official Information and Meetings Act 1987 (The ‘Act’):<br />
(a) If the request is made by an identifiable natural person seeking access to<br />
any personal information about that person then such requests are subject<br />
to the Privacy Act 1993 and these charges do not apply.<br />
(b) If the aggregate amount of staff time spent in actioning a request exceeds<br />
one hour then the basis of charging (except for the issue of Land<br />
Information Memoranda under section 44A of the Act) is as follows:<br />
• An initial charge for the first chargeable half hour or part thereof<br />
$30.00 $31.00<br />
including search, retrieval, provision of information and supervision<br />
• Each additional half hour or part thereof $38.00 $39.00<br />
(c) Photocopying on standard A4 where the total number of pages exceeds<br />
20 (the first 20 pages will be free).<br />
(d) All other charges incurred shall be fixed at an amount that recovers the<br />
actual costs involved. This will include:<br />
• Producing a document by computer or other like equipment<br />
• Reproducing a photograph, film, video or audio recording<br />
• Arranging for the applicant to hear or view an audio or visual recording<br />
• Providing a copy of any map, <strong>plan</strong> or other document larger than A4,<br />
retrieval of information off–site, or any situation in which a direct charge<br />
is incurred by the <strong>Council</strong> in providing the information<br />
• Where repeated requests are made from the same source in respect of<br />
a common subject in any eight-week period, requests after the first will<br />
be aggregated for charging purposes<br />
(e) A charge may be modified or waived at the discretion of a General<br />
Manager or the General Counsel where payment might cause the applicant<br />
financial hardship, or where remission or reduction of the charge would<br />
facilitate good relations with the public, or assist the section, group or<br />
organisation in its work.<br />
(f) The charge may not include any allowance for:<br />
• Information that is not where it ought to be<br />
• Time spent deciding whether or not access should be allowed and in<br />
what form (note that the actual physical editing of protected information<br />
is chargeable)<br />
(g) Charges shall be paid in advance of receipt of information.<br />
$0.20 per<br />
page<br />
$0.20 per<br />
page<br />
PARKING<br />
<strong>Council</strong> operates Pay & Display metered parking in the central business district (CBD) of<br />
Lower <strong>Hutt</strong>.<br />
The metered area is generally from Market Grove at the southern end of the CBD to Downer<br />
Street at the northern end, bounded by Cornwall Street and the Riverbank car park.<br />
Meter charges are structured into five tariff tiers HC1 to HC5.<br />
A small number of P15 and P60 spaces are provided, free from fees, throughout the metered<br />
area for additional public convenience.<br />
Mobility car parks are provided throughout the CBD, at the prevailing metered tariff.<br />
Saturday parking is free from fees within the CBD. Time restrictions (P120) apply on Saturday<br />
to the Red HC1 and Green HC2 parking zones.<br />
Sunday parking – No fee or time restrictions apply on Sunday.<br />
Hours of Meter Operation<br />
Pay & Display parking meters operate for the following hours:<br />
9:00am to 5:00pm Monday to Friday.<br />
<strong>Hutt</strong> <strong>City</strong> <strong>Council</strong> <strong>Annual</strong> Plan 2010-2011<br />
79
80<br />
Tariff Structure<br />
These tariffs will not change throughout the year and are not affected by the increase in GST<br />
Premium (Red HC1) Zone<br />
Shoppers (Green HC2) Zone<br />
Commuter (Yellow HC3) Zone<br />
Riverbank car park (Yellow HC4) Zone<br />
TheNewDowse car park (Yellow HC5) Zone<br />
$2 per hour increasing to $3 per hour for the 2nd hour<br />
2 hour maximum parking duration<br />
Monday to Friday 9am to 5pm<br />
Saturday P120 (no charge)<br />
Sunday and Public Holidays unrestricted<br />
$1.50 per hour<br />
2 hour maximum parking duration<br />
Monday to Friday 9am to 5pm<br />
Saturday P120 (no charge)<br />
Sunday and Public Holidays unrestricted<br />
$1 per hour<br />
$6 maximum daily charge<br />
No daily maximum parking duration<br />
Monday to Friday 9am to 5pm<br />
Saturday, Sunday and Public Holidays unrestricted<br />
70 cents per hour<br />
$4 maximum daily charge<br />
A monthly pass is available at $62 per month (reduced to $46 for<br />
December)<br />
No daily maximum parking duration<br />
Monday to Friday 9am to 5pm<br />
Saturday, Sunday and Public Holidays unrestricted<br />
$1.50 per hour<br />
4 hours maximum parking duration<br />
Monday to Friday 9am to 5pm<br />
Saturday, Sunday and Public Holidays unrestricted<br />
Other Charges<br />
<strong>Council</strong> Pay & Display machines support alternative payments from Mobile telephone Text, or<br />
Credit Cards. A 50 cent per transaction fee applies.<br />
<strong>Council</strong> supports the use of SmartPark in-car meters. <strong>Hutt</strong> <strong>City</strong> <strong>Council</strong> SmartPark stored<br />
value cards are available at <strong>Council</strong> Reception. A $8 media fee applies. $50 and $100<br />
denominations are available.<br />
Reserved spaces - $20 per day for short term applications.<br />
Construction and Temporary Traffic Management exemptions are site specific. Charges are<br />
assessed on a case by case basis.<br />
Parking Zones<br />
<strong>Council</strong> has adopted the following zone structure, effective from 1 July 2010. Small changes<br />
may be required throughout the year as the CBD continues to develop.<br />
Red Premium HC1 Zone<br />
• High Street – Laings Road to Waterloo Road portion<br />
• Queens Drive – Laings Road to Waterloo Road portion<br />
• Laings Road – High Street to Queens Drive portion<br />
• Bunny Street<br />
• Margaret Street<br />
• Waterloo Road - Queens Drive to High Street portion<br />
Green Shopper HC2 Zone<br />
• Stevens Grove parallel parks<br />
• Knights Road – Bunny Street to Laings Road portion<br />
• Queens Drive – Laings Road to Fraser Street portion<br />
• Fraser Street<br />
• High Street – Fraser Street to Laings Road portion<br />
• Ward Street<br />
• Market Grove north side<br />
• Knights Road south side – Bloomfield Terrace to Myrtle Street<br />
• Myrtle Street east side angle parking – Knights Road to Laings Road portion<br />
• Andrews Avenue<br />
• Dudley Street<br />
• Daly Street – Margaret Street to Andrews Avenue<br />
• Rutherford Street, south end<br />
• High Street – Waterloo Road to Downer Street<br />
• Cornwall Street – Pretoria Street to Kings Crescent<br />
• Cornwall Street west side – Waterloo Road to Kings Crescent<br />
• Pretoria Street, west end within CBD<br />
• Raroa Road – east of Cornwall Street<br />
• Kings Crescent - Cornwall Street to Queens Drive<br />
• Osborne Place<br />
• Queens Drive – Kings Crescent to Waterloo Road<br />
• Waterloo Road – Bloomfield Terrace to Queens Drive<br />
• Bloomfield Terrace – Kings Crescent to Knights Road<br />
• Pavilion car park<br />
• Laings Road – Queens Drive to Myrtle Street
Yellow Commuter HC3 Zone<br />
• Fountain car park (Laings Road)<br />
• Myrtle Street west side – Laings Road to Knights Road<br />
• Stevens Grove angle parking portion<br />
• Rutherford Street, south of Queens Drive<br />
• Raroa Road – High Street to Cornwall Street<br />
• Cornwall Street east side – Kings Crescent to Waterloo Road<br />
• Cornwall Street – Waterloo Road to Knights Road<br />
• Knights Road – Cornwall Street to Bloomfield Terrace<br />
• Knights Road north side – Myrtle Street to Bloomfield Terrace<br />
• Market Grove south side<br />
Yellow Riverbank HC4 Zone<br />
• Riverbank car park<br />
• Myrtle Street – west side only, Laings Road to Huia Street<br />
Yellow NewDowse Civic HC5 Zone<br />
• Part of TheNewDowse Gallery car park<br />
Residents Parking Schemes<br />
<strong>Council</strong> does not currently support any Residents Parking Scheme.<br />
Penalties<br />
<strong>Council</strong> sets the penalties in accordance with the maximum permitted in the Transport Act.<br />
Metered Parking<br />
Failure to display a valid Pay & Display Ticket $40<br />
Overstaying, where the excess time is:<br />
More than 30 minutes $12<br />
More than 1 hour $15<br />
More than 2 hours $30<br />
More than 4 hours $42<br />
More than 6 hours $57<br />
Parking on a Mobility car park, without displaying a valid Mobility Pass card $150<br />
RECYCLING<br />
From 1 Jul 2010 From 1 Oct 2010<br />
Replacement recycling containers $10.00 $10.00<br />
ROADING<br />
Subdivision Inspection and Approval Charges<br />
From 1 Jul 2010 From 1 Oct 2010<br />
Boundary adjustment $132.30 $132.30<br />
Additional lots/unit titles - 3.43% of total construction cost for one new lot<br />
reducing by 0.07% for each additional lot to 0.7% for 40 or more additional<br />
lots. This is the minimum fee irrespective of whether any construction work is<br />
necessary. $132.30 $132.30<br />
Motor Crossing Charges<br />
From 1 Jul 2010 From 1 Oct 2010<br />
Standard<br />
Fee<br />
Admin/<br />
Inspection<br />
Standard<br />
Fee<br />
Admin/<br />
Inspection<br />
Concrete dished crossing/m 2 $130.00 $72.00 $130.00 $72.00<br />
Extensions to existing concrete crossings/m 2 $130.00 $72.00 $130.00 $72.00<br />
Installation of concrete dished crossing in<br />
conjunction with road reconstruction work/m 2 $65.00 $72.00 $65.00 $72.00<br />
Concrete block crossing/Pipe crossing/‘Slot’<br />
type crossing/m 2 $130.00 $72.00 $130.00 $72.00<br />
Deposit for privately installed crossing<br />
($200 refunded upon satisfactory completion<br />
of crossing) $272.00 $272.00<br />
Trench Inspection Fees<br />
Proposals, administration and monitoring on time basis: From 1 Jul 2010 From 1 Oct 2010<br />
Engineer (per hour) $115.00 $118.00<br />
Inspector (per hour) $100.00 $102.00<br />
SPORTSFIELDS AND PARKS<br />
Season Charges<br />
Set to recover the percentage of operating cost identified below plus the full operating cost of<br />
ancillary services:<br />
Recovery Rates Percentage Level 1 Level 2 Level 3 Children Training/Winter<br />
Sports 30 20 10 5 5<br />
Cricket/Croquet 25 15 10 5 N/A<br />
<strong>Hutt</strong> <strong>City</strong> <strong>Council</strong> <strong>Annual</strong> Plan 2010-2011<br />
81
One-off or Single Day Hire<br />
Charged at 10% of the season charge per game or where the game lasts three hours or<br />
longer, 15% of the season charge per day.<br />
Special Charges From 1 Jul 2010 From 1 Oct 2010<br />
Events and commercial operators By quotation By quotation<br />
Picnic bookings (30 or more people) $30.00 $30.00<br />
Filming per hour $100.00 $100.00<br />
Marquees for picnics/promotions $100.00 $100.00<br />
Weddings $100.00 $100.00<br />
Hire of rooms, social facilities, training fields etc. By quotation By quotation<br />
Note: Bookings for the season will take priority over casual bookings<br />
STADIA<br />
Walter Nash Stadium From 1 Jul 2010 From 1 Oct 2010<br />
One Court (per hour) $73.00 $75.00<br />
Two Courts (per hour) $124.00 $127.00<br />
Function Room (per hour) $22.50 $23.00<br />
Note: These are maximum charges.<br />
These charges include:<br />
All permanent seating<br />
Set up of courts (i.e. hoops)<br />
Clocks/Scoreboards<br />
Changing rooms and showers<br />
STORMWATER<br />
From 1 Jul 2010 From 1 Oct 2010<br />
Stormwater connection fee $30.00 $31.00<br />
SWIMMING POOLS<br />
Indoor Pools (Huia, Naenae, Stokes Valley)<br />
Casual Rates<br />
From 1 Jul 2010 From 1 Oct 2010<br />
Adult $4.50 $4.50<br />
Child $3.00 $3.00<br />
Over 60s $3.00 $3.00<br />
Spectator (non-supervising adult) $1.50 $1.50<br />
Family pass (2 adults/4 children) $12.00 $12.50<br />
Concession Rates<br />
Adult 10 swim $38.50 $39.50<br />
Adult 30 swim $94.50 $96.60<br />
Child & over 60s 10 swim $25.50 $26.10<br />
Child & over 60s 30 swim $63.00 $64.50<br />
Pool Hire<br />
Regular Hire (25 metres per hour) $60.00 $60.00<br />
Casual hire (25 metres per hour) $85.00 $87.00<br />
Regular hire (50 metres per hour) – Naenae Pool $125.00 $125.00<br />
Casual Hire (50 metres per hour) – Naenae Pool $180.00 $184.00<br />
Lane charge (per hour) $17.00 $18.00<br />
School Groups<br />
Group hire for Lessons (per head) $1.00 $1.00<br />
Meeting Rooms<br />
Casual hire (per hour) $20.00 $20.00<br />
Outdoor Pools (Eastbourne, McKenzie, Wainuiomata)<br />
Casual Rates<br />
Adult $4.00 $4.00<br />
Child $2.50 $2.50<br />
Over 60s $2.50 $2.50<br />
Spectators (non-supervising adult) $1.50 $1.50<br />
Family pass (2 adults/4 children) $10.00 $10.50<br />
82
From 1 Jul 2010 From 1 Oct 2010<br />
Concession Rates<br />
Adult 10 swim $34.00 $35.00<br />
Adult 30 swim $84.00 $86.10<br />
Child & over 60s 10 swim $21.50 $22.00<br />
Child & over 60s 30 swim $52.50 $54.00<br />
Pool Hire<br />
Regular hire (25 metres per hour) $40.00 $40.00<br />
Casual hire (25 metres per hour) $58.00 $60.00<br />
Regular hire (50 metres per hour) – Wainuiomata Pool $55.00 $55.00<br />
Casual hire (50 metres per hour) – Wainuiomata Pool $120.00 $122.00<br />
Wainuiomata Lounge Hire<br />
Casual hire (per hour) $20.00 $20.00<br />
WASTEWATER<br />
From 1 Jul 2010 From 1 Oct 2010<br />
Wastewater connection fee $30.00 $31.00<br />
WATER<br />
From 1 Jul 2010 From 1 Oct 2010<br />
Upper Belmont Development Levy (per lot) $5,925.00 $6,057.00<br />
Water connection fee $75.00 $77.00<br />
Fee for use of water by builders on unmetered<br />
industrial and commercial sites $65.00 $66.00<br />
Charge for Ordinary Supply Class 2 Water<br />
Minimum charge UAC UAC<br />
Domestic water meter rental $60.00 $61.00<br />
Normal users per cubic metre<br />
Up to 100,000 cubic metres $1.41 $1.44<br />
In excess of 100,000 cubic metres $1.08 $1.10<br />
Water supplied by hydrant<br />
Per cubic metre $1.41 $1.44<br />
Minimum charge $25.00 $26.00<br />
Back flow prevention – annual inspection charge $150.00 $153.00<br />
Trade Waste Class From 1 Jul 2010 From 1 Oct 2010<br />
Consent Fees Consent + $200<br />
if conditional<br />
consent<br />
required<br />
Consent Fees Consent + $200<br />
if conditional<br />
consent<br />
required<br />
Class 1: High Risk $1,640.00 $1,880.00 $1,640.00 $1,880.00<br />
Class 2: Moderate Risk $825.00 $1,065.00 $825.00 $1,065.00<br />
Class 3: Low Risk $420.00 $660.00 $420.00 $660.00<br />
Class 4: Minimal Risk $170.00 $410.00 $170.00 $410.00<br />
Class 5: Minimal Risk Low Flow $85.00 N/A $85.00 N/A<br />
Application Fees $82.00 $82.00<br />
Re-inspection Fees $82.00 $82.00<br />
Trade Waste User Charges<br />
From 1 Jul 2010 From 1 Oct 2010<br />
Flow (per cubic metre) $0.420 per m 3 $0.4293 per m 3<br />
Total Suspended Solids $0.590 per kg $0.6031 per kg<br />
COD (Chemical Oxygen Demand) $0.240 per kg $0.2453 per kg<br />
<strong>Hutt</strong> <strong>City</strong> <strong>Council</strong> <strong>Annual</strong> Plan 2010-2011<br />
83
Contact Details<br />
Q1<br />
<strong>Council</strong> staff outside TheNewDowse
HUTT CITY COUNCIL<br />
Address: Administration Building, 30 Laings Road,<br />
Lower <strong>Hutt</strong><br />
Postal Address: Private Bag 31 912, Lower <strong>Hutt</strong> 5040<br />
Telephone: (04) 570 6666<br />
0800 HUTT CITY<br />
After Hours<br />
Emergencies: (04) 570 6666 and<br />
press 1 for emergency<br />
InfoLine: (04) 570 6660<br />
Facsimile: (04) 569 4290<br />
Email: contact@huttcity.govt.nz<br />
Website: www.huttcity.govt.nz<br />
War Memorial Library<br />
Address: Cnr Queens Drive & Woburn Road,<br />
Lower <strong>Hutt</strong><br />
Telephone: (04) 570 6633<br />
Petone Community Library<br />
Address: Britannia Street, Petone<br />
Telephone: (04) 568 6253<br />
Eastbourne Community Library<br />
Address: Rimu Street, Eastbourne<br />
Telephone: (04) 562 8042<br />
Stokes Valley Community Library<br />
Address: Scott Court, Stokes Valley<br />
Telephone: (04) 562 9050<br />
Moera Community Library<br />
Address: Cnr Randwick Road & Randwick Crescent,<br />
Moera<br />
Telephone: (04) 568 4720<br />
Taita Community Library<br />
Address: Taine Street, Taita<br />
Telephone: (04) 567 2767<br />
Naenae Community Library<br />
Address: Hillary Court, Naenae<br />
Telephone: (04) 567 2859<br />
Wainuiomata Community Library<br />
Address: Queen Street, Wainuiomata<br />
Telephone: (04) 564 5822<br />
<strong>Hutt</strong> <strong>City</strong> <strong>Council</strong> <strong>Annual</strong> Plan 2010-2011<br />
85
Mayor and <strong>Council</strong>lors<br />
Mayor David Ogden CA, JP (OCOF)<br />
Mayor<br />
T: 570 6932 (business)<br />
E: david.ogden@huttcity.govt.nz<br />
Central Ward <strong>Council</strong>lors<br />
<strong>Council</strong>lor David Bassett JP (I)<br />
T: 566 4929 (private)<br />
F: 566 4999 (private)<br />
M: 021 135 9391<br />
E: david.bassett@huttcity.govt.nz<br />
<strong>Council</strong>lor Deborah Hislop (I)<br />
T: 567 0567 (private)<br />
M: 027 457 0567<br />
E: deborah.hislop@huttcity.govt.nz<br />
Eastern Ward <strong>Council</strong>lors<br />
<strong>Council</strong>lor Roger Styles (OCOF)<br />
Deputy Mayor<br />
T: 934 3270 (private)<br />
F: 934 3271 (private)<br />
M: 027 480 0072<br />
E: roger.styles@huttcity.govt.nz<br />
<strong>Council</strong>lor Barbara Branch (OCOF)<br />
T: 565 3303 (private)<br />
E: barbara.branch@huttcity.govt.nz<br />
Harbour Ward <strong>Council</strong>lors<br />
<strong>Council</strong>lor Joy Baird JP (I)<br />
T: 568 3225 (private)<br />
F: 569 3350 (private)<br />
M: 027 430 0737<br />
E: joy.baird@huttcity.govt.nz<br />
<strong>Council</strong>lor Ross Jamieson JP (I)<br />
T: 562 7231 (private/business)<br />
F: 562 7231 (private/business)<br />
M: 027 442 7319<br />
E: ross.jamieson@huttcity.govt.nz<br />
86<br />
Key:<br />
(I) Independent<br />
(OCOF) Our <strong>City</strong> Our Future<br />
(TRW) Team Ray Wallace
Northern Ward <strong>Council</strong>lors<br />
<strong>Council</strong>lor Angus Finlayson QSM, JP (I)<br />
T: 566 5046 (private)<br />
F: 566 2082 (private)<br />
M: 027 445 3035<br />
E: angus.finlayson@huttcity.govt.nz<br />
<strong>Council</strong>lor Gwen McDonald<br />
T: 563 7212 (private)<br />
F: 563 6664 (private)<br />
563 7212 (business)<br />
M: 027 454 0546<br />
E: gwen.mcdonald@huttcity.govt.nz<br />
Wainuiomata Ward <strong>Council</strong>lors<br />
<strong>Council</strong>lor Randall Day (TRW)<br />
T: 564 2411 (private)<br />
F: 564 2411 (private)<br />
E: randall.day@huttcity.govt.nz<br />
<strong>Council</strong>lor Ray Wallace JP (TRW)<br />
T: 564 8880 (private)<br />
F: 564 8880 (private)<br />
M: 027 226 4046 (private/business)<br />
E: ray.wallace@huttcity.govt.nz<br />
Western Ward <strong>Council</strong>lors<br />
<strong>Council</strong>lor Margaret Cousins JP (I)<br />
T: 586 2135 (private)<br />
F: 586 1046 (private)<br />
E: margaret.cousins@huttcity.govt.nz<br />
<strong>Council</strong>lor Max Shierlaw (OCOF)<br />
T: 589 3669 (private)<br />
M: 027 260 6852<br />
E: max.shierlaw@huttcity.govt.nz<br />
<strong>Hutt</strong> <strong>City</strong> <strong>Council</strong> <strong>Annual</strong> Plan 2010-2011<br />
Key:<br />
(I) Independent<br />
(OCOF) Our <strong>City</strong> Our Future<br />
(TRW) Team Ray Wallace<br />
87
Community Board and Community Committee Members<br />
Eastbourne Community Board<br />
Ian Young (Chair): 562 8622<br />
Derek Wilshere (Deputy Chair): 562 7920<br />
Sarah Crawford:<br />
sarah.crawford@huttcity.govt.nz<br />
Murray Gibbons: 562 8567<br />
Geoff Rashbrooke: 568 4988<br />
Petone Community Board<br />
Gerald Davidson (Chair): 938 3723<br />
Michael Lulich (Deputy Chair): 977 3166<br />
Mason Branch: 569 1270<br />
Richard Cole: 586 1113<br />
Vera Ellen: 938 1946<br />
Central/West Community Committee<br />
Christopher Milne (Chair): 586 3890<br />
Desiree Mulligan (Deputy Chair): 938 9525<br />
Kathryn Fitzpatrick: 586 6075<br />
Sue Lafrentz: 567 0856<br />
Rick Mooney: 586 1895<br />
North/East Community Committee<br />
Leigh Sutton (Chair): 563 5184<br />
Ted Heslin (Deputy Chair): 567 7753<br />
Michael Ellis: 577 3877<br />
Julie Englebretsen: 563 5179<br />
Wainuiomata Community Board<br />
Margaret Willard (Chair): 973 1378<br />
Terry Stallworth (Deputy Chair): 564 9081<br />
Jim Manu: 564 7366<br />
Marcia Ngarimu: 564 7706<br />
Tracey Pollard: 564 3021<br />
Kevin Small: 564 6841<br />
88
Strategic Leadership Team<br />
Tony Stallinger, Chief Executive<br />
DDI: 570 6773<br />
E: tony.stallinger@huttcity.govt.nz<br />
Joycelyn Foo, General Counsel<br />
DDI: 570 6736<br />
E: joycelyn.foo@huttcity.govt.nz<br />
Marty Grenfell, General Manager Community Services<br />
DDI: 570 6878<br />
E: marty.grenfell@huttcity.govt.nz<br />
Claire Johnstone, General Manager Business Services<br />
DDI: 570 6781<br />
E: claire.johnstone@huttcity.govt.nz<br />
Kim Kelly, General Manager Development Services<br />
DDI: 570 6949<br />
E: kim.kelly@huttcity.govt.nz<br />
Bruce Sherlock, General Manager <strong>City</strong> Infrastructure<br />
DDI: 570 6833<br />
E: bruce.sherlock@huttcity.govt.nz<br />
<strong>Hutt</strong> <strong>City</strong> <strong>Council</strong> <strong>Annual</strong> Plan 2010-2011<br />
89