Nu Skin 2010 Annual Report - Direct Selling News
Nu Skin 2010 Annual Report - Direct Selling News
Nu Skin 2010 Annual Report - Direct Selling News

Create successful ePaper yourself
Turn your PDF publications into a flip-book with our unique Google optimized e-Paper software.
NU SKIN ANNUAL REPORT <strong>2010</strong><br />
ELEVATE
ELEVATE<br />
TO A HIGHER<br />
PLACE<br />
[el-uh-veyt] – verb To raise to a<br />
higher state. To move to a higher<br />
place. To raise the intensity.
35,676<br />
32,939<br />
30,588<br />
30,002<br />
2007 2008 2009 <strong>2010</strong><br />
Executive<br />
Distributor<br />
Growth<br />
2
ELEVATE<br />
With three consecutive years of record breaking revenue<br />
we’re climbing to greater heights in virtually every aspect<br />
of our business with our sights keenly focused on reaching our<br />
goal of becoming the world’s leading direct selling company.<br />
Even as many areas within the global economy continued to struggle to<br />
regain their footing, we continued to elevate our performance in <strong>2010</strong>. As<br />
we anticipated, we met or exceeded virtually all of our operational targets,<br />
which led to exceptional annual results:<br />
• Generated $1.54 billion in revenue, a 15 percent improvement over the prior year;<br />
• Improved our operating margin by 300 basis points, or 220 basis points excluding<br />
restructuring in the prior year to 14.1 percent of revenue;<br />
• Generated earnings per share of $2.11 compared to $1.40 or $1.51 excluding<br />
restructuring in the prior year;<br />
• Increased the number of executive distributors by 8 percent;<br />
• Posted our first ever $400 million revenue quarter in the fourth quarter of <strong>2010</strong>;<br />
• Improved our cash position by $72 million to $230 million while paying<br />
$37 million in debt and repurchasing $59 million of company stock;<br />
• Increased dividend distributions for the enviable tenth consecutive year, paying<br />
more than $30 million in dividends, the equivalent of $0.50 per share.<br />
3
BUILDING FOR THE FUTURE<br />
In 2011, we will also break ground<br />
on the <strong>Nu</strong> <strong>Skin</strong> Enterprises Global<br />
Innovation Center. This $85<br />
million facility will significantly<br />
expand our corporate presence, but<br />
more importantly will give us a<br />
platform to continue to innovate both<br />
within our product lines as well as<br />
within our direct sales business<br />
model. We believe <strong>Nu</strong> <strong>Skin</strong> is known<br />
as the most innovative company<br />
in direct selling. We intend to<br />
maintain that reputation.<br />
As good as these results are, the true measure of our success is found in the positive<br />
impact we are having on the lives of people around the world. In <strong>2010</strong>, an incredible<br />
number of people chose to join our distributor ranks to help them achieve their personal<br />
and professional goals. With an innovative product portfolio, generous compensation<br />
plan, and devoted and talented distributor leadership, we were able to help more people<br />
grow their businesses as demonstrated by solid growth in both active and executivelevel<br />
distributors and a record-level payout of sales commissions—nearly $650 million.<br />
We are proud of the incredibly impressive group of people who comprise the<br />
<strong>Nu</strong> <strong>Skin</strong> family globally. Not only did we elevate our level of financial success,<br />
but our collective force for good culture helped us to reach another important<br />
milestone—donating more than 200 million meals to malnourished children<br />
through our Nourish the Children initiative.<br />
Equally inspiring was the way our global family came together in the aftermath of<br />
the recent earthquake, tsunami and nuclear crisis that have caused havoc in areas<br />
of Japan, our largest market. Our thoughts immediately turned to the safety and<br />
well being of the tens of thousands of loyal <strong>Nu</strong> <strong>Skin</strong> Japan distributors, employees<br />
and customers. Our worldwide distributors and employees quickly rallied together<br />
to offer relief to those in Japan valiantly confronting unforeseeable hardships. Given<br />
our history in Japan, understanding of the culture, and resiliency of our Japanese<br />
distributor leaders, we have no doubt that the people of the land of the rising sun<br />
will successfully tackle these challenges and emerge even stronger.<br />
KEYS TO ELEVATING GROWTH<br />
With a great run over the last few years, some may wonder whether <strong>Nu</strong> <strong>Skin</strong> can<br />
sustain growth and if we have what it takes to continue to elevate our results<br />
To answer this question—yes we can, and yes we will!<br />
We have established a solid financial foundation and a culture of innovation<br />
that will continue to provide ample ammunition to help us sustain our<br />
growth over the next decade. In 2011, we’ll build on our success by focusing<br />
on six key factors that will help elevate our business.<br />
GROWTH<br />
1<br />
Favorable Market Trends<br />
We continue to leverage the socio-economic and industry trends that are driving<br />
people toward anti-aging and home-based businesses. For example, take the<br />
appeal of the direct selling channel. According to the World Federation of direct<br />
<strong>Selling</strong> Associations (WFDSA), nearly 65 million people worldwide are participating<br />
in direct selling, generating more than $114 billion in sales.<br />
Over the past 8 years, the direct sales channel has grown a solid 5 percent. <strong>Nu</strong> <strong>Skin</strong><br />
has a strong presence in the largest direct selling markets of the United States,<br />
Japan and Mainland China and continues to attract the best of the best to its direct<br />
selling business opportunity.<br />
Another global trend that bodes well for <strong>Nu</strong> <strong>Skin</strong> is the aging demographic and the<br />
expanding anti-aging market. Expected to be the next trillion-dollar industry, the<br />
anti-aging market continues to grow at a remarkable pace. This is understandable<br />
when you consider that by 2025 there will be an estimated 832 million people over<br />
the age of 65, representing 10.4 percent of the world’s population.* People may not<br />
mind getting old, but they do mind looking and living old. Our products and business<br />
opportunity are targeted to address this large and rapidly growing market.<br />
(footnote: *According to statistics from the United Nations Population Division.)<br />
4
In <strong>2010</strong>, <strong>Nu</strong> <strong>Skin</strong> reported<br />
annual revenue of $1.54<br />
billion, marking the third<br />
consecutive year of record<br />
revenue.<br />
$1.16B<br />
2007<br />
$1.12B<br />
2006<br />
$1.25B<br />
2008<br />
$1.54B<br />
<strong>2010</strong><br />
$1.33B<br />
2009<br />
5<br />
5
$163M<br />
AGELOC GALVANIC<br />
SPA AND GELS<br />
$210M<br />
AGELOC<br />
TRANSFORMATION<br />
PRODUCTS<br />
$37M<br />
AGELOC<br />
VITALITY<br />
<strong>2010</strong><br />
ageLOC<br />
sales<br />
6
2<br />
AN INNOVATIVE AND EXCLU-<br />
SIVE ANTI-AGING PORTFOLIO<br />
The second factor contributing<br />
to our continued success is our<br />
innovative anti-aging product<br />
pipeline. We continue to believe,<br />
and science continues<br />
to confirm, that the future of<br />
anti-aging technologies lies<br />
within the human genome.<br />
Based on decades of science,<br />
we are elevating anti-aging<br />
technology by targeting the<br />
sources of aging. Our proprietary<br />
ability to identify, target<br />
and reset groups of agerelated<br />
genes to more youthful<br />
activity levels continues to be<br />
well received in the marketplace,<br />
and is consistently<br />
validated scientifically.<br />
During <strong>2010</strong>, our scientists<br />
were invited to give more than<br />
20 presentations at 11 different<br />
academic conferences around<br />
the world. These presentations<br />
discussed the genetic<br />
basis of aging and the identification<br />
of nutritional interventions<br />
that target aging at its<br />
source and promote healthy<br />
life span. We are in the very<br />
early days of scientific discoveries<br />
on this front, and will<br />
continue to broaden our reach<br />
in taking this message to<br />
Targeting aging at its<br />
source.<br />
consumers around the world.<br />
In <strong>2010</strong>, we provided a glimpse<br />
of ageLOC’s potential with<br />
the highly successful global<br />
rollout of the ageLOC Transformation<br />
skin care system.<br />
The Transformation System<br />
generated about $210 million<br />
of revenue in <strong>2010</strong>—a remarkable<br />
number for the first year<br />
of sales. Add to this the sales<br />
from the Galvanic Spa and<br />
related gels and <strong>2010</strong> ageLOC<br />
skin care revenue was approximately<br />
$410 million, or<br />
27 percent of our total annual<br />
revenue. We are pleased with<br />
these initial ageLOC results<br />
and believe it reflects the<br />
great market demand that is<br />
possible for our ageLOC antiaging<br />
portfolio.<br />
In 2011, we are infusing<br />
ageLOC science into our nutritional<br />
product offering. We<br />
have a solid base to work from<br />
when it comes to nutrition,<br />
with more than 40 percent of<br />
our revenue coming from our<br />
Pharmanex ® nutrition line.<br />
In the fourth quarter of <strong>2010</strong>,<br />
sales of our flagship nutrition<br />
product LifePak ® increased 6<br />
percent, despite the fact that<br />
the bright lights have really<br />
been focused on the skin care<br />
side of our business. In the<br />
latter half of the year, we took<br />
ageLOC ‘inside’ with the introduction<br />
of ageLOC Vitality in<br />
the United States and Japan,<br />
and in the fall of this year we<br />
will initiate the global launch<br />
of a new blockbuster supplement<br />
that features ageLOC science<br />
and proven anti-aging benefits.<br />
We are optimistic that<br />
the introduction of ageLOC<br />
into our Pharmanex product<br />
line will enable us to sustain<br />
growth in 2011.<br />
INNOVATE<br />
A REVOLUTIONARY<br />
DISCOVERY<br />
With exclusive access to 30<br />
years of genetic anti-aging<br />
research, <strong>Nu</strong> <strong>Skin</strong>’s scientific<br />
team has identified key<br />
groups of age-related genes<br />
called Youth Gene Clusters<br />
that influence how we age.<br />
<strong>Nu</strong> <strong>Skin</strong>’s proprietary ageLOC ®<br />
science identifies, targets,<br />
and resets these Youth Gene<br />
Clusters to a more youthful<br />
gene expression pattern.<br />
7
8 8
OPPORTUNITY<br />
3<br />
4<br />
THE CONVERSION OF<br />
INNOVATION INTO REVENUE<br />
The third factor weighing<br />
in our favor is our ability to<br />
convert innovation to revenue.<br />
We are spending considerable<br />
time and management attention<br />
to refine the manner in<br />
which we launch new products.<br />
We want to maximize<br />
the impact of new products,<br />
while minimizing sales cannibalization<br />
of existing products.<br />
We have made significant<br />
strides in this regard as we<br />
refine best practices from<br />
around the world in outstanding<br />
markets like South Korea<br />
and Southeast Asia. Not only<br />
is our ability to convert innovation<br />
to revenue evident in the<br />
strong sales of ageLOC products,<br />
but also in our increasingly<br />
compelling business<br />
opportunity. We are continually<br />
infusing innovative features<br />
into the business opportunity<br />
to help generate distributor<br />
success and keep the opportunity<br />
highly attractive. In <strong>2010</strong>,<br />
we saw an 8 percent increase<br />
in the number of executive<br />
level distributors, and a 5 percent<br />
increase in the number<br />
of active distributors. <strong>Nu</strong> <strong>Skin</strong><br />
sales leaders are the envy of<br />
the direct selling world. These<br />
highly capable and motivating<br />
leaders give us great confidence<br />
in the future.<br />
A HEALTHY GLOBAL<br />
REVENUE MIX<br />
Just a few years ago, Japan<br />
represented over 60 percent<br />
of our global sales mix. Today<br />
Japan represents 30 percent<br />
of global revenue. Our revenue<br />
mix is much more diverse than<br />
it has ever been, leaving us<br />
less dependent on any single<br />
market. Emerging markets<br />
in particular are becoming a<br />
much more significant component<br />
of our business. We are<br />
enjoying particularly robust<br />
growth in Greater China and<br />
Southeast Asia—two regions<br />
with great potential and a<br />
population that has a strong<br />
desire for entrepreneurial<br />
opportunities. In <strong>2010</strong>, The<br />
South Asia/Pacific region<br />
grew by more than 50 percent,<br />
with Thailand and Malaysia<br />
accounting for more than<br />
half of regional sales. And we<br />
continue to be very optimistic<br />
about our potential in Greater<br />
China. The crouching tiger in<br />
Mainland China is springing<br />
forward at a tremendous pace.<br />
In <strong>2010</strong>, the region accounted<br />
for 17 percent of our global<br />
revenue. By 2015, we expect<br />
the region to represent 20<br />
percent of global sales.<br />
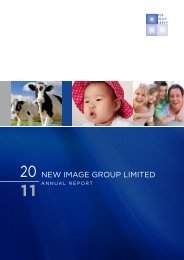
LOOK, FEEL, AND LIVE YOUNGER<br />
Amy Yip, pictured here with her son, is 50 years young. She uses ageLOC products<br />
for their anti-aging benefits and to help build her <strong>Nu</strong> <strong>Skin</strong> business. Prior to becoming<br />
a distributor, Yip and her husband had distinguished careers in investment banking.<br />
“Our <strong>Nu</strong> <strong>Skin</strong> business enables us to have a wholesome and complete life with better<br />
health, the flexibility to enjoy our lives and financial freedom.”<br />
9
5<br />
INCREASING OPERATIONAL<br />
EFFICIENCIES<br />
The fifth factor positively<br />
impacting our business is our<br />
continued efforts to increase<br />
operational efficiency. In 2006,<br />
our operating margin stood at<br />
4.9 percent, or 7.8 percent<br />
excluding restructuring. We<br />
have made steady progress<br />
over the past few years in<br />
improving profitability. In <strong>2010</strong>,<br />
our operating margin improved<br />
to 14.1 percent. We expect to<br />
make continued improvement<br />
of at least another 30 to 50 basis<br />
points in operating margin this<br />
year. In the mid-term, we<br />
believe we can sustain an<br />
operating margin better than<br />
16 percent as we continue to<br />
leverage revenue growth.<br />
11.9% * 14.1%<br />
7.8% * 10.1%<br />
10<br />
2007 2008 2009 <strong>2010</strong><br />
Operating<br />
Margin
EFFICIENCY<br />
11
* GAAP RECONCILATION TABLE 2007 2009 <strong>2010</strong><br />
OPERATING MARGIN................................................................................................... 6.1% 11.1% 14.1%<br />
PERCENTAGE IMPACT OF RESTRUCTURING ............................................................ 1.7% 0.8% —<br />
OPERATING MARGIN EXCLUDING RESTRUCTURING CHARGES ............................. 7.6% 11.9% 14.1%<br />
EARNINGS PER SHARE ............................................................................................$0.67 $1.40 $2.11<br />
IMPACT OF RESTRUCTURING ..................................................................................$0.17 $0.11 —<br />
EARNINGS PER SHARE EXCLUDING RESTRUCTURING CHARGES ......................$0.84 $1.51 $2.11<br />
12
6<br />
ELEVATING AND<br />
ALIGNING MANAGEMENT<br />
PERFORMANCE<br />
This leads to a final factor that<br />
we would cite in support of<br />
our plan to elevate our revenue<br />
and earnings. In 2007,<br />
we initiated a performancebased<br />
incentive plan that had<br />
jumbo-option grants vest on<br />
the achievement of $1.50 and<br />
then $2.00 of EPS. When these<br />
options were issued, we were<br />
coming off an EPS level of<br />
about $0.75, so the $2.00 goal<br />
seemed like a bit of a stretch.<br />
But our team rallied around<br />
the objective and achieved<br />
the $2.00 EPS level two years<br />
ahead of plan, proving that for<br />
us, performance incentives<br />
work. Recently, our Board<br />
of <strong>Direct</strong>ors approved a new<br />
management performancebased<br />
incentive to a broader<br />
group of managers that will<br />
have similar equity incentives<br />
vest at $3.00, $3.50 and $4.00<br />
of EPS, achieved by the year<br />
2015. So, our sights are set on<br />
a new target. We have a plan<br />
in place to achieve that goal.<br />
We feel it’s realistic, and our<br />
team is enthusiastically going<br />
about executing our plan.<br />
ALIGNMENT<br />
LAUNCH PROCESS<br />
<strong>Nu</strong> <strong>Skin</strong>’s unique product launch process focuses on<br />
increasing global synergy around condensed product<br />
launch schedules. This enables our distributors to<br />
work from the same blueprint, allowing for increased<br />
alignment, productivity, and momentum.<br />
13
Can we sustain growth? Yes we can. We have the tools and commitment we<br />
need to continue to elevate our business. Our global management team is<br />
energized and aligned around our key growth drivers.<br />
As we move closer to achieving our goal of becoming the leading direct<br />
selling company in the world, we draw great strength from the global family<br />
of <strong>Nu</strong> <strong>Skin</strong> distributors and employees who are improving their lives and<br />
the lives of others through our innovative products, our rewarding business<br />
opportunity and an enriching and uplifting culture.<br />
It’s a great time to be with <strong>Nu</strong> <strong>Skin</strong>. As we continually elevate our business,<br />
the future looks brighter than ever.<br />
Sincerely,<br />
Blake M. Roney Steven J. Lund Truman Hunt<br />
CHAIRMAN<br />
NU SKIN ENTERPRISES<br />
VICE CHAIRMAN<br />
NU SKIN ENTERPRISES<br />
PRESIDENT, CEO<br />
NU SKIN ENTERPRISES
ANNUAL REPORT ON FORM 10-K
UNITED STATES<br />
SECURITIES AND EXCHANGE COMMISSION<br />
Washington, D.C. 20549<br />
FORM 10-K<br />
(Mark One)<br />
ANNUAL REPORT PURSUANT TO SECTION 13 OR 15(D) OF THE SECURITIES<br />
EXCHANGE ACT OF 1934. FOR THE FISCAL YEAR ENDED DECEMBER 31, <strong>2010</strong><br />
<br />
OR<br />
TRANSITION REPORT PURSUANT TO SECTION 13 OR 15(D) OF THE SECURITIES<br />
EXCHANGE ACT OF 1934.<br />
Commission file number: 001-12421<br />
Delaware<br />
(State or other jurisdiction<br />
of incorporation or<br />
organization)<br />
NU SKIN ENTERPRISES, INC.<br />
(Exact name of registrant as specified in its charter)<br />
75 WEST CENTER STREET<br />
PROVO UT 84601<br />
(Address of principal executive offices, including zip code)<br />
87-0565309<br />
(IRS Employer<br />
Identification No.)<br />
Registrant’s telephone number, including area code: (801) 345-1000<br />
Securities registered pursuant to Section 12(b) of the Act:<br />
Title of each class<br />
Class A common stock, $.001 par value<br />
Name of exchange on which registered<br />
New York Stock Exchange<br />
Securities registered pursuant to Section 12(g) of the Act: None<br />
Indicate by check mark if the registrant is a well-known seasoned issuer, as defined in Rule 405 of the<br />
Securities Act. Yes No <br />
Indicate by check mark if the registrant is not required to file reports pursuant to Section 13 or Section<br />
15(d) of the Act. Yes No <br />
Indicate by check mark whether the Registrant: (1) has filed all reports required to be filed by Section 13<br />
or 15(d) of the Securities Exchange Act of 1934 during the preceding 12 months (or for such shorter period<br />
that the Registrant was required to file such reports), and (2) has been subject to such filing requirements for<br />
the past 90 days. Yes No <br />
Indicate by check mark whether the Registrant has submitted electronically and posted on its corporate<br />
Website, if any, every Interactive Data File required to be submitted and posted pursuant to Rule 405 of<br />
Regulation S-T (§232.405 of this chapter) during the preceding 12 months (or for such shorter period that the<br />
Registrant was required to submit and post such files). Yes No
Indicate by check mark if disclosure of delinquent filers pursuant to Item 405 of Regulation S-K(§229.405<br />
of this chapter) is not contained herein, and will not be contained, to the best of the Registrant’s knowledge,<br />
in definitive proxy or information statements incorporated by reference in Part III of this Form 10-K or any<br />
amendment to this Form 10-K. <br />
Indicate by check mark whether the Registrant is a large accelerated filer, an accelerated filer, a non-accelerated<br />
filer, or a smaller reporting company. See the definitions of “large accelerated filer,” “accelerated filer,”<br />
and “smaller reporting company” in Rule 12b-2 of the Exchange Act.<br />
Large accelerated filer <br />
Non-accelerated filer (Do not check if a smaller reporting company)<br />
Accelerated filer <br />
Smaller <strong>Report</strong>ing Company <br />
Indicate by check mark whether the Registrant is a shell company (as defined in Rule 12b-2 of the<br />
Act). Yes No <br />
Based on the closing sales price of the Class A common stock on the New York Stock Exchange on June<br />
30, <strong>2010</strong>, the aggregate market value of the voting stock held by non-affiliates of the Registrant was approximately<br />
$1.2 billion. All executive officers and directors of the Registrant, and all stockholders holding more<br />
than 10% of the Registrant’s outstanding voting stock, other than institutional investors, such as registered<br />
investment companies, eligible to file beneficial ownership reports on Schedule 13G, have been deemed, solely<br />
for the purpose of the foregoing calculation, to be “affiliates” of the Registrant.<br />
As of February 1, 2011, 61,821,041 shares of the Registrant’s Class A common stock, $.001 par value per<br />
share, and no shares of the Registrant’s Class B common stock, $.001 par value per share, were outstanding.<br />
Documents incorporated by reference. Portions of the Registrant’s definitive Proxy Statement for the<br />
Registrant’s 2011 <strong>Annual</strong> Meeting of Stockholders to be filed with the Securities and Exchange Commission<br />
within 120 days after the Registrant’s fiscal year end are incorporated by reference in Part III of this report.
TABLE OF CONTENTS<br />
PART I<br />
1 ITEM 1 BUSINESS<br />
Overview<br />
Our Difference Demonstrated<br />
Our Product Categories<br />
Sourcing and Production<br />
Research and Development<br />
Intellectual Property<br />
Geographic Sales Regions<br />
Distribution<br />
Our Culture<br />
Competition<br />
Government Regulation<br />
Employees<br />
Available Information<br />
Executive Officers<br />
16 ITEM 1A RISK FACTORS<br />
29 ITEM 1B UNRESOLVED STAFF COMMENTS<br />
ITEM 2 PROPERTIES<br />
30 ITEM 3 LEGAL PROCEEDINGS<br />
31 ITEM 4 [REMOVED AND RESERVED]<br />
PART II<br />
31 ITEM 5 MARKET FOR REGISTRANT’S<br />
COMMON EQUITY, RELATED<br />
STOCKHOLDER MATTERS AND<br />
ISSUER PURCHASES OF EQUITY<br />
SECURITIES<br />
34 ITEM 6 SELECTED FINANCIAL DATA<br />
50 ITEM 7A QUANTITATIVE AND QUALITATIVE<br />
DISCLOSURES ABOUT MARKET RISK<br />
ITEM 8 FINANCIAL STATEMENTS AND<br />
SUPPLEMENTARY DATA<br />
78 ITEM 9 CHANGES IN AND DISAGREEMENTS<br />
WITH ACCOUNTANTS ON<br />
ACCOUNTING AND FINANCIAL<br />
DISCLOSURE<br />
ITEM 9A CONTROLS AND PROCEDURES<br />
ITEM 9B OTHER INFORMATION<br />
PART III<br />
79 ITEM 10 DIRECTORS, EXECUTIVE OFICERS<br />
AND CORPORATE GOVERANGE<br />
ITEM 11 EXECUTIVE COMPENSATION<br />
ITEM 12 SECURITY OWNERSHIP OF<br />
CERTAIN BENEFICIAL OWNERS<br />
AND MANAGEMENT AND RELATED<br />
STOCKHOLDERS MATTERS<br />
ITEM 13 CERTAIN RELATIONSHIPS AND<br />
RELATED TRANSACTIONS AND<br />
DIRECTOR INDEPENDENCE<br />
ITEM 14 PRINCIPAL ACCOUNTANT FEES<br />
AND SERVICES<br />
PART IV<br />
79 ITEM 15 EXHIBITS AND FINANCIAL STATEMENT<br />
SCHEDULES<br />
84 SIGNATURES<br />
85 BOARD OF DIRECTORS<br />
35 ITEM 7 MANAGEMENT’S DISCUSSION AND<br />
ANALYSIS OF FINANCIAL CONDITION<br />
AND RESULTS OF OPERATIONS
FORWARD-LOOKING STATEMENTS<br />
THIS ANNUAL REPORT ON FORM 10-K, IN PARTICULAR “ITEM 7. MANAGEMENT’S DISCUSSION AND ANALYSIS OF<br />
FINANCIAL CONDITION AND RESULTS OF OPERATION,” AND “ITEM 1. BUSINESS,” INCLUDE “FORWARD-LOOKING STATE-<br />
MENTS” WITHIN THE MEANING OF SECTION 21E OF THE SECURITIES EXCHANGE ACT OF 1934, AS AMENDED (THE<br />
“EXCHANGE ACT”). WHEN USED IN THIS REPORT, THE WORDS OR PHRASES “WILL LIKELY RESULT,” “EXPECT,” “INTEND,”<br />
“WILL CONTINUE,” “ANTICIPATE,” “ESTIMATE,” “PROJECT,” “BELIEVE” AND SIMILAR EXPRESSIONS ARE INTENDED TO<br />
IDENTIFY “FORWARD-LOOKING STATEMENTS” WITHIN THE MEANING OF THE EXCHANGE ACT. THESE STATEMENTS<br />
REPRESENT OUR EXPECTATIONS OR BELIEFS CONCERNING, AMONG OTHER THINGS, FUTURE REVENUE, EARNINGS,<br />
GROWTH STRATEGIES, NEW PRODUCTS AND INITIATIVES, FUTURE OPERATIONS AND OPERATING RESULTS, AND<br />
FUTURE BUSINESS AND MARKET OPPORTUNITIES. WE UNDERTAKE NO OBLIGATION TO PUBLICLY UPDATE OR REVISE<br />
ANY FORWARD-LOOKING STATEMENT, WHETHER AS A RESULT OF NEW INFORMATION, FUTURE EVENTS OR OTHER-<br />
WISE, EXCEPT AS REQUIRED BY LAW. WE CAUTION AND ADVISE READERS THAT THESE STATEMENTS ARE BASED ON<br />
CERTAIN ASSUMPTIONS THAT MAY NOT BE REALIZED AND INVOLVE RISKS AND UNCERTAINTIES THAT COULD CAUSE<br />
ACTUAL RESULTS TO DIFFER MATERIALLY FROM THE EXPECTATIONS AND BELIEFS CONTAINED HEREIN. FOR A SUMMARY<br />
OF CERTAIN RISKS RELATED TO OUR BUSINESS, SEE “ITEM 1A – RISK FACTORS” BEGINNING ON PAGE 16.<br />
In this <strong>Annual</strong> <strong>Report</strong> on Form 10-K, references to “dollars” and “$” are to United States dollars.<br />
<strong>Nu</strong> <strong>Skin</strong>, Pharmanex and ageLOC are our trademarks. The italicized product names used in this <strong>Annual</strong> <strong>Report</strong> on Form 10-K are product<br />
names and also, in certain cases, our trademarks.<br />
All references to our “distributors” in this <strong>Annual</strong> <strong>Report</strong> on Form 10-K include our independent distributors and preferred customers, and<br />
our sales employees and contractual sales promoters in China. All references to “executive distributors” include our independent distributors<br />
and China sales employees who have completed certain qualification requirements.
PART I<br />
ITEM 1.<br />
BUSINESS<br />
OVERVIEW<br />
We are a leading, global direct selling company with operations in 51<br />
markets worldwide. We develop and distribute innovative, premiumquality<br />
anti-aging personal care products and nutritional supplements<br />
under our <strong>Nu</strong> <strong>Skin</strong> and Pharmanex brands, respectively. We<br />
strive to secure competitive advantages in four key areas: our people,<br />
our products, the culture we promote, and the business opportunities<br />
we offer. In <strong>2010</strong>, our 26th year of operations, we posted record revenue<br />
of $1.5 billion.<br />
As of December 31, <strong>2010</strong>, we had a global network of approximately<br />
800,000 active distributors. Approximately 36,000 of our<br />
distributors were qualified sales leaders we refer to as “executive distributors.”<br />
Our executive distributors play a critical leadership role in<br />
the growth and development of our business.<br />
Approximately 86% of our <strong>2010</strong> revenue came from our markets<br />
outside of the United States. While we have become more geographically<br />
diverse over the past decade, Japan, our largest revenue<br />
market, accounted for approximately 31% of our <strong>2010</strong> total revenue.<br />
Due to the size of our foreign operations, our results are often impacted<br />
by foreign currency fluctuations, particularly fluctuations in<br />
the Japanese yen. In addition, our results are impacted by global economic,<br />
political, demographic and business trends and conditions.<br />
Our business is subject to various laws and regulations globally,<br />
particularly with respect to our product categories as well as our direct<br />
selling distribution channel, sometimes referred to as “network marketing”<br />
or “multi-level marketing.” Accordingly, we face certain risks,<br />
including risks associated with potential improper activities of our distributors<br />
or any inability to obtain necessary product registrations.<br />
OUR DIFFERENCE DEMONSTRATED<br />
We strive to maintain a competitive advantage in four key areas: our<br />
people, our products, our culture, and our opportunity.<br />
Our people—A global network of approximately 800,000 active<br />
distributors in 51 countries. We distribute all of our products exclusively<br />
through our distributors as opposed to traditional distribution<br />
channels such as retail stores or mail order catalogs. Consequently, our<br />
most significant asset is our extensive global network of distributors<br />
who enable us to introduce products and penetrate new markets with<br />
little upfront promotional expense. We believe our competitive sales<br />
compensation plan for our distributors has helped us to attract and<br />
develop a strong group of distributor leaders who play a critical role in<br />
building, motivating and training our extensive distributor network.<br />
Our products—Science-based, proprietary anti-aging skin care<br />
and nutritional products. We believe our innovative approach to<br />
product development provides us with a competitive advantage in<br />
the anti-aging and direct selling markets. Over the last two years, we<br />
have successfully introduced a suite of innovative ageLOC anti-aging<br />
products including the ageLOC Transformation daily skin care system,<br />
ageLOC Edition Galvanic Spa System II and ageLOC Vitality nutritional<br />
supplement, and we are currently developing additional<br />
ageLOC anti-aging products for the future. These products are<br />
designed to positively influence the expression of genes that we believe<br />
play a critical role in the aging process. We believe that our<br />
in-house research expertise and our research collaborations uniquely<br />
position and enable us to continue to introduce innovative and proprietary<br />
anti-aging products in skin care and nutrition.<br />
Our culture—Improving lives. Our mission statement encourages<br />
our people to be a “force for good” by improving lives through<br />
the use of both our products and business opportunities and promotes<br />
a humanitarian culture. We encourage our distributors, customers<br />
and employees to become involved in humanitarian efforts,<br />
the most signifi cant of which are our Nourish the Children<br />
initiative, which provides our distributors the ability to donate<br />
meals to starving children, and our Force for Good Foundation,<br />
which supports charitable causes that benefi t children. We believe<br />
that people are attracted to organizations that focus on more than<br />
just fi nancial incentives.<br />
Our opportunity—Global business opportunity. We believe our<br />
distributor compensation plan provides our distributors with the<br />
incentive to establish a sales organization and customer base in<br />
any country where we conduct business. We believe that we were<br />
the fi rst major direct selling company to enable sales leaders to<br />
develop an international business and receive commissions on<br />
global sales volume in their home market. We believe our compensation<br />
plan, which pays approximately 42% of our product sales<br />
in commissions, is among the most generous compensation plans<br />
in the direct selling industry. We believe the high payout of our<br />
compensation plan enables sales leaders the opportunity to reach<br />
signifi cant income levels and provides us with a competitive advantage<br />
in attracting and developing highly capable, motivated<br />
sales leaders.<br />
1
OUR PRODUCT CATEGORIES<br />
We have two primary product categories, each operating under its<br />
own brand. We market our premium-quality personal care products<br />
under the <strong>Nu</strong> <strong>Skin</strong> brand and our science-based nutritional supplements<br />
under the Pharmanex brand.<br />
Presented below are the U.S. dollar amounts and associated<br />
revenue percentages from the sale of <strong>Nu</strong> <strong>Skin</strong>, Pharmanex, and other<br />
products and services for the years ended December 31, 2008, 2009,<br />
and <strong>2010</strong>. This table should be read in conjunction with the information<br />
presented in the section entitled “Management’s Discussion and<br />
Analysis of Financial Condition and Results of Operation,” which discusses<br />
the factors impacting revenue trends and the costs associated<br />
with generating the aggregate revenue presented.<br />
REVENUE BY PRODUCT CATEGORY<br />
(U.S. dollars in millions) (1) Year Ended December 31,<br />
Product Category 2008 2009 <strong>2010</strong><br />
<strong>Nu</strong> <strong>Skin</strong> . . . . . . . . . . . . . . . . . . . . . . . . . . . . . . . . . . . . . . . . . . . . . . . . . $ 633.4 50.8% $ 752.7 56.5% $ 913.8 59.4%<br />
Pharmanex . . . . . . . . . . . . . . . . . . . . . . . . . . . . . . . . . . . . . . . . . . . . . 597.7 47.9 565.6 42.5 612.2 39.8<br />
Other . . . . . . . . . . . . . . . . . . . . . . . . . . . . . . . . . . . . . . . . . . . . . . . . . . 16.5 1.3 12.8 1.0 11.3 0.8<br />
$ 1,247.6 100.0% $ 1,331.1 100.0% $ 1,537.3 100.0%<br />
(1)<br />
In <strong>2010</strong>, 86% of our sales were transacted in foreign currencies that were then converted to U.S. dollars for financial reporting purposes at weighted-average exchange rates.<br />
Foreign currency fluctuations positively impacted reported revenue by approximately 5% in <strong>2010</strong> compared to 2009. Foreign currency fluctuations had no material impact<br />
on reported revenue in 2009 compared to 2008<br />
<strong>Nu</strong> <strong>Skin</strong>. <strong>Nu</strong> <strong>Skin</strong> is the brand of our original product line and<br />
offers premium-quality anti-aging personal care products. Our strategy<br />
is to leverage our network marketing distribution model to establish<br />
<strong>Nu</strong> <strong>Skin</strong> as an innovative leader in the anti-aging personal care<br />
market. We are committed to continuously improving and evolving<br />
our product formulations to develop and incorporate innovative and<br />
proven ingredients.<br />
Our ageLOC anti-aging skin care products are designed to target<br />
both the signs and the ultimate sources of aging. Research for our<br />
ageLOC platform has identified and targeted what we call Youth<br />
Gene Clusters, functional groups of genes that regulate how we appear<br />
to age. We incorporate this research into ageLOC products<br />
that have been demonstrated to support and reset Youth Gene<br />
Clusters to function in more youthful patterns of activity. Our<br />
ageLOC products provide both corrective and preventative benefits<br />
in preserving youth and in reducing the signs of aging. In <strong>2010</strong>, we<br />
launched our ageLOC Transformation skin care system in most of our<br />
markets globally, following a successful limited offering in the fourth<br />
quarter of 2009 at our global convention.<br />
Another innovative product that positively impacted our revenue<br />
growth over the past five years is the Galvanic Spa System. The<br />
Galvanic Spa instrument emits a very mild electrical current. When<br />
the Galvanic Spa System is used to apply products that carry either<br />
positively or negatively charged active ingredients, product efficacy<br />
improves dramatically. The Galvanic Spa System is an ideal direct selling<br />
product because our distributors can demonstrate its benefits.<br />
This helps them to recruit new customers and distributors. Our<br />
Galvanic Spa System, Galvanic Spa Gels, and associated products accounted<br />
for approximately 15% of our total revenue and 27% of<br />
<strong>Nu</strong> <strong>Skin</strong> revenue in <strong>2010</strong>. In <strong>2010</strong>, we launched an ageLOC Edition<br />
Galvanic Spa System II to capitalize on enthusiasm for ageLOC generally<br />
in most of our markets except South Korea. This newest system<br />
is more user-friendly and improves the amount of ingredients delivered<br />
to the skin. We plan to introduce this improved ageLOC Edition<br />
Galvanic Spa System II in South Korea in the first quarter of 2011.<br />
2
The following table summarizes our <strong>Nu</strong> <strong>Skin</strong> product line by category:<br />
CATEGORY DESCRIPTION SELECTED PRODUCTS<br />
CORE SYSTEMS<br />
Regardless of skin type, our core systems<br />
provide a solid foundation for our customers’<br />
individual skin care needs. Our systems are<br />
developed to target specific skin concerns<br />
and are made from ingredients scientifically<br />
proven to provide visible results for concerns<br />
ranging from aging to acne.<br />
ageLOC Transformation<br />
<strong>Nu</strong> <strong>Skin</strong> 180º Anti-Aging <strong>Skin</strong> Therapy System<br />
<strong>Nu</strong> <strong>Skin</strong> Tri-Phasic White<br />
<strong>Nu</strong>tricentials<br />
<strong>Nu</strong> <strong>Skin</strong> Clear Action Acne Medication System<br />
TARGETED TREATMENTS<br />
Our customized skin care line allows a<br />
customer to tailor product regimens that<br />
help deliver younger looking skin at any age.<br />
The products are developed using cuttingedge<br />
ingredient technologies that target<br />
specific skin care needs.<br />
ageLOC Edition Galvanic Spa System II<br />
Galvanic Spa Gels with ageLOC<br />
Tru Face Essence Ultra<br />
Tru Face Line Corrector<br />
Enhancer <strong>Skin</strong> Conditioning Gel<br />
Celltrex Ultra Recovery Fluid<br />
Celltrex CoQ10 Complete<br />
NAPCA Moisturizer<br />
Polishing Peel <strong>Skin</strong> Refinisher<br />
TOTAL CARE<br />
Our total care line addresses body, hair and<br />
oral care. The total care line can be used by<br />
families and the products are designed to<br />
deliver superior benefits from head to toe<br />
for the ultimate sense of total body wellness.<br />
Body Bar<br />
Liquid Body Lufra<br />
Perennial Intense Body Moisturizer<br />
Dividends Men’s Care<br />
AP-24 Dental Care<br />
<strong>Nu</strong> <strong>Skin</strong> Renu Hair Mask<br />
COSMETIC<br />
The <strong>Nu</strong> Colour cosmetic line products are<br />
targeted to define and highlight your natural<br />
beauty.<br />
Tinted Moisturizer SPF 15<br />
Finishing Powder<br />
Contouring Lip Gloss<br />
Defining Effects Mascara<br />
EPOCH<br />
Our Epoch line is distinguished by utilizing<br />
traditional knowledge of indigenous cultures<br />
for skin care. Each Epoch product is formulated<br />
with botanical ingredients derived<br />
from renewable resources found in nature.<br />
In addition, we contribute a percentage of<br />
our proceeds from Epoch sales to charitable<br />
causes.<br />
Baobab Body Butter<br />
Sole Solution Foot Treatment<br />
Calming Touch Soothing <strong>Skin</strong> Cream<br />
Glacial Marine Mud<br />
IceDancer Invigorating Leg Gel<br />
Everglide Foaming Shave Gel<br />
Ava puhi moni Shampoo<br />
Epoch Baby Hibiscus Hair & Body Wash<br />
3
Pharmanex. We market a variety of anti-aging nutritional products<br />
under our Pharmanex brand. <strong>Direct</strong> selling has proven to be an<br />
extremely effective method of marketing our high-quality nutritional<br />
supplements because our distributors can personally educate consumers<br />
on the quality and benefits of our products, differentiating<br />
them from our competitors’ offerings. LifePak, our flagship line of micronutrient<br />
supplements, accounted for 16% of our total revenue and<br />
37% of Pharmanex revenue in <strong>2010</strong>. We introduced ageLOC Vitality,<br />
our first ageLOC nutritional product designed to address the internal<br />
sources of aging, in Japan, the United States, Canada, and our markets<br />
in Europe and Latin America during the second half of <strong>2010</strong>. We<br />
plan to fully launch ageLOC Vitality in these markets during the first<br />
quarter of 2011.<br />
Our strategy for our nutritional supplement business is to continue<br />
to introduce innovative, substantiated anti-aging products<br />
based on extensive research and development and quality manufacturing.<br />
We are currently developing additional ageLOC anti-aging<br />
supplements, including a new product that we plan to introduce at<br />
our global convention in the fourth quarter of 2011 and rollout to our<br />
markets beginning in the fourth quarter of 2011 and throughout 2012.<br />
The following table summarizes our Pharmanex product line by category:<br />
CATEGORY DESCRIPTION SELECTED PRODUCTS<br />
NUTRITIONALS<br />
Pharmanex nutritional products supply a<br />
broad spectrum of micronutrients that our<br />
bodies need as a foundation for a lifetime of<br />
optimal health.<br />
LifePak family of products<br />
g3 juice<br />
SOLUTIONS<br />
Our targeted solutions supplements contain<br />
standardized levels of botanical and other<br />
active ingredients that are formulated for<br />
consumers to meet the demands of everyday<br />
life.<br />
ageLOC Vitality<br />
Tēgreen 97<br />
ReishiMax GLp<br />
MarineOmega<br />
Cholestin<br />
CordyMax Cs-4<br />
Cortitrol<br />
Detox Formula<br />
Eye Formula<br />
WEIGHT MANAGEMENT<br />
Our weight management products include<br />
supplements as well as meal replacement<br />
shakes.<br />
The Right Approach (TRA) weight<br />
management system<br />
MyVictory! weight management program<br />
VITAMEAL<br />
A highly nutritious meal that can be<br />
purchased and donated through our<br />
Nourish the Children initiative to feed<br />
starving children or purchased for personal<br />
food storage.<br />
Vitameal<br />
4
Other. We also offer a limited number of other products and<br />
services, including digital content storage, water purifiers and other<br />
household products. We have also integrated technology into other<br />
areas of our business and offer advanced tools and services that help<br />
distributors establish an online presence and manage their business.<br />
These “other” categories of products represented only a small percentage<br />
of our revenue in <strong>2010</strong> and will not likely be an area of focus<br />
in the next few years.<br />
SOURCING AND PRODUCTION<br />
<strong>Nu</strong> <strong>Skin</strong>. In order to maintain high product quality, we acquire our ingredients<br />
and contract production of our proprietary products from<br />
suppliers and manufacturers that we believe are reliable, reputable<br />
and deliver high quality materials and service. Our ageLOC Edition<br />
Galvanic Spa System II is procured from a single vendor who owns<br />
certain patent rights associated with such product. We believe our<br />
agreements with this vendor are sufficiently long-term and exclusive.<br />
However, to continue offering this product category following any<br />
termination of our relationship with this vendor, we would need to<br />
develop a new galvanic unit and source it from another supplier. We<br />
also acquire ingredients and products from one other supplier that<br />
currently manufactures products representing approximately 30% of<br />
our <strong>Nu</strong> <strong>Skin</strong> personal care revenue in <strong>2010</strong>. We maintain a good relationship<br />
with our suppliers and do not anticipate that either party will<br />
terminate the relationship in the near term. We also have ongoing<br />
relationships with secondary and tertiary suppliers. Please refer to<br />
“Risk Factors—The loss of suppliers or shortages in ingredients could<br />
harm our business” for a discussion of risks and uncertainties associated<br />
with our supplier relationships and with the sourcing of raw materials<br />
and ingredients.<br />
We also operate a production facility in Shanghai, where we currently<br />
manufacture our personal care products sold in China, as well<br />
as a small portion of product exported to select other markets. We<br />
believe that if the need arose, this plant could be expanded or other<br />
facilities could be built in China to produce larger amounts of inventory<br />
for export or as a back up to our existing supply chain.<br />
Pharmanex. Substantially all of our Pharmanex nutritional supplements<br />
and ingredients, including LifePak, are produced or provided<br />
by third-party suppliers and manufacturers. We rely on two partners<br />
for the majority of our Pharmanex products, one of which supplies<br />
products that represent approximately 52% of our nutritional supplement<br />
revenue while the other supplier manufactures products that<br />
represent approximately 14% of our nutritional supplement revenue<br />
in <strong>2010</strong>. In the event we become unable to source any products or<br />
ingredients from these suppliers or from other current vendors, we<br />
believe that we would be able to produce or replace those products<br />
or substitute ingredients without great difficulty or significant increases<br />
to our cost of goods sold. Please refer to “Risk Factors—The<br />
loss of suppliers or shortages in ingredients could harm our business”<br />
for a discussion of certain risks and uncertainties associated with our<br />
supplier relationships, as well as with the sourcing of raw materials and<br />
ingredients.<br />
We also operate a facility in Zhejiang Province, China, where we<br />
produce some of our Pharmanex nutritional supplements for sale in<br />
China and herbal extracts used to produce Tegreen 97, ReishiMax<br />
GLp and other products sold globally.<br />
RESEARCH AND DEVELOPMENT<br />
We continually invest in our research and development capabilities.<br />
Our research and development expenditures were $9.6 million, $10.4<br />
million and $12.4 million in 2008, 2009 and <strong>2010</strong>, respectively. These<br />
amounts do not include salary and overhead expenses for our internal<br />
research and development activities. Because of our commitment<br />
to product innovation, we plan to continue to commit resources<br />
to research and development in the future. As we invest in our<br />
ageLOC platform of products, we expect to increase our research<br />
and development expenditures.<br />
The <strong>Nu</strong> <strong>Skin</strong> Center for Anti-Aging Research, our primary research<br />
and testing laboratory located adjacent to our office complex<br />
in Provo, Utah, houses both Pharmanex and <strong>Nu</strong> <strong>Skin</strong> research facilities<br />
and professional and technical personnel. We are currently in the<br />
design phase of building a state-of-the-art innovation center adjacent<br />
to our corporate headquarters, a portion of which will be dedicated<br />
to research and development. We also maintain research facilities<br />
in China. Much of our Pharmanex research is conducted in China,<br />
where we benefit from a well-educated, low-cost, scientific labor pool<br />
that enables us to conduct research at a much lower cost than would<br />
be possible in the United States.<br />
We have joint research projects with numerous independent scientists,<br />
including a scientific advisory board comprised of recognized<br />
authorities in disciplines related to our nutritional and personal care<br />
product categories. We also fund and collaborate on basic research<br />
projects with researchers from prominent universities and research institutions<br />
in the United States, Europe and Asia, whose staffs include<br />
scientists with basic research expertise in natural product chemistry,<br />
biochemistry, dermatology, pharmacology and clinical studies.<br />
In addition, we evaluate a significant number of product ideas<br />
for our <strong>Nu</strong> <strong>Skin</strong> and Pharmanex categories presented by outside<br />
sources. We utilize strategic licensing and other relationships with<br />
vendors for access to directed research and development work for<br />
innovative and proprietary offerings.<br />
5
INTELLECTUAL PROPERTY<br />
Our major trademarks are registered in the United States and in each<br />
country where we operate or have plans to operate, and we consider<br />
trademark protection to be very important to our business. Our major<br />
trademarks include <strong>Nu</strong> <strong>Skin</strong>,® our fountain logos, Pharmanex,®<br />
ageLOC, LifePak® and Galvanic Spa.® In addition, a number of our<br />
products, including the ageLOC Edition Galvanic Spa System II and<br />
Pharmanex BioPhotonic Scanner, are based on proprietary technologies<br />
and formulations, some of which are patented or licensed from<br />
third parties. We also rely on trade secret protection to protect our<br />
proprietary formulas and other proprietary information.<br />
GEOGRAPHIC SALES REGIONS<br />
We currently sell and distribute our products in 51 markets. We have segregated our markets into five geographic regions: North Asia,<br />
Greater China, Americas, South Asia/Pacific and Europe. The following table sets forth the revenue for each of the geographic regions for<br />
the years ended December 31, 2008, 2009 and <strong>2010</strong>:<br />
Year Ended December 31,<br />
(U.S. dollars in millions) 2008 2009 <strong>2010</strong><br />
North Asia . . . . . . . . . . . . . . . . . . . . . . . . . . . . . . . . . . . . . . . . . . . . . . $ 594.5 48% $ 606.1 45% $ 686.1 45%<br />
Greater China . . . . . . . . . . . . . . . . . . . . . . . . . . . . . . . . . . . . . . . . . 210.0 17 210.4 16 268.2 17<br />
Americas . . . . . . . . . . . . . . . . . . . . . . . . . . . . . . . . . . . . . . . . . . . . . . . 223.9 18 260.9 20 250.0 16<br />
South Asia/Pacific . . . . . . . . . . . . . . . . . . . . . . . . . . . . . . . . . . . . . . 107.6 8 120.1 9 182.8 12<br />
Europe . . . . . . . . . . . . . . . . . . . . . . . . . . . . . . . . . . . . . . . . . . . . . . . . . 111.6 9 133.6 10 150.2 10<br />
$ 1,247.6 100% $ 1,331.1 100% $ 1,537.3 100%<br />
Additional comparative revenue and related financial information<br />
is presented in the tables captioned “Segment Information” in<br />
Note 17 to our Consolidated Financial Statements. The information<br />
from these tables is incorporated by reference in this <strong>Report</strong>.<br />
Set forth below is information regarding the key markets in our<br />
geographic regions. The information includes information about the<br />
introduction and launch of key new products. With the launch of<br />
ageLOC Transformation, we implemented a product launch process<br />
that has been refined in our South Korea market. This process generally<br />
involves introducing the product in a market through an initial<br />
limited offering that is often tied to a distributor event. The limited<br />
offering typically generates significant distributor activity and a high<br />
level of distributor purchasing. This generally results in a higher than<br />
normal increase in revenue during the quarter of the limited offering.<br />
We typically launch the product for general sales a few months following<br />
the limited offering. Information regarding product launches<br />
below refers to the launch of the product for general sales and not to<br />
the limited offering used to introduce the product. Reference to introduction<br />
of a product refers to the limited offering.<br />
North Asia. The following table provides information on each of the<br />
markets in the North Asia region, including the year we commenced<br />
operations in the market, <strong>2010</strong> revenue, and the percentage of our total<br />
<strong>2010</strong> revenue for each market:<br />
(U.S. dollars in millions) year opened <strong>2010</strong> revenue<br />
percentage of<br />
<strong>2010</strong> revenue<br />
Japan . . . . . . . . . . . . . . . . . . . . . . 1993 $ 471.4 31%<br />
South Korea . . . . . . . . . . . . . . . 1996 $ 214.7 14%<br />
Japan is our largest market and accounted for approximately 31%<br />
of total revenue in <strong>2010</strong>. We market most of our <strong>Nu</strong> <strong>Skin</strong> and Pharmanex<br />
products in Japan, along with a limited number of other offerings. In<br />
addition, all product categories offer a limited number of locally developed<br />
products sold exclusively in our Japanese market. In the first quarter<br />
of <strong>2010</strong>, we launched our ageLOC Future Serum in Japan, following<br />
a limited offering in the fourth quarter of 2009. During the fourth quarter<br />
of 2009, we also introduced our ageLOC Edition Galvanic Spa System II.<br />
We launched the full ageLOC Transformation skin care system in Japan<br />
in the second quarter of <strong>2010</strong>. In the third quarter of <strong>2010</strong>, we introduced<br />
ageLOC Vitality, our first ageLOC nutritional product designed to address<br />
the internal sources of aging, through a limited offering in Japan.<br />
We plan to fully launch ageLOC Vitality in Japan during the first quarter<br />
of 2011. We currently plan to introduce additional ageLOC antiaging<br />
nutritional products in connection with our global convention<br />
during the fourth quarter of 2011.<br />
The direct selling environment in Japan continues to be difficult<br />
as the industry has been on the decline for several years and regulatory<br />
and media scrutiny have increased. Please refer to “Business—<br />
Government Regulation” and “Risk Factors” for a discussion of risks<br />
and uncertainties associated with challenges in the Japan market.<br />
In South Korea, we offer most of our <strong>Nu</strong> <strong>Skin</strong> and Pharmanex<br />
products, along with a limited number of other offerings. In the second<br />
quarter of <strong>2010</strong>, we launched the ageLOC Transformation skin care<br />
system, following a very successful limited offering in the first quarter<br />
of <strong>2010</strong>. We currently plan to introduce the ageLOC Edition Galvanic<br />
Spa System II in South Korea in the first quarter of 2011, followed by the<br />
6
introduction of additional ageLOC anti-aging products in connection<br />
with our global convention during the fourth quarter of 2011.<br />
Greater China. The following table provides information on<br />
each of the markets in the Greater China region, including the year<br />
we commenced operations in the market, <strong>2010</strong> revenue, and the percentage<br />
of our total <strong>2010</strong> revenue for each market:<br />
(U.S. dollars in millions) year opened <strong>2010</strong> revenue<br />
percentage of<br />
<strong>2010</strong> revenue<br />
Taiwan . . . . . . . . . . . . . . . . . . . . . 1992 $ 107.1 7%<br />
China . . . . . . . . . . . . . . . . . . . . . . 2003 $ 91.4 6%<br />
Hong Kong . . . . . . . . . . . . . . . . 1991 $ 69.7 4%<br />
Our Hong Kong and Taiwan markets operate using our global<br />
direct selling business model and global compensation plan. We<br />
offer a robust product offering of the majority of our <strong>Nu</strong> <strong>Skin</strong> and<br />
Pharmanex products and limited other products and services in<br />
Hong Kong and Taiwan, although one of our flagship <strong>Nu</strong> <strong>Skin</strong> products,<br />
the Galvanic Spa System is not approved for sale in Taiwan. Approximately<br />
50% of our revenue in these markets comes from orders<br />
through our monthly product subscription program, which has led to<br />
improved retention of customers and distributors and has helped<br />
streamline the ordering process.<br />
In China, we sell many of our <strong>Nu</strong> <strong>Skin</strong> products and a locally<br />
produced value line of personal care products under the Scion brand<br />
name. We also sell a select number of Pharmanex products, including<br />
our number one nutritional product, LifePak.<br />
We currently are unable to operate under our global direct selling<br />
business model in China as a result of regulatory restrictions on direct<br />
selling activities in this market. Consequently, we have developed a<br />
hybrid business model that utilizes retail stores with an employed<br />
sales force and contractual sales promoters to sell products through<br />
fixed locations, which we supplement with a direct sales opportunity<br />
in those locations where we have obtained a direct sales license. We<br />
continue to operate our retail store/employed sales representative<br />
model because we believe it provides us with more flexibility in the<br />
manner in which we can operate throughout China and compensate<br />
our sales representatives given the restrictions in the direct selling<br />
regulations. We rely on our sales force to market and sell products at<br />
the various retail locations supported by only minimal advertising and<br />
traditional promotional efforts. Our sales employees may also refer<br />
individuals to us for employment as sales representatives or contractual<br />
sales promoters. Our retail model in China is largely based upon<br />
our ability to attract customers to our retail stores through our sales<br />
force, to educate them about our products through frequent training<br />
meetings, and to obtain repeat purchases.<br />
We also continue to implement a direct sales opportunity that<br />
allows us to engage independent direct sellers who can sell products<br />
away from our retail stores. We have received licenses and approvals<br />
to engage in direct selling activities in the municipalities of Beijing,<br />
Shanghai, Shenzhen and four cities in the Guangdong province, and<br />
we continue to work to obtain the necessary approvals in other locations<br />
in China. The direct selling licenses allow us to engage an entrylevel,<br />
non-employee sales force that can sell products away from fixed<br />
retail locations. Our current direct sales model is structured in a manner<br />
that we believe is complementary to our existing retail sales model.<br />
We introduced our ageLOC Edition Galvanic Spa System II in<br />
our Greater China markets, excluding Taiwan, in the fourth quarter of<br />
2009. In connection with our Greater China regional convention in<br />
the second quarter of <strong>2010</strong>, we introduced our ageLOC Transformation<br />
skin care system in Taiwan and Hong Kong. We currently plan to introduce<br />
our ageLOC Transformation skin care system in Mainland China<br />
as soon as we obtain necessary regulatory approvals. We also currently<br />
plan to introduce ageLOC anti-aging nutritional products in<br />
connection with our global convention during the fourth quarter of<br />
2011, followed by a full launch of the products in 2012.<br />
Americas. The following table provides information on each of<br />
the markets in the Americas region, including the year we commenced<br />
operations in the market, <strong>2010</strong> revenue, and the percentage<br />
of our total <strong>2010</strong> revenue for each market:<br />
(U.S. dollars in millions) year opened <strong>2010</strong> revenue<br />
percentage of<br />
<strong>2010</strong> revenue<br />
United States . . . . . . . . . . . . . 1984 $ 212.1 14%<br />
Canada . . . . . . . . . . . . . . . . . . . . 1990 $ 23.9 1%<br />
Latin America (1) . . . . . . . . . . . 1994 $ 14.0 1%<br />
(1)<br />
Latin America includes Colombia, Costa Rica, El Salvador, Guatemala, Honduras,<br />
Mexico and Venezuela.<br />
Substantially all of our <strong>Nu</strong> <strong>Skin</strong> and Pharmanex products, as well<br />
as limited other products and services, are available for sale in the<br />
United States. In the first quarter of <strong>2010</strong>, we launched our ageLOC<br />
Transformation skin care system in the United States, following a successful<br />
limited offering in the first quarter of <strong>2010</strong> at our global convention.<br />
During the fourth quarter of 2009, we also launched our<br />
ageLOC Edition Galvanic Spa System II. In the third quarter of <strong>2010</strong>, we<br />
introduced ageLOC Vitality, our first ageLOC nutritional product<br />
designed to address the internal sources of aging, through a limited<br />
offering in the United States. We plan to fully launch ageLOC Vitality<br />
in the United States beginning in the first quarter of 2011. We currently<br />
plan to introduce additional ageLOC anti-aging nutritional<br />
products in connection with our global convention during the fourth<br />
quarter of 2011.<br />
7
South Asia/Pacific. The following table provides information on<br />
each of the markets in the South Asia/Pacific region, including the<br />
year opened, <strong>2010</strong> revenue, and the percentage of our total <strong>2010</strong> revenue<br />
for each market:<br />
(U.S. dollars in millions) year opened<br />
<strong>2010</strong><br />
revenue<br />
percentage of<br />
<strong>2010</strong> revenue<br />
Singapore/Malaysia/Brunei 2000/2001/2004 $ 76.8 5%<br />
Thailand . . . . . . . . . . . . . . . . . . . . 1997 $ 56.7 4%<br />
Australia/New Zealand . . . 1993 $ 21.7 1%<br />
Indonesia . . . . . . . . . . . . . . . . . . 2005 $ 15.5 1%<br />
Philippines . . . . . . . . . . . . . . . . . . 1998 $ 12.1 1%<br />
The South Asia/Pacific region was our fastest growing region in<br />
<strong>2010</strong>, with a 39% increase in constant currency revenue. We offer a<br />
majority of our Pharmanex and <strong>Nu</strong> <strong>Skin</strong> products in the South Asia/<br />
Pacific region. In the third quarter of <strong>2010</strong>, we launched the ageLOC<br />
Transformation skin care system, following limited offerings during<br />
the first half of <strong>2010</strong>. In <strong>2010</strong>, we also launched our ageLOC Edition<br />
Galvanic Spa System II. We currently plan to introduce ageLOC antiaging<br />
nutritional products in connection with our global convention<br />
during the fourth quarter of 2011, followed by a full launch of the products<br />
in 2012. Our TRA weight management products also continue<br />
to contribute to our strong growth in this region.<br />
Europe. The following table provides information on our Europe<br />
region, including the year we commenced operations in the market,<br />
<strong>2010</strong> revenue, and the percentage of our total <strong>2010</strong> revenue.<br />
(U.S. dollars in millions) year opened <strong>2010</strong> revenue<br />
percentage of<br />
<strong>2010</strong> revenue<br />
Europe Region (1) . . . . . . . . . . 1995 $ 150.2 10%<br />
(1)<br />
Europe region includes Austria, Belgium, Czech Republic, Denmark, Finland, France,<br />
Germany, Hungary, Ireland, Iceland, Israel, Italy, Luxembourg, the Netherlands, Norway,<br />
Poland, Portugal, Romania, Russia, Slovakia, South Africa, Spain, Sweden, Switzerland,<br />
Turkey, Ukraine and the United Kingdom.<br />
We currently operate and offer a full range of <strong>Nu</strong> <strong>Skin</strong> and<br />
Pharmanex products in 27 countries throughout Northern, Eastern<br />
and Central Europe as well as in Israel and South Africa. Various<br />
products and distributor tools have contributed to Europe’s recent<br />
success, including the Galvanic Spa System II, the Pharmanex<br />
BioPhotonic Scanner, and g3. In the fi rst quarter of <strong>2010</strong>, we launched<br />
the ageLOC Transformation skin care system, following a limited<br />
offering in the fourth quarter of 2009. In the fi rst quarter of <strong>2010</strong>,<br />
we also launched our ageLOC Edition Galvanic Spa System II. In<br />
connection with our Europe regional convention in the fourth quarter<br />
of <strong>2010</strong>, we introduced ageLOC Vitality, our fi rst ageLOC nutritional<br />
product designed to address the internal sources of aging,<br />
through a limited offering. We plan to fully launch ageLOC Vitality<br />
in most of our markets in Europe beginning in the fi rst quarter of<br />
2011. We currently plan to introduce additional ageLOC anti-aging<br />
nutritional products in connection with our global convention during<br />
the fourth quarter of 2011.<br />
DISTRIBUTION<br />
Overview. The foundation of our sales philosophy and distribution<br />
system is network marketing. We sell our products through distributors<br />
who are not employees, except in China where we sell our products<br />
through employed retail sales representatives, contractual sales<br />
promoters and direct sellers. Our distributors generally purchase<br />
products from us for resale to consumers and for personal consumption.<br />
We also sell products directly to preferred customers at discounted<br />
monthly subscription prices.<br />
We believe network marketing is an effective vehicle to distribute<br />
our products because:<br />
• distributors can educate consumers about our products in person,<br />
which we believe is more effective for premium-quality,<br />
differentiated products than using traditional advertising;<br />
• direct sales allow for actual product demonstrations and testing<br />
by potential customers;<br />
• there is greater opportunity for distributor and customer testimonials;<br />
and<br />
• as compared to other distribution methods, our distributors<br />
can provide customers higher levels of service and encourage<br />
repeat purchases.<br />
“Active distributors” under our global compensation plan are defined<br />
as those distributors who have purchased products for resale or<br />
personal consumption during the previous three months. In addition,<br />
we have implemented “preferred customer” programs in many of our<br />
markets, which allow customers to purchase products directly from<br />
us, generally on a recurring monthly product subscription basis. We<br />
include preferred customers who have purchased products during<br />
the previous three months in our “active distributor” numbers. While<br />
preferred customers are legally very different from distributors, both<br />
are considered customers of our products.<br />
“Executive distributors” under our global compensation plan<br />
must achieve and maintain specified personal and group sales volumes<br />
each month. Once an individual becomes an executive distributor, he<br />
or she can begin to take advantage of the benefits of commission<br />
payments on personal and group sales volume. As a result of direct<br />
selling restrictions in China, we have implemented a modified busi-<br />
8
ness model utilizing sales employees and contractual sales promoters<br />
in our retail stores in addition to independent direct sellers. (See the<br />
discussion on China in “Business—Geographic Sales Regions.”)<br />
Our revenue is highly dependent upon the number and productivity<br />
of our distributors. Growth in sales volume requires an increase<br />
in the productivity and/or growth in the total number of distributors.<br />
As of December 31, <strong>2010</strong>, we had a global network of approximately<br />
800,000 active distributors. Approximately 36,000 of our distributors<br />
were executive distributors. As of each of the dates indicated<br />
below, we had the following number of active and executive distributors<br />
in the referenced regions: Our number of active distributors has<br />
historically fluctuated from year to year based on various factors, including<br />
our business model transition in China, efforts to train and<br />
discipline distributors in Japan and changes in promotions. As of<br />
each of the dates indicated below, we had the following number of<br />
active and executive distributors in the referenced regions:<br />
TOTAL NUMBER OF ACTIVE AND EXECUTIVE DISTRIBUTORS BY REGION<br />
As of December 31, 2008 As of December 31, 2009 As of December 31, <strong>2010</strong><br />
Active Executive Active Executive Active Executive<br />
North Asia . . . . . . . . . . . . . . . . . . . . . . . . . . . . . . . 326,000 13,937 319,000 14,144 329,000 14,687<br />
Greater China . . . . . . . . . . . . . . . . . . . . . . . . . . . 115,000 6,323 106,000 6,938 118,000 8,015<br />
Americas . . . . . . . . . . . . . . . . . . . . . . . . . . . . . . . . 171,000 4,876 171,000 5,522 161,000 5,305<br />
South Asia/Pacific . . . . . . . . . . . . . . . . . . . . . . . 66,000 2,541 71,000 2,950 84,000 3,930<br />
Europe . . . . . . . . . . . . . . . . . . . . . . . . . . . . . . . . . . . 83,000 2,911 94,000 3,385 107,000 3,739<br />
Total . . . . . . . . . . . . . . . . . . . . . . . . . . 761,000 30,588 761,000 32,939 799,000 35,676<br />
Sponsoring. We rely on our distributors to recruit and sponsor<br />
new distributors of our products. While we provide internet support,<br />
product samples, brochures, magazines, and other sales and marketing<br />
materials at cost, distributors are primarily responsible for recruiting<br />
and educating new distributors with respect to products, our global<br />
compensation plan, and how to build a successful distributorship.<br />
The sponsoring of new distributors creates multiple levels in a<br />
network marketing structure. Individuals that a distributor sponsors are<br />
referred to as “downline” or “sponsored” distributors. If downline distributors<br />
also sponsor new distributors, they create additional levels in<br />
the structure, but their downline distributors remain in the same downline<br />
network as their original sponsoring distributor.<br />
Sponsoring activities are not required of distributors and we do<br />
not pay any commissions for sponsoring new distributors. However,<br />
because of the financial incentives provided to those who succeed in<br />
building and mentoring a distributor network that resells and consumes<br />
products, many of our distributors attempt, with varying degrees of<br />
effort and success, to sponsor additional distributors. People often<br />
become distributors after using our products as regular customers.<br />
Once a person becomes a distributor, he or she is able to purchase<br />
products directly from us at wholesale prices. The distributor is also<br />
entitled to sponsor other distributors in order to build a network of<br />
distributors and product users. A potential distributor must enter into<br />
a standard distributor agreement, which among other things, obligates<br />
the distributor to abide by our policies and procedures.<br />
Global Compensation Plan. One of our competitive advantages<br />
is our global sales compensation plan. Under our global compensation<br />
plan, a distributor is paid consolidated monthly commissions in<br />
the distributor’s home country, in local currency, for the distributor’s<br />
own product sales and for product sales in that distributor’s downline<br />
distributor network across all geographic markets. Because of restrictions<br />
on direct selling in China, our sales employees and contractual<br />
sales promoters there do not participate in the global compensation<br />
plan, but are instead compensated according to a compensation<br />
model established for that market.<br />
Commissions on the sale of an individual <strong>Nu</strong> <strong>Skin</strong> or Pharmanex<br />
product can exceed 50% of the wholesale price, except in a limited<br />
number of markets where commissions are limited by law. The actual<br />
commission payout percentage, however, varies depending on the<br />
number of distributors at each payout level within our global compensation<br />
plan. Historically, our distributor compensation plan has<br />
paid out to distributors approximately 42% of commissionable sales.<br />
We believe that our commission payout as a percentage of total sales<br />
is among the most generous paid by major direct selling companies.<br />
From time to time, we make modifications and enhancements<br />
to our global compensation plan to help motivate distributors. In<br />
2008 and 2009, we implemented modifications to our compensation<br />
plan to improve commission payments early in the distributor lifecycle.<br />
The results from these modifications have been positive. We<br />
continue to evaluate further changes to our compensation plan to<br />
help increase distributor productivity and earnings potential. In addition,<br />
we evaluate a limited number of distributor requests on a<br />
9
monthly basis for exceptions to the terms and conditions of the global<br />
compensation plan, including volume requirements. While our<br />
general policy is to discourage exceptions, we believe that the flexibility<br />
to grant exceptions is critical in retaining distributor loyalty and<br />
dedication and we make exceptions in limited cases as necessary.<br />
High Level of Distributor Incentives. Based upon management’s<br />
knowledge of our competitors’ distributor compensation<br />
plans, we believe our global compensation plan is among the most<br />
financially rewarding plans offered by leading direct selling companies.<br />
There are two fundamental ways in which our distributors can<br />
earn money:<br />
• through retail markups on sales of products purchased by distributors<br />
at wholesale; and<br />
• through a series of commissions on product sales.<br />
Each of our products carries a specified number of sales volume<br />
points. Commissions are based on total personal and group sales volume<br />
points per month. Sales volume points are generally based upon<br />
a product’s wholesale cost, net of any point-of-sale taxes. As a distributor’s<br />
business expands to successfully sponsoring other distributors<br />
into the business, who in turn expand their own businesses, a<br />
distributor receives a higher percentage of commissions. An executive’s<br />
commissions can increase substantially as multiple downline<br />
distributors achieve executive status. In determining commissions,<br />
the number of levels of downline distributors included in an executive’s<br />
commissionable group increases as the number of executive<br />
distributorships directly below the executive increases.<br />
Distributor Support. We are committed to providing high-level<br />
support services tailored to the needs of our distributors in each market.<br />
We attempt to meet the needs and build the loyalty of distributors<br />
by providing personalized distributor services and by maintaining<br />
a generous product return policy. Because the majority of our distributors<br />
are part time and have only a limited number of hours each<br />
week to concentrate on their business, we believe that maximizing a<br />
distributor’s efforts by providing effective distributor support has<br />
been, and will continue to be, important to our success.<br />
Through training meetings, distributor conventions, web-based<br />
messages, distributor focus groups, regular telephone conference<br />
calls, and other personal contacts with distributors, we seek to understand<br />
and satisfy the needs of our distributors. We provide walk-in,<br />
telephonic, and Web-based product fulfillment and tracking services<br />
that result in user-friendly, timely product distribution. Several of our<br />
walk-in retail centers maintain meeting rooms, which our distributors<br />
may utilize for training and sponsoring activities. Because of our efficient<br />
distribution system, we believe that most of our distributors do<br />
not maintain a significant inventory of our products.<br />
Payments. Distributors generally pay for products prior to shipment.<br />
Accordingly, we carry minimal accounts receivable from distributors.<br />
Distributors typically pay for products in cash, by wire transfer or by<br />
credit card.<br />
Product Returns. In order to provide a high level of consumerprotection,<br />
we offer a generous return policy. While our operations<br />
and applicable regulations vary somewhat from country to country,<br />
we generally follow a uniform procedure for product returns. For 30<br />
days from the date of purchase, our product return policy generally<br />
allows a retail customer to return any <strong>Nu</strong> <strong>Skin</strong> or Pharmanex product<br />
to us directly or to the distributor through whom the product was<br />
purchased for a full refund. After 30 days from the date of purchase,<br />
the end user’s return privilege is at the discretion of the distributor.<br />
Our distributors can generally return unused products directly to us<br />
for a 90% refund for one year. Through <strong>2010</strong>, our experience with actual<br />
product returns averaged less than 5% of annual revenue.<br />
Rules Affecting Distributors. We monitor regulations and distributor<br />
activity in each market to ensure our distributors comply with<br />
local laws. Our published distributor policies and procedures establish<br />
the rules that distributors must follow in each market. We also<br />
monitor distributor activity to maintain a level playing field for our<br />
distributors, ensuring that some are not disadvantaged by the activities<br />
of others. We require our distributors to present products and<br />
business opportunities ethically and professionally. Distributors further<br />
agree that their presentations to customers must be consistent<br />
with, and limited to, the product claims and representations made in<br />
our literature.<br />
Distributors must represent to us that their receipt of commissions<br />
is based on retail sales and substantial personal sales efforts. We<br />
must also monitor sales aids used by distributors to help ensure they<br />
comply with applicable laws and regulations. Distributors may not<br />
use any form of media advertising to promote products. Products<br />
may be promoted only by personal contact or by literature that we<br />
produce or approve.<br />
Our products may not be sold, and our business opportunities<br />
may not be promoted, in traditional retail environments. We have<br />
made an exception to this rule by allowing some of our Pharmanex<br />
products to be sold in independently owned pharmacies and drug<br />
stores meeting specified requirements. Distributors who own or are<br />
employed by a service-related business, such as a doctor’s office, hair<br />
salon or health club, may make products available to regular customers<br />
as long as products are not displayed visibly to the general public<br />
10
in a manner to attract the general public into the establishment to<br />
purchase products.<br />
In order to qualify for commission bonuses, our distributors generally<br />
must satisfy specific requirements including achieving at least<br />
100 points, which is approximately $100 in personal sales volume per<br />
month. In addition, individual markets may have requirements specific<br />
to that country based on regulatory factors. For example, in the<br />
United States, distributors must also:<br />
• document retail sales or customer connections to established<br />
numbers of retail customers; and<br />
• sell and/or consume at least 80% of personal sales volume.<br />
We systematically review reports of alleged distributor misbehavior.<br />
If we determine one of our distributors has violated any of our policies<br />
or procedures, we may terminate the distributor’s rights completely.<br />
Alternatively, we may impose sanctions, such as warnings, probation,<br />
withdrawal or denial of an award, suspension of privileges of a distributorship,<br />
fines and/or withholding of commissions until specified conditions<br />
are satisfied, or other appropriate injunctive relief.<br />
OUR CULTURE<br />
From our inception over 26 years ago, <strong>Nu</strong> <strong>Skin</strong> Enterprises’ mission<br />
has been to improve people’s lives—through our quality products, our<br />
rewarding business opportunities and by promoting an uplifting and<br />
enriching culture. Our mission statement encourages people to be a<br />
“force for good” in the world around them. Our culture unites our<br />
distributors, customers and employees in innovative humanitarian efforts,<br />
the most significant of which are our Nourish the Children initiative<br />
that provides our distributors the ability to donate meals to starving<br />
children, and our Force for Good Foundation that supports many<br />
charitable causes that benefit children. In short, we believe that people<br />
are attracted to organizations that focus on more than just financial<br />
incentives. We encourage our distributors and our employees to<br />
live each day with an understanding that together we have the opportunity<br />
to make the world a better place.<br />
Nourish the Children. In 2002, we introduced an innovative humanitarian<br />
initiative, Nourish the Children, which applies the power of<br />
our distribution network to help address the problem of hunger and<br />
malnutrition. We sell a highly nutritious meal replacement product<br />
under the brand, “VitaMeal,” and encourage our distributors, customers<br />
and employees to purchase VitaMeal and donate their purchase<br />
to charitable organizations that specialize in distributing food<br />
to alleviate famine and poverty. Distributors earn commissions on<br />
sales of Vitameal to distributors in their downline and their customers.<br />
For every eight packages of VitaMeal purchased and donated,<br />
we donate an additional package. Since 2002, our distributors, customers<br />
and employees have joined together to donate more than 210<br />
million meals to malnourished children in various locations throughout<br />
the world.<br />
Force for Good Foundation. The original Force for Good campaign<br />
was introduced in conjunction with the <strong>Nu</strong> <strong>Skin</strong> Epoch product<br />
line in 1996. This unique brand of skin and hair care products was developed<br />
in partnership with the world’s leading ethnobotanists. A<br />
donation of 25 cents from the sale of each Epoch product was directed<br />
to preserve the environments, languages, lifestyles, and traditions<br />
of indigenous people around the world. Today, the Force for<br />
Good Foundation provides support for charitable efforts throughout<br />
the globe, with a special emphasis on addressing the humanitarian<br />
needs of children. Charitable projects supported by the Force for<br />
Good Foundation, us, our employees, and our distributors include<br />
helping to provide crucial heart surgeries for children in Southeast<br />
Asia and China, supporting schools for children in need, helping<br />
farmers in Malawi be trained to grow more crops to better support<br />
the needs of their families, and other projects.<br />
COMPETITION<br />
<strong>Direct</strong> <strong>Selling</strong> Companies. We compete with other direct selling organizations,<br />
some of which have a longer operating history and higher<br />
visibility, name recognition and financial resources than we do. The<br />
leading direct selling companies in our existing markets are Avon,<br />
Alticor (Amway) and Herbalife. We compete for new distributors on<br />
the strength of our multiple business opportunities, product offerings,<br />
global compensation plan, management, and our international operations.<br />
In order to successfully compete in this market and attract and<br />
retain distributors, we must maintain the attractiveness of our business<br />
opportunities to our distributors.<br />
<strong>Nu</strong> <strong>Skin</strong> and Pharmanex Products. The markets for our <strong>Nu</strong> <strong>Skin</strong><br />
and Pharmanex products are highly competitive. Our competitors<br />
include manufacturers and marketers of personal care and nutritional<br />
products, pharmaceutical companies and other direct selling organizations,<br />
many of which have longer operating histories and greater name<br />
recognition and financial resources than we do. We compete in these<br />
markets by emphasizing the innovation, value and premium quality of<br />
our products and the convenience of our distribution system.<br />
GOVERNMENT REGULATION<br />
<strong>Direct</strong> selling activities. <strong>Direct</strong> selling activities are regulated by various<br />
federal, state and local governmental agencies in the United<br />
States and foreign countries. Laws and regulations in Japan, South<br />
Korea and China are particularly restrictive and difficult. These laws<br />
and regulations are generally intended to prevent fraudulent or deceptive<br />
schemes, often referred to as “pyramid” schemes, that compensate<br />
participants for recruiting additional participants irrespective<br />
of product sales, use high-pressure recruiting methods and/or do not<br />
11
involve legitimate products. The laws and regulations in our current<br />
markets often:<br />
• impose cancellation/product return, inventory buy-backs and<br />
cooling-off rights for consumers and distributors;<br />
• require us or our distributors to register with governmental<br />
agencies;<br />
• impose caps on the amount of commission we can pay;<br />
• impose reporting requirements; and<br />
• impose upon us requirements, such as requiring distributors to<br />
maintain levels of retail sales to qualify to receive commissions,<br />
to ensure that distributors are being compensated for sales of<br />
products and not for recruiting new distributors.<br />
The laws and regulations governing direct selling are modified<br />
from time to time, and, like other direct selling companies, we are subject<br />
from time to time to government investigations in our various<br />
markets related to our direct selling activities. This can require us to<br />
make changes to our business model and aspects of our global compensation<br />
plan in the markets impacted by such changes and investigations.<br />
We continue to experience heightened regulatory and media<br />
scrutiny of the direct selling industry in Japan. Several direct sellers in<br />
Japan have been penalized for actions of distributors that violated<br />
applicable regulations, including one prominent international direct<br />
selling company that was suspended from sponsoring activities for<br />
three months in 2008, and another large Japanese direct selling<br />
company that was suspended from sponsoring activities for six<br />
months in 2009. In addition, some Japanese lawmakers have experienced<br />
increased political pressure to discontinue supporting the direct<br />
selling industry.<br />
We also continue to experience a high level of general inquiries<br />
regarding our business and complaints to consumer protection centers<br />
in Japan and have taken steps to try to resolve these issues including<br />
providing additional training to distributors, and restructuring<br />
our compliance group in Japan. We have seen improvements in<br />
some prefectures, but not in others. We have received warnings from<br />
consumer centers in certain prefectures raising concerns about our<br />
distributor training and number of general inquiries and complaints.<br />
Although we are implementing additional steps to reinforce our distributor<br />
education and training in Japan to help address these concerns,<br />
we cannot be sure that such steps will be successful. If consumer<br />
complaints and inquiries escalate to a government review or if<br />
the current level of complaints and inquiries does not improve, there<br />
is an increased likelihood that regulators could take action against us,<br />
including a suspension of our sponsoring activities, or we could receive<br />
negative media attention, either of which could harm our business.<br />
In 2009, Japan implemented a national organization of consumer<br />
protection centers, which appears to have resulted in a further<br />
increase in the scrutiny of our business and industry.<br />
As a result of restrictions in China on direct selling activities, we<br />
have implemented a retail store model utilizing an employed sales<br />
force and contractual sales promoters, and we are currently integrating<br />
direct selling in our business model in this market pursuant to applicable<br />
direct selling regulations. The regulatory environment in<br />
China remains complex. China’s direct selling and anti-pyramiding<br />
regulations are restrictive and contain various limitations, including a<br />
restriction on the ability to pay multi-level compensation. Our operations<br />
in China have attracted significant regulatory and media scrutiny<br />
since we expanded our operations there in January 2003. Regulations<br />
are subject to discretionary interpretation by municipal and<br />
provincial level regulators as well as local customs and practices. Interpretations<br />
of what constitutes permissible activities by regulators<br />
can vary from province to province and can change from time to time<br />
because of the lack of clarity in the rules regarding direct selling activities<br />
and differences in customs and practices in each location.<br />
Because of the Chinese government’s significant concerns<br />
about direct selling activities, it scrutinizes very closely activities of<br />
direct selling companies. At times, investigations and related actions<br />
by government regulators have impeded our ability to conduct business<br />
in certain locations, and have resulted in a few cases where we<br />
have paid substantial fines. In each of these cases, we have been allowed<br />
to recommence operations after the government’s investigation,<br />
and no material changes to our business model were required in<br />
connection with these fines and impediments. Please refer to “Risk<br />
Factors” for more information on the regulatory risks associated with<br />
our business in China.<br />
The regulatory environment with respect to direct selling in<br />
China remains fluid and the process for obtaining the necessary governmental<br />
approvals to conduct direct selling continues to evolve.<br />
The regulations and processes in some circumstances have been interpreted<br />
differently by different governmental authorities. In order<br />
to expand our direct selling model into additional provinces we currently<br />
must obtain a series of approvals from the Departments of<br />
Commerce in such provinces, the Shanghai Department of Commerce<br />
(our supervisory authority), as well as the Departments of<br />
Commerce in each city and district in which we plan to operate. We<br />
also are required to obtain the approval of the State Ministry of Commerce,<br />
which is the national governmental authority overseeing direct<br />
selling. In addition, regulators are acting cautiously as they monitor<br />
the roll-out of direct selling, which has made the approval process<br />
12
take longer than we anticipated. Please refer to “Risk Factors” for<br />
more information on the risks associated with our planned expansion<br />
of direct selling in China.<br />
Regulation of Our Products. Our <strong>Nu</strong> <strong>Skin</strong> and Pharmanex products<br />
and related promotional and marketing activities are subject to<br />
extensive governmental regulation by numerous domestic and foreign<br />
governmental agencies and authorities, including the Food and Drug<br />
Administration (the “FDA”), the Federal Trade Commission (the “FTC”),<br />
the Consumer Product Safety Commission, the Department of<br />
Agriculture, State Attorneys General and other state regulatory agencies<br />
in the United States, and the Ministry of Health, Labor and Welfare<br />
in Japan and similar government agencies in each market in which<br />
we operate.<br />
Our personal care products are subject to various laws and regulations<br />
that regulate cosmetic products and set forth regulations for<br />
determining whether a product can be marketed as a “cosmetic” or<br />
requires further approval as an over-the-counter drug. In the United<br />
States, regulation of cosmetics are under the jurisdiction of the FDA.<br />
The Food, Drug and Cosmetic Act defines cosmetics by their intended<br />
use, as “articles intended to be rubbed, poured, sprinkled, or<br />
sprayed on, introduced into, or otherwise applied to the human body<br />
. . . for cleansing, beautifying, promoting attractiveness, or altering the<br />
appearance.” Among the products included in this definition are skin<br />
moisturizers, perfumes, lipsticks, fingernail polishes, eye and facial<br />
makeup preparations, shampoos, permanent waves, hair colors, toothpastes<br />
and deodorants, as well as any material intended for use as a<br />
component of a cosmetic product. Conversely, a product will not be<br />
considered a cosmetic, but may be considered a drug if it is intended<br />
for use in the diagnosis, cure, mitigation, treatment, or prevention of<br />
disease, or is intended to affect the structure or any function of the<br />
body. A product’s intended use can be inferred from marketing or<br />
product claims. The other markets in which we operate have similar<br />
regulations. In Japan, the Ministry of Health, Labor and Welfare regulates<br />
the sale and distribution of cosmetics and requires us to have<br />
an import business license and to register each personal care product<br />
imported into Japan. In Taiwan, all “medicated” cosmetic products<br />
require registration. In China, personal care products are placed into<br />
one of two categories, “general” and “drug.” Products in both categories<br />
require submission of formulas and other information with the health<br />
authorities, and drug products require human clinical studies. The<br />
product registration process in China for these products can take from<br />
nine to more than 18 months or longer. Such regulations in any given<br />
market can limit our ability to import products and can delay product<br />
launches as we go through the registration and approval process for<br />
those products. The sale of cosmetic products is regulated in the European<br />
Union under the European Union Cosmetics <strong>Direct</strong>ive, which<br />
requires a uniform application for foreign companies making personal<br />
care product sales.<br />
Our Pharmanex products are subject to various regulations promulgated<br />
by government agencies in the markets in which we operate.<br />
In the United States, we generally market our nutritional products as<br />
conventional foods or dietary supplements. The FDA has jurisdiction<br />
over this regulatory area. Because these products are regulated under<br />
the Dietary Supplement and Health Education Act, we are generally<br />
not required to obtain regulatory approval prior to introducing a product<br />
into the United States market. None of this infringes, however,<br />
upon the FDA’s power to remove from the market any product it determines<br />
to be unsafe or an unapproved drug. In our foreign markets,<br />
the products are generally regulated by similar government agencies,<br />
such as the Japan Ministry of Health, Labor and Welfare, the South<br />
Korea Food and Drug Administration, and the Taiwan Department<br />
of Health. We typically market our Pharmanex products in international<br />
markets as foods or health foods under applicable regulatory<br />
regimes. In the event a product, or an ingredient in a product, is classified<br />
as a drug or pharmaceutical product in any market, we will generally<br />
not be able to distribute that product in that market through our<br />
distribution channel because of strict restrictions applicable to drug<br />
and pharmaceutical products. China has some of the most restrictive<br />
nutritional supplement product regulations. Products marketed as<br />
“health foods” are subject to extensive laboratory and clinical analysis<br />
by governmental authorities, and the product registration process for<br />
these products can take from nine to more than 18 months or longer.<br />
We market both “health foods” and “general foods” in China. Our<br />
flagship product, LifePak, is currently marketed as a general food, as<br />
only two of the three main capsules have received “health food” classification.<br />
Currently, “general foods” is not an approved category for<br />
direct selling; therefore, we will only market LifePak through our retail<br />
stores until final “health food” classification for LifePak is obtained for<br />
the other capsule. Additionally, there is some risk associated with the<br />
common practice in China of marketing a product as a “general food”<br />
while seeking “health food” classification. If government officials feel<br />
our categorization of our products is inconsistent with product claims,<br />
ingredients or function, this could end or limit our ability to market such<br />
products in China in their current form.<br />
The markets in which we operate all have varied regulations that<br />
distinguish foods and nutritional health supplements from “drugs” or<br />
“pharmaceutical products.” Because of the varied regulations, some<br />
products or ingredients that are recognized as a “food” in certain markets<br />
may be treated as a “pharmaceutical” in other markets. In Japan,<br />
for example, if a specified ingredient is not listed as a “food” by the<br />
Ministry of Health and Welfare, we must either modify the product to<br />
eliminate or substitute that ingredient, or petition the government to<br />
treat such ingredient as a food. We experience similar issues in our<br />
other markets. This is particularly a problem in Europe where the<br />
regulations differ from country to country. As a result, we must often<br />
modify the ingredients and/or the levels of ingredients in our products<br />
for certain markets. In some circumstances, the regulations in foreign<br />
13
markets may require us to obtain regulatory approval prior to introduction<br />
of a new product or limit our uses of certain ingredients altogether.<br />
Because of negative publicity associated with some supplements,<br />
there has been an increased movement in the United States and<br />
other markets to expand the regulation of dietary supplements, which<br />
could impose additional restrictions or requirements in the future. In<br />
general, the regulatory environment is becoming more complex with<br />
increasingly strict regulations each year.<br />
Effective June 2008, the FDA established regulations to require<br />
current good manufacturing practices (cGMP) for dietary supplements.<br />
The regulations ensure that dietary supplements are produced in a<br />
quality manner, do not contain contaminants or impurities, and are<br />
accurately labeled. The regulations include requirements for establishing<br />
quality control procedures for us and our vendors and suppliers,<br />
designing and constructing manufacturing plants, and testing ingredients<br />
and finished products. The regulations also include requirements<br />
for record keeping and handling consumer product complaints. If dietary<br />
supplements contain contaminants or do not contain the type or quantity<br />
of dietary ingredient they are represented to contain, the FDA<br />
would consider those products to be adulterated or misbranded. Our<br />
business is subject to additional FDA regulations, such as those implementing<br />
an adverse event reporting system (“AER’s”) effective December<br />
2007, which requires us to document and track adverse events<br />
and report serious adverse events, which are events involving hospitalization<br />
or death, associated with consumers’ use of our products.<br />
Compliance with these regulations has increased and may further<br />
increase the cost of manufacturing and selling certain of our products<br />
as we work with our vendors to assure they are in compliance.<br />
Most of our major markets also regulate advertising and product<br />
claims regarding the efficacy of products. Accordingly, these regulations<br />
can limit our ability to inform consumers of the full benefits of<br />
our products. For example, in the United States, we are unable to claim<br />
that any of our nutritional supplements will diagnose, cure, mitigate,<br />
treat or prevent disease. In most of our foreign markets, we are not<br />
able to make any “medicinal” claims with respect to our Pharmanex<br />
products. In the United States, the Dietary Supplement Health and<br />
Education Act, however, permits substantiated, truthful and nonmisleading<br />
statements of nutritional support to be made in labeling,<br />
such as statements describing general well-being resulting from consumption<br />
of a dietary ingredient or the role of a nutrient or dietary<br />
ingredient in affecting or maintaining a structure or a function of the<br />
body. Most of the other markets in which we operate have not adopted<br />
similar legislation and we may be subject to more restrictive<br />
limitations on the claims we can make about our products in these<br />
markets. For example, in Japan, our nutritional supplements are marketed<br />
as food products, which significantly limits our ability to make<br />
any claims regarding these products.<br />
To date, we have not experienced any difficulty maintaining our<br />
import licenses. However, due to the varied regulations governing the<br />
manufacture and sale of nutritional products in the various markets,<br />
we have found it necessary to reformulate many of our products or<br />
develop new products in order to comply with such local requirements.<br />
In the United States, we are also subject to a consent decree with the<br />
FTC and various state regulatory agencies arising out of investigations<br />
that occurred in the early 1990s of certain alleged unsubstantiated<br />
product and earnings claims made by our distributors. The consent<br />
decree requires us to, among other things, supplement our procedures<br />
to enforce our policies, not allow our distributors to make earnings<br />
representations without making certain average earnings disclosures,<br />
and not allow our distributors to make unsubstantiated product claims.<br />
Compliance with the anti terrorism regulations of the United States<br />
has caused some delays in customs but these situations have been<br />
resolved by working with the United States customs officials and training<br />
our vendors and market staff in the guidelines. Effective December<br />
1, 2009, the FTC approved revisions to its Guides Concerning the<br />
Use of Endorsements and Testimonials in Advertising, or Guides, that<br />
restrict marketing to those results obtained by a “typical” consumer<br />
and require disclosure of any material connections between an endorser<br />
and the company or products they are endorsing.<br />
Our Pharmanex BioPhotonic Scanner and our Galvanic Spa System<br />
are technologically advanced business tools designed to help our distributors<br />
effectively market our <strong>Nu</strong> <strong>Skin</strong> and Pharmanex products.<br />
These tools are subject to the regulations of various health, consumer<br />
protection and other governmental authorities around the world. These<br />
regulations vary from market to market and affect whether our business<br />
tools are required to be registered as medical devices, the claims that<br />
can be made with respect to these tools, who can use them, and where<br />
they can be used. We have been subject to regulatory inquiries in the<br />
United States, Japan, and other countries with respect to the status<br />
of the Pharmanex BioPhotonic Scanner as a non-medical device. Any<br />
determination that medical device clearance is required for one of our<br />
products, in a market where we currently market and sell such product<br />
as a cosmetic or non-medical device, could require us to expend significant<br />
time and resources in order to meet the additional stringent<br />
standards imposed on medical device companies or prevent us from<br />
marketing the product. For example, in Indonesia, Thailand, Taiwan<br />
and Colombia we are not able to market the Galvanic Spa System<br />
without registering it as a medical device. We are also subject to<br />
regulatory constraints on the claims that can be made with respect to<br />
the use of our business tools.<br />
Other Regulatory Issues. As a United States entity operating<br />
through subsidiaries in foreign jurisdictions, we are subject to foreign<br />
exchange control, transfer pricing and customs laws that regulate the<br />
flow of funds between us and our subsidiaries and for product pur-<br />
14
chases, management services and contractual obligations, such as<br />
the payment of distributor commissions.<br />
As is the case with most companies that operate in our product<br />
categories, we receive from time to time inquiries from government<br />
regulatory authorities regarding the nature of our business and other<br />
issues, such as compliance with local direct selling, transfer pricing,<br />
customs, taxation, foreign exchange control, securities and other laws.<br />
Negative publicity resulting from inquiries into our operations by the<br />
United States and state government agencies in the early 1990s,<br />
stemming in part from alleged inappropriate product and earnings<br />
claims by distributors, and in the late 1990s resulting from adverse<br />
media attention in South Korea, harmed our business.<br />
EMPLOYEES<br />
As of December 31, <strong>2010</strong>, we had approximately 3,400 full- and parttime<br />
employees worldwide. This does not include approximately<br />
1,654 individuals who were employed as sales representatives in our<br />
China operations. None of our employees are represented by a union<br />
or other collective bargaining group, except in China and a small<br />
number of employees in Japan. We believe that our relationship with<br />
our employees is good, and we do not foresee a shortage in qualified<br />
personnel necessary to operate our business.<br />
AVAILABLE INFORMATION<br />
Our Internet address is www.nuskinenterprises.com. We make available<br />
free of charge on or through our internet website our annual reports<br />
on Form 10-K, quarterly reports on Form 10-Q, current reports<br />
on Form 8-K, and amendments to those reports filed or furnished<br />
pursuant to Section 13(a) or 15(d) of the Securities Exchange Act of<br />
1934 as soon as reasonably practicable after we electronically file<br />
such material with, or furnish it to, the Securities and Exchange Commission<br />
(the “SEC”). The public may read and copy any materials we<br />
file with the SEC at the SEC’s Public Reference Room at 100 F<br />
Street, NE, Washington, DC 20549. The public may obtain information<br />
on the operation of the Public Reference Room by calling the<br />
SEC at 1–800–SEC–0330. The SEC maintains an internet website<br />
at http://www.sec.gov that contains reports, proxy and information<br />
statements, and other information regarding issuers that file electronically<br />
with the SEC.<br />
EXECUTIVE OFFICERS<br />
Our executive officers as of February 1, 2011, are as follows:<br />
NAME AGE POSITION<br />
Blake Roney 52 Chairman of the Board<br />
Truman Hunt 51 President and Chief Executive Officer<br />
Ritch Wood 45 Chief Financial Officer<br />
Joe Chang 58 Chief Scientific Officer and Executive<br />
Vice President, Product Development<br />
Dan Chard 46 President, Global Sales and<br />
Operations<br />
Scott Schwerdt 53 President, Americas, Europe and<br />
South Pacific<br />
Matthew Dorny 47 General Counsel and Secretary<br />
Set forth below is the business background of each of our executive<br />
officers.<br />
Blake Roney founded our company in 1984 and served as its<br />
president through 1996. Mr. Roney currently serves as the Chairman<br />
of the Board, a position he has held since our company became public<br />
in 1996. Mr. Roney is also a trustee of the Force for Good Foundation,<br />
a charitable organization that was established in 1996 by Mr.<br />
Roney and the other founders of our company to help encourage<br />
and drive the philanthropic efforts of our company, its employees, its<br />
distributors and its customers to enrich the lives of others. He received<br />
a B.S. degree from Brigham Young University.<br />
Truman Hunt has served as our President since January 2003<br />
and our Chief Executive Officer since May 2003. He has also served<br />
as a director of our company since May 2003. Mr. Hunt joined our<br />
company in 1994 and has served in various positions, including Vice<br />
President and General Counsel from 1996 to January 2003 and Executive<br />
Vice President from January 2001 until January 2003. He<br />
received a B.S. degree from Brigham Young University and a J.D.<br />
degree from the University of Utah.<br />
Ritch Wood has served as our Chief Financial Officer since<br />
November 2002. Prior to this appointment, Mr. Wood served as<br />
Vice President, Finance from July 2002 to November 2002 and Vice<br />
President, New Market Development from June 2001 to July 2002.<br />
Mr. Wood joined our company in 1993 and has served in various<br />
capacities. Prior to joining us, he worked for the accounting firm of<br />
Grant Thornton LLP. Mr. Wood earned a B.S. and a Master of<br />
Accountancy degrees from Brigham Young University.<br />
Joe Chang has served as Chief Scientific Officer and Executive<br />
Vice President of Product Development since February 2006. Dr.<br />
Chang served as President of our Pharmanex division from April<br />
15
2000 to February 2006. Dr. Chang served as Vice President of Clinical<br />
Studies and Pharmacology of Pharmanex from 1997 until April<br />
2000. Dr. Chang has nearly 20 years of pharmaceutical experience.<br />
He received a B.S. degree from Portsmouth University and a Ph.D.<br />
degree from the University of London.<br />
Daniel Chard has served as President of Global Sales and<br />
Operations since May 2009. Prior to serving in this position, Mr.<br />
Chard served as Executive Vice President of Distributor Success<br />
from February 2006 to May 2009 and President of <strong>Nu</strong> <strong>Skin</strong> Europe<br />
from April 2004 to February 2006. Mr. Chard also served as Vice<br />
President of Marketing and Product Management of Big Planet, our<br />
technology products and services division, from May 2003 to April<br />
2004 and as Senior <strong>Direct</strong>or of Marketing and Product Development<br />
at Pharmanex. Prior to joining us in 1998, Mr. Chard worked in a<br />
variety of strategic marketing positions in the consumer products industry.<br />
Mr. Chard holds a B.A. degree in Economics from Brigham<br />
Young University and an M.B.A. from the University of Minnesota.<br />
Scott Schwerdt has served as President, Americas, Europe and<br />
South Pacific since February 2006. Mr. Schwerdt served as Regional<br />
Vice President of North America and President of <strong>Nu</strong> <strong>Skin</strong> Enterprises<br />
United States, Inc. from May 2004 to February 2006. Mr. Schwerdt<br />
previously served as the General Manager of our U.S. operations from<br />
May 2001 to May 2004. Mr. Schwerdt joined our company in 1988 and<br />
has held various positions, including Vice President of North America/<br />
South Pacific Operations and Vice President of Europe. Mr. Schwerdt<br />
received a B.A. degree in International Relations from Brigham Young<br />
University.<br />
Matthew Dorny has served as our General Counsel and Secretary<br />
since January 2003. Mr. Dorny previously served as Assistant General<br />
Counsel from May 1998 to January 2003. Prior to joining us, Mr. Dorny<br />
was a securities and business attorney in private practice in Salt Lake<br />
City, Utah. Mr. Dorny received B.A., M.B.A. and J.D. degrees from the<br />
University of Utah.<br />
ITEM 1A. RISK FACTORS<br />
We face a number of substantial risks. Our business, financial condition<br />
or results of operations could be harmed by any of these risks. The trading<br />
price of our common stock could decline due to any of these risks, and<br />
they should be considered in connection with the other information contained<br />
in this <strong>Annual</strong> <strong>Report</strong> on Form 10-K. These risk factors should be<br />
read together with the other items in this <strong>Annual</strong> <strong>Report</strong> on Form 10-K,<br />
including “Item 1. Business” and “Item 7. Management’s Discussion and<br />
Analysis of Financial Condition and Results of Operation.”<br />
Difficult economic conditions could harm our business.<br />
Global economic conditions continue to be challenging.<br />
Although the economy appears to be recovering in some countries,<br />
it is not possible for us to predict the extent and timing of any improvement<br />
in global economic conditions. Even with continued<br />
growth in many of our markets during this period, the economic<br />
downturn could adversely impact our business in the future by causing<br />
a decline in demand for our products, particularly if the economic<br />
conditions are prolonged or worsen. In addition, such economic conditions<br />
may adversely impact access to capital for us and our suppliers,<br />
may decrease our distributors’ ability to obtain or maintain credit<br />
cards, and may otherwise adversely impact our operations and overall<br />
financial condition.<br />
Currency exchange rate fluctuations could impact our financial results.<br />
In <strong>2010</strong>, approximately 86% of our sales occurred in markets outside<br />
of the United States in each market’s respective local currency.<br />
We purchase inventory primarily in the United States in U.S. dollars.<br />
In preparing our financial statements, we translate revenue and expenses<br />
in our markets outside the United States from their local currencies<br />
into U.S. dollars using weighted average exchange rates. If the<br />
U.S. dollar strengthens relative to local currencies, particularly the<br />
Japanese yen which accounted for approximately 31% of our <strong>2010</strong><br />
revenue, our reported revenue, gross profit and net income will likely<br />
be reduced. Foreign currency fluctuations, particularly with respect<br />
to the Japanese yen given the amount of yen denominated debt on<br />
our balance sheet, can also result in losses and gains resulting from<br />
translation of foreign currency denominated balances on our balance<br />
sheet. Given the complex global political and economic dynamics<br />
that affect exchange rate fluctuations, it is difficult to predict future<br />
fluctuations and the effect these fluctuations may have upon future<br />
reported results or our overall financial condition.<br />
Because our Japanese operations account for a significant part<br />
of our business, continued weakness in our business operations in<br />
Japan could harm our business.<br />
Approximately 31% of our <strong>2010</strong> revenue was generated in Japan.<br />
We have experienced local currency revenue declines in Japan over<br />
the last several years and continue to face challenges in this market.<br />
16
These declines could continue or increase. Factors that could impact<br />
our results in the market include:<br />
• continued or increased levels of regulatory and media scrutiny<br />
and any regulatory actions taken by regulators, or any adoption<br />
of more restrictive regulations, in response to such scrutiny;<br />
• significant weakening of the Japanese yen;<br />
• increased regulatory constraints with respect to the claims we<br />
can make regarding the efficacy of products and tools, which<br />
could limit our ability to effectively market them;<br />
• risks that the initiatives we have implemented in Japan, which<br />
are patterned after successful initiatives implemented in other<br />
markets, will not have the same level of success in Japan, may<br />
not generate renewed growth or increased productivity among<br />
our distributors, and may cost more or require more time to<br />
implement than we have anticipated;<br />
• inappropriate activities by our distributors and any resulting<br />
regulatory actions against us or our distributors;<br />
• improper practices of other direct selling companies or their<br />
distributors that increase regulatory and media scrutiny of our<br />
industry;<br />
• any weakness in the economy or consumer confidence; and ;<br />
• increased competitive pressures from other direct selling companies<br />
and their distributors who actively seek to solicit our<br />
distributors to join their businesses.<br />
Heightened regulatory scrutiny of the direct selling industry in<br />
Japan could harm our business if we are not able to successfully<br />
limit the number of general inquiries and complaints regarding<br />
our business received by consumer protection centers.<br />
We continue to experience heightened regulatory scrutiny of the<br />
direct selling industry in Japan. Several direct sellers in Japan have<br />
been penalized for actions of distributors that violated applicable<br />
regulations, including one prominent international direct selling company<br />
that was suspended from sponsoring activities for three months<br />
in 2008, and another large Japanese direct selling company that was<br />
suspended from sponsoring activities for six months in 2009. In addition,<br />
some Japanese lawmakers have experienced increased political<br />
pressure to discontinue supporting the direct selling industry.<br />
We also continue to experience a high level of general inquiries and<br />
complaints to consumer protection centers in Japan and have taken<br />
steps to try to resolve these issues including providing additional training<br />
to distributors, and restructuring our compliance group in Japan. We<br />
have seen improvements in some prefectures, but not in others. We<br />
have received warnings from consumer centers in certain prefectures<br />
raising concerns about our distributor training and number of general<br />
inquiries and complaints. Although we are implementing additional steps<br />
to reinforce our distributor education and training in Japan to help address<br />
these concerns, we cannot be sure that such steps will be successful.<br />
If consumer complaints and inquiries escalate to a government review<br />
or if the current level of complaints and inquiries does not improve, there<br />
is an increased likelihood that regulators could take action against us,<br />
including a suspension of our sponsoring activities, or we could receive<br />
negative media attention, either of which could harm our business. In<br />
2009, Japan implemented a national organization of consumer protection<br />
centers, which appears to have resulted in a further increase in the<br />
scrutiny of our business and industry.<br />
If we are unable to retain our existing distributors and recruit<br />
additional distributors, our revenue will not increase and may<br />
even decline.<br />
We distribute almost all of our products through our distributors<br />
and we depend on them to generate virtually all of our revenue. Our<br />
distributors may terminate their services at any time, and, like most<br />
direct selling companies, we experience high turnover among distributors<br />
from year to year. Distributors who join to purchase our products<br />
for personal consumption or for short-term income goals frequently<br />
only stay with us for a short time. Executive distributors who have<br />
committed time and effort to build a sales organization will generally<br />
stay for longer periods. Distributors have highly variable levels of training,<br />
skills and capabilities. As a result, in order to maintain sales and<br />
increase sales in the future, we need to increase our retention of existing<br />
distributors and continue to successfully recruit additional distributors.<br />
To increase our revenue, we must increase the number of and/or<br />
the productivity of our distributors.<br />
We have experienced periodic declines in both active distributors<br />
and executive distributors in the past and could experience such declines<br />
again in the future. For example, over the last several months we<br />
have experienced some softness in our active and executive distributor<br />
numbers in the United States. If our initiatives for 2011 do not drive<br />
growth in our distributor numbers, particularly in the United States and<br />
Japan where our distributors numbers have been down, our operating<br />
results could be harmed. While we take many steps to help train, motivate,<br />
and retain distributors, we cannot accurately predict how the<br />
number and productivity of distributors may fluctuate because we rely<br />
primarily upon our distributor leaders to recruit, train, and motivate new<br />
distributors. Our operating results could be harmed if we and our distributor<br />
leaders do not generate sufficient interest in our business to<br />
retain existing distributors and attract new distributors.<br />
17
The number and productivity of our distributors could be<br />
harmed by several additional factors, including:<br />
• any any adverse publicity regarding us, our products, our distribution<br />
channel, or our competitors;<br />
• lack of interest in, or the technical failure of, existing or new<br />
products;<br />
• lack of a compelling sponsoring story that generates interest<br />
for potential new distributors and effectively draws them into<br />
the business;<br />
• any negative public perception of our products and their ingredients;<br />
• any negative public perception of our distributors and direct<br />
selling businesses in general;<br />
• our actions to enforce our policies and procedures;<br />
• any regulatory actions or charges against us or others in our<br />
industry;<br />
• general economic and business conditions; and<br />
• potential saturation or maturity levels in a given country or<br />
market which could negatively impact our ability to attract and<br />
retain distributors in such market.<br />
Although our distributors are independent contractors, improper<br />
distributor actions that violate laws or regulations could harm<br />
our business.<br />
Distributor activities that violate applicable laws or regulations<br />
could result in government or third party actions against us, which<br />
could harm our business. Except in China, our distributors are not employees<br />
and act independently of us. We implement strict policies and<br />
procedures to ensure our distributors will comply with legal requirements.<br />
However, given the size of our distributor force, we experience<br />
problems with distributors from time to time. For example, product<br />
claims made by some of our distributors in 1990 and 1991 led to an<br />
investigation by the Federal Trade Commission (“FTC”) in the United<br />
States, which resulted in our entering into a consent decree with<br />
the FTC. In addition, rulings by the South Korean Federal Trade Commission<br />
and by judicial authorities against us and other companies in<br />
South Korea indicate that vicarious liability may be imposed on us for<br />
the criminal activity of our distributors. In addition, we have seen an<br />
increase in sales aids and promotional material being produced by<br />
distributors and distributor groups in some markets, which places an<br />
increased burden on us to monitor compliance of such materials and<br />
increases the risk of materials that violate our policies and applicable<br />
regulations. As we expand internationally, our distributors often attempt<br />
to anticipate which markets we will open in the future and begin marketing<br />
and sponsoring activities in markets where we are not qualified<br />
to conduct business. If we are unable to adequately address these<br />
issues, we could face fines or other legal action.<br />
Laws and regulations may prohibit or severely restrict our direct<br />
sales efforts and cause our revenue and profitability to decline, and<br />
regulators could adopt new regulations that harm our business.<br />
Various government agencies throughout the world regulate<br />
direct sales practices. Laws and regulations in Japan, South Korea and<br />
China are particularly restrictive and difficult. These laws and regulations<br />
are generally intended to prevent fraudulent or deceptive schemes,<br />
often referred to as “pyramid” schemes, that compensate participants<br />
for recruiting additional participants irrespective of product sales, use<br />
high pressure recruiting methods and/or do not involve legitimate products.<br />
The laws and regulations in our current markets often:<br />
• impose order cancellations, product returns, inventory buybacks<br />
and cooling-off rights for consumers and distributors;<br />
• require us or our distributors to register with government<br />
agencies;<br />
• impose caps on the amount of commissions we can pay;<br />
and/or<br />
• require us to ensure that distributors are not being compensated<br />
based upon the recruitment of new distributors.<br />
Complying with these widely varying and sometimes inconsistent<br />
rules and regulations can be difficult and may require the devotion<br />
of significant resources on our part. If we are unable to continue<br />
business in existing markets or commence operations in new markets<br />
because of these laws, our revenue and profitability may decline. In<br />
addition, countries where we currently do business could change<br />
their laws or regulations to negatively affect or completely prohibit<br />
direct sales efforts.<br />
Challenges to the form of our network marketing system or other<br />
regulatory compliance issues could harm our business.<br />
We may be subject to challenges by government regulators regarding<br />
the form of our network marketing system or elements of our<br />
business including marketing and product claims made by us or our<br />
distributors. Legal and regulatory requirements concerning our industry<br />
involve a high level of subjectivity and are inherently factbased<br />
and subject to interpretation, which provides regulators with<br />
more discretion in their application of these laws and regulations. We<br />
have seen an increase in government scrutiny of our industry in vari-<br />
18
ous markets, including Japan, South Korea, China, Europe, and the<br />
United Kingdom. From time to time, we receive formal and informal<br />
inquiries from various government regulatory authorities about our<br />
business and our compliance with local laws and regulations. For example,<br />
in 2009, we received notice from Belgium authorities alleging<br />
that we have violated the anti-pyramid regulations in that market and<br />
an inquiry from the Consumer Protection Agency in Hungary regarding<br />
various marketing claims. In the early 1990s, we entered into<br />
voluntary consent agreements with the FTC and a few state regulatory<br />
agencies relating to investigations of our distributors’ product<br />
claims and practices. Pursuant to the consent decrees, we agreed,<br />
among other things, to supplement our procedures to enforce our<br />
policies, to not allow distributors to make earnings representations<br />
without making additional disclosures relating to average earnings<br />
and to not make, or allow our distributors to make, product claims that<br />
were not substantiated. As a result of the previous investigations, the<br />
FTC makes inquiries from time to time regarding our compliance<br />
with applicable laws and regulations and our consent decree. If we are<br />
not able to resolve existing regulatory reviews to the satisfaction of<br />
the applicable governmental agencies, or there are any new regulatory<br />
challenges regarding our business or others in our industry, our<br />
business could be harmed if such actions result in the imposition of<br />
any fines or damages on our business, create adverse publicity, increase<br />
scrutiny of our industry, detrimentally affect our efforts to recruit<br />
or motivate distributors and attract customers, or interpret laws<br />
in a manner inconsistent with our current business practices.<br />
Challenges by third parties to the form of our business model or the<br />
actions of our company or distributors could harm our business.<br />
There have been private actions filed against some of our competitors<br />
in our industry in recent years by their distributors challenging<br />
the legality of their form of business. One of our largest competitors<br />
recently settled a class-action lawsuit, requiring it to pay a large cash<br />
settlement. There is a risk that such challenges and settlements could<br />
provide incentives for similar actions by distributors against us and<br />
other direct selling companies. Any challenges regarding us or others<br />
in our industry could harm our business if such challenges result in the<br />
imposition of any fines or damages on our business, create adverse<br />
publicity, increase scrutiny of our industry, detrimentally affect our efforts<br />
to recruit or motivate distributors and attract customers, or interpret<br />
laws in a manner inconsistent with our current business practices.<br />
Because legal and regulatory requirements concerning our<br />
industry involve a high level of subjectivity and are inherently fact-based<br />
and subject to judicial interpretation, we can provide no assurance that<br />
we would not be harmed by the application or interpretation of statutes<br />
or regulations governing network marketing in any civil challenge by<br />
a current or former distributor.<br />
Government regulations relating to the marketing and advertising<br />
of our products and services may restrict, inhibit or delay our ability<br />
to sell these products and harm our business.<br />
Our products and our related marketing and advertising efforts<br />
are subject to numerous domestic and foreign government agencies’<br />
and authorities’ laws and extensive regulations, which govern the ingredients<br />
and products that may be marketed without pre-market approval<br />
and/or registration as a drug and the claims that may be made<br />
regarding such products. Many of these laws and regulations involve a<br />
high level of subjectivity, are inherently fact-based and subject to interpretation,<br />
and vary significantly from market to market. These laws and<br />
regulations can limit the claims we can make regarding our products<br />
and often restrict our ability to introduce products or ingredients into<br />
one or more markets. In Europe for example, we are unable to market<br />
supplements that contain ingredients that were not marketed prior to<br />
May 1997 in Europe (“novel foods”) without going through an extensive<br />
registration and pre-market approval process. In addition, there has<br />
been increased regulatory scrutiny of nutritional supplements and marketing<br />
claims under existing and new regulations. At times these laws<br />
and regulations may prevent us from launching a product in a market,<br />
require us to reformulate a product or limit the claims made regarding<br />
a product. For example, as we prepare for the global launch of our new<br />
ageLOC nutritional product, we face regulatory issues that may force<br />
us to reformulate the product for some markets and may limit our ability<br />
to revise the product formulations without delaying necessary registrations.<br />
If these laws and regulations restrict, inhibit or delay our ability<br />
to introduce or market our products or limit the claims we are able<br />
to make regarding our products, our business may be harmed.<br />
During recent years, authorities’ enforcement activity and interpretation<br />
of these regulations suggest a greater allowance for scientific-based<br />
and substantiated claims when not involving specific drug or disease<br />
claims. As a result, as companies have developed new and innovative<br />
products, there has been a trend towards more aggressive claims and<br />
the inclusion of greater science regarding the marketing of cosmetic and<br />
nutritional products. We believe in order to remain competitive we need<br />
to have similarly compelling claims. Because there is a degree of subjectivity<br />
in determining whether marketing materials or statements constitute<br />
product claims and whether they involve improper drug claims, our<br />
claims and our interpretation of applicable regulations may be challenged,<br />
which could harm our business. This is a particular risk with respect to<br />
our ageLOC line of products based on our novel approach to these<br />
products and our focus on genes and sources of aging in both our scientific<br />
explanation for support of our products as well as our marketing<br />
claims. If regulators take a more restrictive stance regarding such claims,<br />
alter their enforcement priorities, or determine that any of our claims<br />
violate applicable regulations, we could be fined or forced to modify our<br />
claims or stop selling a product.<br />
19
New regulations governing the marketing and sale of nutritional<br />
supplements could harm our business.<br />
There has been an increasing movement in the United States and<br />
other markets to increase the regulation of dietary supplements, which<br />
could impose additional restrictions or requirements in the future. In<br />
the United States, for example, some legislators and industry critics<br />
continue to push for increased regulatory authority by the FDA over<br />
nutritional supplements. Our business could be harmed if more restrictive<br />
legislation is successfully introduced and adopted in the future. In<br />
particular, the adoption of legislation requiring FDA approval of supplements<br />
or ingredients could delay or inhibit our ability to introduce<br />
new supplements. We face similar pressures in our other markets, including<br />
Europe, which is expected to adopt additional regulations<br />
setting new limits on acceptable maximum levels of vitamins and<br />
minerals. In the United States, effective December 1, 2009, the FTC<br />
approved revisions to its Guides Concerning the Use of Endorsements<br />
and Testimonials in Advertising, or Guides, that require disclosure of<br />
material connections between an endorser and the company they are<br />
endorsing and do not allow marketing using atypical results. The requirements<br />
and restrictions of the revised Guides may diminish the<br />
impact of our marketing efforts and negatively impact our sales results.<br />
If we or our distributors fail to comply with these Guides, the FTC<br />
could bring an enforcement action against us and we could be fined<br />
and/or forced to alter our operations. Our operations also could be<br />
harmed if new laws or regulations are enacted that restrict our ability<br />
to market or distribute nutritional supplements or impose additional<br />
burdens or requirements on nutritional supplement companies or require<br />
us to reformulate our products.<br />
Regulations governing the production and marketing of our personal<br />
care products could harm our business.<br />
Our personal care products are subject to various domestic and<br />
foreign laws and regulations that regulate cosmetic products and set<br />
forth regulations for determining whether a product can be marketed<br />
as a “cosmetic” or requires further approval as an over-the-counter<br />
drug. A determination that our cosmetic products impact the structure<br />
or function of the human body, or improper marketing claims by<br />
our distributors may lead to a determination that such products require<br />
pre-market approval as a drug. Such regulations in any given<br />
market can limit our ability to import products and can delay product<br />
launches as we go through the registration and approval process for<br />
those products. Furthermore, if we fail to comply with these regulations,<br />
we could face enforcement action against us and we could be<br />
fined, forced to alter or stop selling our products and/or required to<br />
adjust our operations. Our operations also could be harmed if new<br />
laws or regulations are enacted that restrict our ability to market or<br />
distribute our personal care products or impose additional burdens or<br />
requirements on the contents of our personal care products or require<br />
us to reformulate our products.<br />
If we are found not to be in compliance with Good Manufacturing<br />
Practices our operations could be harmed.<br />
FDA regulations on Good Manufacturing Practices and Adverse<br />
Event <strong>Report</strong>ing requirements for the nutritional supplement<br />
industry have recently gone into effect and require good manufacturing<br />
processes for us and our vendors, including stringent vendor<br />
qualifications, ingredient identification, manufacturing controls and<br />
record keeping. The ingredient identification requirement, which requires<br />
us to confirm the levels, identity and potency of ingredients<br />
listed on our product labels within a narrow range, is particularly burdensome<br />
and difficult for us with respect to a product like LifePak,<br />
which contains 46 different ingredients. We are also now required to<br />
report serious adverse events associated with consumer use of our<br />
products. Our operations could be harmed if regulatory authorities<br />
make determinations that we or our vendors are not in compliance<br />
with the new regulations. A finding of noncompliance may result in<br />
administrative warnings, penalties or actions impacting our ability to<br />
continue selling certain of our products. In addition, compliance with<br />
these regulations has increased and may further increase the cost of<br />
manufacturing certain of our products as we work with our vendors to<br />
assure they are qualified and in compliance.<br />
Our operations in China are subject to significant government scrutiny<br />
and may be harmed by the results of such scrutiny.<br />
Because of the government’s significant concerns about direct<br />
selling activities, government regulators in China closely scrutinize<br />
activities of direct selling companies or activities that resemble direct<br />
selling. The regulatory environment in China with regards to direct<br />
selling is evolving, and officials in multiple national and local levels in<br />
the Chinese government often exercise broad discretion in deciding<br />
how to interpret, apply and enforce applicable regulations. We cannot<br />
be certain that our operations will continue to be deemed by national<br />
and local regulatory authorities to be in compliance with such<br />
regulations. In the past, the government has taken significant actions<br />
against companies that the government found were engaging in direct<br />
selling activities in violation of applicable law, including shutting<br />
down their businesses and imposing substantial fines.<br />
Our operations in China are subject to significant regulatory<br />
scrutiny, and we have experienced challenges in the past, including<br />
interruption of sales activities at certain stores and fines being paid in<br />
some cases. Although we have now obtained direct selling licenses in<br />
a limited number of provinces, we continue to operate a hybrid model<br />
that utilizes sales employees, contractual sales promoters and direct<br />
sellers to market our products. Government regulators continue<br />
to scrutinize our activities and the activities of our sales employees,<br />
contractual sales promoters and direct sellers to monitor our compliance<br />
with applicable regulations. We continue to be subject to government<br />
reviews and investigations. At times, complaints made by<br />
our sales representatives to the government have resulted in in-<br />
20
creased scrutiny by the government. Any determination that our operations<br />
or activities, or the activities of our sales employees, contractual<br />
sales promoters or direct sellers, are not in compliance with<br />
applicable regulations could result in substantial fines, extended interruptions<br />
of business, termination of necessary licenses and permits,<br />
including our direct selling licenses, or restrictions on our ability to<br />
open new stores, obtain approvals for service centers or expand into<br />
new locations, all of which could harm our business.<br />
If regulations in China are interpreted or enforced by government<br />
authorities in a manner that negatively impacts our retail business<br />
model or our hybrid business model there, our business in China<br />
could be harmed.<br />
The Chinese government has adopted anti-pyramiding and direct<br />
selling regulations that contain significant restrictions and limitations,<br />
including a restriction on multi-level compensation for independent<br />
distributors selling away from a fixed location. The<br />
regulations also impose various requirements that are more burdensome<br />
than in our other markets and which could negatively impact<br />
the willingness of some people to sign up to become direct sellers.<br />
There continues to be uncertainty as to the interpretation and enforcement<br />
of the regulations and their scope, and the specific types<br />
of restrictions and requirements imposed under them and national<br />
and local regulatory authorities exercise broad discretion in interpreting,<br />
applying and enforcing these direct selling regulations. Our business<br />
and growth prospects would be harmed if the anti-pyramiding<br />
regulations or direct selling regulations are interpreted in such a manner<br />
that our current method of conducting business through the use<br />
of sales employees, contractual sales promoters and direct sellers is<br />
deemed to violate these regulations. In particular, our business would<br />
be harmed by any determination that our current method of compensating<br />
our sales employees and contractual sales promoters, including<br />
our use of the sales productivity of an individual and the<br />
group of individuals whom he or she trains and supervises as one of<br />
the factors in establishing salary and compensation, violates the restriction<br />
on multi-level compensation under the rules. Our business<br />
could also be harmed if regulators inhibit our ability to operate our<br />
hybrid business model, which includes retail stores, sales employees,<br />
contractual sales promoters and direct sellers.<br />
If we are unable to obtain additional necessary national and local<br />
government approvals in China as quickly as we would like, our<br />
ability to expand our direct selling business and grow our business<br />
there could be negatively impacted.<br />
We have completed the required national and local licensing<br />
process and commenced direct selling activities in Beijing, Shanghai,<br />
Shenzhen and four cities in the Guangdong province. In order to expand<br />
our direct selling model into additional provinces, we currently must<br />
obtain a series of approvals from district, city, provincial and national<br />
government agencies with respect to each province in which we wish<br />
to expand. The process for obtaining the necessary government approvals<br />
to conduct direct selling continues to evolve. As we are being<br />
required to work with such a large number of provincial, city, district<br />
and national government authorities, we have found that it is taking<br />
more time than anticipated to work through the approval process with<br />
these authorities. The complexity of the approval process as well as<br />
the government’s continued cautious approach as direct selling develops<br />
in China makes it difficult to predict the timeline for obtaining<br />
these approvals. If the results of the government’s evaluation of our<br />
direct selling activities result in further delays in obtaining licenses<br />
elsewhere, or if the current processes for obtaining approvals are delayed<br />
further for any reason or are changed or are interpreted differently than<br />
currently understood, our ability to expand direct selling in China and<br />
our growth prospects in this market, could be negatively impacted.<br />
Our compensation plan and business model for our sales force in<br />
China differs from other markets and could harm our ability to grow<br />
our business in China.<br />
The direct selling regulations in China impose various limitations<br />
and requirements, including a prohibition on multi-level compensation<br />
and a required examination prior to becoming a distributor. The<br />
regulations also impose other restrictions on direct selling activities<br />
that differ from the regulations in our other markets. As a result, our<br />
direct selling compensation plan and business model for the direct<br />
sales component of our business differs from the model we use in<br />
other markets. There can be no assurance that these restrictions will<br />
not negatively impact our ability to provide an attractive business opportunity<br />
to distributors in this market and limit our ability to grow our<br />
business in this market. In addition, the regulations do not allow the<br />
sale of general foods through a direct selling business model. Because<br />
some of our supplements, including LifePak, are currently marketed<br />
as general foods pending approval as health foods these products<br />
cannot currently be approved for sale through our direct selling<br />
channel. Failure of these products to receive health food status or<br />
direct selling product approval in a timely manner could have a negative<br />
impact on our direct selling business.<br />
The loss of suppliers or shortages in ingredients could harm our<br />
business.<br />
We acquire ingredients and products from two suppliers that<br />
each currently manufactures a significant portion of our <strong>Nu</strong> <strong>Skin</strong> personal<br />
care products. In addition, we currently rely on two suppliers for<br />
a majority of Pharmanex nutritional supplement products. In the<br />
event we were to lose any of these suppliers and experience any difficulties<br />
in finding or transitioning to alternative suppliers, this could<br />
harm our business. In addition, we obtain some of our products from<br />
sole suppliers that own or control the product formulations, ingredients,<br />
or other intellectual property rights associated with such prod-<br />
21
ucts. These products include our Galvanic Spa System and True<br />
Face Essence Ultra products, two of our better selling products. We<br />
also license the right to distribute some of our products from third<br />
parties. In the event we are unable to renew these contracts, we may<br />
need to discontinue some products or develop substitute products,<br />
which could harm our revenue. In addition, if we experience supply<br />
shortages or regulatory impediments with respect to the raw materials<br />
and ingredients we use in our products, we may need to seek alternative<br />
supplies or suppliers and may experience difficulties in finding<br />
ingredients that are comparable in quality and price. Some of our<br />
nutritional products, including g3 juice, incorporate natural products<br />
that are only harvested once a year and may have limited supplies. If<br />
demand exceeds forecasts, we may have difficulties in obtaining additional<br />
supplies to meet the excess demand until the next growing<br />
season. If we are unable to successfully respond to such issues, our<br />
business could be harmed.<br />
Product diversion to certain markets, including China, may have a<br />
negative impact on our business.<br />
From time to time, we see our product being sold through online<br />
or other distribution channels in certain markets. Although we have<br />
taken steps to try to control this activity for products sold in China,<br />
this issue continues to be a significant challenge. Product diversion<br />
causes confusion regarding our distribution channels and negatively<br />
impacts our distributors’ ability to retail our products. It also creates a<br />
negative impression regarding the viability of the business opportunity<br />
for our distributors and sales representatives, which can harm our<br />
ability to recruit new distributors and sales representatives. In addition,<br />
in some cases, product diversion schemes may also involve illegal<br />
importation, investment or other activities. If we are unable to effectively<br />
address this issue or if diversion increases, our business could<br />
be harmed.<br />
Intellectual property rights are difficult to enforce in China.<br />
Chinese commercial law is relatively undeveloped compared to<br />
most of our other major markets, and, as a result, we may have limited<br />
legal recourse in the event we encounter significant difficulties with<br />
patent or trademark infringement or theft of trade secrets. Limited<br />
protection of intellectual property is available under Chinese law, and<br />
the local manufacturing of our products may subject us to an increased<br />
risk that unauthorized parties may attempt to copy or otherwise<br />
obtain or use our product formulations. As a result, we cannot<br />
assure that we will be able to adequately protect our intellectual<br />
property and product formulations.<br />
If our Galvanic Spa System or Pharmanex BioPhotonic Scanner are<br />
determined to be a medical device in a particular geographic<br />
market or if our distributors use it for medical purposes, our ability<br />
to continue to market and distribute such tools could be harmed.<br />
One of our strategies is to market unique and innovative products<br />
and tools that allow our distributors to distinguish our products,<br />
including the Galvanic Spa System and the Pharmanex BioPhotonic<br />
Scanner. We do not believe these products are medical devices.<br />
However, we have faced regulatory inquiries in Japan, South Korea,<br />
Indonesia, Taiwan, Singapore, Thailand and the United States regarding<br />
our Pharmanex BioPhotonic Scanner and/or our Galvanic<br />
Spa System. While we have successfully worked with regulators to<br />
resolve these matters in some markets, we have not been able to<br />
market the Galvanic Spa System as a cosmetic device in Taiwan, Indonesia,<br />
Thailand and Colombia, due to similar regulatory restrictions<br />
that have required us to register the Galvanic Spa System as a<br />
medical device. There have also been legislative proposals in Singapore<br />
and Malaysia relating to the regulation of medical devices that<br />
could affect the way we market the Galvanic Spa System and the<br />
Pharmanex BioPhotonic Scanner in these countries. Any determination<br />
in additional markets that the Galvanic Spa System or the Pharmanex<br />
BioPhotonic Scanner are medical devices or that distributors<br />
are using them to make medical claims or perform medical diagnoses<br />
or other activities limited to licensed professionals or approved medical<br />
devices could negatively impact our ability to use these products<br />
in a market. Regulatory scrutiny of a product could also dampen distributor<br />
enthusiasm and hinder the ability of distributors to effectively<br />
utilize such product.<br />
Where necessary, obtaining medical device registrations could<br />
require us to provide documentation concerning product manufacturing<br />
and clinical utility and to make design, specification and manufacturing<br />
process modifications to meet stringent standards imposed<br />
on medical device companies. We have registered, or are currently in<br />
the process of registering, the Galvanic Spa System as a medical device<br />
in Taiwan, Indonesia, Thailand and Colombia. Any difficulty, delay<br />
or inability to comply with regulatory requirements, including obtaining<br />
or maintaining any required registrations, in these markets<br />
may harm our business. In an effort to allow registration of the Galvanic<br />
Spa System in Taiwan and to update the registration in Indonesia,<br />
we are working with our vendor to obtain certification of its facilities<br />
for medical device manufacturing. There can be no assurance we<br />
will be able to provide the required medical device documentation,<br />
prove clinical utility in a manner sufficient to obtain medical device<br />
approval or make such changes promptly or in a manner that is satisfactory<br />
to regulatory authorities. If we obtain such medical device approval<br />
in order to sell a product in one market, such approval may be<br />
used as precedent to a claim that similar approval should be required<br />
in another market. Such additional requirements could negatively im-<br />
22
pact the cost associated with manufacturing the Galvanic Spa System<br />
and sale of the Galvanic Spa System as a non-medical device in<br />
those markets.<br />
Changes to our distributor compensation arrangements could be<br />
viewed negatively by some distributors, could fail to achieve desired<br />
long-term results and have a negative impact on revenue.<br />
Our distributor compensation plan includes some components<br />
that differ from market to market. We modify components of our<br />
compensation plan from time to time in an attempt to keep our compensation<br />
plan competitive and attractive to existing and potential<br />
distributors, to address changing market dynamics, to provide incentives<br />
to distributors that we believe will help grow our business, to<br />
conform to local regulations and to address other business needs.<br />
Because of the size of our distributor force and the complexity of our<br />
compensation plans, it is difficult to predict how such changes will be<br />
viewed by distributors and whether such changes will achieve their<br />
desired results. For example, certain changes we made to our compensation<br />
plan in 2005, which had been successful in several markets,<br />
did not achieve anticipated results in Japan, China and certain markets<br />
in Southeast Asia and negatively impacted our business.<br />
Our ability to conduct business, particularly in international markets,<br />
may be affected by political, legal, tax and regulatory risks.<br />
Our ability to capitalize on growth in new international markets<br />
and to maintain the current level of operations in our existing international<br />
markets is exposed to risks associated with our international<br />
operations, including:<br />
• the possibility that a foreign government might ban or severely<br />
restrict our business method of direct selling, or that local civil<br />
unrest, political instability or changes in diplomatic or trade<br />
relationships might disrupt our operations in an international<br />
market;<br />
• the lack of well-established or reliable legal systems in certain<br />
areas where we operate;<br />
• the presence of high inflation in the economies of international<br />
markets in which we operate;<br />
• the possibility that a government authority might impose legal,<br />
tax or other financial burdens on us or our distributors, due, for<br />
example, to the structure of our operations in various markets;<br />
and<br />
• the possibility that a government authority might challenge the<br />
status of our distributors as independent contractors or impose<br />
employment or social taxes on our distributors.<br />
Another risk associated with our international operations is the<br />
possibility that a foreign government may impose currency remittance<br />
restrictions. Due to the possibility of government restrictions<br />
on transfers of cash out of the country and control of exchange rates,<br />
we may not be able to immediately repatriate cash at the official exchange<br />
rate or if the official exchange rate devalues, it may have a<br />
material adverse effect on our business, results of operations and financial<br />
condition.<br />
Our international operations may also expose us to the risk that<br />
we violate the Foreign Corrupt Practices Act (“FCPA”) or related<br />
U.S. and foreign laws. Any determination that our operations or activities<br />
are not in compliance with existing laws or regulations could<br />
result in the imposition of substantial fines, civil and criminal penalties,<br />
equitable remedies, including disgorgement, injunctive relief and<br />
other sanctions against us or our personnel. In addition, other countries<br />
in which we do business may initiate their own investigations and<br />
impose similar sanctions. Should this be the case, there can be no<br />
assurance as to how the resulting consequences, if any, may impact<br />
our internal controls, business, reputation, results of operations or financial<br />
condition. One of our competitors has announced that it is<br />
investigating claims that its employees violated the FCPA in China<br />
and other markets. If this investigation causes adverse publicity or increased<br />
scrutiny of our industry, our business could be harmed.<br />
We are also subject to the interpretation and enforcement by<br />
governmental agencies of other foreign laws, rules, regulations or<br />
policies, including any changes thereto, such as restrictions on trade,<br />
import and export license requirements, privacy and data protection<br />
laws, and tariffs and taxes, which may require us to adjust our operations<br />
in certain markets where we do business. In addition, we face<br />
legal and regulatory risks in the United States and, in particular, cannot<br />
predict with certainty the outcome of various contingencies or<br />
the impact that pending or future legislative and regulatory changes<br />
may have on our business in the future.<br />
If we are unable to successfully expand and grow operations within<br />
developing markets, we may have difficulty achieving our long-term<br />
objectives.<br />
A significant percentage of our revenue growth over the past<br />
decade has been attributable to our expansion into new markets. Our<br />
growth over the next several years depends in part on our ability to<br />
successfully introduce products and tools, and to successfully implement<br />
initiatives in developing markets that will help generate growth.<br />
23
In addition to the regulatory difficulties we may face in introducing<br />
our products and initiatives in these markets, we could face difficulties<br />
in achieving acceptance of our premium-priced products in developing<br />
markets. In the past, we have struggled to operate profitably in<br />
developing markets. We may experience similar difficulty in our current<br />
and future new markets. If we are unable to successfully expand<br />
our operations within these developing markets, our opportunities to<br />
grow our business may be limited, and, as a result, we may not be able<br />
to achieve our long-term objectives.<br />
Adverse publicity concerning our business, marketing plan or products<br />
could harm our business and reputation.<br />
The size of our distribution force and the results of our operations<br />
can be particularly impacted by adverse publicity regarding us,<br />
the nature of our distributor network, our products or the actions of<br />
our distributors. Specifically, we are susceptible to adverse publicity<br />
concerning:<br />
• suspicions about the legality and ethics of network marketing;<br />
• the safety or effectiveness of ingredients in our or our competitors’<br />
products;<br />
• regulatory investigations of us, our competitors and our respective<br />
products;<br />
• the actions of our current or former distributors; and<br />
• public perceptions of the direct selling industry or the nutritional<br />
or personal care industry generally.<br />
For example, in <strong>2010</strong> we received a 60-day notice from a consumer<br />
group in California of its intent to file a citizen enforcement<br />
action under California Proposition 65, alleging that we failed to warn<br />
consumers of exposure to lead in four of our products. We are aware<br />
that a number of other nutritional companies have received similar<br />
notices and withdrawals from the same group. In <strong>2010</strong>, we also received<br />
a letter from the California Attorney General, alleging that<br />
one of our products contained lead in excess of the level allowed under<br />
California Proposition 65. If one or more of these products is<br />
found to be in violation of California Proposition 65, we may be required<br />
to reformulate the product, label the product in compliance<br />
with California Proposition 65 or, at our election, discontinue selling<br />
the product in California. We may also be required to pay civil fines.<br />
Although we believe we are in compliance with the requirements of<br />
California Proposition 65, any negative media attention or other adverse<br />
publicity created by these allegations, or any new or additional<br />
allegations, could negatively impact consumer and distributor perceptions<br />
of our products and harm our business.<br />
In addition, in the past we have experienced negative publicity<br />
that has harmed our business in connection with regulatory investigations<br />
and inquiries. Critics of our industry and other individuals who<br />
want to pursue an agenda, have in the past and may in the future<br />
utilize the internet, the press and other means to publish criticisms of<br />
the industry, our company and our competitors, or make allegations<br />
regarding our business and operations, or the business and operations<br />
of our competitors. We or others in our industry may receive<br />
similar negative publicity or allegations in the future, and it may harm<br />
our business and reputation.<br />
Any failure of our internal controls over financial reporting or our<br />
compliance efforts could harm our financial and operating results or<br />
result in fines or penalties if our employees or distributors violate<br />
any material laws or regulations.<br />
We have implemented internal controls to help ensure the accuracy<br />
of our financial reporting and have implemented compliance<br />
policies and programs to help ensure that our employees and distributors<br />
comply with applicable laws and regulations. Our internal<br />
audit team regularly audits our internal controls and various aspects<br />
of our business and we regularly assess the effectiveness of our internal<br />
controls. In addition, our independent external auditor audits our<br />
controls and provides its opinion regarding the effectiveness of our<br />
controls. There can be no assurance, however, that these internal or<br />
external assessments and audits will identify all significant or material<br />
weaknesses in our internal controls. If we fail to identify a material<br />
weakness or if we fail to correct any noted weakness there would be a<br />
risk that we may have to restate financial statements if the material<br />
weakness resulted in a material misstatement in our financial results.<br />
From time to time, we initiate further investigations into our<br />
business operations based on the results of these audits or complaints,<br />
questions, or allegations made by employees or other parties<br />
regarding our business practices and operations. In addition, our<br />
business and operations may be investigated by applicable government<br />
authorities. In the event any of these investigations identify material<br />
violations of applicable laws by our employees or distributors,<br />
we could be subject to adverse publicity, fines, penalties or loss of licenses<br />
or permits.<br />
Inability of new products and other initiatives to gain distributor and<br />
market acceptance could harm our business.<br />
Our ability to retain key and executive level distributors or to<br />
sponsor new executive distributors is critical to our success. Because<br />
our products are distributed exclusively through our distributors and<br />
we compete with other direct selling companies in attracting distributors,<br />
our operating results could be adversely affected if our existing<br />
and new business opportunities and incentives, products and other<br />
initiatives do not generate sufficient enthusiasm and economic incentive<br />
to retain our existing distributors or to sponsor new distributors<br />
24
on a sustained basis. Factors that could affect our ability to continue<br />
to introduce new products include, among others, government regulations,<br />
the inability to attract and retain qualified research and development<br />
staff, the termination of third-party research and collaborative<br />
arrangements, proprietary protections of competitors that may<br />
limit our ability to offer comparable products and the difficulties in<br />
anticipating changes in consumer tastes and buying preferences. In<br />
addition, in our more mature markets, one of the challenges we face<br />
is keeping distributor leaders with established businesses and high<br />
income levels motivated and actively engaged in business building<br />
activities and in developing new distributor leaders. There can be no<br />
assurance that our initiatives will continue to generate excitement<br />
among our distributors in the long-term or that planned initiatives will<br />
be successful in maintaining distributor activity and productivity or in<br />
motivating distributor leaders to remain engaged in business building<br />
and developing new distributor leaders. Some initiatives may have<br />
unanticipated negative impacts on our distributors, particularly<br />
changes to our compensation plan. The introduction of a new product<br />
or key initiative can also negatively impact other product lines to<br />
the extent our distributor leaders focus their efforts on the new product<br />
or initiative. In addition, if any of our products fail to gain distributor<br />
acceptance, we could see an increase in returns.<br />
The loss of key high-level distributors could negatively impact our<br />
distributor growth and our revenue.<br />
As of December 31, <strong>2010</strong>, we had a global network of approximately<br />
800,000 active distributors. Approximately 36,000 of our<br />
distributors were executive distributors. Approximately 480 distributors<br />
occupied the highest distributor level under our global compensation<br />
plan as of that date. These distributors, together with their extensive<br />
networks of downline distributors, generate substantially all of<br />
our revenue. As a result, the loss of a high-level distributor or a group<br />
of leading distributors in the distributor’s network of downline distributors,<br />
whether by their own choice or through disciplinary actions<br />
by us for violations of our policies and procedures, could negatively<br />
impact our distributor growth and our revenue.<br />
We are currently involved in disputes regarding customs assessments<br />
in Japan and any adverse rulings in these matters could require<br />
us to take charges to our earnings.<br />
We are currently involved in two separate disputes with the customs<br />
authorities in Japan with respect to duty assessments on several<br />
of our Pharmanex nutritional products totaling approximately 5.3<br />
billion Japanese yen as of December 31, <strong>2010</strong> (approximately $65.3<br />
million), net of any recovery of consumption taxes. We also recently<br />
were notified that we are likely to receive an additional assessment of<br />
0.6 billion Japanese yen (approximately $7.7 million) related to the<br />
second dispute.<br />
The first dispute relates to additional customs assessments made<br />
by Yokohama Customs for the period of October 2002 through July<br />
2005. The aggregate amount of these additional assessments is 2.7<br />
billion Japanese yen (approximately $33.2 million as of December 31,<br />
<strong>2010</strong>), net of any recovery of consumption taxes. The final hearing on<br />
this matter was held on February 1, 2011 and the court indicated it<br />
would issue a decision on this case on March 25, 2011. Either party has<br />
the right to appeal this decision. If we receive an adverse decision in<br />
this case, we may be required to record an expense for the full amount<br />
of the disputed assessments, or $33.2 million.<br />
The second dispute relates to additional customs assessments<br />
made by Yokohama Customs for the period of October 2006<br />
through November 2008 in connection with an audit in 2009, as well<br />
as the disputed portion of our current import duty rate we have been<br />
required to pay or hold in bond, and have paid under protest, since<br />
October of 2009. The aggregate amount of these additional assessments<br />
and disputed duties is 2.6 billion Japanese yen as of December<br />
31, <strong>2010</strong> (approximately $32.1 million), net of any recovery of consumption<br />
taxes. We were also recently notified that we are likely to be<br />
assessed an additional 0.6 billion Japanese yen (approximately $7.7<br />
million), net of any recovery of consumption taxes based on an audit<br />
of the period of November 2008 through September 2009. With this<br />
assessment, we have been required to pay or hold in bond amounts<br />
for all periods from October 2006 to present and we believe that<br />
additional assessments related to any prior period would be barred<br />
by applicable statutes of limitations. To the extent that we are unsuccessful<br />
in recovering the amounts assessed and paid or held in bond,<br />
we will likely be required to record an expense for the full amount of<br />
the disputed assessments, or $32.1 million as of December 31, <strong>2010</strong>.<br />
Government authorities may question our tax positions or transfer<br />
pricing policies or change their laws in a manner that could increase<br />
our effective tax rate or otherwise harm our business.<br />
As a U.S. company doing business in international markets<br />
through subsidiaries, we are subject to various tax and intercompany<br />
pricing laws, including those relating to the flow of funds between our<br />
company and our subsidiaries. From time to time, we are audited by<br />
tax regulators in the United States and in our foreign markets. If regulators<br />
challenge our tax positions, corporate structure, transfer pricing<br />
mechanisms or intercompany transfers, we may be subject to fines<br />
and payment of back taxes, our effective tax rate may increase and<br />
our operations may be harmed. Tax rates vary from country to country,<br />
and, if regulators determine that our profits in one jurisdiction may<br />
25
need to be increased, we may not be able to fully utilize all foreign tax<br />
credits that are generated, which will increase our effective tax rate.<br />
For example, our corporate income tax rate in the United States is<br />
35%. If our profitability in a higher tax jurisdiction, such as Japan where<br />
the corporate tax rate is currently set at 45%, increases disproportionately<br />
to the rest of our business, our effective tax rate may increase.<br />
The various customs, exchange control and transfer pricing laws are<br />
continually changing and are subject to the interpretation of government<br />
agencies. Despite our efforts to be aware of and comply with<br />
such laws and changes to and interpretations thereof, there is a risk<br />
that we may not continue to operate in compliance with such laws.<br />
We may need to adjust our operating procedures in response to such<br />
changes, and as a result, our business may suffer.<br />
In addition, due to the international nature of our business, we<br />
are subject from time to time to reviews and audits by the foreign<br />
taxing authorities of other jurisdictions in which we conduct business<br />
throughout the world.<br />
We may be held responsible for certain taxes or assessments relating<br />
to the activities of our distributors, which could harm our financial<br />
condition and operating results.<br />
Our distributors are subject to taxation, and in some instances,<br />
legislation or governmental agencies impose an obligation on us to<br />
collect taxes, such as value added taxes, and to maintain appropriate<br />
records. In addition, we are subject to the risk in some jurisdictions of<br />
being responsible for social security and similar taxes with respect to<br />
our distributors. In the event that local laws and regulations or the<br />
interpretation of local laws and regulations change to require us to<br />
treat our independent distributors as employees, or that our distributors<br />
are deemed by local regulatory authorities in one or more of<br />
the jurisdictions in which we operate to be our employees rather<br />
than independent contractors under existing laws and interpretations,<br />
we may be held responsible for social security and related<br />
taxes in those jurisdictions, plus any related assessments and penalties,<br />
which could harm our financial condition and operating results.<br />
If our distributors were deemed to be employees rather than independent<br />
contractors, we would also face the threat of increased vicarious<br />
liability for their actions.<br />
Production difficulties and quality control problems could harm our<br />
business.<br />
Production difficulties and quality control problems and our reliance<br />
on third party suppliers to deliver quality products in a timely<br />
manner could harm our business. Occasionally, we have experienced<br />
production difficulties with respect to our products, including the<br />
import or export of ingredients and delivery of products that do not<br />
meet our specifications and quality control standards. These quality<br />
problems have resulted in the past, and could result in the future, in<br />
stock outages or shortages in our markets with respect to such products,<br />
harming our sales and creating inventory write-offs for unusable<br />
products.<br />
Beginning with the 2009 launch of our ageLOC Transformation<br />
skin care system, we have launched new products globally on a condensed<br />
schedule, which has increased pressure on our supply chain. If<br />
we are not able to accurately forecast sales levels on a market by market<br />
basis, or are unable to produce a sufficient supply to meet such<br />
demand globally, we may incur higher expedited shipping costs and<br />
we may experience stockouts, which could negatively impact the enthusiasm<br />
of our distributors. However, if we over forecast demand for<br />
a global product launch, we could incur increased write-offs.<br />
The loss of or a disruption in our manufacturing and distribution<br />
operations could adversely affect our business.<br />
As of December 31, <strong>2010</strong>, our principal properties consist of distribution<br />
centers where offices are located and where finished merchandise<br />
is packed and shipped to distributors in fulfillment of their<br />
orders, our worldwide headquarters, three research and development<br />
facilities and 40 retail stores and manufacturing facilities in mainland<br />
China. Additionally, we also use third party manufacturers to manufacture<br />
certain of our products. As a company engaged in manufacturing,<br />
distribution and research and development on a global scale,<br />
we are subject to the risks inherent in such activities, including industrial<br />
accidents, environmental events, fires, strikes and other labor or<br />
industrial disputes, disruptions in logistics or information systems, loss<br />
or impairment of key manufacturing or distribution sites, product<br />
quality control, safety, licensing requirements and other regulatory or<br />
government issues, as well as natural disasters, pandemics, border<br />
disputes, acts of terrorism and other external factors over which we<br />
have no control. These risks may be exacerbated by our efforts to increase<br />
facility consolidation covering our manufacturing, distribution<br />
and supply footprints or if we are unable to successfully enhance our<br />
disaster recovery planning. The loss of, or damage to, any of our facilities<br />
or centers, or that of our third party manufacturers could have<br />
a material adverse effect on our business, results of operations and<br />
financial condition.<br />
Disruptions to transportation channels that we use to distribute our<br />
products to international warehouses may adversely affect our margins<br />
and profitability in those markets.<br />
We may experience disruptions to the transportation channels<br />
used to distribute our products, including increased airport and shipping<br />
port congestion, a lack of transportation capacity, increased fuel<br />
expenses, and a shortage of manpower. Disruptions in our container<br />
shipments may result in increased costs, including the additional use<br />
of airfreight to meet demand. Although we have not recently experienced<br />
significant shipping disruptions, we continue to watch for signs<br />
of upcoming congestion. Congestion to ports can affect previously<br />
26
negotiated contracts with shipping companies, resulting in unexpected<br />
increases in shipping costs and reduction in our net sales.<br />
We depend on our key personnel, and the loss of the services provided<br />
by any of our executive officers or other key employees could<br />
harm our business and results of operations.<br />
Our success depends to a significant degree upon the continued<br />
contributions of our senior management, many of whom would<br />
be difficult to replace. In addition, expatriates serve in key management<br />
positions in several of our foreign markets, including Japan and<br />
China. These employees may voluntarily terminate their employment<br />
with us at any time. We may not be able to successfully retain<br />
existing personnel or identify, hire and integrate new personnel. We<br />
do not carry key person insurance for any of our personnel. Although<br />
we have signed offer letters or written agreements summarizing the<br />
compensation terms for some of our senior executives, we have generally<br />
not entered into formal employment agreements with our executive<br />
officers. If we lose the services of our executive officers or key<br />
employees for any reason, our business, financial condition and results<br />
of operations could be harmed.<br />
Our markets are intensely competitive, and market conditions and<br />
the strengths of competitors may harm our business.<br />
The markets for our products are intensely competitive. Our results<br />
of operations may be harmed by market conditions and competition<br />
in the future. Many competitors have much greater name recognition<br />
and financial resources than we have, which may give them a<br />
competitive advantage. For example, our <strong>Nu</strong> <strong>Skin</strong> products compete<br />
directly with branded, premium retail products. We also compete with<br />
other direct selling organizations. Some of the leading direct selling<br />
companies in our existing markets are Herbalife, Mary Kay, Oriflame,<br />
Melaleuca, Avon and Amway. Because of regulatory restrictions concerning<br />
claims about the efficacy of personal care products and dietary<br />
supplements, we may have difficulty differentiating our products<br />
from our competitors’ products, and competing products entering the<br />
personal care and nutritional market could harm our revenue.<br />
We also compete with other network marketing companies for<br />
distributors. Some of these competitors have a longer operating history<br />
and greater visibility, name recognition and financial resources<br />
than we do. Some of our competitors have also adopted and could<br />
continue to adopt some of our successful business strategies, including<br />
our global compensation plan for distributors. Consequently, to<br />
successfully compete in this market and attract and retain distributors,<br />
we must ensure that our business opportunities and compensation<br />
plans are financially rewarding. We are beginning our 27th year in<br />
this industry and believe we have significant competitive advantages,<br />
but we cannot assure you that we will be able to successfully compete<br />
in every endeavor in this market.<br />
Any future acquisitions may expose us to additional risks.<br />
From time to time we review acquisition prospects that would<br />
complement our current product offerings, increase the size and<br />
geographic scope of our operations or otherwise offer growth and<br />
operating efficiency opportunities. The financing for any of these acquisitions<br />
could dilute the interests of our stockholders, result in an<br />
increase in our indebtedness or both. Acquisitions may entail numerous<br />
risks, including:<br />
• difficulties in assimilating acquired operations or products, including<br />
the loss of key employees from acquired businesses<br />
and disruption to our direct selling channel;<br />
• diversion of management’s attention from our core business;<br />
• adverse effects on existing business relationships with suppliers<br />
and customers; and<br />
• risks of entering markets in which we have limited or no prior<br />
experience.<br />
Our failure to successfully complete the integration of any acquired<br />
business could have a material adverse effect on our business,<br />
financial condition and operating results. In addition, there can be no<br />
assurance that we will be able to identify suitable acquisition candidates<br />
or consummate acquisitions on favorable terms.<br />
Product liability claims could harm our business.<br />
We may be required to pay for losses or injuries purportedly or<br />
actually caused by our products. Although historically we have had a<br />
very limited number and relatively low financial exposure from product<br />
claims, we have experienced difficulty in finding insurers that are willing<br />
to provide product liability coverage at reasonable rates due to insurance<br />
industry trends and the rising cost of insurance generally. As a result,<br />
we have elected to self-insure our product liability risks for our<br />
product lines. Until we elect and are able at reasonable rates to obtain<br />
product liability insurance, if any of our products are found to cause any<br />
injury or damage, we will be subject to the full amount of liability associated<br />
with any injuries or damages. This liability could be substantial and<br />
may exceed our reserves. We cannot predict if and when product liability<br />
insurance will be available to us on reasonable terms.<br />
We are involved, and may become involved in the future, in legal<br />
proceedings that, if adversely adjudicated or settled, could adversely<br />
affect our financial results.<br />
We are and may in the future become party to litigation. In general,<br />
litigation claims can be expensive and time consuming to bring<br />
or defend against and could result in settlements or damages that<br />
could significantly affect financial results. We are currently vigorously<br />
contesting certain of these litigation claims. However, it is not possi-<br />
27
le to predict the final resolution of the litigation to which we currently<br />
are or may in the future become party to, and the impact of<br />
certain of these matters on our business, results of operations and financial<br />
condition could be material.<br />
Our intellectual property may infringe on the rights of others,<br />
resulting in costly litigation. In recent years, there has been significant<br />
litigation in the United States involving patents and other intellectual<br />
property rights. In particular, there has been an increase in the filing of<br />
suits alleging infringement of intellectual property rights, which pressure<br />
defendants into entering settlement arrangements quickly to<br />
dispose of such suits, regardless of their merit. Other companies or<br />
individuals may allege that we, our customers, licensees or other parties<br />
indemnified by us infringe on their intellectual property rights.<br />
Even if we believe that such claims are without merit, defending such<br />
intellectual property litigation can be costly, distract management’s<br />
attention and resources, and the outcome is inherently uncertain.<br />
Claims of intellectual property infringement also might require us to<br />
redesign affected products, enter into costly settlement or license<br />
agreements, pay costly damage awards, or face a temporary or permanent<br />
injunction prohibiting us from marketing or selling certain of<br />
our products. Any of these results may adversely affect our financial<br />
condition.<br />
If we are unable to protect our intellectual property rights, our ability<br />
to compete could be negatively impacted.<br />
The market for our products depends to a significant extent<br />
upon the value associated with our product innovations and our brand<br />
equity. We rely upon patent, copyright, trademark and trade secret<br />
laws in the United States and similar laws in other countries, and nondisclosure,<br />
confidentiality and other types of agreements with our employees,<br />
customers, suppliers and other parties, to establish, maintain<br />
and enforce our intellectual property rights. Despite these measures,<br />
any of our intellectual property rights could be challenged, invalidated,<br />
circumvented or misappropriated, or such intellectual property rights<br />
may not be sufficient to permit us to provide competitive advantages,<br />
which could result in costly product redesign efforts, discontinuance of<br />
certain product offerings or other competitive harm. In addition, the<br />
laws of certain foreign countries, including many emerging markets,<br />
may not protect our intellectual property rights to the same extent as<br />
the laws of the United States. The costs required to protect our patents<br />
and trademarks may be substantial. We have filed patent applications<br />
to protect our intellectual property rights in our new technologies,<br />
however, there can be no assurance that our patent applications<br />
will be approved, that any patents issued will adequately protect our<br />
intellectual property, or that such patents will not be challenged by<br />
third parties or found by a judicial authority to be invalid or unenforceable.<br />
Moreover, many of our products rely on technologies developed<br />
or licensed by third parties, and we may not be able to obtain or continue<br />
to obtain licenses and technologies from these third parties at all<br />
or on reasonable terms.<br />
In order to protect or enforce and protect our intellectual property<br />
rights, we may initiate litigation against third parties, such as patent<br />
infringement suits or interference proceedings. Any lawsuits that<br />
we initiate could be expensive, take significant time and divert management’s<br />
attention from other business concerns. Litigation also<br />
puts our patents at risk of being invalidated or interpreted narrowly<br />
and our patent applications at risk of not issuing. Additionally, we may<br />
provoke third parties to assert claims against us. We may not prevail<br />
in any lawsuits that we initiate and the damages or other remedies<br />
awarded, if any, may not be commercially valuable. The occurrence of<br />
any of these events may adversely affect our financial condition.<br />
If we are unable to protect the confidentiality of our proprietary information<br />
and know-how, the value of our products could be adversely<br />
affected.<br />
In addition to patented technology, we rely on our unpatented<br />
proprietary technology, trade secrets, processes and know-how. Despite<br />
these measures, any of our intellectual property rights could,<br />
however, be challenged, invalidated, circumvented or misappropriated.<br />
We generally seek to protect this information by confidentiality,<br />
non-disclosure and assignment of invention agreements with our<br />
employees, consultants, scientific advisors and third parties. Our employees<br />
may leave to work for competitors. These agreements may<br />
be breached, and we may not have adequate remedies for any such<br />
breach. In addition, our trade secrets may be disclosed to or otherwise<br />
become known or be independently developed by competitors.<br />
To the extent that our current or former employees, consultants or<br />
contractors use intellectual property owned by others in their work<br />
for us, disputes may arise as to the rights in related or resulting knowhow<br />
and inventions. If, for any of the above reasons, our intellectual<br />
property is disclosed or misappropriated, it would harm our ability to<br />
protect our rights and adversely affect our financial condition.<br />
We may be subject to claims that our employees or we have inadvertently<br />
or otherwise used or disclosed alleged trade secrets or other<br />
proprietary information of former employers of our employees.<br />
We employ individuals who were previously employed at other<br />
personal care product or nutritional supplement companies, including<br />
our competitors or potential competitors. To the extent that our<br />
employees are involved in research areas that are similar to those in<br />
which they were involved with their former employers, we may be<br />
subject to claims that such employees have inadvertently or otherwise<br />
used or disclosed the alleged trade secrets or other proprietary<br />
information of the former employers. Litigation may be necessary to<br />
defend against such claims.<br />
28
System failures could harm our business.<br />
Because of our diverse geographic operations and our complex<br />
distributor compensation plan, our business is highly dependent on<br />
efficiently functioning information technology systems. These systems<br />
and operations are vulnerable to damage or interruption from<br />
fires, earthquakes, telecommunications failures and other events.<br />
They are also subject to break-ins, sabotage, intentional acts of vandalism<br />
and similar misconduct. We have adopted and implemented<br />
a Business Continuity/Disaster Recovery Plan. Our primary data sets<br />
are archived and stored at third-party secure sites. We have set up a<br />
recovery site for certain critical data and operations related to our distributors<br />
and we are currently setting up a recovery site for certain<br />
other critical data and operations. Despite these precautions, the occurrence<br />
of a natural disaster or other unanticipated problems could<br />
result in interruptions in services and reduce our revenue and profits.<br />
Epidemics and other global health risks could negatively impact our<br />
business.<br />
Our revenue was negatively impacted in 2003 by the SARS<br />
epidemic that hit Asia during that year. It is difficult to predict the<br />
impact on our business, if any, of a recurrence of SARS, or the emergence<br />
of new epidemics, such as avian flu or H1N1 flu. Although such<br />
events could generate increased sales of health and immune supplements<br />
and certain personal care products, our direct selling and retail<br />
activities and results of operations could be harmed if the fear of any<br />
communicable and rapidly spreading disease results in travel restrictions<br />
or causes people to avoid group meetings or gatherings or interaction<br />
with other people. In addition, most of our Pharmanex nutritional<br />
supplement revenue is generated from products that are<br />
encapsulated in bovine- and/or porcine-sourced gel capsules. If we<br />
experience production difficulties, quality control problems, or shortages<br />
in supply in connection with bovine or porcine related health<br />
concerns, this could result in additional risk of product shortages or<br />
write-offs of inventory that no longer can be used. We may be unable<br />
to introduce our products in some markets if we are unable to obtain<br />
the necessary regulatory approvals or if any product ingredients are<br />
prohibited, which could harm our business.<br />
The market price of our Class A common stock is subject to significant<br />
fluctuations due to a number of factors that are beyond<br />
our control.<br />
Our Class A common stock closed at $9.64 per share on February<br />
2, 2009 and closed at $31.21 per share on February 1, 2011. During<br />
this two-year period, our Class A common stock traded as low as<br />
$7.90 per share and as high as $33.99 per share. Many factors could<br />
cause the market price of our Class A common stock to fall. Some of<br />
these factors include:<br />
• fluctuations in our quarterly operating results;<br />
• the sale of shares of Class A common stock by our original or<br />
significant stockholders;<br />
• general trends in the market for our products;<br />
• acquisitions by us or our competitors;<br />
• economic and/or currency exchange issues in markets in which<br />
we operate;<br />
• changes in estimates of our operating performance or changes<br />
in recommendations by securities analysts; and<br />
• general business and political conditions.<br />
Broad market fluctuations could also lower the market price of<br />
our Class A common stock regardless of our actual operating performance.<br />
If our stockholders sell a substantial number of shares of our Class A<br />
common stock in the public market, the market price of our Class A<br />
common stock could fall.<br />
Several of our principal stockholders hold a large number of<br />
shares of the outstanding Class A common stock. Some of the original<br />
stockholders have actively sold shares during the last year. Additional<br />
sales by these stockholders or a decision by any of the other<br />
principal stockholders to aggressively sell shares could depress the<br />
market price of our Class A common stock. As of December 31,<br />
<strong>2010</strong>, we had approximately 62.1 million shares of Class A common<br />
stock outstanding.<br />
ITEM 1B.<br />
None.<br />
ITEM 2.<br />
UNRESOLVED STAFF COMMENTS<br />
PROPERTIES<br />
Our principal properties consist of the following:<br />
Operational Facilities. These facilities include administrative offices,<br />
walk-in centers, and warehouse/distribution centers. Our operational<br />
facilities measuring 30,000 square feet or more include the<br />
following:<br />
• our worldwide headquarters in Provo, Utah;<br />
• our worldwide distribution center/warehouse in Provo, Utah; and<br />
• our distribution center in Tokyo, Japan.<br />
29
Manufacturing Facilities. Each of our manufacturing facilities<br />
measure 30,000 square feet or more, and include the following:<br />
• our nutritional supplement manufacturing facility in Zhejiang<br />
Province, China;<br />
• our personal care manufacturing facility in Shanghai, China;<br />
• our Vitameal manufacturing facility in Jixi, Heilongjiang Province;<br />
• our herbal extraction facility in Zhejiang Province.<br />
Retail Stores. As of December 31, <strong>2010</strong>, we operated 40 stores<br />
throughout China.<br />
Research and Development Centers. We operate three research<br />
and development centers, one in Provo, Utah, one in Shanghai,<br />
China, and one in Beijing, China. We are currently in the design<br />
phase of building a state-of-the-art innovation center adjacent to our<br />
corporate headquarters. We believe this facility will cost approximately<br />
$85 million and will take roughly two years to complete.<br />
We own our corporate headquarters buildings, distribution center<br />
and research and development center located in Provo, Utah. We<br />
also own our nutritional supplement plant in China, and a few other<br />
minor facilities. We currently lease the other properties described<br />
above. We believe that our existing and planned facilities are adequate<br />
for our current operations in each of our existing markets.<br />
ITEM 3.<br />
LEGAL PROCEEDINGS<br />
Due to the international nature of our business, we are subject from<br />
time to time to reviews and audits by the foreign taxing authorities of<br />
the various jurisdictions in which we conduct business throughout the<br />
world. We are currently involved in two separate disputes with the customs<br />
authorities in Japan with respect to duty assessments on several<br />
of our Pharmanex nutritional products totaling approximately 5.3 billion<br />
Japanese yen as of December 31, <strong>2010</strong> (approximately $65.3 million),<br />
net of any recovery of consumption taxes. We also recently were notified<br />
that we are likely to receive an additional assessment of 0.6 billion Japanese<br />
yen (approximately $7.7 million) related to the second dispute.<br />
The first dispute relates to additional customs assessments made<br />
by Yokohama Customs for the period of October 2002 through July<br />
2005. The aggregate amount of these additional assessments is 2.7<br />
billion Japanese yen (approximately $33.2 million as of December 31,<br />
<strong>2010</strong>), net of any recovery of consumption taxes. The dispute relates to<br />
whether we used the proper valuation method for these products in<br />
determining the applicable customs duties. The primary legal issue in<br />
the case is whether the relevant import transaction is a sale between<br />
our third party manufacturers and our Japan subsidiary, or a sale between<br />
our US subsidiary and our Japan subsidiary. In 1999, we worked with the<br />
Yokohama Customs authorities to restructure the form of the relevant<br />
transactions in order to have the import transaction be a sale between<br />
our third party manufacturers and our Japan subsidiary, and thus have<br />
the duties assessed on the price paid to our third party manufacturers.<br />
With the input and guidance of the Yokohama Customs authorities, we<br />
restructured the form of the transaction and the agreements between<br />
the relevant parties based on these discussions so that our US subsidiary<br />
would be acting on behalf of our Japan subsidiary with respect to the<br />
purchase of these products rather than as a buyer/seller. Our Japan<br />
subsidiary entered into a Memorandum of Understanding with each of<br />
our third party manufacturers of the relevant products, which provided<br />
that our Japan subsidiary was the purchaser of the products and that<br />
our US subsidiary was acting for and on behalf of our Japan subsidiary<br />
with respect to these products. Our Japan subsidiary also entered into<br />
a Memorandum of Understanding with our US subsidiary documenting<br />
the same agency relationship. We believe that these legal documents<br />
establish that our US subsidiary was acting as an agent and not buyer<br />
and seller of the relevant products. The additional assessment of duties<br />
by Yokohama Customs was based on its re-characterization of the<br />
transaction as a sale between our US subsidiary and our Japan subsidiary<br />
for custom law purposes despite the legal form of the transaction.<br />
We do not believe the legal documentation supports the re-characterization<br />
of these transactions. Yokohama Customs has raised several<br />
issues to support its re-characterization, including the fact that we have<br />
treated the relevant transaction as a sale between our US subsidiary<br />
and Japan subsidiary for income tax purposes. However, we believe that<br />
the relevant income tax and transfer pricing rules and regulations apply<br />
different standards and are not relevant to the customs issue. Because<br />
we believe that the legal documentation for these transactions support<br />
our position, we filed a complaint in the Tokyo District Court Civil Action<br />
Section in December 2006 to have the Ministry of Finance’s affirmation<br />
of the additional assessments reversed. The final hearing on<br />
this matter was held on February 1, 2011 and the court indicated it would<br />
issue a decision on this case on March 25, 2011. Either party has the right<br />
to appeal this decision. If we receive an adverse decision in this case, we<br />
may be required to record an expense for the full amount of the disputed<br />
assessments, or $33.2 million.<br />
The second dispute relates to additional customs assessments made<br />
by Yokohama Customs for the period of October 2006 through November<br />
2008 in connection with an audit in 2009, as well as the disputed<br />
portion of our current import duty rate we have been required to<br />
pay or hold in bond, and have paid under protest, since October of 2009.<br />
The aggregate amount of these additional assessments and disputed<br />
duties is 2.6 billion Japanese yen as of December 31, <strong>2010</strong> (approximately<br />
$32.1 million), net of any recovery of consumption taxes. We were<br />
also recently notified that we are likely to be assessed an additional 0.6<br />
billion Japanese yen (approximately $7.7 million), net of any recovery of<br />
30
consumption taxes based on an audit of the period of November 2008<br />
through September 2009. With this assessment, we have been required<br />
to pay or hold in bond amounts for all periods from October 2006 to<br />
present and we believe that additional assessments related to any prior<br />
period would be barred by applicable statutes of limitations. In July<br />
2005, we changed our operating structure in Japan and believed that<br />
these changes would eliminate further valuation disputes with Yokohama<br />
Customs as the new structure eliminated the issues that were the<br />
basis of the litigation in the first dispute (i.e., whether our US subsidiary<br />
was acting as an agent for our Japan subsidiary or was acting as the<br />
seller). However, in October 2009 we received notice from Yokohama<br />
Customs authorities that they were assessing additional duties, penalties<br />
and interest for the period of October 2006 through November<br />
2008 based on their view that we were not utilizing the proper valuation<br />
method. The basis for such additional assessment is different from the<br />
issues that are being litigated in the first dispute. The issue in this second<br />
case is whether a US entity utilizing a commissionaire agent in Japan<br />
to import its products can use the manufacturer’s invoice or must use<br />
another valuation method, and, if an alternative method must be used,<br />
what the allowable deductions would be in determining the proper<br />
valuation. Following our review of the assessments and after consulting<br />
with our legal and customs advisors, we believe that the additional assessments<br />
are improper and are not supported by applicable customs<br />
laws. We filed letters of protest with Yokohama Customs, which were<br />
rejected. We have appealed the matter to the Ministry of Finance in<br />
Japan. In addition, we are currently being required to post a bond or<br />
make a deposit equal to the difference between our declared duties and<br />
the amount the customs authorities have determined we should be<br />
paying on all current imports. Because we believe that the higher rate<br />
determined by the customs authorities is an improper application of the<br />
regulations, we are currently expensing the portion of the duties we<br />
believe is supported under applicable customs law, and recording the<br />
additional deposit or payment as a receivable within long-term assets<br />
in our consolidated financial statements. To the extent that we are unsuccessful<br />
in recovering the amounts assessed and paid or held in bond,<br />
we will likely be required to record an expense for the full amount of the<br />
disputed assessments, or $32.1 million as of December 31, <strong>2010</strong>.<br />
ITEM 4.<br />
[REMOVED AND RESERVED]<br />
PART II<br />
ITEM 5.<br />
MARKET FOR REGISTRANT’S<br />
COMMON EQUITY, RELATED<br />
STOCKHOLDER MATTERS AND<br />
ISSUER PURCHASES OF EQUITY<br />
SECURITIES<br />
Our Class A common stock is listed on the New York Stock Exchange<br />
(“NYSE”) and trades under the symbol “NUS.” The following<br />
table is based upon the information available to us and sets forth<br />
the range of the high and low sales prices for our Class A common<br />
stock for the quarterly periods during 2009 and <strong>2010</strong> based upon<br />
quotations on the NYSE.<br />
Quarter Ended High Low<br />
March 31, 2009 . . . . . . . . . . . . . $ 11.56 $ 7.90<br />
June 30, 2009 . . . . . . . . . . . . . . 15.70 10.05<br />
September 30, 2009. . . . . . . . 18.80 14.69<br />
December 31, 2009 . . . . . . . . . 28.78 18.23<br />
Quarter Ended High Low<br />
March 31, <strong>2010</strong> . . . . . . . . . . . . . . $ 30.23 $ 22.86<br />
June 30, <strong>2010</strong> . . . . . . . . . . . . . . . 33.99 23.12<br />
September 30, <strong>2010</strong> . . . . . . . . 29.87 23.55<br />
December 31, <strong>2010</strong> . . . . . . . . . 32.72 28.24<br />
The market price of our Class A common stock is subject to<br />
significant fluctuations in response to variations in our quarterly operating<br />
results, general trends in the market for our products and product<br />
candidates, economic and currency exchange issues in the foreign<br />
markets in which we operate and other factors, many of which<br />
are not within our control. In addition, broad market fluctuations, as<br />
well as general economic, business, regulatory and political conditions<br />
may adversely affect the market for our Class A common stock,<br />
regardless of our actual or projected performance.<br />
The closing price of our Class A common stock on February 1,<br />
2011, was $31.21. The approximate number of holders of record of our<br />
Class A common stock as of February 1, 2011 was 626. This number of<br />
holders of record does not represent the actual number of beneficial<br />
owners of shares of our Class A common stock because shares are<br />
frequently held in “street name” by securities dealers and others for the<br />
benefit of individual owners who have the right to vote their shares.<br />
DIVIDENDS<br />
We declared and paid a $0.115 per share dividend for Class A common<br />
stock in March, June, September and December of 2009, and a<br />
$0.125 per share quarterly dividend for Class A common stock in March,<br />
June, September and December of <strong>2010</strong>. The board of directors has<br />
approved an increased quarterly cash dividend of $0.135 per share of<br />
Class A common stock to be paid on March 16, 2011, to stockholders of<br />
record on February 25, 2011. <strong>Annual</strong>ly, this would increase the dividend<br />
to $0.54 from $0.50 in the prior year. Management believes that cash<br />
flows from operations will be sufficient to fund this and future dividend<br />
payments, if any.<br />
31
We expect to continue to pay dividends on our common stock. However, the declaration of dividends is subject to the discretion of our board<br />
of directors and will depend upon various factors, including our net earnings, financial condition, cash requirements, future prospects and other factors<br />
deemed relevant by our board of directors.<br />
Purchases of Equity Securities by the Issuer<br />
(a) (b) (c) (d)<br />
Total <strong>Nu</strong>mber of Shares<br />
Purchased as Part of<br />
Publicly Announced<br />
Plans or Programs<br />
Approximate Dollar Value<br />
of Shares that may yet be<br />
Purchased Under the<br />
Plans or Programs<br />
(in millions) (1)<br />
Total <strong>Nu</strong>mber<br />
Period<br />
of Shares<br />
Purchased<br />
Average Price<br />
Paid per Share<br />
October 1 – 31, <strong>2010</strong> . . . . . . . . . . . . . . . 12,649 $ 29.21 10,500 $ 160.8<br />
November 1 – 30, <strong>2010</strong> . . . . . . . . . . . . 105,000 30.80 105,000 157.6<br />
December 1 – 31, <strong>2010</strong> . . . . . . . . . . . . 157,446 31.29 146,000 153.6<br />
Total . . . . . . . . . . . . . . . . . . . . . . . . . . . . . 275,095 (2) 31.01 261,500<br />
(1)<br />
In August 1998, our board of directors approved a plan to repurchase $10.0 million of our Class A common stock on the open market or in private transactions. Our board has<br />
from time to time increased the amount authorized under the plan, including a $150.0 million increase in June <strong>2010</strong>. A total amount of approximately $485.0 million is currently<br />
authorized under the plan. As of December 31, <strong>2010</strong>, $153.6 million was available for repurchases under the stock repurchase program. There has been no termination or expiration<br />
of the plan since the initial date of approval.<br />
(2)<br />
We have authorized the repurchase of shares acquired by our employees and distributors in certain foreign markets because of regulatory and other issues that make it difficult<br />
or costly for these persons to sell such shares in the open market. These shares were awarded or acquired in connection with our initial public offering in 1996. Of the shares listed<br />
in this column, 2,149 shares in October at an average price per share of $31.79 and 11,446 shares in December at an average price per share of $31.61, relate to repurchases from<br />
such employees and distributors.<br />
32
STOCK PERFORMANCE GRAPH<br />
Set forth below is a line graph comparing the cumulative total stockholder return (stock price appreciation plus dividends) on the Class A<br />
Common Stock with the cumulative total return of the S&P 500 Index, a market-weighted index of publicly traded peers (“Peer Group”) for<br />
the period from December 31, 2005 through December 31, <strong>2010</strong>. The graph assumes that $100 is invested in each of the Class A Common<br />
Stock, the S&P 500 Index, and each of the indexes of publicly traded peers on December 31, 2005 and that all dividends were reinvested. The<br />
Peer Group consists of all of the following companies, which compete in our industry and product categories: Avon Products, Inc., Estee<br />
Lauder, Tupperware Corporation, Herbalife LTD., USANA Health Sciences, Inc. and Alberto Culver Co.<br />
250<br />
200<br />
DOLLARS<br />
150<br />
100<br />
50<br />
0<br />
12/05 12/06 12/07 12/08 12/09 12/10<br />
NU SKIN ENTERPRISES, INC. S&P 500 PEER GROUP<br />
Measured Period Company S&P 500 Index Peer Group Index<br />
December 31, 2005 $ 100.00 $ 100.00 $ 100.00<br />
December 31, 2006 106.04 115.80 120.23<br />
December 31, 2007 98.02 122.16 140.08<br />
December 31, 2008 64.16 76.96 94.79<br />
December 31, 2009 170.40 97.33 138.61<br />
December 31, <strong>2010</strong> 195.34 111.99 169.10<br />
33
ITEM 6.<br />
SELECTED FINANCIAL DATA<br />
The following selected consolidated financial data as of and for the years ended December 31, 2006, 2007, 2008, 2009 and <strong>2010</strong> have been<br />
derived from the audited consolidated financial statements.<br />
Year Ended December 31,<br />
2006 2007 2008 2009 <strong>2010</strong><br />
(U.S. dollars in thousands, except per share data and cash dividends)<br />
Income Statement Data:<br />
Revenue . . . . . . . . . . . . . . . . . . . . . . . . . . . . . . . . . . . . . . . . . . . . . . . . . . . . $ 1,115,409 $ 1,157,667 $ 1,247,646 $ 1,331,058 $ 1,537,259<br />
Cost of sales . . . . . . . . . . . . . . . . . . . . . . . . . . . . . . . . . . . . . . . . . . . . . . . 195,203 209,283 228,597 243,648 272,431<br />
Gross profit . . . . . . . . . . . . . . . . . . . . . . . . . . . . . . . . . . . . . . . . . . . . . . . . . 920,206 948,384 1,019,049 1,087,410 1,264,828<br />
Operating expenses:<br />
<strong>Selling</strong> expenses . . . . . . . . . . . . . . . . . . . . . . . . . . . . . . . . . . . . . . . . . . 482,931 499,095 533,151 559,605 646,348<br />
General and administrative expenses . . . . . . . . . . . . . . . . . . . . 350,617 358,601 360,470 369,368 401,418<br />
Restructuring charges . . . . . . . . . . . . . . . . . . . . . . . . . . . . . . . . . . . . 11,115 19,775 — 10,724 —<br />
Impairment of assets and other . . . . . . . . . . . . . . . . . . . . . . . . . . 20,840 — — — —<br />
Total operating expenses . . . . . . . . . . . . . . . . . . . . . . . . . . . . . . . 865,503 877,471 893,621 939,697 1,047,766<br />
Operating income . . . . . . . . . . . . . . . . . . . . . . . . . . . . . . . . . . . . . . . . . 54,703 70,913 125,428 147,713 217,062<br />
Other income (expense), net . . . . . . . . . . . . . . . . . . . . . . . . . . . . . . (2,027) (2,435) (24,775) (6,589) (9,449)<br />
Income before provision for income taxes . . . . . . . . . . . . . . . . . 52,676 68,478 100,653 141,124 207,613<br />
Provision for income taxes . . . . . . . . . . . . . . . . . . . . . . . . . . . . . . . . . 19,859 24,606 35,306 51,279 71,562<br />
Net income . . . . . . . . . . . . . . . . . . . . . . . . . . . . . . . . . . . . . . . . . . . . . . . . . $ 32,817 $ 43,872 $ 65,347 $ 89,845 $ 136,051<br />
Net income per share:<br />
Basic . . . . . . . . . . . . . . . . . . . . . . . . . . . . . . . . . . . . . . . . . . . . . . . . . . . . . . $ 0.47 $ 0.68 $ 1.03 $ 1.42 $ 2.18<br />
Diluted . . . . . . . . . . . . . . . . . . . . . . . . . . . . . . . . . . . . . . . . . . . . . . . . . . . . $ 0.47 $ 0.67 $ 1.02 $ 1.40 $ 2.11<br />
Weighted-average common shares outstanding (000s):<br />
Basic . . . . . . . . . . . . . . . . . . . . . . . . . . . . . . . . . . . . . . . . . . . . . . . . . . . . . . 69,418 64,783 63,510 63,333 62,370<br />
Diluted . . . . . . . . . . . . . . . . . . . . . . . . . . . . . . . . . . . . . . . . . . . . . . . . . . . . 70,506 65,584 64,132 64,296 64,547<br />
Balance Sheet Data (at end of period):<br />
Cash and cash equivalents and current investments . . . . . . $ 121,353 $ 92,552 $ 114,586 $ 158,045 $ 230,337<br />
Working capital . . . . . . . . . . . . . . . . . . . . . . . . . . . . . . . . . . . . . . . . . . . . 109,418 95,175 124,036 152,731 206,078<br />
Total assets . . . . . . . . . . . . . . . . . . . . . . . . . . . . . . . . . . . . . . . . . . . . . . . . . 664,849 683,243 709,772 748,449 892,224<br />
Current portion of long-term debt . . . . . . . . . . . . . . . . . . . . . . . . 26,652 31,441 30,196 35,400 27,865<br />
Long-term debt . . . . . . . . . . . . . . . . . . . . . . . . . . . . . . . . . . . . . . . . . . . . 136,173 169,229 158,760 121,119 133,013<br />
Stockholders’ equity . . . . . . . . . . . . . . . . . . . . . . . . . . . . . . . . . . . . . . . . 318,980 275,009 316,180 375,687 471,249<br />
Cash dividends declared . . . . . . . . . . . . . . . . . . . . . . . . . . . . . . . . . . . 0.40 0.42 0.44 0.46 0.50<br />
Supplemental Operating Data (at end of period):<br />
Approximate number of active distributors (1) . . . . . . . . . . . . . . 761,000 755,000 761,000 761,000 799,000<br />
<strong>Nu</strong>mber of executive distributors (1) . . . . . . . . . . . . . . . . . . . . . . . . 29,756 30,002 30,588 32,939 35,676<br />
(1)<br />
Active distributors include preferred customers and distributors purchasing products directly from us during the three months ended as of the date indicated. An executive<br />
distributor is an active distributor who has achieved required personal and group sales volumes.<br />
34
ITEM 7.<br />
MANAGEMENT’S DISCUSSION<br />
AND ANALYSIS OF FINANCIAL<br />
CONDITION AND RESULTS OF<br />
OPERATIONS<br />
The following discussion of our financial condition and results of operation<br />
should be read in conjunction with the Consolidated Financial<br />
Statements and related Notes thereto, which are included in this <strong>Annual</strong><br />
<strong>Report</strong> on Form 10-K.<br />
OVERVIEW<br />
We are a leading, global direct selling company with operations<br />
in over 51 markets worldwide. We develop and distribute innovative,<br />
premium-quality anti-aging personal care products and nutritional<br />
supplements under our <strong>Nu</strong> <strong>Skin</strong> and Pharmanex brands, respectively.<br />
We strive to secure competitive advantage in four key areas: our<br />
people, our products, the culture we promote, and the business opportunities<br />
we offer. In <strong>2010</strong>, we posted record revenue of $1.5 billion.<br />
Revenue in <strong>2010</strong> grew 15% based on the success of strong product<br />
launches and distributor initiatives. As of December 31, <strong>2010</strong>, we had<br />
a global network of approximately 800,000 active independent distributors.<br />
Approximately 36,000 of our distributors were qualified<br />
sales leaders we refer to as “executive distributors.” Our executive<br />
distributors play a critical leadership role in the growth and development<br />
of our business. Approximately 86% of our <strong>2010</strong> revenue came<br />
from markets outside the United States. While we have become<br />
more geographically diverse over the past decade, Japan, our largest<br />
revenue market, accounted for approximately 31% of our <strong>2010</strong> total<br />
revenue. Due to the size of our foreign operations, our results are often<br />
impacted by foreign currency fluctuations, particularly fluctuations<br />
in the Japanese yen. In addition, our results are generally impacted<br />
by global economic, political, demographic and business<br />
conditions.<br />
Our revenue depends on the number and productivity of our<br />
active distributors and executive distributor leaders. We have been<br />
successful in attracting and motivating distributors by:<br />
• developing and marketing innovative, technologically and scientifically<br />
advanced products;<br />
• providing compelling initiatives and strong distributor support;<br />
and<br />
• offering attractive incentives that motivate distributors to build<br />
sales organizations.<br />
Our distributors market and sell our products and recruit new<br />
distributors based on the distinguishing benefits and innovative characteristics<br />
of our products. As a result, it is vital to our business that<br />
we continuously leverage our research and development resources to<br />
develop and introduce innovative products and provide our distributors<br />
with an attractive portfolio of products. Over the last two years,<br />
we have successfully introduced a suite of innovative ageLOC antiaging<br />
products including the ageLOC Transformation daily skin care<br />
system, ageLOC Edition Galvanic Spa System II and ageLOC Vitality<br />
nutritional supplement, and we are currently developing additional<br />
ageLOC anti-aging products for the future. These products are designed<br />
to positively influence the expression of genes that we believe<br />
play a critical role in the aging process. We also offer unique initiatives,<br />
products, and business tools, such as our Galvanic Spa System<br />
and Pharmanex BioPhotonic Scanner, to help distributors effectively<br />
differentiate our earnings opportunity and product offering. Any delays<br />
or difficulties in introducing compelling products or attractive<br />
initiatives or tools into our markets may have a negative impact on<br />
our revenue and distributor recruiting.<br />
We have developed a global distributor compensation plan and<br />
other incentives designed to motivate our distributors to market and<br />
sell our products and to build sales organizations around the world and<br />
across product lines. In 2008 and 2009, we implemented modifications<br />
to our compensation plan to improve commission payments<br />
early in the distributor lifecycle. The results from these modifications<br />
have been positive. We continue to evaluate further changes to our<br />
compensation plan to help increase distributor productivity and earnings<br />
potential. However, there are always risks associated with making<br />
changes to our compensation plan as there is a degree of uncertainty<br />
as to how distributors will react to such changes and whether such<br />
changes will impact distributor activity in unanticipated ways.<br />
With the launch of ageLOC Transformation, we implemented a<br />
product launch process that has been refined in our South Korea market<br />
that has contributed to our growth in revenue in <strong>2010</strong>. This process<br />
generally involves introducing the product in a market through an initial<br />
limited offering that is often tied to a distributor event. The limited<br />
offering typically generates significant distributor activity and a high<br />
level of distributor purchasing. This generally results in a higher than<br />
normal increase in revenue during the quarter of the limited offering.<br />
We typically launch the product for general sales a few months following<br />
the limited offering. Information regarding product launches below<br />
refers to the launch of the product for general sales and not to the<br />
limited offering used to introduce the product. Reference to introduction<br />
of a product refers to the limited offering.<br />
Our extensive global distributor network helps us to rapidly introduce<br />
products and penetrate our markets with little up-front promotional<br />
expense. Similar to other companies in our industry, we experience<br />
a high level of turnover among our distributors. As a result,<br />
it is important that we regularly introduce innovative and compelling<br />
products and initiatives in order to maintain a compelling business<br />
35
opportunity that will attract new distributors. We have also developed,<br />
and continue to promote in many of our markets, product subscription<br />
and loyalty programs that provide incentives for customers<br />
to commit to purchase a specific amount of products on a monthly<br />
basis. We believe these subscription programs have improved customer<br />
retention, have had a stabilizing impact on revenue, and have<br />
helped generate recurring sales for our distributors. Subscription orders<br />
represented 54% of our revenue in <strong>2010</strong>.<br />
Global economic conditions continue to be challenging in many<br />
of our markets. Although the economy appears to be recovering, it is<br />
not possible for us to predict the extent and timing of any improvement<br />
in global economic conditions. Despite difficult economic conditions,<br />
we experienced healthy growth in <strong>2010</strong>. We believe we have<br />
benefited from the nature of our distribution model and strong execution<br />
around a demonstrative product/opportunity initiative, which<br />
has helped offset to some degree the impact of weaker consumer<br />
spending. As a direct selling company, we offer a direct selling opportunity<br />
that allows an individual to supplement his/her income by<br />
selling our products and building a sales organization to market and<br />
sell our products. As the economy and the labor market decline, we<br />
find that there can be an increase in the number of people interested<br />
in becoming distributors in order to supplement their income. We<br />
believe that this increase in interest in our direct selling opportunity<br />
coupled with the strong marketing position of our new ageLOC antiaging<br />
products and our other products and tools have helped us to<br />
continue growing our business in these difficult economic conditions.<br />
However, if the economic problems are prolonged or worsen, we expect<br />
that we could see a negative impact on our business as distributors<br />
may have a more difficult time selling products and finding new<br />
customers.<br />
Our business is subject to various laws and regulations globally,<br />
particularly with respect to network marketing activities, cosmetics,<br />
and nutritional supplements. Accordingly, we face certain risks, including<br />
any improper claims or activities of our distributors or any inability<br />
to obtain or maintain necessary product registrations. For example,<br />
we continue to experience heightened regulatory and media<br />
scrutiny of the direct selling industry in Japan. Several direct sellers in<br />
Japan have been penalized for actions of distributors that violated<br />
applicable regulations. We could face similar penalties if we are unable<br />
to effectively manage the activities of our distributors<br />
INCOME STATEMENT PRESENTATION<br />
We recognize revenue in five geographic regions and we translate<br />
revenue from each market’s local currency into U.S. dollars using<br />
weighted-average exchange rates. The following table sets forth revenue<br />
information by region for the periods indicated. This table<br />
should be reviewed in connection with the tables presented under<br />
“Results of Operations,” which disclose selling expenses and other<br />
costs associated with generating the aggregate revenue presented.<br />
REVENUE BY REGION<br />
Year Ended December 31,<br />
(U.S. dollars in millions) 2008 2009 <strong>2010</strong><br />
North Asia . . . . . . . . . . . . . . . . . . . . . . . . . . . . . . . . . . . . . . . . . . . . . . $ 594.5 48% $ 606.1 45% $ 686.1 45%<br />
Greater China . . . . . . . . . . . . . . . . . . . . . . . . . . . . . . . . . . . . . . . . . 210.0 17 210.4 16 268.2 17<br />
Americas . . . . . . . . . . . . . . . . . . . . . . . . . . . . . . . . . . . . . . . . . . . . . . . 223.9 18 260.9 20 250.0 16<br />
South Asia/Pacific . . . . . . . . . . . . . . . . . . . . . . . . . . . . . . . . . . . . . 107.6 8 120.1 9 182.8 12<br />
Europe . . . . . . . . . . . . . . . . . . . . . . . . . . . . . . . . . . . . . . . . . . . . . . . . . . 111.6 9 133.6 10 150.2 10<br />
$ 1,247.6 100% $ 1,331.1 100% $ 1,537.3 100%<br />
Cost of sales primarily consists of:<br />
• cost of products purchased from third-party vendors, generally<br />
in U.S. dollars;<br />
• costs of self-manufactured products;<br />
• cost of sales materials which we sell to distributors at or near<br />
cost;<br />
• amortization expenses associated with certain products and<br />
services such as the Pharmanex BioPhotonic Scanners that are<br />
leased to distributors;<br />
• freight cost of shipping products to distributors and import<br />
duties for the products; and<br />
• royalties and related expenses for licensed technologies.<br />
We source the majority of our products from third-party manufacturers<br />
located in the United States. Due to Chinese government<br />
36
estrictions on the importation of finished goods applicable to the<br />
current scope of our business in China, we are required to manufacture<br />
the bulk of our own products for distribution in China. Cost of<br />
sales and gross profit may fluctuate as a result of changes in the ratio<br />
between self-manufactured products and products sourced from<br />
third-party suppliers. In addition, because we purchase a significant<br />
majority of our goods in U.S. dollars and recognize revenue in local<br />
currencies, we are subject to exchange rate risks in our gross margins.<br />
Because our gross margins vary from product to product and are<br />
higher in some markets such as Japan, changes in product mix and<br />
geographic revenue mix can impact our gross margins.<br />
<strong>Selling</strong> expenses are our most significant expense and are classified<br />
as operating expenses. <strong>Selling</strong> expenses include distributor commissions,<br />
costs for incentive trips and other rewards, as well as wages,<br />
benefits, bonuses and other labor and unemployment expenses we<br />
pay to sales employees in China. Our global compensation plan,<br />
which we employ in all of our markets except China, is an important<br />
factor in our ability to attract and retain distributors. We pay monthly<br />
commissions to several levels of distributors on each product sale<br />
based upon a distributor’s personal and group product volumes, as<br />
well as the group product volumes of up to six levels of executive<br />
distributors in such distributor’s downline sales organization. We do<br />
not pay commissions on sales materials, which are sold to distributors<br />
at or near cost. Small fluctuations occur in the amount of commissions<br />
paid as the network of distributors actively purchasing products<br />
changes from month to month. However, due to the size of our distributor<br />
force of approximately 800,000 active distributors, the fluctuation<br />
in the overall payout is relatively small. The overall payout has<br />
typically averaged between 41% and 44% of global product sales.<br />
From time to time, we make modifications and enhancements to our<br />
global compensation plan in an effort to help motivate distributors<br />
and develop leadership characteristics, which can have an impact on<br />
selling expenses.<br />
Distributors also have the opportunity to make retail profits by<br />
purchasing products from us at wholesale and selling them to customers<br />
with a retail mark-up. We do not account for nor pay additional<br />
commissions on these retail mark-ups received by distributors.<br />
In many markets, we also allow individuals who are not distributors,<br />
whom we refer to as “preferred customers,” to buy products directly<br />
from us at wholesale or discounted prices. We pay commissions on<br />
preferred customer purchases to the referring distributors.<br />
General and administrative expenses include:<br />
• wages and benefits;<br />
• rents and utilities;<br />
• depreciation and amortization;<br />
• promotion and advertising;<br />
• professional fees;<br />
• travel;<br />
• research and development; and<br />
• other operating expenses.<br />
Labor expenses are the most significant portion of our general<br />
and administrative expenses. Promotion and advertising expenses<br />
include costs of distributor conventions held in various markets<br />
worldwide, which we expense in the period in which they are incurred.<br />
Because our various distributor conventions are not always held during<br />
each fiscal year, or in the same period each year, their impact on<br />
our general and administrative expenses may vary from year to year<br />
and from quarter to quarter. For example, we held our global distributor<br />
convention in October 2009 and will have another global convention<br />
in the fall of 2011 as we currently plan to hold a global convention<br />
every other year. In addition, we hold regional conventions and conventions<br />
in our major markets at different times during the year.<br />
These conventions have significant expenses associated with them.<br />
Because we have not incurred expenses for these conventions during<br />
every fiscal year or in comparable interim periods, year-over-year<br />
comparisons have been impacted accordingly.<br />
Provision for income taxes depends on the statutory tax rates in<br />
each of the jurisdictions in which we operate. For example, statutory<br />
tax rates in <strong>2010</strong> were approximately 16.5% in Hong Kong, 20% in Taiwan,<br />
22% in South Korea, 45% in Japan and 25% in China. We are<br />
subject to taxation in the United States at the statutory corporate<br />
federal tax rate of 35% and we pay taxes in multiple states within the<br />
United States at various tax rates. Our overall effective tax rate was<br />
34.5% for the year ended December 31, <strong>2010</strong>.<br />
CRITICAL ACCOUNTING POLICIES<br />
The following critical accounting policies and estimates should be<br />
read in conjunction with our audited Consolidated Financial Statements<br />
and related Notes thereto. Management considers our critical<br />
accounting policies to be the recognition of revenue, accounting for<br />
income taxes, accounting for intangible assets and accounting for<br />
stock-based compensation. In each of these areas, management<br />
makes estimates based on historical results, current trends and future<br />
projections.<br />
Revenue. We recognize revenue when products are shipped,<br />
which is when title and risk of loss pass to our distributors. With some<br />
37
exceptions in various countries, we offer a return policy whereby distributors<br />
can return unopened and unused product for up to 12<br />
months subject to a 10% restocking fee. <strong>Report</strong>ed revenue is net of<br />
returns, which have historically been less than 5% of annual revenue.<br />
A reserve for product returns is accrued based on historical experience.<br />
We classify selling discounts as a reduction of revenue. Our<br />
selling expenses are computed pursuant to our global compensation<br />
plan for our distributors, which is focused on remunerating distributors<br />
based primarily upon the selling efforts of the distributors and<br />
the volume of products purchased by their downlines, and not their<br />
personal purchases.<br />
Income Taxes. We account for income taxes in accordance with<br />
the Income Taxes Topic of the Financial Accounting Standards Codification.<br />
These standards establish financial accounting and reporting<br />
standards for the effects of income taxes that result from an enterprise’s<br />
activities during the current and preceding years. We take<br />
an asset and liability approach for financial accounting and reporting<br />
of income taxes. We pay income taxes in many foreign jurisdictions<br />
based on the profits realized in those jurisdictions, which can be significantly<br />
impacted by terms of intercompany transactions among<br />
our affiliates around the world. Deferred tax assets and liabilities are<br />
created in this process. As of December 31, <strong>2010</strong>, we had net deferred<br />
tax assets of $59.9 million. These net deferred tax assets assume sufficient<br />
future earnings will exist for their realization, as well as the continued<br />
application of current tax rates. In certain foreign jurisdictions<br />
valuation allowances have been recorded against the deferred tax<br />
assets specifically related to use of net operating losses. When we<br />
determine that there is sufficient taxable income to utilize the net operating<br />
losses, the valuation allowances will be released. In the event<br />
we were to determine that we would not be able to realize all or part<br />
of our net deferred tax assets in the future, an adjustment to the deferred<br />
tax assets would be charged to earnings in the period such<br />
determination was made.<br />
We file income tax returns in the U.S. federal jurisdiction, and in<br />
various state and foreign jurisdictions. We are currently under examination<br />
by the United States Internal Revenue Service (the “IRS”) for<br />
the 2005, 2006, 2007 and 2008 tax years. With a few exceptions, we<br />
are no longer subject to U.S. federal, state and local income tax examination<br />
by tax authorities for years before 2005. Beginning with<br />
the tax year 2009, we entered into a voluntary program with the IRS<br />
called Compliance Assurance Process (“CAP”). The objective of<br />
CAP is to contemporaneously work with the IRS to achieve federal<br />
tax compliance and resolve all or most of the issues prior to filing of<br />
the tax return. We have elected to participate in the CAP program<br />
for tax years 2009 through 2011 and may elect to continue participating<br />
in CAP for future tax years. We are allowed to withdraw from the<br />
program at any time. In major foreign jurisdictions, we are no longer<br />
subject to income tax examinations for years before 2004. Along<br />
with the IRS examination, we are currently under examination in certain<br />
foreign jurisdictions; however, the outcomes of these reviews are<br />
not yet determinable.<br />
At December 31, <strong>2010</strong>, we had $14.8 million in unrecognized tax<br />
benefits of which $2.4 million, if recognized, would affect the effective<br />
tax rate. In comparison, at December 31, 2009, we had $28.3 million in<br />
unrecognized tax benefits of which $4.4 million, if recognized, would<br />
affect the effective tax rate. During each of the years ended December<br />
31, <strong>2010</strong> and 2009, we recognized approximately ($1.7) million and<br />
$0.1 million and $0.5 million in interest and penalties expenses/(benefits),<br />
respectively. We had approximately $1.6 million, $3.3 million<br />
and $3.2 million of accrued interest and penalties related to uncertain<br />
tax positions at December 31, <strong>2010</strong>, 2009 and 2008, respectively. Interest<br />
and penalties related to uncertain tax positions are recognized<br />
as a component of income tax expense.<br />
We are subject to regular audits by federal, state and foreign tax<br />
authorities. These audits may result in additional tax liabilities. We account<br />
for such contingent liabilities in accordance with relevant accounting<br />
standards and believe we have appropriately provided for<br />
income taxes for all years. Several factors drive the calculation of our<br />
tax reserves. Some of these factors include: (i) the expiration of various<br />
statutes of limitations; (ii) changes in tax law and regulations; (iii)<br />
issuance of tax rulings; and (iv) settlements with tax authorities.<br />
Changes in any of these factors may result in adjustments to our reserves,<br />
which would impact our reported financial results.<br />
Intangible Assets. Acquired intangible assets may represent indefinite-lived<br />
assets, determinable-lived intangibles, or goodwill. Of<br />
these, only the costs of determinable-lived intangibles are amortized<br />
to expense over their estimated life. The value of indefinite-lived intangible<br />
assets and residual goodwill is not amortized, but is tested at<br />
least annually for impairment. Our impairment testing for goodwill is<br />
performed separately from our impairment testing of indefinite-lived<br />
intangibles. We test goodwill for impairment, at least annually, by reviewing<br />
the book value compared to the fair value at the reportable<br />
unit level. We test individual indefinite-lived intangibles at least annually<br />
by reviewing the individual book values compared to the fair value.<br />
Considerable management judgment is necessary to measure<br />
fair value. We did not recognize any impairment charges for goodwill<br />
or intangible assets during the periods presented.<br />
Stock-Based Compensation. All share-based payments to employees<br />
are recognized in the financial statements based on their fair<br />
values using an option-pricing model at the date of grant. We use a<br />
Black-Scholes-Merton option-pricing model to calculate the fair<br />
value of options. Stock based compensation expense is recognized<br />
net of any estimated forfeitures on a straight-line basis over the requisite<br />
service period of the award.<br />
38
RESULTS OF OPERATIONS<br />
The following table sets forth our operating results as a percentage of revenue for the periods indicated::<br />
Year Ended December 31,<br />
2008 2009 <strong>2010</strong><br />
Revenue . . . . . . . . . . . . . . . . . . . . . . . . . . . . . . . . . . . . . . . . . . . . . . . . . . . . . . . . . 100.0% 100.0% 100.0%<br />
Cost of sales . . . . . . . . . . . . . . . . . . . . . . . . . . . . . . . . . . . . . . . . . . . . . . . . . . . . 18.3 18.3 17.7<br />
Gross profit . . . . . . . . . . . . . . . . . . . . . . . . . . . . . . . . . . . . . . . . . . . . . . . . . . . . . . 81.7 81.7 82.3<br />
Operating expenses:<br />
<strong>Selling</strong> expenses . . . . . . . . . . . . . . . . . . . . . . . . . . . . . . . . . . . . . . . . . . . . . . . 42.4 41.4 42.1<br />
General and administrative expenses . . . . . . . . . . . . . . . . . . . . . . . . . 29.2 28.4 26.1<br />
Restructuring charges . . . . . . . . . . . . . . . . . . . . . . . . . . . . . . . . . . . . . . . . . — 0.8 —<br />
Total operating expenses . . . . . . . . . . . . . . . . . . . . . . . . . . . . . . . . . . . . . . . 71.6 70.6 68.2<br />
Operating income . . . . . . . . . . . . . . . . . . . . . . . . . . . . . . . . . . . . . . . . . . . . . . 10.1 11.1 14.1<br />
Other income (expense), net . . . . . . . . . . . . . . . . . . . . . . . . . . . . . . . . . . . (2.0) (0.5) (0.6)<br />
Income before provision for income taxes . . . . . . . . . . . . . . . . . . . . . 8.1 10.6 13.5<br />
Provision for income taxes . . . . . . . . . . . . . . . . . . . . . . . . . . . . . . . . . . . . . . 2.9 3.8 4.6<br />
Net income . . . . . . . . . . . . . . . . . . . . . . . . . . . . . . . . . . . . . . . . . . . . . . . . . . . . . . 5.2% 6.8% 8.9%<br />
<strong>2010</strong> COMPARED TO 2009<br />
OVERVIEW<br />
Revenue in <strong>2010</strong> increased 15% to $1.54 billion from $1.33 billion in<br />
2009. Our revenue growth in <strong>2010</strong> was driven by the global launch of<br />
our ageLOC anti-aging products, including our ageLOC Transformation<br />
skin care system, which has generated sales of approximately $220<br />
million since its introduction in the fourth quarter of 2009. We also<br />
introduced ageLOC Vitality, our first ageLOC nutritional product<br />
designed to address the internal sources of aging, in Japan, the United<br />
States, Canada, and certain of our markets in Europe and Latin<br />
America during the second half of <strong>2010</strong>. Foreign currency exchange<br />
fluctuations had a 5% positive impact on revenue in <strong>2010</strong> compared<br />
to 2009. Our revenue growth rates were the highest in Mainland<br />
China, South Korea and the South Asia/Pacific region. We also saw<br />
improving trends in Japan, as the rate of local currency revenue decline<br />
in that market decreased compared to the prior year.<br />
Earnings per share in <strong>2010</strong> increased to $2.11 compared to $1.40<br />
in 2009 on a diluted basis. The increase in earnings is largely the result<br />
of increased revenue, as discussed above, coupled with improved<br />
margins and controlled expenses. Earnings per share comparisons<br />
were also impacted by restructuring charges in 2009 totaling $6.8<br />
million (net of taxes of $3.9 million), or $.11 per share, primarily related<br />
to transformation efforts to streamline our operations in Japan.<br />
REVENUE<br />
North Asia. The following table sets forth revenue for the North Asia<br />
region and its principal markets (U.S. dollars in millions):<br />
2009 <strong>2010</strong> Change<br />
Japan . . . . . . . . . . . . . . $ 461.9 $ 471.4 2%<br />
South Korea . . . . . . . 144.2 214.7 49%<br />
North Asia total . . . $ 606.1 $ 686.1 13%<br />
Foreign currency fluctuations positively impacted revenue by 8%<br />
in this region compared to the prior-year period. Currency fluctuations<br />
positively impacted revenue in Japan by 6% and in South Korea by<br />
13% in <strong>2010</strong>. Our active and executive distributor counts decreased<br />
4% and 3%, respectively, in Japan in <strong>2010</strong> compared to 2009. In South<br />
Korea, our active and executive distributor counts increased 17% and<br />
19%, respectively, comparing <strong>2010</strong> to 2009.<br />
Local currency revenue in Japan decreased 4% in <strong>2010</strong><br />
compared to 2009. We continue to experience some weakness in<br />
Japan, as evidenced by the declines in both our active and executive<br />
distributors. The direct selling industry and most direct selling companies<br />
in Japan have been in decline for several years in this challenging<br />
market. Increased regulatory and media scrutiny of the industry<br />
continues to negatively impact the industry and our business. As a<br />
result of this increased scrutiny, we continue to focus on distributor<br />
compliance and have also been more cautious in both our corporate<br />
39
and our distributor’s marketing activities. These challenges were partially<br />
offset by distributor and product initiatives, including the launch<br />
of the full ageLOC Transformation skin care system in the second<br />
quarter of <strong>2010</strong> and the limited offering of our ageLOC Vitality in the<br />
second half of <strong>2010</strong>. Local currency revenue in Japan decreased 8%<br />
year-over-year in the fourth quarter primarily due to a difficult comparison<br />
with the strong introduction of ageLOC Transformation in the<br />
fourth quarter of 2009. We believe that we may continue to see modest<br />
local currency revenue declines during 2011, based on continued<br />
weakness in distributor numbers, the promotional nature of some of<br />
the revenue generated in connection with the launch of our ageLOC<br />
product platform, and our anticipation that difficult regulatory conditions<br />
will continue throughout 2011.<br />
South Korea posted strong year-over-year local currency revenue<br />
growth of 36%. This growth was driven by the introduction of our<br />
ageLOC Transformation skin care system, which generated approximately<br />
$20 million in sales during a limited offering in the first quarter<br />
of <strong>2010</strong>, and continued excitement and sponsoring activities surrounding<br />
ageLOC Transformation throughout the remainder of the year. This<br />
excitement contributed to the healthy growth in active and executive<br />
distributors in this market.<br />
Greater China. The following table sets forth revenue for the<br />
Greater China region and its principal markets (U.S. dollars in millions):<br />
2009 <strong>2010</strong> Change<br />
Taiwan . . . . . . . . . . . . . $ 91.7 $ 107.1 17%<br />
China . . . . . . . . . . . . . . 71.1 91.4 29%<br />
Hong Kong . . . . . . . . 47.6 69.7 46%<br />
Greater China total $ 210.4 $ 268.2 27%<br />
Foreign currency exchange rate fluctuations positively impacted<br />
revenue in the Greater China region by 3% in <strong>2010</strong>. Revenue growth in<br />
the region was driven by the introduction of ageLOC Transformation<br />
during the second quarter of <strong>2010</strong>, generating approximately $20<br />
million in sales during a limited offering of this product in connection<br />
with our Greater China Regional Convention.<br />
Local currency revenue in Taiwan was up 11% in <strong>2010</strong> compared<br />
to 2009. As discussed above, the growth was driven by the launch of<br />
ageLOC Transformation, which led to healthy growth in the number<br />
of active and executive distributors as well as revenue. Active distributors<br />
in Taiwan increased 5% and executive distributors increased<br />
1% compared to the prior-year period.<br />
On a local currency basis, revenue in Mainland China increased<br />
27% in <strong>2010</strong> compared to 2009. Mainland China reported a 28% and<br />
38% increase in our preferred customers and number of sales representatives,<br />
respectively, compared to the prior-year period. Revenue and<br />
sales force growth in Mainland China were primarily the result of<br />
successful sales initiatives and excitement surrounding our ageLOC<br />
Transformation skin care system, which we introduced at the regional<br />
convention in the second quarter of <strong>2010</strong> and fully launched in Mainland<br />
China in the fourth quarter of <strong>2010</strong>. Strong sales of the ageLOC Edition<br />
Galvanic Spa System II also contributed to growth in this market. We<br />
continue to focus our efforts on managing our sales force to ensure<br />
compliance with our policies and local regulations in this market.<br />
Hong Kong local currency revenue was up 47% in <strong>2010</strong> compared<br />
to 2009 primarily as a result of the introduction of our ageLOC<br />
Transformation skin care system at the regional convention in the<br />
second quarter. Approximately $17 million of revenue was generated<br />
from convention sales to distributors from outside of Hong Kong.<br />
Executive and active distributors in Hong Kong were down 2% and<br />
5%, respectively, compared to 2009.<br />
Americas. The following table sets forth revenue for the Americas<br />
region and its principal markets (U.S. dollars in millions):<br />
2009 <strong>2010</strong> Change<br />
United States . . . . . . $ 218.6 $ 212.1 (3%)<br />
Canada . . . . . . . . . . . . 23.5 23.9 2%<br />
Latin America . . . . . 18.8 14.0 (26%)<br />
Americas total . . . . $ 260.9 $ 250.0 (4%)<br />
Revenue in the United States declined 3% in <strong>2010</strong> compared to<br />
2009. In the fourth quarter of <strong>2010</strong>, U.S. revenue declined 23% compared<br />
to the same prior-year period. Approximately $17 million in<br />
sales at our global distributor convention held in the U.S. during<br />
the fourth quarter of 2009, and the introduction of our ageLOC<br />
Transformation skin care system in connection with the global convention<br />
created a difficult comparison for the fourth quarter of <strong>2010</strong>.<br />
Excluding the impact of $11 million of 2009 global convention sales to<br />
non-U.S. based distributors, revenue in the U.S. would have been<br />
down 5% for the fourth quarter of <strong>2010</strong> and up 3% for the year compared<br />
to the same prior-year periods. Our recent growth initiatives<br />
have had less of an impact on distributor productivity and active<br />
distributor growth in the U.S. than in many of our other markets. We<br />
currently expect continued softness in the U.S. for the first half of<br />
2011, offset by growth in the second half of the year in connection<br />
with our global convention in October. Active distributors in the U.S.<br />
decreased 4% in <strong>2010</strong> and executive distributors increased 1% compared<br />
to the prior-year period.<br />
On a local currency basis, revenue decreased by 7% in Canada<br />
and by 19% in Latin America in <strong>2010</strong> compared to 2009, respectively.<br />
Revenue declines in these markets were primarily a result of decreased<br />
distributor activity.<br />
40
South Asia/Pacific. The following table sets forth revenue<br />
for the South Asia/Pacific region and its principal markets (U.S. dollars<br />
in millions):<br />
2009 <strong>2010</strong> Change<br />
Singapore/Malaysia/<br />
Brunei. . . . . . . . . . . . . . $ 49.2 $ 76.8 56%<br />
Thailand . . . . . . . . . . . . . . . 38.8 56.7 46%<br />
Australia/New Zealand 14.2 21.7 53%<br />
Indonesia . . . . . . . . . . . . . . 10.7 15.5 45%<br />
Philippines . . . . . . . . . . . . . 7.2 12.1 68%<br />
South Asia/Pacific total $ 120.1 $ 182.8 52%<br />
Foreign currency exchange rate fluctuations positively impacted<br />
revenue in South Asia/Pacific by 13% in <strong>2010</strong> compared to the same<br />
prior-year period. Revenue growth was driven largely by strong sales<br />
and sponsoring activity in connection with the general launch of our<br />
ageLOC Transformation skin care system. Continued interest in our<br />
TRA weight management products and ageLOC Edition Galvanic Spa<br />
System II also contributed to strong growth in this region. Executive<br />
distributors in the region increased 33% while active distributors increased<br />
18% compared to the prior year.<br />
Europe. The following table sets forth revenue for our Europe<br />
region (U.S. dollars in millions):<br />
2009 <strong>2010</strong> Change<br />
Europe . . . . . . . . . . . . . $ 133.6 $ 150.2 12%<br />
Foreign currency exchange rate fluctuations negatively impacted<br />
revenue in Europe by 4% in <strong>2010</strong> compared to the prior year. On a local<br />
currency basis, revenue in Europe grew by 16% in <strong>2010</strong> compared to<br />
2009. Growth in Europe was driven by sustained interest in our ageLOC<br />
anti-aging products and LifePak nutrition supplements. We also began<br />
initial marketing activities in Ukraine during the fourth quarter of <strong>2010</strong>. Our<br />
active and executive distributor counts in our Europe region increased<br />
by 14% and 11%, respectively, in <strong>2010</strong> compared to 2009.<br />
GROSS PROFIT<br />
Gross profit as a percentage of revenue in <strong>2010</strong> increased to<br />
82.3% compared to 81.7% in 2009. The increase is a result of strong<br />
sales of our higher margin ageLOC products, and foreign currency<br />
benefits in <strong>2010</strong>. We anticipate that our gross profit as a percentage<br />
of revenue will remain at this level in 2011.<br />
SELLING EXPENSES<br />
<strong>Selling</strong> expenses remained relatively level as a percentage of<br />
revenue at 42.1% in <strong>2010</strong> compared to 42.0% in 2009.<br />
As part of our compensation plan improvements, we increased<br />
our focus on distributor recognition. Accordingly, during <strong>2010</strong>, the<br />
costs of certain incentive trips and other rewards earned by distributors,<br />
previously recorded as general and administrative expenses,<br />
have been reclassified as selling expenses. In order to provide a<br />
meaningful comparison, we have made this reclassification for both<br />
the current and prior-year periods.<br />
GENERAL AND ADMINISTRATIVE EXPENSES<br />
General and administrative expenses decreased as a percentage<br />
of revenue to 26.1% in <strong>2010</strong> from 27.8% in 2009, primarily as a result of<br />
increased revenue and controlled expenses.<br />
RESTRUCTURING CHARGES<br />
During 2009, we recorded restructuring charges of $10.7 million<br />
primarily related to transformation efforts in Japan designed to improve<br />
operational efficiencies and align organizationally in Japan with<br />
how we are organized globally in our other markets. There were no<br />
similar charges in <strong>2010</strong>.<br />
OTHER INCOME (EXPENSE), NET<br />
Other income (expense), net was $9.4 million of expense in <strong>2010</strong><br />
compared to $6.6 million of expense in 2009. The increase in expense<br />
is due primarily to the impact of changes in foreign currency exchange<br />
rates. Because it is impossible to predict foreign currency fluctuations,<br />
we cannot estimate the degree to which our other income expense will<br />
be impacted in the future. Other income (expense), net also includes<br />
approximately $5.8 million and $6.9 million in interest expense during<br />
<strong>2010</strong> and 2009, respectively.<br />
PROVISION FOR INCOME TAXES<br />
Provision for income taxes increased to $71.6 million in <strong>2010</strong> from $51.3<br />
million in 2009. The effective tax rate decreased to 34.5% in <strong>2010</strong> from<br />
36.3% of pre-tax income in 2009. The lower income tax rate was due to<br />
an increased benefit relating to the expiration of the statute of limitations<br />
in <strong>2010</strong> compared to 2009. We anticipate our tax rate will return to approximately<br />
36.5% in 2011.<br />
NET INCOME<br />
As a result of the foregoing factors, net income increased to $136.1<br />
million in <strong>2010</strong> from $89.8 million in 2009.<br />
2009 COMPARED TO 2008<br />
OVERVIEW<br />
Revenue in 2009 increased 6% to $1.33 billion from $1.25 billion<br />
in 2008. The introduction of our ageLOC Transformation skin care<br />
system at our global distributor convention held in Los Angeles during<br />
the fourth quarter of 2009 contributed to revenue growth during this<br />
period. Foreign currency exchange fluctuations did not materially<br />
41
impact revenue in 2009 compared to 2008. Revenue in 2009 was<br />
positively impacted by growth in all of our regions, driven largely by<br />
strong sales of our personal care products, including the Galvanic Spa<br />
System II with ageLOC Galvanic Spa Gels and our new ageLOC<br />
Transformation skin care system, as well as successful promotions of<br />
other key products. Despite improving trends in Japan, we continued<br />
to see declines in our local currency revenue in that market.<br />
Earnings per share in 2009 increased to $1.40 compared to $1.02<br />
in 2008 on a diluted basis. The increase in earnings was largely the<br />
result of increased revenue, as discussed above, and transformation<br />
initiatives we executed over the previous several years to transform<br />
and align our business and operate more efficiently. Earnings per share<br />
in 2009 and 2008 were also impacted by:<br />
• foreign currency transaction losses in 2008 of approximately<br />
$11.9 million (net of taxes of $6.5 million), or $.19 per share, as<br />
foreign currencies shifted dramatically during the year;<br />
• restructuring charges in 2009 totaling $6.8 million (net of taxes<br />
of $3.9 million), or $.11 per share, relating to further transformation<br />
initiatives to reduce overhead, primarily in Japan<br />
REVENUE<br />
North Asia. The following table sets forth revenue for the North Asia<br />
region and its principal markets (U.S. dollars in millions):<br />
2008 2009 Change<br />
Japan . . . . . . . . . . . . . . $ 443.7 $ 461.9 4%<br />
South Korea . . . . . . . 150.8 144.2 (4%)<br />
North Asia total . . . $ 594.5 $ 606.1 2%<br />
Foreign currency fluctuations positively impacted revenue by<br />
3% in this region compared to the prior-year period. Currency fluctuations<br />
positively impacted revenue in Japan by 10% and negatively<br />
impacted revenue in South Korea by 16% in 2009. Our active and<br />
executive distributor counts decreased 10% and 5%, respectively, in<br />
Japan in 2009 compared to 2008. In South Korea, our active and<br />
executive distributor counts increased 18% and 20%, respectively,<br />
comparing 2009 to 2008.<br />
Local currency revenue in Japan declined 6% in 2009 compared<br />
to 2008. The revenue decline was largely due to the difficult industry<br />
and regulatory conditions in this market as previously discussed,<br />
which contributed to our decline in active and executive distributors.<br />
We believe that most direct selling companies also saw their businesses<br />
contract in this market in 2009. As a result of industry and<br />
regulatory challenges in this market, we focused on distributor compliance<br />
and were also more cautious in both our corporate and our<br />
distributor’s marketing activities. Local currency revenue in Japan<br />
decreased 1% year-over-year in the fourth quarter of 2009.<br />
In response to this regulatory environment and, as a result of increases<br />
in the number of complaints to consumer centers regarding<br />
the activities of some of our distributors, we increased our focus on<br />
distributor compliance and training. Some of the actions we took to<br />
address activities of distributor groups that were having higher levels<br />
of complaints contributed to the declines in our revenue. We also<br />
engaged in less aggressive product promotions in 2008 than we had<br />
in 2007.<br />
South Korea posted strong year-over-year local currency revenue<br />
growth of 12%. This growth was fueled by strong distributor<br />
alignment behind our product and distributor initiatives, maintaining<br />
a vibrant sponsoring environment for our distributors and spurring<br />
significant growth in our active and executive distributors. This revenue<br />
growth was more than offset by a weakening of the South Korean<br />
won during 2009.<br />
Greater China. The following table sets forth revenue for<br />
the Greater China region and its principal markets (U.S. dollars<br />
in millions):<br />
2008 2009 Change<br />
Taiwan . . . . . . . . . . . . . $ 92.3 $ 91.7 1%<br />
China . . . . . . . . . . . . . . 65.3 71.1 9%<br />
Hong Kong . . . . . . . . 52.4 47.6 (9%)<br />
Greater China total $ 210.0 $ 210.4 —<br />
Foreign currency exchange rate fluctuations positively impacted<br />
revenue in the Greater China region by 1% in 2009. Local currency<br />
revenue in Taiwan was up 4% in 2009 compared to 2008. The executive<br />
distributor count in Taiwan was up 9% compared to the prior-year<br />
period, while the number of active distributors was up 12% when compared<br />
to the prior-year period. In Taiwan, due to regulatory restrictions,<br />
we were unable to market the Galvanic Spa System II, which had been<br />
a primary growth initiative in our other markets.<br />
On a local currency basis, revenue in Mainland China increased<br />
7% in 2009 compared to 2008. Mainland China reported a 27% decline<br />
in our preferred customers compared to the prior-year period and a<br />
9% increase in the number of sales representatives. The year-over-year<br />
increase in revenue in Mainland China was the result of strong sales<br />
of the Galvanic Spa System II, which we fully launched in the first quarter<br />
of 2009, successful sales initiatives and the adoption of our revised<br />
business model.<br />
Hong Kong local currency revenue was down 9% in 2009 compared<br />
to 2008 primarily as a result of a reduction in sales of products to sales<br />
42
employees in Mainland China who had been purchasing products in<br />
2008 from Hong Kong that were not available in Mainland China such<br />
as our Galvanic Spa System II. Executive distributors in Hong Kong<br />
were up 15% and the active distributors in Hong Kong were down 4%<br />
compared to 2008.<br />
Americas. The following table sets forth revenue for the Americas<br />
region and its principal markets (U.S. dollars in millions):<br />
2008 2009 Change<br />
United States . . . . . . $ 192.1 $ 218.6 14%<br />
Canada . . . . . . . . . . . . 16.2 23.5 45%<br />
Latin America . . . . . 15.6 18.8 21%<br />
Americas total . . . . $ 223.9 $ 260.9 17%<br />
In 2009, we continued to experience strong growth in the United<br />
States, driven particularly by our highly demonstrable personal<br />
care products, including our Galvanic Spa System II with ageLOC<br />
Galvanic Spa Gels and our new ageLOC Transformation skin care<br />
system and ageLOC Edition Galvanic Spa System II. Revenue in<br />
2009 was positively impacted by approximately $11.0 million as a result<br />
of product sales and convention fee revenue from foreign distributors<br />
attending our biannual global convention in Los Angeles.<br />
Active distributors in the United States decreased 3% and executive<br />
distributors increased 12% compared to the prior-year period.<br />
Revenue increased by 45% in Canada and by 21% in Latin America<br />
in 2009 compared to 2008, respectively. Revenue continued to be<br />
driven primarily by the success of our Galvanic Spa System II and<br />
ageLOC Galvanic Spa Gels in these markets. Our growth in Latin<br />
America is also attributed to our expansion into Colombia during the<br />
second quarter of 2009.<br />
South Asia/Pacific. The following table sets forth revenue<br />
for the South Asia/Pacific region and its principal markets (U.S. dollars<br />
in millions):<br />
2008 2009 Change<br />
Singapore/Malaysia/<br />
Brunei . . . . . . . . . . . . . $ 43.8 $ 49.2 12%<br />
Thailand . . . . . . . . . . . . . 34.6 38.8 12%<br />
Australia/New Zealand 13.3 14.2 7%<br />
Indonesia . . . . . . . . . . . . 8.9 10.7 20%<br />
Philippines . . . . . . . . . . . 7.0 7.2 3%<br />
South Asia/Pacific total $ 107.6 $ 120.1 12%<br />
Foreign currency exchange rate fluctuations negatively impacted<br />
revenue in South Asia/Pacific by 5% in 2009 compared to the same<br />
prior-year period. All of the markets in this region experienced growth.<br />
The growth was driven largely by continued strong sales of our TRA<br />
family of weight loss products and our Galvanic Spa System II, as well<br />
as successful distributor leadership initiatives. We also successfully launched<br />
enhancements to our sales compensation plan in these markets, which<br />
we believe helped contribute to increased distributor productivity.<br />
Executive distributors in the region increased 16% while active distributors<br />
increased 9% compared to the prior year.<br />
Europe. The following table sets forth revenue for our Europe<br />
region (U.S. dollars in millions):<br />
2008 2009 Change<br />
Europe . . . . . . . . . . . . . $ 111.6 $ 133.6 20%<br />
Foreign currency exchange rate fluctuations negatively impacted<br />
revenue in Europe by 6% in 2009 compared to the prior year. On a local<br />
currency basis, revenue in Europe grew by 26% in 2009 compared to<br />
2008. The strong growth in Europe was driven by strong sales force<br />
leadership and sustained interest in our Galvanic Spa System II and our<br />
products supported by the Pharmanex BioPhotonic Scanner, particularly<br />
in Eastern Europe where we had recently expanded our business,<br />
as well as growth in Russia and South Africa. We also began initial marketing<br />
activities in Turkey during the second quarter of 2009. Our active<br />
and executive distributor counts in our Europe region increased by 12%<br />
and 16%, respectively, in 2009 compared to 2008.<br />
GROSS PROFIT<br />
Gross profit as a percentage of revenue in 2009 remained level<br />
with 2008 at 81.7%..<br />
SELLING EXPENSES<br />
<strong>Selling</strong> expenses decreased as a percentage of revenue to 42.0% in<br />
2009 from 42.7% in 2008. The decrease as a percentage of revenue was<br />
due primarily to modifications to our compensation plan to improve the<br />
alignment of our compensation plan incentives around more productive<br />
distributor activity.<br />
For both 2008 and 2009, the costs of certain incentive trips and<br />
other rewards earned by distributors, previously recorded as general and<br />
administrative expenses, have been reclassified as selling expenses.<br />
GENERAL AND ADMINISTRATIVE EXPENSES<br />
General and administrative expenses decreased as a percentage<br />
of revenue to 27.8% in 2009 from 28.9% in 2008, primarily as a<br />
result of increased revenue and our transformation to better leverage<br />
our overhead costs as we grow our revenue. General and administrative<br />
expenses were also positively impacted by our transformation<br />
efforts to reduce our overhead and general and administration expenses<br />
in Japan.<br />
43
RESTRUCTURING CHARGES<br />
During 2009, we recorded restructuring charges of $10.7 million<br />
primarily related to transformation efforts in Japan designed to improve<br />
operational efficiencies and align organizationally in Japan with<br />
how we are organized globally in our other markets.<br />
OTHER INCOME (EXPENSE), NET<br />
Other income (expense), net was $6.6 million of expense in<br />
2009 compared to $24.8 million of expense in 2008. Of this 2008<br />
amount, approximately $18.4 million relates to foreign currency transaction<br />
losses related to our yen-denominated debt as the Japanese<br />
yen strengthened from 111.45 at December 31, 2007 to 90.73 at December<br />
31, 2008. Other income (expense), net also includes approximately<br />
$6.9 million and $7.8 million in interest expense during 2009<br />
and 2008, respectively.<br />
PROVISION FOR INCOME TAXES<br />
Provision for income taxes increased to $51.3 million in 2009<br />
from $35.3 million in 2008. The effective tax rate increased to 36.3%<br />
in 2009 from 35.1% of pre-tax income in 2008. The higher income tax<br />
rate was due to a reduced benefit relating to the expiration of the<br />
statute of limitations in 2009 compared to 2008.<br />
NET INCOME<br />
As a result of the foregoing factors, net income increased to<br />
$89.8 million in 2009 from $65.3 million in 2008.<br />
LIQUIDITY AND CAPITAL RESOURCES<br />
Historically, our principal uses of cash have included operating<br />
expenses, particularly selling expenses, and working capital (principally<br />
inventory purchases), as well as capital expenditures, stock repurchases,<br />
dividends, debt repayment, and the development of operations<br />
in new markets. We have generally relied on cash flow from<br />
operations to fund operating activities, and we have at times<br />
incurred long-term debt in order to fund strategic transactions and<br />
stock repurchases.<br />
We typically generate positive cash flow from operations due to<br />
favorable margins. We generated $187.9 million in cash from operations<br />
in <strong>2010</strong> compared to $133.9 million in 2009. This increase in cash<br />
generated from operations is primarily due to the increase in revenue<br />
in <strong>2010</strong> as well as increased profitability from our restructuring efforts.<br />
As of December 31, <strong>2010</strong>, working capital was $206.1 million<br />
compared to $152.7 million as of December 31, 2009. Our working<br />
capital increased primarily due to an increase in cash and cash equivalents.<br />
Cash and cash equivalents at December 31, <strong>2010</strong> were $230.3<br />
million compared to $158.0 million at December 31, 2009. The increase<br />
in cash was primarily the result of the increase in our cash generated<br />
from operations in <strong>2010</strong>.<br />
Capital expenditures in <strong>2010</strong> totaled $53.8 million, and we anticipate<br />
capital expenditures of approximately $65 million for 2011.<br />
These capital expenditures in 2011 are primarily related to:<br />
• purchases of computer systems and software, including equipment<br />
and development costs;<br />
• the build-out and upgrade of leasehold improvements in our<br />
various markets, including retail stores in China<br />
• real estate acquisitions and initial development work related<br />
to the building of a new innovation center on our Provo, Utah<br />
campus; and<br />
• acquisition of our previously leased corporate headquarters buildings<br />
and distribution center in Provo, Utah.<br />
44
We currently have debt pursuant to various credit facilities and other borrowings. The following table summarizes these debt arrangements<br />
as of December 31, <strong>2010</strong>:<br />
Facility or<br />
Arrangement (1)<br />
Original<br />
Principal<br />
Amount<br />
Balance as of<br />
December 31, Interest<br />
<strong>2010</strong> (2) Rate<br />
Repayment terms<br />
2003 $205.0 million multicurrency<br />
uncommitted<br />
shelf facility:<br />
U.S. dollar denominated $40.0 million $34.3 million 6.2% Notes due July 2016 with annual<br />
principal payments that began in<br />
July <strong>2010</strong>.<br />
$20.0 million $20.0 million 6.2% Notes due January 2017 with<br />
annual principal payments that<br />
began in January 2011.<br />
Japanese yen denominated 3.1 billion yen 1.8 billion yen<br />
($22.0 million as of<br />
December 31, <strong>2010</strong>)<br />
2.3 billion yen 2.3 billion yen<br />
($27.9 million as of<br />
December 31, <strong>2010</strong>)<br />
2.2 billion yen 2.2 billion yen<br />
($26.7 million as of<br />
December 31, <strong>2010</strong>)<br />
1.7% Notes due April 2014, with<br />
annual principal payments that<br />
began in April 2008.<br />
2.6% Notes due September 2017, with<br />
annual principal payments<br />
beginning September 2011.<br />
3.3% Notes due January 2017, with<br />
annual principal payments that<br />
began in January 2011.<br />
<strong>2010</strong> committed loan:<br />
U.S. dollar denominated $30.0 million $30.0 million Variable<br />
30 day:<br />
1.26%<br />
2004 $25.0 million revolving N/A None N/A<br />
credit facility<br />
2009 $100.0 million uncommitted N/A None N/A<br />
multi-currency shelf facility<br />
Amortizes at $1.5 million<br />
per quarter.<br />
(1)<br />
Each of the credit facilities and arrangements listed in the table are secured by guarantees issued by our material domestic subsidiaries and by pledges of 65% of the outstanding<br />
stock of our material foreign subsidiaries. The <strong>2010</strong> committed loan is also secured by deeds of trust with respect to our corporate headquarters and distribution<br />
center in Provo, Utah.<br />
(2)<br />
The current portion of our long-term debt (i.e. becoming due in the next 12 months) includes $13.3 million of the balance of our Japanese yen-denominated debt under the 2003<br />
multi-currency uncommitted shelf facility, $8.6 million of the balance on our U.S. dollar denominated debt under the 2003 multi-currency uncommitted shelf facility and $6.0<br />
million of our <strong>2010</strong> committed loan.<br />
Our board of directors has approved a stock repurchase program<br />
authorizing us to repurchase our outstanding shares of Class A common<br />
stock on the open market or in private transactions. The repurchases<br />
are used primarily to offset dilution from our equity incentive<br />
plans and for strategic initiatives. During the year ended December<br />
31, <strong>2010</strong>, we repurchased approximately 2.2 million shares of Class A<br />
common stock under this program for approximately $58.5 million. In<br />
June <strong>2010</strong>, our board of directors authorized an increase of $150.0<br />
million in the amount available under our ongoing stock repurchase<br />
program. At December 31, <strong>2010</strong>, $153.6 million was available for repurchases<br />
under the stock repurchase program.<br />
During each quarter of <strong>2010</strong>, our board of directors declared cash<br />
dividends on our Class A common stock of $0.125 per share. These<br />
quarterly cash dividends totaled approximately $31.2 million and were<br />
paid during <strong>2010</strong> to stockholders of record in <strong>2010</strong>. The board of direc-<br />
45
tors has approved an increased quarterly cash dividend of $0.135 per<br />
share of Class A common stock to be paid on March 16, 2011, to stockholders<br />
of record on February 25, 2011. <strong>Annual</strong>ly, this would increase<br />
the dividend to $0.54 from $0.50 in the prior year. Currently, we anticipate<br />
that our board of directors will continue to declare quarterly<br />
cash dividends and that the cash flows from operations will be sufficient<br />
to fund our future dividend payments. However, the continued declaration<br />
of dividends is subject to the discretion of our board of directors<br />
and will depend upon various factors, including our net earnings,<br />
financial condition, cash requirements, future prospects and other<br />
factors deemed relevant by our board of directors.<br />
We believe we have sufficient liquidity to be able to meet our<br />
obligations on both a short- and long-term basis. We currently believe<br />
that existing cash balances, future cash flows from operations and existing<br />
lines of credit will be adequate to fund our cash needs on both<br />
a short- and long-term basis. The majority of our historical expenses<br />
have been variable in nature and as such, a potential reduction in the<br />
level of revenue would reduce our cash flow needs. In the event that<br />
our current cash balances, future cash flow from operations and current<br />
lines of credit are not sufficient to meet our obligations or strategic<br />
needs, we would consider raising additional funds in the debt or equity<br />
markets or restructuring our current debt obligations. Additionally,<br />
we would consider realigning our strategic plans, including a reduction<br />
in capital spending, stock repurchases or dividend payments.<br />
CONTRACTUAL OBLIGATIONS AND CONTINGENCIES<br />
The following table sets forth payments due by period for fixed contractual obligations as of December 31, <strong>2010</strong> (U.S. dollars in thousands):<br />
Total 2011 2012–2013 2014–2015 Thereafter<br />
Long-term debt obligations. . . . . . . . . . . $ 160,878 $ 27,865 $ 67,730 $ 38,242 $ 27,041<br />
Operating lease obligations . . . . . . . . . . . 61,931 15,073 26,069 20,631 158<br />
Purchase obligations . . . . . . . . . . . . . . . . . . 111,942 68,351 22,319 20,161 1,111<br />
Related party payable . . . . . . . . . . . . . . . . . 16,995 16,995 — — —<br />
Other long-term liabilities reflected<br />
on the balance sheet (1) . . . . . . . . . . . . . . . — — — — —<br />
Total . . . . . . . . . . . . . . . . . . . . . . . . . . . . . . . $ 351,746 $ 128,284 $ 116,118 $ 79,034 $ 28,310<br />
(1)<br />
Other long-term liabilities reflected on the balance sheet of $71.5 million primarily consisting of long-term tax related balances, in which the timing of the commitments is uncertain.<br />
Due to the international nature of our business, we are subject<br />
from time to time to reviews and audits by the foreign taxing authorities<br />
of the various jurisdictions in which we conduct business throughout<br />
the world. We are currently involved in two separate disputes<br />
with the customs authorities in Japan with respect to duty assessments<br />
on several of our Pharmanex nutritional products totaling approximately<br />
5.3 billion Japanese yen as of December 31, <strong>2010</strong> (approximately<br />
$65.3 million), net of any recovery of consumption taxes.<br />
We also recently were notified that we are likely to receive an additional<br />
assessment of 0.6 billion Japanese yen (approximately $7.7 million)<br />
related to the second dispute.<br />
The first dispute relates to additional customs assessments<br />
made by Yokohama Customs for the period of October 2002<br />
through July 2005. The aggregate amount of these additional assessments<br />
is 2.7 billion Japanese yen (approximately $33.2 million as<br />
of December 31, <strong>2010</strong>), net of any recovery of consumption taxes.<br />
The dispute relates to whether we used the proper valuation method<br />
for these products in determining the applicable customs duties. The<br />
primary legal issue in the case is whether the relevant import transaction<br />
is a sale between our third party manufacturers and our Japan<br />
subsidiary, or a sale between our US subsidiary and our Japan subsidiary.<br />
In 1999, we worked with the Yokohama Customs authorities<br />
to restructure the form of the relevant transactions in order to have<br />
the import transaction be a sale between our third party manufacturers<br />
and our Japan subsidiary, and thus have the duties assessed on<br />
the price paid to our third party manufacturers. With the input and<br />
guidance of the Yokohama Customs authorities, we restructured the<br />
form of the transaction and the agreements between the relevant<br />
parties based on these discussions so that our US subsidiary would<br />
be acting on behalf of our Japan subsidiary with respect to the purchase<br />
of these products rather than as a buyer/seller. Our Japan subsidiary<br />
entered into a Memorandum of Understanding with each of<br />
our third party manufacturers of the relevant products, which provided<br />
that our Japan subsidiary was the purchaser of the products<br />
and that our US subsidiary was acting for and on behalf of our Japan<br />
subsidiary with respect to these products. Our Japan subsidiary also<br />
entered into a Memorandum of Understanding with our US subsidiary<br />
documenting the same agency relationship. We believe that<br />
these legal documents establish that our US subsidiary was acting as<br />
an agent and not buyer and seller of the relevant products. The additional<br />
assessment of duties by Yokohama Customs was based on<br />
its re-characterization of the transaction as a sale between our US<br />
subsidiary and our Japan subsidiary for custom law purposes despite<br />
46
the legal form of the transaction. We do not believe the legal documentation<br />
supports the re-characterization of these transactions.<br />
Yokohama Customs has raised several issues to support its re-characterization,<br />
including the fact that we have treated the relevant<br />
transaction as a sale between our US subsidiary and Japan subsidiary<br />
for income tax purposes. However, we believe that the relevant income<br />
tax and transfer pricing rules and regulations apply different<br />
standards and are not relevant to the customs issue. Because we believe<br />
that the legal documentation for these transactions support our<br />
position, we filed a complaint in the Tokyo District Court Civil Action<br />
Section in December 2006 to have the Ministry of Finance’s affirmation<br />
of the additional assessments reversed. The final hearing on this<br />
matter was held on February 1, 2011 and the court indicated it would<br />
issue a decision on this case on March 25, 2011. Either party has the<br />
right to appeal this decision. If we receive an adverse decision in this<br />
case, we may be required to record an expense for the full amount of<br />
the disputed assessments, or $33.2 million.<br />
The second dispute relates to additional customs assessments<br />
made by Yokohama Customs for the period of October 2006<br />
through November 2008 in connection with an audit in 2009, as well<br />
as the disputed portion of our current import duty rate we have been<br />
required to pay or hold in bond, and have paid under protest, since<br />
October of 2009. The aggregate amount of these additional assessments<br />
and disputed duties is 2.6 billion Japanese yen as of December<br />
31, <strong>2010</strong> (approximately $32.1 million), net of any recovery of consumption<br />
taxes. We were also recently notified that we are likely to be<br />
assessed an additional 0.6 billion Japanese yen (approximately $7.7<br />
million), net of any recovery of consumption taxes based on an audit<br />
of the period of November 2008 through September 2009. With this<br />
assessment, we have been required to pay additional assessments for<br />
all periods from October 2006 to present and we believe that additional<br />
assessments related to any prior period would be barred by<br />
applicable statutes of limitations. In July 2005, we changed our operating<br />
structure in Japan and believed that these changes would eliminate<br />
further valuation disputes with Yokohama Customs as the new<br />
structure eliminated the issues that were the basis of the litigation in<br />
the first dispute (i.e., whether our US subsidiary was acting as an<br />
agent for our Japan subsidiary or was acting as the seller). However,<br />
in October 2009 we received notice from Yokohama Customs authorities<br />
that they were assessing additional duties, penalties and interest<br />
for the period of October 2006 through November 2008<br />
based on their view that we were not utilizing the proper valuation<br />
method. The basis for such additional assessment is different from<br />
the issues that are being litigated in the first dispute. The issue in this<br />
second case is whether a US entity utilizing a commissionaire agent<br />
in Japan to import its products can use the manufacturer’s invoice or<br />
must use another valuation method, and, if an alternative method<br />
must be used, what the allowable deductions would be in determining<br />
the proper valuation. Following our review of the assessments<br />
and after consulting with our legal and customs advisors, we believe<br />
that the additional assessments are improper and are not supported<br />
by applicable customs laws. We filed letters of protest with Yokohama<br />
Customs, which were rejected. We have appealed the matter to<br />
the Ministry of Finance in Japan. In addition, we are currently being<br />
required to post a bond or make a deposit equal to the difference<br />
between our declared duties and the amount the customs authorities<br />
have determined we should be paying on all current imports. Because<br />
we believe that the higher rate determined by the customs<br />
authorities is an improper application of the regulations, we are currently<br />
expensing the portion of the duties we believe is supported<br />
under applicable customs law, and recording the additional deposit<br />
or payment as a receivable within long-term assets in our consolidated<br />
financial statements. To the extent that we are unsuccessful in<br />
recovering the amounts assessed and paid or held in bond, we will<br />
likely be required to record an expense for the full amount of the disputed<br />
assessments, or $32.1 million as of December 31, <strong>2010</strong>.<br />
SEASONALITY AND CYCLICALITY<br />
In addition to general economic factors, we are impacted by seasonal<br />
factors and trends such as major cultural events and vacation patterns.<br />
For example, most Asian markets celebrate their respective local New Year<br />
in the first quarter, which generally has a negative impact on that quarter.<br />
We believe that direct selling in Japan, the United States and Europe is<br />
also generally negatively impacted during the third quarter, when many<br />
individuals, including our distributors, traditionally take vacations.<br />
We have experienced rapid revenue growth in certain new markets<br />
following commencement of operations. This initial rapid growth has often<br />
been followed by a short period of stable or declining revenue, then followed<br />
by renewed growth fueled by product introductions, an increase in the<br />
number of active distributors and increased distributor productivity. The<br />
contraction following initial rapid growth has been more pronounced in<br />
certain new markets, due to other factors such as business or economic<br />
conditions or distributor distractions outside the market.<br />
47
DISTRIBUTOR INFORMATION<br />
The following table provides information concerning the number of active and executive distributors as of the dates indicated. Active<br />
distributors are those distributors and preferred customers who were resident in the countries in which we operated and purchased products<br />
for resale or personal consumption directly from us during the three months ended as of the date indicated. Executive distributors are active<br />
distributors who have achieved required monthly personal and group sales volumes as well as sales representatives in China who have completed<br />
a qualification process.<br />
As of December 31, 2008 As of December 31, 2009 As of December 31, <strong>2010</strong><br />
Active Executive Active Executive Active Executive<br />
North Asia . . . . . . . . . . . . . . . . . . . . . 326,000 13,937 319,000 14,144 329,000 14,687<br />
Greater China . . . . . . . . . . . . . . . . . . 115,000 6,323 106,000 6,938 118,000 8,015<br />
Americas . . . . . . . . . . . . . . . . . . . . . . . 171,000 4,876 171,000 5,522 161,000 5,305<br />
South Asia/Pacific . . . . . . . . . . . . . . 66,000 2,541 71,000 2,950 84,000 3,930<br />
Europe . . . . . . . . . . . . . . . . . . . . . . . . . . 83,000 2,911 94,000 3,385 107,000 3,739<br />
Total . . . . . . . . . . . . . . . . . . . . . . . . . . 761,000 30,588 761,000 32,939 799,000 35,676<br />
QUARTERLY RESULTS<br />
The following table sets forth selected unaudited quarterly data for the periods shown (U.S. dollars in millions, except per share amounts):<br />
2009 <strong>2010</strong><br />
1st<br />
Quarter<br />
2nd<br />
Quarter<br />
3rd<br />
Quarter<br />
4th<br />
Quarter<br />
1st<br />
Quarter<br />
2nd<br />
Quarter<br />
3rd<br />
Quarter<br />
4th<br />
Quarter<br />
Revenue . . . . . . . . . . . . . . . . $ 296.2 $ 322.6 $ 334.2 $ 378.1 $ 364.1 $ 388.4 $ 383.6 $ 401.2<br />
Gross profit . . . . . . . . . . . . . . 242.4 261.9 272.1 311.0 299.3 320.4 314.8 330.3<br />
Operating income . . . . . . . 20.2 34.4 40.9 52.2 46.1 59.2 52.9 58.9<br />
Net income . . . . . . . . . . . . . . 11.8 22.1 25.6 30.3 31.0 32.4 35.3 37.3<br />
Net income per share:<br />
Basic . . . . . . . . . . . . . . . . . . . 0.19 0.35 0.41 0.48 0.50 0.51 0.57 0.60<br />
Diluted . . . . . . . . . . . . . . . . . 0.19 0.35 0.40 0.47 0.48 0.50 0.55 0.58<br />
RECENT ACCOUNTING PRONOUNCEMENTS<br />
In January <strong>2010</strong>, the Financial Accounting Standards Board issued<br />
guidance to amend the disclosure requirements related to recurring<br />
and nonrecurring fair value measurements. The guidance requires new<br />
disclosures on the transfers of assets and liabilities between Level 1<br />
(quoted prices in active market for identical assets or liabilities) and<br />
Level 2 (significant other observable inputs) of the fair value measurement<br />
hierarchy, including the reasons and the timing of the transfers.<br />
Additionally, the guidance requires a roll forward of activities on purchases,<br />
sales, issuance, and settlements of the assets and liabilities<br />
measured using significant unobservable inputs (Level 3 fair value<br />
measurements). The guidance became effective for our reporting<br />
period beginning January 3, <strong>2010</strong>, except for the disclosure on the roll<br />
forward activities for Level 3 fair value measurements, which will become<br />
effective our reporting period beginning January 1, 2011. Adoption of<br />
this new guidance will not have a material impact on our unaudited<br />
condensed consolidated financial statements.<br />
During the first quarter of <strong>2010</strong>, we adopted new accounting guidance<br />
issued by the Financial Accounting Standards Board (“FASB”) related to<br />
transfers of financial assets. This guidance modifies the requirements for<br />
derecognizing financial assets from a transferor’s balance sheet and requires<br />
additional disclosures about transfers of financial assets and any continuing<br />
involvement by the transferor. The new guidance did not have a significant<br />
impact on our operating results, financial condition or disclosures.<br />
In October 2009, the FASB issued amendments to the criteria<br />
for separating consideration in multiple-deliverable arrangements.<br />
These amendments will establish a selling price hierarchy for determining<br />
the selling price of a deliverable. The amendments will require that<br />
a vendor determine its best estimate of selling price in a manner that<br />
is consistent with that used to determine the price to sell the deliverable<br />
on a standalone basis. These amendments will eliminate the residual<br />
method of allocation and require that arrangement consideration be<br />
allocated at the inception of the arrangement to all deliverables using<br />
the relative selling price method. These amendments will expand dis-<br />
48
closures related to vendor’s multiple-deliverable revenue arrangements.<br />
These amendments will be effective for our fiscal 2011 year end. We<br />
are currently evaluating the impact these amendments will have on<br />
our consolidated financial statements and disclosures.<br />
In June 2009, the FASB amended the consolidation accounting<br />
guidance. Effective January 1, <strong>2010</strong>, we are required to qualitatively<br />
assess the determination of our being the primary beneficiary (“consolidator”)<br />
of a variable interest entity (“VIE”) on whether we (1) have<br />
the power to direct matters that most significantly impact the activities<br />
of the VIE, and (2) have the obligation to absorb losses or the right to<br />
receive benefits of the VIE that could potentially be significant to the<br />
VIE. It also requires an ongoing reconsideration of the primary beneficiary<br />
and amends events that trigger a reassessment of whether an<br />
entity is a VIE. The new model is applicable to all new and existing<br />
VIEs. The adoption of this new guidance on January 1, <strong>2010</strong>, had no<br />
impact on our consolidated financial position or results of operation.<br />
In June 2009, the FASB amended the accounting guidance for<br />
determining whether a transfer of a financial asset qualifies for sale<br />
accounting. The amended guidance also provided four broad disclosure<br />
objectives designed to provide users of the financial statements<br />
with an understanding of.<br />
• the transferor’s continuing involvement with the transferred<br />
assets;<br />
• the nature of any restrictions on the transferor’s assets that relate<br />
to a transferred financial asset, including the carrying amount<br />
of those assets;<br />
• how servicing assets and servicing liabilities are reported by the<br />
transferor; and<br />
• how a transfer of financial assets affects the company’s balance<br />
sheet, earnings and cash flows.<br />
The prospective adoption of this guidance to new transfers of<br />
financial assets beginning January 1, <strong>2010</strong>, had no impact on our consolidated<br />
financial position or results of operation.<br />
CURRENCY RISK AND EXCHANGE RATE INFORMATION<br />
A majority of our revenue and many of our expenses are recognized<br />
outside of the United States, except for inventory purchases, which are<br />
primarily transacted in U.S. dollars from vendors in the United States.<br />
The local currency of each of our Subsidiaries’ primary markets is considered<br />
the functional currency. All revenue and expenses are translated<br />
at weighted-average exchange rates for the periods reported.<br />
Therefore, our reported revenue and earnings will be positively impacted<br />
by a weakening of the U.S. dollar and will be negatively impacted<br />
by a strengthening of the U.S. dollar. Given the large portion<br />
of our business derived from Japan, any weakening of the yen negatively<br />
impacts reported revenue and profits, whereas a strengthening<br />
of the yen positively impacts our reported revenue and profits. Given<br />
the uncertainty of exchange rate fluctuations, it is difficult to predict the<br />
effect of these fluctuations on our future business, product pricing and<br />
results of operation or financial condition. However, based on current<br />
exchange rate levels, we currently anticipate that foreign currency fluctuations<br />
will have a positive impact on reported revenue in 2011.<br />
We may seek to reduce our exposure to fluctuations in foreign<br />
currency exchange rates through the use of foreign currency exchange<br />
contracts, through intercompany loans of foreign currency and through<br />
our Japanese yen-denominated debt. We do not use derivative financial<br />
instruments for trading or speculative purposes. We regularly<br />
monitor our foreign currency risks and periodically take measures to<br />
reduce the impact of foreign exchange fluctuations on our operating<br />
results. At December 31, <strong>2010</strong>, we held forward contracts designated<br />
as foreign currency cash flow hedges with notional amounts totaling<br />
approximately $22.2 million to cash flow hedges for forecasted foreigncurrency-denominated<br />
intercompany transactions. At December 31,<br />
2009, we held forward contracts designated as foreign currency cash<br />
flow hedges with notional amounts totaling approximately $3.0 million<br />
to hedge forecasted foreign-currency-denominated intercompany<br />
transactions. Because of our foreign exchange contracts at December<br />
31, <strong>2010</strong>, the impact of a 10% appreciation or 10% depreciation of the<br />
U.S. dollar against the Japanese yen would not represent a material<br />
potential loss in fair value, earnings or cash flows against these contracts.<br />
This potential loss does not consider the underlying foreign currency<br />
transaction or translation exposures to which we are subject.<br />
49
Following are the weighted-average currency exchange rates of U.S. $1 into local currency for each of our international or foreign markets<br />
in which revenue exceeded U.S. $5.0 million for at least one of the quarters listed.<br />
1st<br />
Quarter<br />
2nd<br />
Quarter<br />
2009 <strong>2010</strong><br />
3rd<br />
Quarter<br />
4th<br />
Quarter<br />
1st<br />
Quarter<br />
2nd<br />
Quarter<br />
3rd<br />
Quarter<br />
4th<br />
Quarter<br />
Japan (1) . . . . . . . . . . . . 93.6 97.3 93.5 89.9 90.6 92.0 85.7 82.6<br />
Taiwan. . . . . . . . . . . . . . 34.0 33.1 32.8 32.3 31.9 31.8 31.9 30.3<br />
Hong Kong . . . . . . . . 7.8 7.8 7.8 7.8 7.8 7.8 7.8 7.8<br />
South Korea . . . . . . . 1,418.4 1,282.8 1,237.3 1,167.4 1,142.0 1,163.2 1,182.3 1,133.5<br />
Malaysia . . . . . . . . . . . 3.6 3.5 3.5 3.4 3.4 3.2 3.2 3.1<br />
Thailand . . . . . . . . . . . 35.3 34.7 34.0 33.3 32.9 32.4 31.6 30.0<br />
China . . . . . . . . . . . . . . 6.8 6.8 6.8 6.8 6.8 6.8 6.8 6.7<br />
Singapore. . . . . . . . . . 1.5 1.5 1.4 1.4 1.4 1.4 1.4 1.3<br />
Canada . . . . . . . . . . . . 1.2 1.2 1.1 1.1 1.0 1.0 1.0 1.0<br />
(1)<br />
As of February 1, 2011, the exchange rate of U.S. $1 into the Japanese yen was approximately 81.35.<br />
ITEM 7A. QUANTITATIVE AND QUALITATIVE DISCLOSURES ABOUT MARKET RISK<br />
The information required by Item 7A of Form 10-K is incorporated herein by reference from the information contained in Item 7. “Management’s<br />
Discussion and Analysis of Financial Condition and Results of Operation - Currency Risk and Exchange Rate Information” and Note 15 to the<br />
Consolidated Financial Statements.<br />
ITEM 8.<br />
FINANCIAL STATEMENTS AND SUPPLEMENTARY DATA<br />
1. Financial Statements. Set forth below is the index to the Financial Statements included in this Item 8:<br />
Consolidated Balance Sheets at December 31, 2009 and <strong>2010</strong> 51<br />
Consolidated Statements of Income for the years ended 52<br />
December 31, 2008, 2009 and <strong>2010</strong><br />
Consolidated Statements of Stockholders’ Equity and Comprehensive Income for the years ended 53<br />
December 31, 2008, 2009 and <strong>2010</strong><br />
Consolidated Statements of Cash Flows for the years ended 54<br />
December 31, 2008, 2009 and <strong>2010</strong><br />
Notes to Consolidated Financial Statements 55<br />
<strong>Report</strong> of Independent Registered Public Accounting Firm 77<br />
2. Financial Statement Schedules: Financial statement schedules have been omitted because they are not required or are not<br />
applicable, or because the required information is shown in the financial statements or notes thereto.<br />
Page<br />
50
NU SKIN ENTERPRISES, INC.<br />
Consolidated Balance Sheets<br />
(U.S. dollars in thousands)<br />
December 31,<br />
2009 <strong>2010</strong><br />
ASSETS<br />
Current assets<br />
Cash and cash equivalents $ 158,045 $ 230,337<br />
Accounts receivable 22,513 25,701<br />
Inventories, net 105,661 114,475<br />
Prepaid expenses and other 51,724 52,013<br />
337,943 422,526<br />
Property and equipment, net 79,356 133,722<br />
Goodwill 112,446 112,446<br />
Other intangible assets, net 81,968 78,270<br />
Other assets 136,736 145,260<br />
Total assets $ 748,449 $ 892,224<br />
LIABILITIES AND STOCKHOLDERS’ EQUITY<br />
Current liabilities<br />
Accounts payable $ 25,292 $ 25,480<br />
Accrued expenses 124,520 146,108<br />
Current portion of long-term debt 35,400 27,865<br />
Related party payable — 16,995<br />
185,212 216,448<br />
Long-term debt 121,119 133,013<br />
Other liabilities 66,431 71,514<br />
Total liabilities 372,762 420,975<br />
Commitments and contingencies (Notes 9, 13 and 19)<br />
Stockholders’ equity<br />
Class A common stock—500 million shares authorized,<br />
$.001 par value, 90.6 million shares issued 91 91<br />
Additional paid-in capital 232,219 256,505<br />
Treasury stock, at cost—27.8 and 28.5 million shares (433,567) (476,748)<br />
Accumulated other comprehensive loss (68,134) (58,539)<br />
Retained earnings 645,078 749,940<br />
375,687 471,249<br />
Total liabilities and stockholders’ equity $ 748,449 $ 892,224<br />
The accompanying notes are an integral part of these consolidated financial statements.<br />
51
NU SKIN ENTERPRISES, INC.<br />
Consolidated Statements of Income<br />
(U.S. dollars in thousands, except per share amounts)<br />
Year Ended December 31,<br />
2008 2009 <strong>2010</strong><br />
Revenue $ 1,247,646 $ 1,331,058 $ 1,537,259<br />
Cost of sales 228,597 243,648 272,431<br />
Gross profit 1,019,049 1,087,410 1,264,828<br />
Operating expenses:<br />
<strong>Selling</strong> expenses 533,151 559,605 646,348<br />
General and administrative expenses 360,470 369,368 401,418<br />
Restructuring charges — 10,724 —<br />
Total operating expenses 893,621 939,697 1,047,766<br />
Operating income 125,428 147,713 217,062<br />
Other income (expense), net (Note 22) (24,775) (6,589) (9,449)<br />
Income before provision for income taxes 100,653 141,124 207,613<br />
Provision for income taxes 35,306 51,279 71,562<br />
Net income $ 65,347 $ 89,845 $ 136,051<br />
Net income per share:<br />
Basic $ 1.03 $ 1.42 $ 2.18<br />
Diluted $ 1.02 $ 1.40 $ 2.11<br />
Weighted-average common shares outstanding (000s):<br />
Basic 63,510 63,333 62,370<br />
Diluted 64,132 64,296 64,547<br />
The accompanying notes are an integral part of these consolidated financial statements.<br />
52
NU SKIN ENTERPRISES, INC.<br />
Consolidated Statements of Stockholders’ Equity and Comprehensive Income<br />
(U.S. dollars in thousands)<br />
Class A<br />
Common<br />
Stock<br />
Additional<br />
Paid-in Capital<br />
Treasury Stock<br />
Accumulated<br />
Other<br />
Comprehensive<br />
Loss<br />
Retained<br />
Earnings<br />
Balance at January 1, 2008 $ 91 $ 209,821 $ (413,976) $ (67,759) $ 546,832 $ 275,009<br />
Comprehensive income:<br />
Net income — — — — 65,347 65,347<br />
Foreign currency translation adjustment — — — (2,302) — (2,302)<br />
Total comprehensive income 63,045<br />
Repurchase of Class A common stock (Note 10) — — (6,093) — — (6,093)<br />
Exercise of employee stock options (401,000 shares) — 772 3,052 — — 3,824<br />
Excess tax benefit from equity awards — 1,062 — — — 1,062<br />
Stock-based compensation — 7,273 — — — 7,273<br />
Cash dividends — — — — (27,940) (27,940)<br />
Balance at December 31, 2008 91 218,928 (417,017) (70,061) 584,239 316,180<br />
Comprehensive income:<br />
Net income — — — — 89,845 89,845<br />
Foreign currency translation adjustment — — — 1,830 — 1,830<br />
Net unrealized gains on foreign currency cash<br />
fl owh e d g e s — — — 97 — 97<br />
Total comprehensive income 91,772<br />
Repurchase of Class A common stock (Note 10) — — (21,144) — — (21,144)<br />
Exercise of employee stock options (614,000 shares)/<br />
vesting of stock awards — 1,633 4,594 — — 6,227<br />
Excess tax benefit from equity awards — 1,669 — — — 1,669<br />
Stock-based compensation — 9,989 — — — 9,989<br />
Cash dividends — — — — (29,006) (29,006)<br />
Balance at December 31, 2009 91 232,219 (433,567) (68,134) 645,078 375,687<br />
Comprehensive income:<br />
Net income — — — — 136,051 136,051<br />
Foreign currency translation adjustment — — — 9,661 — 9,661<br />
Net unrealized gains on foreign currency cash<br />
fl owh e d g e s — — — 60 — 60<br />
Less: reclassification adjustment for realized<br />
gains in current earnings — — — (126) — (126)<br />
Total comprehensive income 145,646<br />
Repurchase of Class A common stock (Note 10) — — (58,516) — — (58,516)<br />
Reclassification of treasury shares held by subsidiary 3,122 (3,122) — — —<br />
Exercise of employee stock options (1.5 million shares)/<br />
vesting of stock awards — 2,724 18,457 — — 21,181<br />
Excess tax benefit from equity awards — 7,605 — — — 7,605<br />
Stock-based compensation — 10,835 — — — 10,835<br />
Cash dividends — — — — (31,189) (31,189)<br />
Balance at December 31, <strong>2010</strong> $ 91 $ 256,505 $ (476,748) $ (58,539) $ 749,940 $ 471,249<br />
Total<br />
The accompanying notes are an integral part of these consolidated financial statements.<br />
53
NU SKIN ENTERPRISES, INC.<br />
Consolidated Statements of Cash Flows<br />
(U.S. dollars in thousands)<br />
Year Ended December 31,<br />
2008 2009 <strong>2010</strong><br />
Cash flows from operating activities:<br />
Net income $ 65,347 $ 89,845 $ 136,051<br />
Adjustments to reconcile net income to net cash<br />
provided by operating activities:<br />
Depreciation and amortization 30,393 28,557 29,616<br />
Foreign currency (gains)/losses 18,409 (1,966) 3,681<br />
Stock-based compensation 7,273 9,989 10,835<br />
Deferred taxes (4,078) 12,350 (13,735)<br />
Changes in operating assets and liabilities:<br />
Accounts receivable 7,069 (7,043) (6,649)<br />
Inventories, net (14,910) 9,740 (4,293)<br />
Prepaid expenses and other 4,260 (3,850) 3,854<br />
Other assets 1,699 (18,690) (1,631)<br />
Accounts payable (6,139) 3,602 (568)<br />
Accrued expenses (3,250) 8,598 13,777<br />
Other liabilities (2,766) 2,812 16,945<br />
Net cash provided by operating activities 103,307 133,944 187,883<br />
Cash flows from investing activities:<br />
Purchase of property and equipment (16,007) (20,215) (53,783)<br />
Proceeds on investment sales 19,135 — —<br />
Purchases of investments (13,910) — —<br />
Net cash used in investing activities (10,782) (20,215) (53,783)<br />
Cash flows from financing activities:<br />
Payment of cash dividends (27,940) (29,006) (31,189)<br />
Repurchase of shares of common stock (6,094) (21,144) (58,516)<br />
Exercise of distributor and employee stock options 3,824 6,227 21,181<br />
Income tax benefit of options exercised 227 1,101 6,908<br />
Payments on long-term debt (32,711) (30,188) (37,401)<br />
Proceeds from long-term debt — — 30,000<br />
Net cash used in financing activities (62,694) (73,010) (69,017)<br />
Effect of exchange rate changes on cash (2,572) 2,740 7,209<br />
Net increase in cash and cash equivalents 27,259 43,459 72,292<br />
Cash and cash equivalents, beginning of period 87,327 114,586 158,045<br />
Cash and cash equivalents, end of period $ 114,586 $ 158,045 $ 230,337<br />
The accompanying notes are an integral part of these consolidated financial statements.<br />
54
NU SKIN ENTERPRISES, INC.<br />
Notes to Consolidated Financial Statements<br />
1. THE COMPANY<br />
<strong>Nu</strong> <strong>Skin</strong> Enterprises, Inc. (the “Company”) is a leading, global direct<br />
selling company that develops and distributes premium-quality, innovative<br />
personal care products and nutritional supplements that are<br />
sold worldwide under the <strong>Nu</strong> <strong>Skin</strong> and Pharmanex brands and a small<br />
number of other products and services. The Company reports revenue<br />
from five geographic regions: North Asia, which consists of<br />
Japan and South Korea; Greater China, which consists of Mainland<br />
China, Hong Kong, Macau and Taiwan; Americas, which consists of<br />
the United States, Canada and Latin America; South Asia/Pacific,<br />
which consists of Australia, Brunei, Indonesia, Malaysia, New Zealand,<br />
the Philippines, Singapore and Thailand; and Europe, which consists<br />
of several markets in Europe as well as Israel, Russia and South Africa<br />
(the Company’s subsidiaries operating in these countries are collectively<br />
referred to as the “Subsidiaries”).<br />
2. SUMMARY OF SIGNIFICANT<br />
ACCOUNTING POLICIES<br />
CONSOLIDATION<br />
The consolidated financial statements include the accounts of<br />
the Company and the Subsidiaries. All significant intercompany<br />
accounts and transactions are eliminated in consolidation.<br />
USE OF ESTIMATES<br />
The preparation of these financial statements, in conformity with<br />
accounting principles generally accepted in the United States of<br />
America, required management to make estimates and assumptions<br />
that affected the reported amounts of assets and liabilities, and disclosure<br />
of contingent assets and liabilities, at the date of the financial statements<br />
and the reported amounts of revenue and expenses during the<br />
reporting period. Actual results may differ from these estimates.<br />
CASH AND CASH EQUIVALENTS<br />
Cash equivalents are short-term, highly liquid instruments with<br />
original maturities of 90 days or less.<br />
INVENTORIES<br />
Inventories consist primarily of merchandise purchased for resale and<br />
are stated at the lower of cost or market, using the first-in, first-out method.<br />
The Company had reserves for obsolete inventory totaling $6.4 million<br />
and $10.5 million as of December 31, 2009 and <strong>2010</strong>, respectively.<br />
Inventories consist of the following (U.S. dollars in thousands):<br />
December 31,<br />
2009 <strong>2010</strong><br />
Raw materials . . . . . . . . . . . . . . . $ 31,557 $ 31,497<br />
Finished goods . . . . . . . . . . . . . 74,104 82,978<br />
$ 105,661 $ 114,475<br />
PROPERTY AND EQUIPMENT<br />
Property and equipment are recorded at cost and depreciated<br />
using the straight-line method over the following estimated<br />
useful lives:<br />
Buildings . . . . . . . . . . . . . . . . . . . . . . . . . . . . . .<br />
Furniture and fixtures . . . . . . . . . . . . . . . . .<br />
Computers and equipment . . . . . . . . . .<br />
Leasehold improvements . . . . . . . . . . . .<br />
Scanners . . . . . . . . . . . . . . . . . . . . . . . . . . . . . .<br />
Vehicles . . . . . . . . . . . . . . . . . . . . . . . . . . . . . . .<br />
39 years<br />
5 – 7 years<br />
3 – 5 years<br />
Shorter of estimated<br />
useful life or lease term<br />
3 years<br />
3 – 5 years<br />
Expenditures for maintenance and repairs are charged to expense<br />
as incurred. When an asset is sold or otherwise disposed of, the cost<br />
and associated accumulated depreciation are removed from the accounts<br />
and the resulting gain or loss is recognized in the statement of income.<br />
Property and equipment are reviewed for impairment whenever events<br />
or changes in circumstances indicate that the carrying amount of such<br />
assets may not be recoverable. An impairment loss is recognized if the<br />
carrying amount of the asset exceeds its fair value.<br />
GOODWILL AND OTHER INTANGIBLE ASSETS<br />
Acquired intangible assets may represent indefinite-lived assets,<br />
determinable-lived intangibles, or goodwill. Of these, only the costs<br />
of determinable-lived intangibles are amortized to expense over their<br />
estimated life. The value of indefinite-lived intangible assets and residual<br />
goodwill is not amortized, but is tested at least annually for impairment.<br />
Our impairment testing for goodwill is performed separately<br />
from our impairment testing of indefinite-lived intangibles. We<br />
test goodwill for impairment, at least annually, by reviewing the book<br />
value compared to the fair value at the reportable unit level. We test<br />
individual indefinite-lived intangibles at least annually by reviewing the<br />
individual book values compared to the fair value. Considerable management<br />
judgment is necessary to measure fair value. We did not<br />
55
NU SKIN ENTERPRISES, INC.<br />
Notes to Consolidated Financial Statements<br />
recognize any impairment charges for goodwill or intangible assets<br />
during the periods presented.<br />
REVENUE RECOGNITION<br />
Revenue is recognized when products are shipped, which is when<br />
title and risk of loss pass to independent distributors and preferred<br />
customers who are the Company’s customers. A reserve for product<br />
returns is accrued based on historical experience totaling $2.9 million<br />
and $3.3 million as of December 31, 2009 and <strong>2010</strong>, respectively. The<br />
Company generally requires cash or credit card payment at the point<br />
of sale. The Company has determined that no allowance for doubtful<br />
accounts is necessary. Amounts received prior to shipment and title<br />
passage to distributors are recorded as deferred revenue. The global<br />
compensation plan for the Company’s distributors generally does not<br />
provide rebates or selling discounts to distributors who purchase its<br />
products and services. The Company classifies selling discounts and<br />
rebates, if any, as a reduction of revenue.<br />
ADVERTISING EXPENSES<br />
Advertising costs are expensed as incurred. Advertising expense<br />
incurred for the years ended December 31, 2008, 2009 and <strong>2010</strong> totaled<br />
approximately $1.7 million, $2.0 million and $2.1 million, respectively.<br />
SELLING EXPENSES<br />
<strong>Selling</strong> expenses are the Company’s most significant expense and<br />
are classified as operating expenses. <strong>Selling</strong> expenses include distributor<br />
commissions as well as wages, benefits, bonuses and other labor and<br />
unemployment expenses the Company pays to sales employees in<br />
China. The Company pays monthly commissions to several levels of<br />
distributors on each product sale based upon a distributor’s personal<br />
and group product volumes, as well as the group product volumes of up<br />
to six levels of executive distributors in such distributor’s downline sales<br />
organization. The Company does not pay commissions on sales materials.<br />
The Company’s distributors may make retail profits by purchasing<br />
the products from the Company at wholesale and selling them to<br />
customers with a retail mark-up. The Company does not account for<br />
nor pay additional commissions on these retail mark-ups received by<br />
distributors. In many markets, the Company also allows individuals<br />
who are not distributors, referred to as “preferred customers,” to buy<br />
products directly from the Company at wholesale or discounted<br />
prices. The Company pays commissions on preferred customer purchases<br />
to the referring distributors.<br />
As part of the Company’s compensation plan improvements, the<br />
Company increased its focus on distributor recognition. Accordingly,<br />
during <strong>2010</strong>, the costs of certain incentive trips and other rewards earned<br />
by distributors, previously recorded as general and administrative<br />
expenses, have been reclassified as selling expenses. In order to provide<br />
a meaningful comparison, the Company has made this reclassification<br />
for both the current and prior-year periods.<br />
RESEARCH AND DEVELOPMENT<br />
The Company’s research and development activities are conducted<br />
primarily through its Pharmanex division. Research and development<br />
costs are included in general and administrative expenses in the<br />
accompanying consolidated statements of income and are expensed<br />
as incurred and totaled $9.6 million, $10.4 million and $12.4 million in<br />
2008, 2009 and <strong>2010</strong>, respectively.<br />
DEFERRED TAX ASSETS AND LIABILITIES<br />
The Company accounts for income taxes in accordance with the<br />
Income Taxes Topic of the Financial Accounting Standards Codification.<br />
These standards establish financial accounting and reporting standards<br />
for the effects of income taxes that result from an enterprise’s activities<br />
during the current and preceding years. The Company takes an asset<br />
and liability approach for financial accounting and reporting of income<br />
taxes. The Company pays income taxes in many foreign jurisdictions<br />
based on the profits realized in those jurisdictions, which can be significantly<br />
impacted by terms of intercompany transactions between the<br />
Company and its foreign affiliates. Deferred tax assets and liabilities are<br />
created in this process. As of December 31, <strong>2010</strong>, the Company has net<br />
deferred tax assets of $59.9 million. The Company has netted these<br />
deferred tax assets and deferred tax liabilities by jurisdiction. Valuation<br />
allowances are established when necessary to reduce deferred tax assets<br />
to the amounts expected to be ultimately realized.<br />
UNCERTAIN TAX POSITIONS<br />
The Company files income tax returns in the U.S. federal jurisdiction<br />
and in various state and foreign jurisdictions. The Company is currently<br />
under examination by the United States Internal Revenue Service<br />
(the “IRS”) for the 2005, 2006, 2007 and 2008 tax years. With a few<br />
exceptions, the Company is no longer subject to U.S. federal, state and<br />
local income tax examination by tax authorities for years before 2005.<br />
For the tax year 2009, the Company entered into a voluntary program<br />
with the IRS called Compliance Assurance Process (“CAP”). The objective<br />
of CAP is to contemporaneously work with the IRS to achieve<br />
federal tax compliance and resolve all or most of the issues prior to filing<br />
56
NU SKIN ENTERPRISES, INC.<br />
Notes to Consolidated Financial Statements<br />
of the tax return. The Company has elected to participate in the CAP<br />
program for <strong>2010</strong> and 2011 and may elect to continue participating in<br />
CAP for future tax years; the Company may withdraw from the program<br />
at any time. In major foreign jurisdictions, the Company in no longer<br />
subject to income tax examinations for years before 2003. Along with<br />
the IRS examination, the Company is currently under examination in<br />
certain foreign jurisdictions; however, the outcomes of those reviews are<br />
not yet determinable.<br />
A reconciliation of the beginning and ending amount of unrecognized<br />
tax benefits is as follows (U.S. dollars in thousands):<br />
Gross Balance at January 1, 2008. . . . . . . . . . . . . . . . . . . $ 31,875<br />
Increases related to current year tax positions . . . . . . 1,494<br />
Settlements . . . . . . . . . . . . . . . . . . . . . . . . . . . . . . . . . . . . . . . . . (14)<br />
Decreases due to lapse of statutes of limitations . . . (5,977)<br />
Currency adjustments . . . . . . . . . . . . . . . . . . . . . . . . . . . . . . 3,537<br />
Gross Balance at December 31, 2008 $ 30,915<br />
Gross Balance at January 1, 2009 . . . . . . . . . . . . . . . . . . $ 30,915<br />
Increases related to prior year tax positions . . . . . . . . . 2<br />
Increases related to current year tax positions . . . . . . 3,618<br />
Settlements . . . . . . . . . . . . . . . . . . . . . . . . . . . . . . . . . . . . . . . . . (946)<br />
Decreases due to lapse of statutes of limitations . . . (4,858)<br />
Currency adjustments . . . . . . . . . . . . . . . . . . . . . . . . . . . . . . (456)<br />
Gross Balance at December 31, 2009 $ 28,275<br />
Gross Balance at January 1, <strong>2010</strong> . . . . . . . . . . . . . . . . . . . $ 28,275<br />
Decreases related to prior year tax positions. . . . . . . . (1,206)<br />
Increases related to current year tax positions . . . . . . 2,236<br />
Settlements . . . . . . . . . . . . . . . . . . . . . . . . . . . . . . . . . . . . . . . . . —<br />
Decreases due to lapse of statutes of limitations . . . (15,395)<br />
Currency adjustments . . . . . . . . . . . . . . . . . . . . . . . . . . . . . . 911<br />
Gross Balance at December 31, <strong>2010</strong> $ 14,821<br />
At December 31, <strong>2010</strong>, the Company had $14.8 million in unrecognized<br />
tax benefits of which $2.4 million, if recognized, would affect the<br />
effective tax rate. In comparison, at December 31, 2009, the Company<br />
had $28.3 million in unrecognized tax benefits of which $4.4 million, if<br />
recognized, would affect the effective tax rate. The Company’s unrecognized<br />
tax benefits relate to multiple foreign and domestic jurisdictions.<br />
Due to potential increases in unrecognized tax benefits from the multiple<br />
jurisdictions in which the Company operates, as well as the expiration<br />
of various statutes of limitation, it is reasonably possible that the<br />
Company’s gross unrecognized tax benefits, net of foreign currency<br />
adjustments, may change within the next 12 months by a range of approximately<br />
$8 to $11 million.<br />
During each of the years ended December 31, 2008, 2009 and<br />
<strong>2010</strong>, the Company recognized approximately $0.5 million, $0.1 million<br />
and ($1.7) million, respectively in interest and penalties expenses/(benefits).<br />
The Company had approximately $3.2 million, $3.3 million and<br />
$1.6 million of accrued interest and penalties related to uncertain tax<br />
positions at December 31, 2008, 2009 and <strong>2010</strong>, respectively. Interest<br />
and penalties related to uncertain tax positions are recognized as a<br />
component of income tax expense.<br />
NET INCOME PER SHARE<br />
Net income per share is computed based on the weighted-average<br />
number of common shares outstanding during the periods presented.<br />
Additionally, diluted earnings per share data gives effect to all potentially<br />
dilutive common shares that were outstanding during the periods<br />
presented (Note 10)<br />
FOREIGN CURRENCY TRANSLATION<br />
Most of the Company’s business operations occur outside the<br />
United States. The local currency of each of the Company’s subsidiaries<br />
is considered its functional currency. All assets and liabilities are<br />
translated into U.S. dollars at exchange rates existing at the balance<br />
sheet dates, revenue and expenses are translated at weighted-average<br />
exchange rates and stockholders’ equity is recorded at historical<br />
exchange rates. The resulting foreign currency translation adjustments<br />
are recorded as a separate component of stockholders’ equity<br />
in the consolidated balance sheets and transaction gains and losses<br />
are included in other income and expense in the consolidated financial<br />
statements.<br />
FAIR VALUE OF FINANCIAL INSTRUMENTS<br />
The carrying value of financial instruments including cash and<br />
cash equivalents, accounts receivable and accounts payable approximate<br />
fair values due to the short-term nature of these instruments. The carrying<br />
amount of long-term debt approximates fair value because the<br />
applicable interest rates approximate current market rates. Fair value<br />
estimates are made at a specific point in time, based on relevant market<br />
information.<br />
The FASB Codification defines fair value as the price that would<br />
be received to sell an asset or paid to transfer a liability in the principal<br />
57
NU SKIN ENTERPRISES, INC.<br />
Notes to Consolidated Financial Statements<br />
or most advantageous market for the asset or liability in an orderly transaction<br />
between market participants at the measurement date. On a<br />
quarterly basis, the Company measures at fair value certain financial<br />
assets, including cash equivalents and available-for-sale securities. Accounting<br />
standards specify a hierarchy of valuation techniques based<br />
on whether the inputs to those valuation techniques are observable or<br />
unobservable. Observable inputs reflect data obtained from independent<br />
sources, while unobservable inputs reflect the Company’s market<br />
assumptions. These two types of inputs have created the following fairvalue<br />
hierarchy:<br />
• Level 1—quoted prices in active markets for identical assets or<br />
liabilities;<br />
• Level 2—inputs, other than the quoted prices in active markets,<br />
that are observable either directly or indirectly;<br />
• Level 3—unobservable inputs based on the Company’s own<br />
assumptions.<br />
Accounting standards permit companies, at their option, to<br />
choose to measure many financial instruments and certain other<br />
items at fair value. The Company has elected to not fair value existing<br />
eligible items<br />
STOCK-BASED COMPENSATION<br />
All share-based payments, including grants of stock options and<br />
restricted stock units, are required to be recognized in our financial<br />
statements based upon their respective grant date fair values. The<br />
Black-Scholes option pricing model is used to estimate the fair value<br />
of stock options. The determination of the fair value of stock options<br />
is affected by our stock price and a number of assumptions, including<br />
expected volatility, expected life, risk-free interest rate and expected<br />
dividends. We use historical volatility as the expected volatility assumption<br />
required in the Black-Scholes model. The expected life of<br />
the stock options is based on historical data trended into the future.<br />
The risk-free interest rate assumption is based on observed interest<br />
rates appropriate for the expected terms of our stock options. The<br />
fair value of our restricted stock units is based on the closing market<br />
price of our stock on the date of grant less our expected dividend<br />
yield. We recognize stock-based compensation net of any estimated<br />
forfeitures on a straight-line basis over the requisite service period of<br />
the award.<br />
The total compensation expense related to equity compensation<br />
plans was approximately $7.3 million, $10.0 million and $10.8 million<br />
for the years ended December 31, 2008, 2009 and <strong>2010</strong>. For the<br />
years ended December 31, 2008, 2009 and <strong>2010</strong>, all stock-based<br />
compensation expense was recorded within general and administrative<br />
expenses.<br />
REPORTING COMPREHENSIVE INCOME<br />
Comprehensive income is defined as the change in equity of a<br />
business enterprise during a period from transactions and other<br />
events and circumstances from non-owner sources, and it includes all<br />
changes in equity during a period except those resulting from investments<br />
by owners and distributions to owners.<br />
ACCOUNTING FOR DERIVATIVE INSTRUMENTS AND<br />
HEDGING ACTIVITIES<br />
The Company recognizes all derivatives as either assets or liabilities,<br />
with the instruments measured at fair value.<br />
The Company’s Subsidiaries enter into significant transactions<br />
with each other and third parties that may not be denominated in the<br />
respective Subsidiaries’ functional currencies. The Company regularly<br />
monitors its foreign currency risks and seeks to reduce its exposure to<br />
fluctuations in foreign exchange rates using foreign currency exchange<br />
contracts and through certain intercompany loans of foreign currency.<br />
The Company hedges its exposure to future cash flows from<br />
forecasted transactions over a maximum period of 12 months. Hedge<br />
effectiveness is assessed at inception and throughout the life of the<br />
hedge to ensure the hedge qualifies for hedge accounting treatment.<br />
Changes in fair value associated with hedge ineffectiveness, if any, are<br />
recorded in the results of operations currently. In the event that an anticipated<br />
transaction is no longer likely to occur, the Company recognizes<br />
the change in fair value of the derivative in its results of operations<br />
currently.<br />
Changes in the fair value of derivatives are recorded in current<br />
earnings or accumulated other comprehensive loss, depending on the<br />
intended use of the derivative and its resulting designation. The gains<br />
and losses in accumulated other comprehensive loss stemming from<br />
these derivatives will be reclassified into earnings in the period during<br />
which the hedged forecasted transaction affects earnings. The fair<br />
value of the receivable and payable amounts related to these unrealized<br />
gains and losses is classified as other current assets and liabilities.<br />
The Company does not use such derivative financial instruments for<br />
trading or speculative purposes. Gains and losses on certain intercompany<br />
loans of foreign currency are recorded as other income and expense<br />
in the consolidated statements of income.<br />
58
NU SKIN ENTERPRISES, INC.<br />
Notes to Consolidated Financial Statements<br />
RECENT ACCOUNTING PRONOUNCEMENTS<br />
In January <strong>2010</strong>, the Financial Accounting Standards Board issued<br />
guidance to amend the disclosure requirements related to recurring<br />
and nonrecurring fair value measurements. The guidance requires<br />
new disclosures on the transfers of assets and liabilities<br />
between Level 1 (quoted prices in active market for identical assets or<br />
liabilities) and Level 2 (significant other observable inputs) of the fair<br />
value measurement hierarchy, including the reasons and the timing of<br />
the transfers. Additionally, the guidance requires a roll forward of activities<br />
on purchases, sales, issuance, and settlements of the assets<br />
and liabilities measured using significant unobservable inputs (Level<br />
3 fair value measurements). The guidance became effective for the<br />
Company with the reporting period beginning January 3, <strong>2010</strong>, except<br />
for the disclosure on the roll forward activities for Level 3 fair<br />
value measurements, which will become effective for the Company<br />
with the reporting period beginning January 1, 2011. Adoption of this<br />
new guidance will not have a material impact on the Company’s unaudited<br />
condensed consolidated financial statements.<br />
During the first quarter of <strong>2010</strong>, the Company adopted new accounting<br />
guidance issued by the Financial Accounting Standards<br />
Board (“FASB”) related to transfers of financial assets. This guidance<br />
modifies the requirements for derecognizing financial assets from a<br />
transferor’s balance sheet and requires additional disclosures about<br />
transfers of financial assets and any continuing involvement by the<br />
transferor. The new guidance did not have a significant impact on the<br />
Company’s operating results, financial condition or disclosures.<br />
In October 2009, the FASB issued amendments to the criteria<br />
for separating consideration in multiple-deliverable arrangements.<br />
These amendments will establish a selling price hierarchy for determining<br />
the selling price of a deliverable. The amendments will require<br />
that a vendor determine its best estimate of selling price in a manner<br />
that is consistent with that used to determine the price to sell the deliverable<br />
on a standalone basis. These amendments will eliminate the<br />
residual method of allocation and require that arrangement consideration<br />
be allocated at the inception of the arrangement to all deliverables<br />
using the relative selling price method. These amendments will<br />
expand disclosures related to vendor’s multiple-deliverable revenue<br />
arrangements. These amendments will be effective for the Company’s<br />
fiscal 2011 year end. The Company is currently evaluating the<br />
impact these amendments will have on its consolidated financial<br />
statements and disclosures.<br />
In June 2009, the FASB amended the consolidation accounting<br />
guidance. Effective January 1, <strong>2010</strong>, the Company is are required to<br />
qualitatively assess the determination of its being the primary beneficiary<br />
(“consolidator”) of a variable interest entity (“VIE”) on whether<br />
it (1) has the power to direct matters that most significantly impact<br />
the activities of the VIE, and (2) has the obligation to absorb losses or<br />
the right to receive benefits of the VIE that could potentially be significant<br />
to the VIE. It also requires an ongoing reconsideration of the<br />
primary beneficiary and amends events that trigger a reassessment<br />
of whether an entity is a VIE. The new model is applicable to all new<br />
and existing VIEs. The adoption of this new guidance on January 1,<br />
<strong>2010</strong>, had no impact on the Company’s consolidated financial position<br />
or results of operation.<br />
In June 2009, the FASB amended the accounting guidance for<br />
determining whether a transfer of a financial asset qualifies for sale<br />
accounting. The amended guidance also provided four broad disclosure<br />
objectives designed to provide users of the financial statements<br />
with an understanding of.<br />
• the transferor’s continuing involvement with the transferred assets;<br />
• the nature of any restrictions on the transferor’s assets that relate<br />
to a transferred financial asset, including the carrying<br />
amount of those assets;<br />
• how servicing assets and servicing liabilities are reported by the<br />
transferor; and<br />
• how a transfer of financial assets affects the company’s balance<br />
sheet, earnings and cash flows.<br />
The prospective adoption of this guidance to new transfers of<br />
financial assets beginning January 1, <strong>2010</strong>, had no impact on the<br />
Company’s consolidated financial position or results of operation.<br />
3. RELATED PARTY TRANSACTIONS<br />
The Company leased corporate office and warehouse space<br />
from two entities that are owned by certain officers and directors of<br />
the Company. Total lease payments to these two affiliated entities<br />
were $3.8 million, $3.9 million and $3.6 million for the years ended<br />
December 31, 2008, 2009 and <strong>2010</strong>. On December 30, <strong>2010</strong>, the<br />
Company purchased the corporate office and warehouse space from<br />
59
NU SKIN ENTERPRISES, INC.<br />
Notes to Consolidated Financial Statements<br />
these two affiliated entities for approximately $33.0 million. Approximately $16.0 million was paid in cash and the remaining $17.0 million (see<br />
related party payable on the consolidated balance sheet) was paid in January 2011.<br />
4. PROPERTY AND EQUIPMENT<br />
Property and equipment are comprised of the following (U.S. dollars in thousands):<br />
December 31,<br />
2009 <strong>2010</strong><br />
Land . . . . . . . . . . . . . . . . . . . . . . . . . . . . . . . . . . . . . . . . . . . . . . . . . . . . . . . . . . . $ — $ 16,480<br />
Buildings . . . . . . . . . . . . . . . . . . . . . . . . . . . . . . . . . . . . . . . . . . . . . . . . . . . . . . . — 41,496<br />
Furniture and fixtures . . . . . . . . . . . . . . . . . . . . . . . . . . . . . . . . . . . . . . . . . . 54,261 46,799<br />
Computers and equipment . . . . . . . . . . . . . . . . . . . . . . . . . . . . . . . . . . . . 91,481 87,653<br />
Leasehold improvements . . . . . . . . . . . . . . . . . . . . . . . . . . . . . . . . . . . . . . 68,780 56,393<br />
Scanners . . . . . . . . . . . . . . . . . . . . . . . . . . . . . . . . . . . . . . . . . . . . . . . . . . . . . . . . 18,784 9,469<br />
Vehicles . . . . . . . . . . . . . . . . . . . . . . . . . . . . . . . . . . . . . . . . . . . . . . . . . . . . . . . . . 1,943 2,222<br />
235,249 260,512<br />
Less: accumulated depreciation . (155,893) (126,790)<br />
$ 79,356 $ 133,722<br />
Depreciation of property and equipment totaled $24.4 million, $21.8 million and $22.7 million for the years ended December 31, 2008,<br />
2009 and <strong>2010</strong>.<br />
5. GOODWILL AND OTHER INTANGIBLE ASSETS<br />
Goodwill and other intangible assets consist of the following (U.S. dollars in thousands):<br />
Carrying Amount at<br />
December 31,<br />
Goodwill and indefinite life intangible assets: 2009 <strong>2010</strong><br />
Goodwill . . . . . . . . . . . . . . . . . . . . . . . . . . . . . . . . . . . . . . . . . . . . . . . . . . . . . . . . . . . . . . . . . . . $ 112,446 $ 112,446<br />
Trademarks and trade names . . . . . . . . . . . . . . . . . . . . . . . . . . . . . . . . . . . . . . . . . . . . . . 24,599 24,599<br />
$ 137,045 $ 137,045<br />
December 31, 2009 December 31, <strong>2010</strong><br />
Finite life intangible assets:<br />
Gross Carrying<br />
Amount<br />
Accumulated<br />
Amortization<br />
Gross Carrying<br />
Amount<br />
Accumulated<br />
Amortization<br />
Weighted-average<br />
Amortization Period<br />
Scanner technology . . . . . . . . $ 46,482 $ 15,390 $ 46,482 $ 18,423 18 years<br />
Developed technology . . . . . 22,500 12,612 22,500 13,436 20 years<br />
Distributor network . . . . . . . . . 11,598 8,085 11,598 8,587 15 years<br />
Trademarks . . . . . . . . . . . . . . . . . 13,316 8,837 13,323 9,524 15 years<br />
Other . . . . . . . . . . . . . . . . . . . . . . . 29,755 21,358 32,989 23,251 5 years<br />
$ 123,651 $ 66,282 $ 126,892 $ 73,221 15 years<br />
60
NU SKIN ENTERPRISES, INC.<br />
Notes to Consolidated Financial Statements<br />
Amortization of finite-life intangible assets totaled $6.0 million, $6.8 million and $6.9 million for the years ended December 31, 2008, 2009 and<br />
<strong>2010</strong>, respectively. <strong>Annual</strong> estimated amortization expense is expected to approximate $6.0 million for each of the five succeeding fiscal years.<br />
All of the Company’s goodwill is based in the U.S. Goodwill and indefinite life intangible assets are not amortized, rather they are subject<br />
to annual impairment tests. <strong>Annual</strong> impairment tests were completed resulting in no impairment charges for any of the periods shown. Finite<br />
life intangibles are amortized over their useful lives unless circumstances occur that cause the Company to revise such lives or review such assets<br />
for impairment.<br />
6. OTHER ASSETS<br />
Other assets consist of the following (U.S. dollars in thousands):<br />
December 31,<br />
2009 <strong>2010</strong><br />
Deferred taxes . . . . . . . . . . . . . . . . . . . . . . . . . . . . . . . . . . . . . . . . . . . . . . . . . . . . . . . . . . . . . . . . . . . $ 49,030 $ 45,027<br />
Deposits for noncancelable operating leases . . . . . . . . . . . . . . . . . . . . . . . . . . . . . . . . . . . 20,713 14,261<br />
Deposit for customs assessment (Note 19) . . . . . . . . . . . . . . . . . . . . . . . . . . . . . . . . . . . . . 46,476 65,255<br />
Other . . . . . . . . . . . . . . . . . . . . . . . . . . . . . . . . . . . . . . . . . . . . . . . . . . . . . . . . . . . . . . . . . . . . . . . . . . . . 20,517 20,717<br />
$ 136,736 $ 145,260<br />
7. ACCRUED EXPENSES<br />
Accrued expenses consist of the following (U.S. dollars in thousands):<br />
December 31,<br />
2009 <strong>2010</strong><br />
Accrued commissions and other payments to distributors . . . . . . . . . . . . . . . . . . . . . $ 50,332 $ 66,335<br />
Other taxes payable . . . . . . . . . . . . . . . . . . . . . . . . . . . . . . . . . . . . . . . . . . . . . . . . . . . . . . . . . . . . . 5,596 15,948<br />
Accrued payroll and payroll taxes . . . . . . . . . . . . . . . . . . . . . . . . . . . . . . . . . . . . . . . . . . . . . . . 12,790 13,063<br />
Accrued payable to vendors . . . . . . . . . . . . . . . . . . . . . . . . . . . . . . . . . . . . . . . . . . . . . . . . . . . . 12,438 9,744<br />
Accrued severance . . . . . . . . . . . . . . . . . . . . . . . . . . . . . . . . . . . . . . . . . . . . . . . . . . . . . . . . . . . . . . 2,537 112<br />
Other accrued employee expenses . . . . . . . . . . . . . . . . . . . . . . . . . . . . . . . . . . . . . . . . . . . . . 15,800 19,704<br />
Other . . . . . . . . . . . . . . . . . . . . . . . . . . . . . . . . . . . . . . . . . . . . . . . . . . . . . . . . . . . . . . . . . . . . . . . . . . . . 25,027 21,202<br />
$ 124,520 $ 146,108<br />
61
NU SKIN ENTERPRISES, INC.<br />
Notes to Consolidated Financial Statements<br />
8. LONG-TERM DEBT<br />
The following tables summarize the Company’s long-term debt arrangements as of December 31, <strong>2010</strong>:<br />
Facility or<br />
Arrangement (1)<br />
2003 $205.0 million multi-currency<br />
uncommitted shelf facility:<br />
Original Principal<br />
Amount<br />
Balance as of<br />
December 31, Interest<br />
<strong>2010</strong> (2) Rate<br />
Repayment terms<br />
U.S. dollar denominated $40.0 million $34.3 million 6.2% Notes due July 2016, with annual<br />
principal payments that began in<br />
July <strong>2010</strong>.<br />
$20.0 million $20.0 million 6.2% Notes due January 2017, with annual<br />
principal payments that began in<br />
January 2011.<br />
Japanese yen denominated 3.1 billion yen 1.8 billion yen ($22.0<br />
million as of December<br />
31, <strong>2010</strong>)<br />
2.3 billion yen 2.3 billion yen ($27.9<br />
million as of December<br />
31, <strong>2010</strong>)<br />
2.2 billion yen 2.2 billion yen ($26.7<br />
million as of December<br />
31, <strong>2010</strong>)<br />
<strong>2010</strong> committed loan:<br />
U.S. dollar denominated $30.0 million $30.0 million Variable 30<br />
day: 1.26%<br />
2004 $25.0 million revolving credit N/A None N/A<br />
facility<br />
2009 $100.0 million uncommitted N/A None N/A<br />
multi-currency shelf facility<br />
1.7% Notes due April 2014, with annual<br />
principal payments that began in<br />
April 2008.<br />
2.6% Notes due September 2017, with<br />
annual principal payments beginning<br />
September 2011.<br />
3.3% Notes due January 2017, with annual<br />
principal payments that began in<br />
January 2011.<br />
Amortizes $1.5 million per quarter<br />
(1)<br />
Each of the credit facilities and arrangements listed in the table are secured by guarantees issued by the Company’s domestic subsidiaries and by pledges of 65% of the outstanding<br />
stock of its material foreign subsidiaries. The <strong>2010</strong> committed loan is also secured by deeds of trust with respect to the Company’s corporate headquarters and distribution<br />
center in Provo, Utah.<br />
(2)<br />
The current portion of the Company’s long-term debt (i.e. becoming due in the next 12 months) includes $13.3 million of the balance of its Japanese yen-denominated debt under<br />
the 2003 multi-currency uncommitted shelf facility, $8.6 million of the balance on its U.S. dollar denominated debt under the 2003 multi-currency uncommitted shelf facility and<br />
$6.0 million of its <strong>2010</strong> committed loan.<br />
62
NU SKIN ENTERPRISES, INC.<br />
Notes to Consolidated Financial Statements<br />
Interest expense relating to debt totaled $7.8 million, $6.9 million and $5.8 million for the years ended December 31, 2008, 2009 and <strong>2010</strong>,<br />
respectively.<br />
The notes and shelf facility contain other terms and conditions and affirmative and negative financial covenants customary for credit facilities<br />
of this type, including a requirement to maintain a minimum cash balance of $65.0 million. As of December 31, <strong>2010</strong>, the Company is<br />
in compliance with all financial covenants under the notes and shelf facility.<br />
Maturities of all long-term debt at December 31, <strong>2010</strong>, based on the year-end exchange rate, are as follows (U.S. dollars in thousands):<br />
Year Ending December 31,<br />
2011 . . . . . . . . . . . . . . . . . . . . . . . . . . . . . . . . . . . . . . . . . . . $ 27,865<br />
2012 . . . . . . . . . . . . . . . . . . . . . . . . . . . . . . . . . . . . . . . . . . . 27,865<br />
2013 . . . . . . . . . . . . . . . . . . . . . . . . . . . . . . . . . . . . . . . . . . . 39,865<br />
2014 . . . . . . . . . . . . . . . . . . . . . . . . . . . . . . . . . . . . . . . . . . . 21,865<br />
2015 . . . . . . . . . . . . . . . . . . . . . . . . . . . . . . . . . . . . . . . . . . . 16,377<br />
Thereafter . . . . . . . . . . . . . . . . . . . . . . . . . . . . . . . . . . . . . 27,041<br />
Total . . . . . . . . . . . . . . . . . . . . . . . . . . . . . . . . . . . . . . . $ 160,878<br />
9. LEASE OBLIGATIONS<br />
The Company leases office space and computer hardware under noncancelable long-term operating leases. Most leases include renewal<br />
options of at least three years. Minimum future operating lease obligations at December 31, <strong>2010</strong> are as follows (U.S. dollars in thousands):<br />
Year Ending December 31,<br />
2011 . . . . . . . . . . . . . . . . . . . . . . . . . . . . . . . . . . . . . . . . . . . $ 15,073<br />
2012 . . . . . . . . . . . . . . . . . . . . . . . . . . . . . . . . . . . . . . . . . . . 13,598<br />
2013 . . . . . . . . . . . . . . . . . . . . . . . . . . . . . . . . . . . . . . . . . . . 12,471<br />
2014 . . . . . . . . . . . . . . . . . . . . . . . . . . . . . . . . . . . . . . . . . . . 10,497<br />
2015 . . . . . . . . . . . . . . . . . . . . . . . . . . . . . . . . . . . . . . . . . . . 10,134<br />
Thereafter . . . . . . . . . . . . . . . . . . . . . . . . . . . . . . . . . . . . . 158<br />
Total . . . . . . . . . . . . . . . . . . . . . . . . . . . . . . . . . . . . . . . $ 61,931<br />
Rental expense for operating leases totaled $33.5 million, $33.8 million and $28.8 million for the years ended December 31, 2008, 2009<br />
and <strong>2010</strong>, respectively.<br />
63
NU SKIN ENTERPRISES, INC.<br />
Notes to Consolidated Financial Statements<br />
10. CAPITAL STOCK<br />
The Company’s authorized capital stock consists of 25 million shares of preferred stock, par value $.001 per share, 500 million shares of<br />
Class A common stock, par value $.001 per share, and 100 million shares of Class B common stock, par value $.001 per share. The shares of<br />
Class A common stock and Class B common stock are identical in all respects, except for voting rights and certain conversion rights and<br />
transfer restrictions, as follows: (1) each share of Class A common stock entitles the holder to one vote on matters submitted to a vote of the<br />
Company’s stockholders and each share of Class B common stock entitles the holder to ten votes on each such matter; (2) stock dividends of<br />
Class A common stock may be paid only to holders of Class A common stock and stock dividends of Class B common stock may be paid<br />
only to holders of Class B common stock; (3) if a holder of Class B common stock transfers such shares to a person other than a permitted<br />
transferee, as defined in the Company’s Certificate of Incorporation, such shares will be converted automatically into shares of Class A common<br />
stock; and (4) Class A common stock has no conversion rights; however, each share of Class B common stock is convertible into one share of<br />
Class A common stock, in whole or in part, at any time at the option of the holder. All outstanding Class B shares have been converted to<br />
Class A shares. As of December 31, <strong>2010</strong> and 2009, there were no preferred or Class B common shares outstanding.<br />
WEIGHTED-AVERAGE COMMON SHARES OUTSTANDING<br />
The following is a reconciliation of the weighted-average common shares outstanding for purposes of computing basic and diluted net<br />
income per share (in thousands):<br />
Year Ended December 31,<br />
2008 2009 <strong>2010</strong><br />
Basic weighted-average common shares outstanding . . . . . . . . . . . . 63,510 63,333 62,370<br />
Effect of dilutive securities:<br />
Stock awards and options . . . . . . . . . . . . . . . . . . . . . . . . . . . . . . . . . . . . . . . 622 963 2,177<br />
Diluted weighted-average common shares outstanding . . . . . . . . . 64,132 64,296 64,547<br />
For the years ended December 31, 2008, 2009 and <strong>2010</strong>, other<br />
stock options totaling 5.0 million, 4.8 million and 0.4 million, respectively,<br />
were excluded from the calculation of diluted earnings per<br />
share because they were anti-dilutive.<br />
REPURCHASES OF COMMON STOCK<br />
The board of directors has approved a stock repurchase program<br />
authorizing the Company to repurchase the Company’s outstanding<br />
shares of Class A common stock on the open market or in private transactions.<br />
The repurchases are used primarily to offset dilution from the<br />
Company’s equity incentive plans and for strategic initiatives. During the<br />
years ended December 31, 2008, 2009 and <strong>2010</strong>, the Company repurchased<br />
approximately 0.4 million, 1.2 million and 2.2 million shares of Class<br />
A common stock for an aggregate price of approximately $6.1 million,<br />
$21.1 million and $58.5 million, respectively. Between August 1998 and<br />
December 31, <strong>2010</strong>, the Company repurchased a total of approximately<br />
21.8 million shares of Class A common stock under this program for<br />
an aggregate price of approximately $332.3 million. In June <strong>2010</strong>, the<br />
Company’s board of directors authorized an increase of $150.0 million<br />
in the amount available under the Company’s ongoing stock repurchase<br />
program. At December 31, <strong>2010</strong>, $153.6 million was available for repurchases<br />
under the stock repurchase program.<br />
11. STOCK–BASED COMPENSATION<br />
At December 31, <strong>2010</strong>, the Company had the following stockbased<br />
employee compensation plans:<br />
EQUITY INCENTIVE PLANS<br />
During the year ended December 31, 1996, the Company’s board<br />
of directors adopted the <strong>Nu</strong> <strong>Skin</strong> Enterprises, Inc., 1996 Stock Incentive<br />
Plan (the “1996 Stock Incentive Plan”). In April 2006, the Company’s<br />
Board of <strong>Direct</strong>ors approved the <strong>Nu</strong> <strong>Skin</strong> Enterprises, Inc. 2006 Stock<br />
Incentive Plan (the “2006 Stock Incentive Plan”). The 2006 Stock Incentive<br />
Plan was approved by the Company’s stockholders at the<br />
Company’s 2006 <strong>Annual</strong> Meeting of Stockholders held in May of<br />
2006. The 1996 Stock Incentive Plan and the 2006 Stock Incentive<br />
Plan provide for granting of stock awards and options to purchase<br />
common stock to executives, other employees, independent consultants<br />
and directors of the Company and its Subsidiaries. Stock options<br />
64
NU SKIN ENTERPRISES, INC.<br />
Notes to Consolidated Financial Statements<br />
granted under these plans are generally non-qualified stock options,<br />
but the plans permit some stock options granted to qualify as “incentive<br />
stock options” under the U.S. Internal Revenue Code. The exercise<br />
price of a stock option generally is equal to the fair market value of the<br />
Company’s common stock on the stock option grant date. The contractual<br />
term of stock options granted since 1996 is generally ten years.<br />
However, for stock options granted beginning in the second quarter<br />
of 2006, the contractual term has been shortened to seven years. Currently,<br />
all shares issued upon the exercise of stock options are from the<br />
Company’s treasury shares. With the adoption of the <strong>2010</strong> Omnibus<br />
Incentive Plan discussed below, no further grants will be made under<br />
the 1996 Stock Incentive Plan or the 2006 Stock Incentive Plan.<br />
In April <strong>2010</strong>, the Company’s Board of <strong>Direct</strong>ors approved the<br />
<strong>Nu</strong> <strong>Skin</strong> Enterprises, Inc. <strong>2010</strong> Omnibus Incentive Plan (the “<strong>2010</strong><br />
Omnibus Incentive Plan”). This plan was approved by the Company’s<br />
stockholders at the Company’s <strong>2010</strong> <strong>Annual</strong> Meeting of Stockholders<br />
held in May of <strong>2010</strong>. The <strong>2010</strong> Omnibus Incentive Plan provides for<br />
granting of a variety of equity based awards including stock options,<br />
stock appreciation rights, restricted stock, restricted stock units, other<br />
share based awards, performance cash, performance shares and performance<br />
units to executives, other employees, independent consultants<br />
and directors of the Company and its subsidiaries. Options<br />
granted under the <strong>2010</strong> Omnibus Incentive Plan are generally nonqualified<br />
stock options, but the <strong>2010</strong> Omnibus Incentive Plan permits<br />
some stock options granted to qualify as “incentive stock options”<br />
under the U.S. Internal Revenue Code. The exercise price of a stock<br />
option generally is equal to the fair market value of the Company’s<br />
common stock on the stock option grant date. The contractual term<br />
of a stock option granted under the <strong>2010</strong> Omnibus Incentive Plan is<br />
seven years. Currently, all shares issued upon the exercise of stock<br />
options are from the Company’s treasury shares. Seven million shares,<br />
subject to certain adjustments, were uthorized for issuance under the<br />
<strong>2010</strong> Omnibus Incentive Plan.<br />
The Company has traditionally granted time-vested options.<br />
However, the Company has made several performance based grants<br />
over the last four years. The following is a summary of the terms of<br />
the two most significant grants of performance awards. The compensation<br />
committee of the board of directors approved the grant of<br />
performance stock options to certain senior level executives in the<br />
fourth quarter of 2007 under the 2006 Stock Incentive Plan. Vesting<br />
for the options is performance based, with the options vesting in two<br />
installments if the Company’s earnings per share equal or exceed the<br />
two established performance levels, measured in terms of diluted earnings<br />
per share. Fifty percent of the options vest upon earnings per<br />
share meeting or exceeding the first performance level and fifty percent<br />
of the options vest upon earnings per share meeting or exceeding the<br />
second performance level. As of December 31, <strong>2010</strong>, both of the performance<br />
levels were met for these performance stock options, which<br />
resulted in cumulative compensation expense of $8.3 million.<br />
In November <strong>2010</strong>, the compensation committee of the board<br />
of directors approved the grant of performance stock options to certain<br />
key employees under the <strong>2010</strong> Omnibus Incentive Plan. Vesting<br />
for the options is performance based, with the options vesting in three<br />
installments if the Company’s earnings per share equal or exceed the<br />
three established performance levels, measured in terms of diluted<br />
earnings per share. One third of the options will vest upon earnings<br />
per share meeting or exceeding the first performance level, one third<br />
of the options will vest upon earnings per share meeting or exceeding<br />
the second performance level and one third of the options will vest<br />
upon earnings per share meeting or exceeding the third performance<br />
level. All unvested options will terminate upon the Company’s failure<br />
to meet certain performance thresholds for each of years 2013 through<br />
2015. In addition, all unvested options will terminate on March 30, 2016.<br />
The Company records an expense each period for the estimated amount<br />
of expense associated with the Company’s projected achievement of<br />
the performance based targets.<br />
The Company has also issued other performance based awards<br />
to a limited number of participants that similarly vest, or become eligible<br />
for vesting, upon achievement of various performance targets.<br />
65
NU SKIN ENTERPRISES, INC.<br />
Notes to Consolidated Financial Statements<br />
The fair value of stock option awards was estimated using the Black-Scholes option-pricing model with the following assumptions and<br />
weighted-average fair values as follows:<br />
Year Ended December 31,<br />
Stock Options: 2008 2009 <strong>2010</strong><br />
Weighted average grant date fair value of grants . . . . . . . . . . . . . . . . . $ 4.69 $ 2.84 $ 8.61<br />
Risk-free interest rate (1) . . . . . . . . . . . . . . . . . . . . . . . . . . . . . . . . . . . . . . . . . . . . . 3.0% 2.3% 1.8%<br />
Dividend yield (2) . . . . . . . . . . . . . . . . . . . . . . . . . . . . . . . . . . . . . . . . . . . . . . . . . . . . 2.6% 3.2% 2.6%<br />
Expected volatility (3) . . . . . . . . . . . . . . . . . . . . . . . . . . . . . . . . . . . . . . . . . . . . . . . . 36.1% 40.7% 37.8%<br />
Expected life in months (4) . . . . . . . . . . . . . . . . . . . . . . . . . . . . . . . . . . . . . . . . . . 58 months 69 months 69 months<br />
(1)<br />
The risk-free interest rate is based upon the rate on a zero coupon U.S. Treasury bill, for periods within the contractual life of the option, in effect at the time of the grant.<br />
(2)<br />
The dividend yield is based on the average of historical stock prices and actual dividends paid.<br />
(3)<br />
Expected volatility is based on the historical volatility of our stock price, over a period similar to the expected life of the option.<br />
(4)<br />
The expected term of the option is based on the historical employee exercise behavior, the vesting terms of the respective option, and a contractual life of either seven or ten years.<br />
66
NU SKIN ENTERPRISES, INC.<br />
Notes to Consolidated Financial Statements<br />
Options under the plans as of December 31, <strong>2010</strong> and changes during the year ended December 31, <strong>2010</strong> were as follows:<br />
Shares<br />
(in thousands)<br />
Weightedaverage<br />
Exercise Price<br />
Weightedaverage<br />
Remaining<br />
Contractual<br />
Term<br />
(in years)<br />
Aggregate<br />
Intrinsic Value<br />
(in thousands)<br />
Options activity — service based<br />
Outstanding at December 31, 2009 . . . . . . . . . . . . . . . . . . . . . 5,792.0 $ 14.82<br />
Granted . . . . . . . . . . . . . . . . . . . . . . . . . . . . . . . . . . . . . . . . . . . . . . . . . 209.5 26.14<br />
Exercised . . . . . . . . . . . . . . . . . . . . . . . . . . . . . . . . . . . . . . . . . . . . . . . . (1,298.8) 13.24<br />
Forfeited/cancelled/expired . . . . . . . . . . . . . . . . . . . . . . . . . . . . . (218.8) 14.53<br />
Outstanding at December 31, <strong>2010</strong> . . . . . . . . . . . . . . . . . . . . . 4,483.9 15.82 4.31 $ 64,734<br />
Exercisable at December 31, <strong>2010</strong> . . . . . . . . . . . . . . . . . . . . . . . 2,747.6 17.63 3.76 34,707<br />
Options activity — performance based<br />
Outstanding at December 31, 2009 . . . . . . . . . . . . . . . . . . . . . 1,742.5 $ 17.03<br />
Granted . . . . . . . . . . . . . . . . . . . . . . . . . . . . . . . . . . . . . . . . . . . . . . . . . 2,121.5 30.31<br />
Exercised . . . . . . . . . . . . . . . . . . . . . . . . . . . . . . . . . . . . . . . . . . . . . . . . (242.5) 16.65<br />
Forfeited/cancelled/expired . . . . . . . . . . . . . . . . . . . . . . . . . . . . . (35.0) 18.03<br />
Outstanding at December 31, <strong>2010</strong> . . . . . . . . . . . . . . . . . . . . . 3,586.5 24.90 5.71 $ 19,563<br />
Exercisable at December 31, <strong>2010</strong> . . . . . . . . . . . . . . . . . . . . . . . 665.0 17.07 4.07 8,773<br />
Options activity — all options<br />
Outstanding at December 31, 2009 . . . . . . . . . . . . . . . . . . . . . 7,534.5 $ 15.33<br />
Granted . . . . . . . . . . . . . . . . . . . . . . . . . . . . . . . . . . . . . . . . . . . . . . . . . 2,331.0 29.93<br />
Exercised . . . . . . . . . . . . . . . . . . . . . . . . . . . . . . . . . . . . . . . . . . . . . . . . (1,541.3) 13.77<br />
Forfeited/cancelled/expired . . . . . . . . . . . . . . . . . . . . . . . . . . . . . (253.8) 15.02<br />
Outstanding at December 31, <strong>2010</strong> . . . . . . . . . . . . . . . . . . . . . 8,070.4 19.86 4.93 $ 84,298<br />
Exercisable at December 31, <strong>2010</strong> . . . . . . . . . . . . . . . . . . . . . . . 3,412.6 17.52 3.83 43,480<br />
The aggregate intrinsic value in the table above represents the total pretax intrinsic value (the difference between the Company’s closing<br />
stock price on the last trading day of the respective years and the exercise price, multiplied by the number of in-the-money options) that would<br />
have been received by the option holders had all option holders exercised their options on December 31, <strong>2010</strong>. This amount varies based on<br />
the fair market value of the Company’s stock. The total fair value of options vested and expensed was $4.8 million, net of tax, for the year<br />
ended December 31, <strong>2010</strong>.<br />
67
NU SKIN ENTERPRISES, INC.<br />
Notes to Consolidated Financial Statements<br />
Cash proceeds, tax benefits, and intrinsic value related to total stock options exercised during 2008, 2009 and <strong>2010</strong>, were as follows (in<br />
millions):<br />
December 31,<br />
2008 2009 <strong>2010</strong><br />
Cash proceeds from stock options exercised . . . . . . . . . . . . . . . . . . . . . $ 3.8 $ 6.2 $ 21.2<br />
Tax benefit realized for stock options exercised . . . . . . . . . . . . . . . . . . . 1.2 2.9 10.3<br />
Intrinsic value of stock options exercised . . . . . . . . . . . . . . . . . . . . . . . . . . 0.2 8.2 25.4<br />
Nonvested restricted stock awards as of December 31, <strong>2010</strong> and changes during the year ended December 31, <strong>2010</strong> were as follows:<br />
<strong>Nu</strong>mber of Shares<br />
(in thousands)<br />
Weighted-average<br />
Grant Date<br />
Fair Value<br />
Nonvested at December 31, 2009 . . . . . . . . . . . . . . . . . . . . . . . . . . . . . . . . . . . . . . . . . . . . . . . . . . . . . . . . . . . 340.3 $ 17.12<br />
Granted . . . . . . . . . . . . . . . . . . . . . . . . . . . . . . . . . . . . . . . . . . . . . . . . . . . . . . . . . . . . . . . . . . . . . . . . . . . . . . . . . . . . . . 338.9 25.98<br />
Vested . . . . . . . . . . . . . . . . . . . . . . . . . . . . . . . . . . . . . . . . . . . . . . . . . . . . . . . . . . . . . . . . . . . . . . . . . . . . . . . . . . . . . . . . (140.0) 16.65<br />
Forfeited . . . . . . . . . . . . . . . . . . . . . . . . . . . . . . . . . . . . . . . . . . . . . . . . . . . . . . . . . . . . . . . . . . . . . . . . . . . . . . . . . . . . . (8.9) 18.82<br />
Nonvested at December 31, <strong>2010</strong> . . . . . . . . . . . . . . . . . . . . . . . . . . . . . . . . . . . . . . . . . . . . . . . . . . . . . . . . . . . 530.3 22.88<br />
As of December 31, <strong>2010</strong>, there was $8.9 million of unrecognized stock-based compensation expense related to nonvested restricted<br />
stock awards. That cost is expected to be recognized over a weighted-average period of 2.5 years. As of December 31, <strong>2010</strong>, there was $22.4<br />
million of unrecognized stock-based compensation expense related to nonvested stock option awards. That cost is expected to be recognized<br />
over a weighted-average period of 3.9 years.<br />
12. INCOME TAXES<br />
Consolidated income before provision for income taxes consists of the following for the years ended December 31, 2008, 2009 and <strong>2010</strong><br />
(U.S. dollars in thousands):<br />
2008 2009 <strong>2010</strong><br />
U.S. . . . . . . . . . . . . . . . . . . . . . . . . . . . . . . . . . . . . . . . . . . . . . . . . . . . . . . . . . . . . . . . . $ 52,756 $ 71,338 $ 141,069<br />
Foreign . . . . . . . . . . . . . . . . . . . . . . . . . . . . . . . . . . . . . . . . . . . . . . . . . . . . . . . . . . . . 47,897 69,786 66,544<br />
Total . . . . . . . . . . . . . . . . . . . . . . . . . . . . . . . . . . . . . . . . . . . . . . . . . . . . . . . . . . . . $ 100,653 $ 141,124 $ 207,613<br />
68
NU SKIN ENTERPRISES, INC.<br />
Notes to Consolidated Financial Statements<br />
The provision for current and deferred taxes for the years ended December 31, 2008, 2009 and <strong>2010</strong> consists of the following (U.S. dollars<br />
in thousands):<br />
2008 2009 <strong>2010</strong><br />
Current . . . . . . . . . . . . . . . . . . . . . . . . . . . . . . . . . . . . . . . . . . . . . . . . . . . . . . . . . . . .<br />
Federal . . . . . . . . . . . . . . . . . . . . . . . . . . . . . . . . . . . . . . . . . . . . . . . . . . . . . . . . . $ 10,524 $ 9,409 $ 45,761<br />
State . . . . . . . . . . . . . . . . . . . . . . . . . . . . . . . . . . . . . . . . . . . . . . . . . . . . . . . . . . . 2,620 1,690 3,825<br />
Foreign . . . . . . . . . . . . . . . . . . . . . . . . . . . . . . . . . . . . . . . . . . . . . . . . . . . . . . . . . 22,408 27,784 27,450<br />
35,552 38,883 77,036<br />
Deferred . . . . . . . . . . . . . . . . . . . . . . . . . . . . . . . . . . . . . . . . . . . . . . . . . . . . . . . . . . .<br />
Federal . . . . . . . . . . . . . . . . . . . . . . . . . . . . . . . . . . . . . . . . . . . . . . . . . . . . . . . . . 713 14,266 (2,558)<br />
State . . . . . . . . . . . . . . . . . . . . . . . . . . . . . . . . . . . . . . . . . . . . . . . . . . . . . . . . . . . (345) 937 212<br />
Foreign . . . . . . . . . . . . . . . . . . . . . . . . . . . . . . . . . . . . . . . . . . . . . . . . . . . . . . . . . (614) (2,807) (3,128)<br />
(246) 12,396 (5,474)<br />
Provision for income taxes . . . . . . . . . . . . . . . . . . . . . . . . . . . . . . . . . . . . . . . . $ 35,306 $ 51,279 $ 71,562<br />
The Company’s foreign taxes paid are high relative to foreign operating income and the Company’s U.S. taxes paid are low relative to<br />
U.S. operating income due largely to the flow of funds among the Company’s Subsidiaries around the world. As payments for services, management<br />
fees, license arrangements and royalties are made from the Company’s foreign affiliates to its U.S. corporate headquarters, these<br />
payments often incur withholding and other forms of tax that are generally creditable for U.S. tax purposes. Therefore, these payments lead<br />
to increased foreign effective tax rates and lower U.S. effective tax rates. Variations (or shifts) occur in the Company’s foreign and U.S. effective<br />
tax rates from year to year depending on several factors. These factors include the impact of global transfer prices, the timing and level of<br />
remittances from foreign affiliates, profits and losses in various markets, in the valuation of deferred tax assets or liabilities, or changes in tax<br />
laws, regulations, accounting principles, or interpretations thereof.<br />
69
NU SKIN ENTERPRISES, INC.<br />
Notes to Consolidated Financial Statements<br />
The principal components of deferred taxes are as follows (U.S. dollars in thousands):<br />
Year Ended December 31,<br />
2009 <strong>2010</strong><br />
Deferred tax assets:<br />
Inventory differences . . . . . . . . . . . . . . . . . . . . . . . . . . . . . . . . . . . . . . . . . . . . . . . . . . . . . . . . . $ 3,777 $ 5,572<br />
Foreign tax credit and other foreign benefits . . . . . . . . . . . . . . . . . . . . . . . . . . . . . . . . 34,717 25,408<br />
Stock-based compensation . . . . . . . . . . . . . . . . . . . . . . . . . . . . . . . . . . . . . . . . . . . . . . . . . . 8,251 9,632<br />
Accrued expenses not deductible until paid . . . . . . . . . . . . . . . . . . . . . . . . . . . . . . . . . 25,211 28,325<br />
Foreign currency exchange . . . . . . . . . . . . . . . . . . . . . . . . . . . . . . . . . . . . . . . . . . . . . . . . . . 8,934 17,727<br />
Net operating losses . . . . . . . . . . . . . . . . . . . . . . . . . . . . . . . . . . . . . . . . . . . . . . . . . . . . . . . . . 14,430 12,481<br />
Capitalized research and development . . . . . . . . . . . . . . . . . . . . . . . . . . . . . . . . . . . . . . 19,175 18,295<br />
Asian marketing rights . . . . . . . . . . . . . . . . . . . . . . . . . . . . . . . . . . . . . . . . . . . . . . . . . . . . . . . 1,095 483<br />
Other . . . . . . . . . . . . . . . . . . . . . . . . . . . . . . . . . . . . . . . . . . . . . . . . . . . . . . . . . . . . . . . . . . . . . . . . 5,839 7,023<br />
Gross deferred tax assets . . . . . . . . . . . . . . . . . . . . . . . . . . . . . . . . . . . . . . . . . . . . . . . . . 121,429 124,946<br />
Deferred tax liabilities:<br />
Exchange gains and losses . . . . . . . . . . . . . . . . . . . . . . . . . . . . . . . . . . . . . . . . . . . . . . . . . . . 3,299 4,763<br />
Pharmanex intangibles step-up . . . . . . . . . . . . . . . . . . . . . . . . . . . . . . . . . . . . . . . . . . . . . . 13,514 12,923<br />
Amortization of intangibles . . . . . . . . . . . . . . . . . . . . . . . . . . . . . . . . . . . . . . . . . . . . . . . . . . 8,768 10,193<br />
Foreign outside basis in controlled foreign corporation . . . . . . . . . . . . . . . . . . . . . . 10,137 10,683<br />
Prepaid expenses . . . . . . . . . . . . . . . . . . . . . . . . . . . . . . . . . . . . . . . . . . . . . . . . . . . . . . . . . . . . 11,239 11,239<br />
Other . . . . . . . . . . . . . . . . . . . . . . . . . . . . . . . . . . . . . . . . . . . . . . . . . . . . . . . . . . . . . . . . . . . . . . . . 2,025 3,921<br />
Gross deferred tax liabilities . . . . . . . . . . . . . . . . . . . . . . . . . . . . . . . . . . . . . . . . . . . . . . 48,982 53,722<br />
Valuation allowance . . . . . . . . . . . . . . . . . . . . . . . . . . . . . . . . . . . . . . . . . . . . . . . . . . . . . . . . . . . . . (11,150) (11,351)<br />
Deferred taxes, net . . . . . . . . . . . . . . . . . . . . . . . . . . . . . . . . . . . . . . . . . . . . . . . . . . . . . . . . . . . . . . $ 61,297 $ 59,873<br />
At December 31, <strong>2010</strong>, the Company had foreign operating loss carryforwards of approximately $54.7 million for tax purposes, which will<br />
be available to offset future taxable income. If not used, $20.7 million of carryforwards will expire between 2011 and 2020, while $34.0 million<br />
do not expire.<br />
The valuation allowance primarily represents amounts for foreign operating loss carryforwards for which it is more likely than not<br />
some portion or all of the deferred tax asset will not be realized. In making such determination, the Company considers all available positive<br />
and negative evidence, including future reversals of existing taxable temporary difference, projected future taxable income, tax planning strategies<br />
and recent financial operations. When the Company determines that there is sufficient taxable income to utilize the net operating<br />
losses, the valuation will be released which would reduce the provision for income taxes.<br />
70
NU SKIN ENTERPRISES, INC.<br />
Notes to Consolidated Financial Statements<br />
The components of deferred taxes, net on a jurisdiction basis are as follows (U.S. dollars in thousands):<br />
Year Ended December 31,<br />
2009 <strong>2010</strong><br />
Net current deferred tax assets . . . . . . . . . . . . . . . . . . . . . . . . . . . . . . . . . . . . . . . . . . . . . . . . . $ 23,541 $ 26,094<br />
Net noncurrent deferred tax assets . . . . . . . . . . . . . . . . . . . . . . . . . . . . . . . . . . . . . . . . . . . . 49,030 45,027<br />
Total net deferred tax assets . . . . . . . . . . . . . . . . . . . . . . . . . . . . . . . . . . . . . . . . . . . . . . . . 72,571 71,121<br />
Net current deferred tax liabilities . . . . . . . . . . . . . . . . . . . . . . . . . . . . . . . . . . . . . . . . . . . . . . — 8<br />
Net noncurrent deferred tax liabilities . . . . . . . . . . . . . . . . . . . . . . . . . . . . . . . . . . . . . . . . . . 11,274 11,240<br />
Total net deferred tax liabilities . . . . . . . . . . . . . . . . . . . . . . . . . . . . . . . . . . . . . . . . . . . . . . 11,274 11,248<br />
Deferred taxes, net . . . . . . . . . . . . . . . . . . . . . . . . . . . . . . . . . . . . . . . . . . . . . . . . . . . . . . . . . . . . . $ 61,297 $ 59,873<br />
The Company is subject to regular audits by federal, state and foreign tax authorities. These audits may result in proposed assessments<br />
that may result in additional tax liabilities.<br />
The actual tax rate for the years ended December 31, 2008, 2009 and <strong>2010</strong> compared to the statutory U.S. Federal tax rate is as follows:<br />
Year Ended December 31,<br />
2008 2009 <strong>2010</strong><br />
Income taxes at statutory rate . . . . . . . . . . . . . . . . . . . . . . . . . . . . 35.00% 35.00% 35.00%<br />
Non-deductible expenses . . . . . . . . . . . . . . . . . . . . . . . . . . . . . . . . .23 .24 .10<br />
Other . . . . . . . . . . . . . . . . . . . . . . . . . . . . . . . . . . . . . . . . . . . . . . . . . . . . . (.15) 1.10 (.63)<br />
35.08% 36.34% 34.47%<br />
The increase in the effective tax rate in 2009 compared to 2008 was due to a reduced benefit relating to the expiration of the statute of<br />
limitations. The decrease in the effective tax rate in <strong>2010</strong> compared to 2009 was due primarily to the increased benefit relating to the expiration<br />
of the statute of limitations in certain tax jurisdictions.<br />
13. EMPLOYEE BENEFIT PLAN<br />
The Company has a 401(k) defined contribution plan which permits participating employees to defer up to a maximum of 100% of their<br />
compensation, subject to limitations established by the Internal Revenue Service. Employees age 18 and older are eligible to contribute to the<br />
plan starting the first day of employment. After completing at least one day of service, employees are eligible to receive the Company’s<br />
matching funds. In 2008, 2009, and <strong>2010</strong> the Company matched employees’ base pay up to 3%, 3.5% and 4%, respectively. In 2008, the Company’s<br />
contributions vested evenly over four years. In 2009 and <strong>2010</strong> the Company’s contributions cliff vest at two years. The Company recorded<br />
compensation expense of $1.3 million, $1.7 million and $2.1 million for the years ended December 31, 2008, 2009 and <strong>2010</strong>, respectively,<br />
related to its contributions to the plan.<br />
The Company has a defined benefit pension plan for its employees in Japan. All employees of <strong>Nu</strong> <strong>Skin</strong> Japan, after certain years of<br />
service, are entitled to pension plan benefits when they terminate employment with <strong>Nu</strong> <strong>Skin</strong> Japan. The accrued pension liability was $6.9<br />
million, $5.9 million and $7.4 million as of December 31, 2008, 2009 and <strong>2010</strong>, respectively. Although <strong>Nu</strong> <strong>Skin</strong> Japan has not specifically<br />
funded this obligation, as it is not required to do so, <strong>Nu</strong> <strong>Skin</strong> Japan believes it maintains adequate cash balances for this defined benefit pen-<br />
71
NU SKIN ENTERPRISES, INC.<br />
Notes to Consolidated Financial Statements<br />
sion plan. The Company recorded pension expense of $0.9 million, $0.6 million and $1.1 million for the years ended December 31, 2008, 2009<br />
and <strong>2010</strong>, respectively.<br />
14. EXECUTIVE DEFERRED COMPENSATION PLAN<br />
The Company has an executive deferred compensation plan for select management personnel. Under this plan, the Company may<br />
make a contribution of up to 10% of a participant’s salary. In addition, each participant has the option to defer a portion of their compensation<br />
up to a maximum of 80% of their compensation. Participant contributions are immediately vested. Company contributions vest on the earlier<br />
of: (a) attaining 60 years of age; (b) 50% after ten years of service and 5% each year of service thereafter; and (c) death or disability. The Company<br />
recorded compensation expense of $0.8 million, $1.1 million and $3.4 million for the years ended December 31, 2008, 2009 and <strong>2010</strong>,<br />
respectively, related to its contributions to the plan. The Company had accrued $10.0 million and $15 million as of December 31, 2009 and<br />
<strong>2010</strong>, respectively, related to the Executive Deferred Compensation Plan.<br />
15. DERIVATIVE FINANCIAL INSTRUMENTS<br />
At December 31, 2009, the Company held forward contracts designated as foreign currency cash flow hedges with notional amounts<br />
totaling approximately $3.0 million to hedge forecasted foreign-currency-denominated intercompany transactions and $0.1 million net unrealized<br />
gain, net of related taxes, was recorded in accumulated other comprehensive loss. At December 31, <strong>2010</strong>, the Company held $22.2 million<br />
in forward contracts designated as foreign currency cash flow hedges to hedge forecasted foreign-currency-denominated intercompany<br />
transactions.<br />
The contracts held at December 31, <strong>2010</strong>, have maturities through June 2011, and accordingly, all unrealized gains and losses on foreign<br />
currency cash flow hedges included in accumulated other comprehensive loss will be recognized in current earnings over the next 5 months.<br />
There were no pre-tax net (losses)/gains on foreign currency cash flow hedges recorded in current earnings for the years ended December 31,<br />
2008 and 2009. There were $0.1 million of pre-tax net gains on foreign currency cash flow hedges recorded in current earnings for year ended<br />
December 31, <strong>2010</strong>.<br />
16. SUPPLEMENTAL CASH FLOW INFORMATION<br />
Cash paid for interest totaled $7.9 million, $7.0 million and $6.2 million for the years ended December 31, 2008, 2009 and <strong>2010</strong>, respectively. Cash<br />
paid for income taxes totaled $27.2 million, $36.8 million and $61.2 million for the years ended December 31, 2008, 2009 and <strong>2010</strong>, respectively. There<br />
was a non-cash item for the year ended December 31, <strong>2010</strong>, as described in Note 3 to the consolidated financial statements pertaining to the related<br />
party purchase of corporate office and warehouse space.<br />
17. SEGMENT INFORMATION<br />
The Company operates in a single operating segment by selling products to a global network of independent distributors that operates<br />
in a seamless manner from market to market, except for its operations in Mainland China. In Mainland China, the Company utilizes an employed<br />
sales force, contractual sales promoters and direct sellers to sell its products through fixed retail locations. <strong>Selling</strong> expenses are the Company’s<br />
largest expense comprised of the commissions paid to its worldwide independent distributors as well as remuneration to its Mainland China<br />
sales employees, promoters and direct sellers paid on product sales. The Company manages its business primarily by managing its global sales<br />
force. The Company does not use profitability reports on a regional or divisional basis for making business decisions. However, the Company<br />
does recognize revenue in five geographic regions: North Asia, Greater China, Americas, South Asia/Pacific and Europe.<br />
72
NU SKIN ENTERPRISES, INC.<br />
Notes to Consolidated Financial Statements<br />
Revenue generated in each of these regions is set forth below (U.S. dollars in thousands):<br />
Year Ended December 31,<br />
Revenue: 2008 2009 <strong>2010</strong><br />
North Asia . . . . . . . . . . . . . . . . . . . . . . . . . . . . . . . . . . . . . . . . . . . . . . . . . $ 594,548 $ 606,113 $ 686,073<br />
Greater China . . . . . . . . . . . . . . . . . . . . . . . . . . . . . . . . . . . . . . . . . . . . . 209,968 210,379 268,171<br />
Americas . . . . . . . . . . . . . . . . . . . . . . . . . . . . . . . . . . . . . . . . . . . . . . . . . . 223,902 260,865 250,008<br />
South Asia/Pacific . . . . . . . . . . . . . . . . . . . . . . . . . . . . . . . . . . . . . . . . . 107,656 120,123 182,796<br />
Europe . . . . . . . . . . . . . . . . . . . . . . . . . . . . . . . . . . . . . . . . . . . . . . . . . . . . . 111,572 133,578 150,211<br />
Total . . . . . . . . . . . . . . . . . . . . . . . . . . . . . . . . . . . . . . . . . . . . . . . . . . . . $ 1,247,646 $ 1,331,058 $ 1,537,259<br />
Revenue generated by each of the Company’s product lines is set forth below (U.S. dollars in thousands):<br />
Year Ended December 31,<br />
Revenue: 2008 2009 <strong>2010</strong><br />
<strong>Nu</strong> <strong>Skin</strong> . . . . . . . . . . . . . . . . . . . . . . . . . . . . . . . . . . . . . . . . . . . . . . . . . . . . $ 633,411 $ 752,681 $ 913,819<br />
Pharmanex . . . . . . . . . . . . . . . . . . . . . . . . . . . . . . . . . . . . . . . . . . . . . . . . 597,714 565,592 612,209<br />
Other . . . . . . . . . . . . . . . . . . . . . . . . . . . . . . . . . . . . . . . . . . . . . . . . . . . . . . 16,521 12,785 11,231<br />
Total . . . . . . . . . . . . . . . . . . . . . . . . . . . . . . . . . . . . . . . . . . . . . . . . . . . . $ 1,247,646 $ 1,331,058 $ 1,537,259<br />
Additional information as to the Company’s operations in the most significant geographical areas is set forth below<br />
(U.S. dollars in thousands):<br />
Year Ended December 31,<br />
Revenue: 2008 2009 <strong>2010</strong><br />
Japan . . . . . . . . . . . . . . . . . . . . . . . . . . . . . . . . . . . . . . . . . . . . . . . . . . . . . . $ 443,714 $ 461,914 $ 471,425<br />
South Korea . . . . . . . . . . . . . . . . . . . . . . . . . . . . . . . . . . . . . . . . . . . . . . . 150,834 144,199 214,648<br />
United States . . . . . . . . . . . . . . . . . . . . . . . . . . . . . . . . . . . . . . . . . . . . . . 192,140 218,557 212,070<br />
Europe . . . . . . . . . . . . . . . . . . . . . . . . . . . . . . . . . . . . . . . . . . . . . . . . . . . . . 96,573 111,862 124,497<br />
Taiwan . . . . . . . . . . . . . . . . . . . . . . . . . . . . . . . . . . . . . . . . . . . . . . . . . . . . . 92,297 91,727 107,133<br />
Mainland China . . . . . . . . . . . . . . . . . . . . . . . . . . . . . . . . . . . . . . . . . . . 65,329 71,086 91,352<br />
Year Ended December 31,<br />
Long-lived assests: 2009 <strong>2010</strong><br />
Japan . . . . . . . . . . . . . . . . . . . . . . . . . . . . . . . . . . . . . . . . . . . . . . . . . . . . . . $ 8,079 $ 12,473<br />
South Korea . . . . . . . . . . . . . . . . . . . . . . . . . . . . . . . . . . . . . . . . . . . . . . . 3,654 9,396<br />
United States . . . . . . . . . . . . . . . . . . . . . . . . . . . . . . . . . . . . . . . . . . . . . . 42,378 84,829<br />
Europe . . . . . . . . . . . . . . . . . . . . . . . . . . . . . . . . . . . . . . . . . . . . . . . . . . . . . 3,005 2,697<br />
Taiwan . . . . . . . . . . . . . . . . . . . . . . . . . . . . . . . . . . . . . . . . . . . . . . . . . . . . . 1,758 2,200<br />
Mainland China . . . . . . . . . . . . . . . . . . . . . . . . . . . . . . . . . . . . . . . . . . . 11,841 11,646<br />
73
NU SKIN ENTERPRISES, INC.<br />
Notes to Consolidated Financial Statements<br />
18. RESTRUCTURING CHARGES<br />
During 2009, the Company recorded restructuring charges of<br />
$10.7 million, related to restructuring of its Japan operations, including<br />
an approximate 30% headcount reduction as well as facility relocations<br />
and closures. $7.4 million related to severance payments to terminated<br />
employees and $3.3 million of these charges related to facility relocation<br />
or closing costs. The majority of these severance charges are related<br />
to a voluntary employment reduction program. The restructuring<br />
charges for facility relocation or closing costs related to costs<br />
incurred during 2009 for leases terminated in that period.<br />
19. COMMITMENTS AND CONTINGENCIES<br />
The Company is subject to governmental regulations pertaining<br />
to product formulation, labeling and packaging, product claims and<br />
advertising and to the Company’s direct selling system. The Company<br />
is also subject to the jurisdiction of numerous foreign tax and customs<br />
authorities. Any assertions or determination that either the Company<br />
or the Company’s distributors is not in compliance with existing statutes,<br />
laws, rules or regulations could potentially have a material adverse<br />
effect on the Company’s operations. In addition, in any country or jurisdiction,<br />
the adoption of new statutes, laws, rules or regulations or<br />
changes in the interpretation of existing statutes, laws, rules or regulations<br />
could have a material adverse effect on the Company and its<br />
operations. Although management believes that the Company is in<br />
compliance, in all material respects, with the statutes, laws, rules and<br />
regulations of every jurisdiction in which it operates, no assurance can<br />
be given that the Company’s compliance with applicable statutes, laws,<br />
rules and regulations will not be challenged by foreign authorities or<br />
that such challenges will not have a material adverse effect on the<br />
Company’s financial position or results of operations or cash flows. The<br />
Company and its Subsidiaries are defendants in litigation and proceedings<br />
involving various matters. Except as noted below, in the opinion of<br />
the Company’s management, based upon advice of its counsel handling<br />
such litigation and proceedings, adverse outcomes, if any, will not<br />
likely result in a material effect on the Company’s consolidated financial<br />
condition, results of operations or cash flows.<br />
The Company is subject to regular audits by federal, state and<br />
foreign tax authorities. These audits may result in additional tax liabilities.<br />
The Company believes it has appropriately provided for income<br />
taxes for all years. Several factors drive the calculation of its tax reserves.<br />
Some of these factors include: (i) the expiration of various<br />
statutes of limitations; (ii) changes in tax law and regulations; (iii) issuance<br />
of tax rulings; and (iv) settlements with tax authorities. Changes<br />
in any of these factors may result in adjustments to the Company’s<br />
reserves, which would impact its reported financial results.<br />
Due to the international nature of the Company’s business, the<br />
Company is subject from time to time to reviews and audits by the<br />
foreign taxing authorities of the various jurisdictions in which the<br />
Company conducts business throughout the world. The Company is<br />
currently involved in two separate disputes with the customs authorities<br />
in Japan with respect to duty assessments on several of the<br />
Company’s Pharmanex nutritional products totaling approximately<br />
5.3 billion Japanese yen as of December 31, <strong>2010</strong> (approximately<br />
$65.3 million), net of any recovery of consumption taxes. The Company<br />
was also recently notified that it is likely to receive an additional<br />
assessment of 0.6 billion Japanese yen (approximately $7.7 million)<br />
related to the second dispute.<br />
The first dispute relates to additional customs assessments<br />
made by Yokohama Customs for the period of October 2002<br />
through July 2005. The aggregate amount of these additional assessments<br />
is 2.7 billion Japanese yen (approximately $33.2 million as<br />
of December 31, <strong>2010</strong>), net of any recovery of consumption taxes.<br />
The dispute relates to whether the Company used the proper valuation<br />
method for these products in determining the applicable customs<br />
duties. The primary legal issue in the case is whether the relevant<br />
import transaction is a sale between the Company’s third party<br />
manufacturers and the Company’s Japan subsidiary, or a sale between<br />
the Company’s US subsidiary and the Company’s Japan subsidiary.<br />
In 1999, the Company worked with the Yokohama Customs<br />
authorities to restructure the form of the relevant transactions in order<br />
to have the import transaction be a sale between the Company’s<br />
third party manufacturers and the Company’s Japan subsidiary, and<br />
thus have the duties assessed on the price paid to the Company’s<br />
third party manufacturers. With the input and guidance of the Yokohama<br />
Customs authorities, the Company restructured the form of<br />
the transaction and the agreements between the relevant parties<br />
based on these discussions so that the Company’s US subsidiary<br />
would be acting on behalf of the Company’s Japan subsidiary with<br />
respect to the purchase of these products rather than as a buyer/<br />
seller. The Company’s Japan subsidiary entered into a Memorandum<br />
of Understanding with each of the Company’s third party manufacturers<br />
of the relevant products, which provided that the Company’s<br />
Japan subsidiary was the purchaser of the products and that<br />
the Company’s US subsidiary was acting for and on behalf of the<br />
Company’s Japan subsidiary with respect to these products. The<br />
Company’s Japan subsidiary also entered into a Memorandum of<br />
74
NU SKIN ENTERPRISES, INC.<br />
Notes to Consolidated Financial Statements<br />
Understanding with the Company’s US subsidiary documenting the<br />
same agency relationship. The Company believes that these legal<br />
documents establish that the Company’s US subsidiary was acting<br />
as an agent and not buyer and seller of the relevant products. The<br />
additional assessment of duties by Yokohama Customs was based<br />
on its re-characterization of the transaction as a sale between the<br />
Company’s US subsidiary and the Company’s Japan subsidiary for<br />
custom law purposes despite the legal form of the transaction. The<br />
Company does not believe the legal documentation supports the<br />
re-characterization of these transactions. Yokohama Customs has<br />
raised several issues to support its re-characterization, including the<br />
fact that the Company has treated the relevant transaction as a sale<br />
between the Company’s US subsidiary and Japan subsidiary for income<br />
tax purposes. However, the Company believes that the relevant<br />
income tax and transfer pricing rules and regulations apply different<br />
standards and are not relevant to the customs issue. Because<br />
the Company believes that the legal documentation for these transactions<br />
support the Company’s position, the Company filed a complaint<br />
in the Tokyo District Court Civil Action Section in December<br />
2006 to have the Ministry of Finance’s affirmation of the additional<br />
assessments reversed. The final hearing on this matter was held on<br />
February 1, 2011 and the court indicated it would issue a decision on<br />
this case on March 25, 2011. Either party has the right to appeal this<br />
decision. If the Company receives an adverse decision in this case,<br />
the Company may be required to record an expense for the full<br />
amount of the disputed assessments, or $33.2 million.<br />
The second dispute relates to additional customs assessments<br />
made by Yokohama Customs for the period of October 2006 through<br />
November 2008 in connection with an audit in 2009, as well as the<br />
disputed portion of the Company’s current import duty rate the<br />
Company has been required to pay or hold in bond, and has paid under<br />
protest, since October of 2009. The aggregate amount of these<br />
additional assessments and disputed duties is 2.6 billion Japanese yen<br />
as of December 31, <strong>2010</strong> (approximately $32.1 million), net of any recovery<br />
of consumption taxes. The Company was also recently notified<br />
that it will likely be assessed an additional 0.6 billion Japanese yen<br />
(approximately $7.7 million), net of any recovery of consumption taxes<br />
based on an audit of the period of November 2008 through September<br />
2009. With this assessment, the Company has been required to<br />
pay or hold in bond amounts for all periods from October 2006 to<br />
present and the Company believes that additional assessments related<br />
to any prior period would be barred by applicable statutes of limitations.<br />
In July 2005, the Company changed the its operating structure<br />
in Japan and believed that these changes would eliminate further<br />
valuation disputes with Yokohama Customs as the new structure<br />
eliminated the issues that were the basis of the litigation in the first<br />
dispute (i.e., whether the Company’s US subsidiary was acting as an<br />
agent for the Company’s Japan subsidiary or was acting as the seller).<br />
However, in October 2009 the Company received notice from Yokohama<br />
Customs authorities that they were assessing additional duties,<br />
penalties and interest for the period of October 2006 through November<br />
2008 based on their view that the Company was not utilizing<br />
the proper valuation method. The basis for such additional assessment<br />
is different from the issues that are being litigated in the first dispute.<br />
The issue in this second case is whether a US entity utilizing a<br />
commissionaire agent in Japan to import its products can use the<br />
manufacturer’s invoice or must use another valuation method, and, if<br />
an alternative method must be used, what the allowable deductions<br />
would be in determining the proper valuation. Following the Company’s<br />
review of the assessments and after consulting with the Company’s<br />
legal and customs advisors, the Company believes that the additional<br />
assessments are improper and are not supported by applicable<br />
customs laws. The Company filed letters of protest with Yokohama<br />
Customs, which were rejected. The Company has appealed the matter<br />
to the Ministry of Finance in Japan. In addition, the Company is<br />
currently being required to post a bond or make a deposit equal to the<br />
difference between the Company’s declared duties and the amount<br />
the customs authorities have determined the Company should be<br />
paying on all current imports. Because the Company believes that the<br />
higher rate determined by the customs authorities is an improper application<br />
of the regulations, the Company is currently expensing the<br />
portion of the duties the Company believes is supported under applicable<br />
customs law, and recording the additional deposit or payment<br />
as a receivable within long-term assets on its consolidated financial<br />
statements. To the extent that the Company is unsuccessful in recovering<br />
the amounts assessed and paid or held in bond, the Company<br />
will likely be required to record an expense for the full amount of the<br />
disputed assessments, or $32.1 million as of December 31, <strong>2010</strong>.<br />
In November 2008, the U.S. Internal Revenue Service began an<br />
audit of the Company’s 2006 and 2007 tax years. The Company anticipates<br />
this audit will be completed during 2011.<br />
20. DIVIDENDS PER SHARE<br />
Quarterly cash dividends for the years ended December 31, 2009<br />
and <strong>2010</strong> totaled $29.0 million and $31.2 million or $0.115 and $0.125 per<br />
share, respectively. The board of directors has declared a quarterly cash<br />
dividend of $0.135 per share for all classes of common stock to be paid<br />
on March 16, 2011 to stockholders of record on February 25, 2011.<br />
75
NU SKIN ENTERPRISES, INC.<br />
Notes to Consolidated Financial Statements<br />
21. QUARTERLY RESULTS<br />
The following table sets forth selected unaudited quarterly data for the periods shown (U.S. dollars in millions, except per share amounts):<br />
1st<br />
Quarter<br />
2nd<br />
Quarter<br />
2009 <strong>2010</strong><br />
3rd<br />
Quarter<br />
4th<br />
Quarter<br />
1st<br />
Quarter<br />
2nd<br />
Quarter<br />
3rd<br />
Quarter<br />
4th<br />
Quarter<br />
Revenue . . . . . . . . . . . . $ 296.2 $ 322.6 $ 334.2 $ 378.1 $ 364.1 $ 388.4 $ 383.6 $ 401.2<br />
Gross profit. . . . . . . . . 242.4 261.9 272.1 311.0 299.3 320.4 314.8 330.3<br />
Operating income . . 20.2 34.4 40.9 52.2 46.1 59.2 52.9 58.9<br />
Net income . . . . . . . . 11.8 22.1 25.6 30.3 31.0 32.4 35.3 37.3<br />
Net income per share:<br />
Basic . . . . . . . . . . . . 0.19 0.35 0.41 0.48 0.50 0.51 0.57 0.60<br />
Diluted . . . . . . . . . . 0.19 0.35 0.40 0.47 0.48 0.50 0.55 0.58<br />
22. OTHER INCOME (EXPENSE), NET<br />
Other income (expense), net was $9.4 million of expense in <strong>2010</strong> compared to $6.6 million of expense in 2009. The Company recorded<br />
foreign currency transaction losses with respect to its intercompany receivables and payables with certain of its international affiliates, including<br />
markets that are newly opened or have remained in a loss position since inception. Generally, foreign currency transaction losses with these<br />
affiliates would be offset by gains related to the foreign currency transactions of the Company’s yen-based bank debt. Other income (expense),<br />
net also includes approximately $7.8 million, $6.9 million and $5.8 million in interest expense during 2008, 2009 and <strong>2010</strong>, respectively.<br />
It is impossible to predict foreign currency fluctuations. The Company cannot estimate the degree to which its operations will be impacted in<br />
the future, but it remains subject to these currency risks. However, the majority of these transaction losses are non-cash, non-operating losses.<br />
76
<strong>Report</strong> of Independent Registered Public Accounting Firm<br />
To the Board of <strong>Direct</strong>ors and Shareholders of <strong>Nu</strong> <strong>Skin</strong> Enterprises, Inc.:<br />
In our opinion, the accompanying consolidated balance sheets and<br />
the related consolidated statements of income, shareholder’s equity<br />
and comprehensive income, and cash flows present fairly, in all material<br />
respects, the financial position of <strong>Nu</strong> <strong>Skin</strong> Enterprises, Inc and its<br />
subsidiaries at December 31, <strong>2010</strong> and December 31, 2009, and the<br />
results of their operations and their cash flows for each of the three<br />
years in the period ended December 31, <strong>2010</strong> in conformity with accounting<br />
principles generally accepted in the United States of America.<br />
Also in our opinion, the Company maintained, in all material respects,<br />
effective internal control over financial reporting as of<br />
December 31, <strong>2010</strong>, based on criteria established in Internal Control<br />
- Integrated Framework issued by the Committee of Sponsoring Organizations<br />
of the Treadway Commission (COSO). The Company’s<br />
management is responsible for these financial statements, for maintaining<br />
effective internal control over financial reporting and for its<br />
assessment of the effectiveness of internal control over financial reporting,<br />
included in the accompanying Management’s <strong>Report</strong> on Internal<br />
Control over Financial <strong>Report</strong>ing, appearing in Item 9A. Our<br />
responsibility is to express opinions on these financial statements and<br />
on the Company’s internal control over financial reporting based on<br />
our integrated audits. We conducted our audits in accordance with<br />
the standards of the Public Company Accounting Oversight Board<br />
(United States). Those standards require that we plan and perform<br />
the audits to obtain reasonable assurance about whether the financial<br />
statements are free of material misstatement and whether effective<br />
internal control over financial reporting was maintained in all material<br />
respects. Our audits of the financial statements included examining,<br />
on a test basis, evidence supporting the amounts and disclosures in<br />
the financial statements, assessing the accounting principles used<br />
and significant estimates made by management, and evaluating the<br />
overall financial statement presentation. Our audit of internal control<br />
over financial reporting included obtaining an understanding of internal<br />
control over financial reporting, assessing the risk that a material<br />
weakness exists, and testing and evaluating the design and operating<br />
effectiveness of internal control based on the assessed risk. Our audits<br />
also included performing such other procedures as we considered<br />
necessary in the circumstances. We believe that our audits provide<br />
a reasonable basis for our opinions.<br />
A company’s internal control over financial reporting is a process designed<br />
to provide reasonable assurance regarding the reliability of financial<br />
reporting and the preparation of financial statements for external<br />
purposes in accordance with generally accepted accounting<br />
principles. A company’s internal control over financial reporting includes<br />
those policies and procedures that (i) pertain to the maintenance<br />
of records that, in reasonable detail, accurately and fairly reflect<br />
the transactions and dispositions of the assets of the company; (ii)<br />
provide reasonable assurance that transactions are recorded as necessary<br />
to permit preparation of financial statements in accordance with<br />
generally accepted accounting principles, and that receipts and expenditures<br />
of the company are being made only in accordance with<br />
authorizations of management and directors of the company; and (iii)<br />
provide reasonable assurance regarding prevention or timely detection<br />
of unauthorized acquisition, use, or disposition of the company’s<br />
assets that could have a material effect on the financial statements.<br />
Because of its inherent limitations, internal control over financial reporting<br />
may not prevent or detect misstatements. Also, projections<br />
of any evaluation of effectiveness to future periods are subject to the<br />
risk that controls may become inadequate because of changes in<br />
conditions, or that the degree of compliance with the policies or procedures<br />
may deteriorate.<br />
/s/ PricewaterhouseCoopers LLP<br />
Salt Lake City, Utah<br />
February 23, 2011<br />
77
ITEM 9.<br />
None.<br />
CHANGES IN AND<br />
DISAGREEMENTS WITH<br />
ACCOUNTANTS ON<br />
ACCOUNTING AND<br />
FINANCIAL DISCLOSURE<br />
ITEM 9A. CONTROLS AND PROCEDURES<br />
Evaluation of Disclosure Controls and Procedures. Under the supervision<br />
and with the participation of our management, including our<br />
Chief Executive Officer and Chief Financial Officer, we evaluated<br />
the effectiveness of the design and operation of our disclosure controls<br />
and procedures (as such term is defined in Rule 13a-15(e) under<br />
the Securities Exchange Act of 1934 (the “Exchange Act”)). Disclosure<br />
controls and procedures are the controls and other procedures<br />
that we designed to ensure that we record, process, summarize and<br />
report in a timely manner the information we must disclose in reports<br />
that we file with or submit to the Securities and Exchange Commission<br />
under the Exchange Act. Based on this evaluation, our Chief<br />
Executive Officer and our Chief Financial Officer concluded that our<br />
disclosure controls and procedures were effective as of the end of the<br />
period covered by this report.<br />
Changes in Internal Control over Financial <strong>Report</strong>ing. During<br />
the fourth quarter of <strong>2010</strong>, there was no change in our internal control<br />
over financial reporting (as such term is defined in Rule 13a-15(f) under<br />
the Exchange Act) that has materially affected, or is reasonably<br />
likely to materially affect, our internal control over financial reporting.<br />
Management’s <strong>Report</strong> on Internal Control over Financial <strong>Report</strong>ing.<br />
Our management is responsible for establishing and maintaining adequate<br />
internal control over financial reporting. Internal control over<br />
financial reporting is defined in Rule 13a-15(f) under the Exchange Act<br />
as a process designed by, or under the supervision of, our principal<br />
executive and principal financial officers and effected by our board of<br />
directors, management and other personnel, to provide reasonable<br />
assurance regarding the reliability of financial reporting and the preparation<br />
of financial statements for external purposes in accordance<br />
with accounting principles generally accepted in the United States of<br />
America and includes those policies and procedures that:<br />
• pertain to the maintenance of records that, in reasonable detail,<br />
accurately and fairly reflect the transactions and dispositions of<br />
our assets;<br />
• provide reasonable assurance that transactions are recorded as<br />
necessary to permit preparation of financial statements in accordance<br />
with accounting principles generally accepted in the<br />
United States of America, and that our receipts and expenditures<br />
are being made only in accordance with authorization of<br />
management and directors; and<br />
• provide reasonable assurance regarding prevention or timely<br />
detection of unauthorized acquisition, use or disposition of our<br />
assets that could have a material effect on the financial statements.<br />
Because of its inherent limitations, internal control over financial<br />
reporting may not prevent or detect misstatements. Also, projections<br />
of any evaluation of effectiveness to future periods are subject to the<br />
risk that controls may become inadequate because of changes in<br />
conditions, or that the degree of compliance with the policies or procedures<br />
may deteriorate.<br />
Under the supervision and with the participation of our management,<br />
including our principal executive and principal financial<br />
officers, we assessed, as of December 31, <strong>2010</strong>, the effectiveness of<br />
our internal control over financial reporting. This assessment was<br />
based on criteria established in the framework in Internal Control-<br />
Integrated Framework issued by the Committee of Sponsoring<br />
Organizations of the Treadway Commission. Based on our assessment,<br />
our management concluded that our internal control over<br />
financial reporting was effective as of December 31, <strong>2010</strong>.<br />
The effectiveness of our internal control over financial reporting<br />
as of December 31, <strong>2010</strong> has been audited by PricewaterhouseCoopers<br />
LLP, an independent registered public accounting firm, as stated<br />
in their report which appears herein.<br />
ITEM 9B.<br />
None.<br />
OTHER INFORMATION<br />
78
PART III<br />
The information required by Items 10, 11, 12, 13 and 14 of Part III is<br />
hereby incorporated by reference to our Definitive Proxy Statement<br />
filed or to be filed with the Securities and Exchange Commission for<br />
our 2011 <strong>Annual</strong> Meeting of Stockholders except for certain information<br />
required by Item 10 with respect to our executive officers which is<br />
set forth under Item 1 – Business, of this <strong>Annual</strong> <strong>Report</strong> on Form 10-K,<br />
and is incorporated herein by reference.<br />
PART IV<br />
ITEM 15.<br />
EXHIBITS AND FINANCIAL<br />
STATEMENT SCHEDULES<br />
Documents filed as part of this Form 10-K:<br />
1. Financial Statements. See Index to Consolidated Financial<br />
Statements under Item 8 of Part II.<br />
2. Financial Statement Schedules. N/A<br />
3. Exhibits. References to the “Company” shall mean <strong>Nu</strong> <strong>Skin</strong><br />
Enterprises, Inc. Exhibits preceded by an asterisk (*) are<br />
management contracts or compensatory plans or arrangements.<br />
Unless otherwise noted, the SEC exhibits number for<br />
exhibits incorporated by reference is 001-12421.<br />
3.1 Amended and Restated Certificate of Incorporation of the<br />
Company (incorporated by reference to Exhibit 3.1 to the<br />
Company’s Registration Statement on Form S-1 (File No.<br />
333-12073) (the “Form S-1”)).<br />
3.2 Certificate of Amendment to the Amended and Restated<br />
Certificate of Incorporation (incorporated by reference to<br />
Exhibit 3.2 to the Company’s <strong>Annual</strong> <strong>Report</strong> on Form 10-K<br />
for the year ended December 31, 2009).<br />
3.3 Certificate of Designation, Preferences and Relative Participating,<br />
Optional and Other Special Rights of Preferred<br />
Stock and Qualifications, Limitations and Restrictions<br />
Thereof (incorporated by reference to Exhibit 3.3 to the<br />
Company’s <strong>Annual</strong> <strong>Report</strong> on Form 10-K for the year ended<br />
December 31, 2004).<br />
3.4 Amended and Restated Bylaws of the Company (as amended)<br />
(incorporated by reference to Exhibit 3.4 to the Company’s<br />
<strong>Annual</strong> <strong>Report</strong> on Form 10-K for the year ended December<br />
31, 2007).<br />
3.5 Amendment to the Amended and Restated Bylaws of the<br />
Company (incorporated by reference to Exhibit 3.1 to the<br />
Company’s Current <strong>Report</strong> on Form 8-K filed on January 7,<br />
2008).<br />
4.1 Specimen Form of Stock Certificate for Class A Common<br />
Stock (incorporated by reference to Exhibit 4.1 to the Company’s<br />
Registration Statement on Form S-3 (File No. 333-<br />
90716)).<br />
4.2 Specimen Form of Stock Certificate for Class B Common<br />
Stock (incorporated by reference to Exhibit 4.2 to the Company’s<br />
Form S-1).<br />
10.1 Credit Agreement, dated as of May 10, 2001, among the<br />
Company, various financial institutions, and Bank of America,<br />
N.A., as Administrative Agent (incorporated by reference<br />
to Exhibit 10.7 to the Company’s <strong>Annual</strong> <strong>Report</strong> on<br />
Form 10-K for the year ended December 31, 2006).<br />
10.2 First Amendment to Credit Agreement, dated as of December<br />
14, 2001, among the Company, various financial institutions,<br />
and Bank of America, N.A. as Administrative<br />
Agent (incorporated by reference to Exhibit 10.8 to the<br />
Company’s <strong>Annual</strong> <strong>Report</strong> on Form 10-K for the year ended<br />
December 31, 2006).<br />
10.3 Second Amendment to Credit Agreement, dated as of October<br />
22, 2003 between the Company, various financial institutions,<br />
and Bank of America, N.A. as Administrative<br />
Agent (incorporated by reference to Exhibit 10.11 to the<br />
Company’s <strong>Annual</strong> <strong>Report</strong> on Form 10-K for the year ended<br />
December 31, 2003).<br />
79
10.4 Third Amendment to Credit Agreement, dated as of May<br />
10, 2004, among the Company, various financial institutions,<br />
and Bank One, N.A. as Administrative Agent (incorporated<br />
by reference to Exhibit 10.1 to the Company’s Quarterly <strong>Report</strong><br />
on Form 10-Q for the quarter ended June 30, 2004).<br />
10.5 Fourth Amendment to Credit Agreement, dated as of July<br />
28, 2006, among the Company, various financial institutions,<br />
and JPMorgan Chase Bank, N.A. as Administrative Agent<br />
(as successor to Bank One, N.A.) (incorporated by reference<br />
to Exhibit 99.2 to the Company’s Current <strong>Report</strong> on Form<br />
8-K filed on August 23, 2006).<br />
10.6 Fifth Amendment to Credit Agreement, dated as of October<br />
5, 2006, among the Company, various financial institutions,<br />
and JPMorgan Chase Bank, N.A. as Administrative<br />
Agent (as successor to Bank One, N.A.) (incorporated by<br />
reference to Exhibit 99.2 to the Company’s Current <strong>Report</strong><br />
on Form 8-K filed on October 10, 2006).<br />
10.7 Sixth Amendment to Credit Agreement, dated as of August<br />
8, 2007, among the Company, various financial institutions,<br />
and JPMorgan Chase Bank, N.A. as Administrative<br />
Agent (as successor to Bank One, N.A.) (incorporated by<br />
reference to Exhibit 99.1 to the Company’s Current <strong>Report</strong><br />
on Form 8-K filed August 15, 2007).<br />
10.8 Seventh Amendment to Credit Agreement, dated as of<br />
November 7, 2007, among the Company, various financial<br />
institutions, and JPMorgan Chase Bank, N.A. as Administrative<br />
Agent (as successor to Bank One, N.A.) (incorporated<br />
by reference to Exhibit 99.2 to the Company’s Current<br />
<strong>Report</strong> on Form 8-K filed on November 13, 2007).<br />
10.9 Eighth Amendment to Credit Agreement, dated as of February<br />
29, 2008, among the Company, various financial institutions,<br />
and JPMorgan Chase Bank, N.A. as Administrative<br />
Agent (as successor to Bank One, N.A.) (incorporated by<br />
reference to Exhibit 10.87 to the Company’s <strong>Annual</strong> <strong>Report</strong><br />
on Form 10-K for the year ended December 31, 2007).<br />
10.10 Ninth Amendment to Credit Agreement dated as of August<br />
25, 2009, among the Company, various financial institutions,<br />
and JPMorgan Chase Bank, N.A. (as successor to<br />
Bank One N.A.) as successor administrative agent (incorporated<br />
by reference to Exhibit 99.1 to the Company’s Current<br />
<strong>Report</strong> on Form 8-K filed on August 31, 2009).<br />
10.11 Letter Agreement among the Company, various financial<br />
institutions, and JPMorgan Chase Bank, N.A. as Administrative<br />
Agent (as successor to Bank One, N.A.) (incorporated<br />
by reference to Exhibit 99.5 to the Company’s Current<br />
<strong>Report</strong> on Form 8-K filed November 13, 2007).<br />
10.12 Credit Agreement, dated as of December 29, <strong>2010</strong>, among<br />
the Company and JPMorgan Chase Bank, N.A.<br />
10.13 Private Shelf Agreement, dated as of August 26, 2003, between<br />
the Company and Prudential Investment Management,<br />
Inc. (the “Private Shelf Agreement”) (incorporated by<br />
reference to Exhibit 10.20 to the Company’s <strong>Annual</strong> report<br />
on Form 10-K for the year ended December 31, 2008).<br />
10.14 First Amendment to the Private Shelf Agreement, dated as<br />
of October 31, 2003 between the Company and Prudential<br />
Investment Management, Inc. (incorporated by reference to<br />
Exhibit 10.53 to the Company’s <strong>Annual</strong> <strong>Report</strong> on Form<br />
10-K for the year ended December 31, 2003).<br />
10.15 Second Amendment to the Private Shelf Agreement, dated<br />
as of May 18, 2004, between the Company, Prudential Investment<br />
Management, Inc., and the holders of the Series A<br />
Senior Notes and Series B Senior Notes issued under the<br />
Private Shelf Agreement (incorporated by reference to Exhibit<br />
10.3 to the Company’s Quarterly <strong>Report</strong> on Form 10-Q<br />
for the quarter ended June 30, 2004).<br />
10.16 Third Amendment to the Private Shelf Agreement dated<br />
June 13, 2005 between the Company, Prudential Investment<br />
Management, Inc. and certain other lenders (incorporated<br />
by reference to Exhibit 10.1 to the Company’s Quarterly<br />
<strong>Report</strong> on Form 10-Q for the quarter ended June 30,<br />
2005).<br />
10.17 Fourth Amendment to the Private Shelf Agreement dated<br />
July 28, 2006 between the Company, Prudential Investment<br />
Management, Inc. and certain other lenders (incorporated<br />
by reference to Exhibit 99.3 to the Company’s Current <strong>Report</strong><br />
on Form 8-K filed on August 23, 2006).<br />
10.18 Fifth Amendment to the Private Shelf Agreement dated<br />
October 5, 2006 between the Company, Prudential Investment<br />
Management, Inc. and certain other lenders (incorporated<br />
by reference to Exhibit 99.3 to the Company’s Current<br />
<strong>Report</strong> on Form 8-K filed on October 10, 2006).<br />
10.19 Sixth Amendment to the Private Shelf Agreement, dated as<br />
of November 7, 2007, between the Company, Prudential Investment<br />
Management, Inc. and certain other lenders (in-<br />
80
corporated by reference to Exhibit 99.3 to the Company’s<br />
Current <strong>Report</strong> on Form 8-K filed on November 13, 2007).<br />
10.20 Seventh Amendment to the Private Shelf Agreement, dated<br />
as of February 25, 2008, between the Company, Prudential<br />
Investment Management, Inc. and certain other lenders<br />
(incorporated by reference to Exhibit 10.83 to the Company’s<br />
<strong>Annual</strong> <strong>Report</strong> on Form 10-K for the year ended December<br />
31, 2007).<br />
10.21 Multi-Currency Private Shelf Agreement dated as of October<br />
1, 2009, between the Company, Prudential Investment<br />
Management, Inc. and certain other lenders (incorporated<br />
by reference to Exhibit 10.1 to the Company’s Quarterly <strong>Report</strong><br />
on Form 10-Q for the quarter ended June 30, 2009).<br />
10.22 Letter Agreement among the Company, Prudential Investment<br />
Management, Inc. and certain other lenders (incorporated<br />
by reference to Exhibit 99.6 to the Company’s Current<br />
<strong>Report</strong> on Form 8-K filed November 13, 2007).<br />
10.23 Letter Agreement dated October 1, 2009, among the Company,<br />
Prudential Investment Management, Inc. and certain<br />
other lenders (incorporated by reference to Exhibit 10.32 to<br />
the Company’s <strong>Annual</strong> <strong>Report</strong> on Form 10-K for the year<br />
ended December 31, 2009).<br />
10.24 Series C Senior Notes Nos. C-1 and C-2 issued February 7,<br />
2005 by the Company to Prudential Investment Management,<br />
Inc. and/or its affiliates pursuant to the Private Shelf<br />
Agreement (incorporated by reference to Exhibit 99.2 to the<br />
Company’s Current <strong>Report</strong> on Form 8-K filed February 8,<br />
2005).<br />
10.25 Series D Senior Notes Nos. D-1, D-2, D-3 and D-4 issued<br />
October 3, 2006 by the Company to Prudential Investment<br />
Management, Inc. and/or its affiliates pursuant to the Private<br />
Shelf Agreement (incorporated by reference to Exhibit 99.4<br />
to the Company’s Current <strong>Report</strong> on Form 8-K filed October<br />
10, 2006).<br />
10.26 Series E Senior Notes Nos. E-1, E-2, E-3, E-4 and E-5 issued<br />
January 19, 2007 by the Company to Prudential Investment<br />
Management, Inc. and/or its affiliates pursuant to the Private<br />
Shelf Agreement (incorporated by reference to Exhibit 99.1<br />
to the Company’s Current <strong>Report</strong> on Form 8-K filed January<br />
25, 2007).<br />
10.27 Series E Senior Note E-6, issued July 20, 2007, by the Company<br />
to Prudential Insurance Company of America pursuant<br />
to the Private Shelf Agreement (incorporated by reference<br />
to Exhibit 99.1 to the Company’s Current <strong>Report</strong> on 8-K filed<br />
January 14, 2008).<br />
10.28 Series EE Senior Note EE-1, issued January 8, 2008, by the<br />
Company to Prudential Insurance Company of America<br />
pursuant to the Private Shelf Agreement (incorporated by<br />
reference to Exhibit 99.2 to the Company’s Current <strong>Report</strong><br />
on 8-K filed January 14, 2008).<br />
10.29 Series F Senior Notes Nos. F-1 and F-2 issued September<br />
28, 2007 by the Company to Prudential Investment Management,<br />
Inc. and/or its affiliates pursuant to the Private<br />
Shelf Agreement (incorporated by reference to Exhibit 10.1<br />
to the Company’s Quarterly <strong>Report</strong> on Form 10-Q for the<br />
quarter ended September 30, 2007).<br />
10.30 Pledge Agreement dated October 12, 2000, by and between<br />
the Company and State Street Bank and Trust Company<br />
of California, N.A., acting in its capacity as collateral<br />
agent (incorporated by reference to Exhibit 10.5 to the Company’s<br />
<strong>Annual</strong> <strong>Report</strong> on Form 10-K for the year ended December<br />
31, 2005).<br />
10.31 Pledge Amendments executed by the Company dated December<br />
31, 2003 (incorporated by reference to Exhibit 10.5 to<br />
the Company’s <strong>Annual</strong> <strong>Report</strong> on Form 10-K for the year<br />
ended December 31, 2003).<br />
10.32 Pledge Agreement dated as of January 31, 2005 by and<br />
among <strong>Nu</strong> <strong>Skin</strong> Asia Investment, Inc., a wholly-owned subsidiary<br />
of the Company, and U.S. Bank National Association,<br />
as agent for and on behalf of the Benefited Parties under the<br />
Amended and Restated Collateral Agency and Intercreditor<br />
Agreement (referred to below) (incorporated by reference to<br />
Exhibit 99.3 to the Company’s Current <strong>Report</strong> on Form<br />
8-K/A filed on March 10, 2005).<br />
10.33 Amended and Restated Collateral Agency and Intercreditor<br />
Agreement, dated as of August 26, 2003, by and among the<br />
Company and various of its subsidiaries, U.S. Bank National<br />
Association, as Collateral Agent, and various lending institutions<br />
(incorporated by reference to Exhibit 10.40 to the<br />
Company’s <strong>Annual</strong> <strong>Report</strong> on Form 10-K for the year ended<br />
December 31, 2008).<br />
10.34 Real Estate Purchase and Sale Agreement, and other ancillary<br />
agreements, dated as of December 30, <strong>2010</strong> between<br />
Aspen Country, LLC and <strong>Nu</strong> <strong>Skin</strong> International, Inc.<br />
81
10.35 Real Estate Purchase and Sale Agreement, and other ancillary<br />
agreements, dated as of December 30, <strong>2010</strong> between<br />
Scrub Oak, LLC and <strong>Nu</strong> <strong>Skin</strong> International, Inc.<br />
10.36 Form of Promissory Notes dated as of December 30, <strong>2010</strong><br />
by <strong>Nu</strong> <strong>Skin</strong> International, Inc., with a schedule of material differences.<br />
10.37 Form of Termination of Lock-up Agreements dated as of<br />
September 1, <strong>2010</strong> between the Company and each of Blake<br />
and Nancy Roney, Steven and Kalleen Lund, and Sandra Tillotson<br />
*10.38 Form of Indemnification Agreement to be entered into between<br />
the Company and certain of its officers and directors<br />
(incorporated by reference to Exhibit 10.48 to the Company’s<br />
<strong>Annual</strong> <strong>Report</strong> on Form 10-K for the year ended December<br />
31, 2008).<br />
*10.39 Amended and Restated Deferred Compensation Plan, effective<br />
as of January 1, 2008 (incorporated by reference to<br />
Exhibit 10.5 to the Company’s Quarterly <strong>Report</strong> on Form<br />
10-Q for the quarter ended September 30, 2007).<br />
*10.40 Amendment to the Deferred Compensation Plan, effective<br />
as of January 1, 2009 (incorporated by reference to Exhibit<br />
10.50 to the Company’s <strong>Annual</strong> <strong>Report</strong> on Form 10-K for<br />
the year ended December 31, 2008).<br />
*10.41 <strong>Nu</strong> <strong>Skin</strong> Enterprises, Inc. Nonqualified Deferred Compensation<br />
Trust dated December 14, 2005 (incorporated by reference<br />
to Exhibit 99.2 to the Company’s Current <strong>Report</strong> on<br />
Form 8-K filed December 19, 2005).<br />
*10.42 Second Amended and Restated <strong>Nu</strong> <strong>Skin</strong> Enterprises, Inc.<br />
1996 Stock Incentive Plan (incorporated by reference to Exhibit<br />
10.28 to the Company’s <strong>Annual</strong> <strong>Report</strong> on Form 10-K<br />
for the year ended December 31, 2005).<br />
*10.43 Form of Master Stock Option Agreement (1996 Plan) (incorporated<br />
by reference to Exhibit 10.49 to the Company’s<br />
<strong>Annual</strong> <strong>Report</strong> on Form 10-K for the year ended December<br />
31, 2007).<br />
*10.44 Form of Stock Option Agreement for <strong>Direct</strong>ors (1996 Plan)<br />
(incorporated by reference to Exhibit 10.48 to the Company’s<br />
<strong>Annual</strong> <strong>Report</strong> on Form 10-K for the year ended December<br />
31, 2006).<br />
*10.45 <strong>Nu</strong> <strong>Skin</strong> Enterprises, Inc. 2006 Stock Incentive Plan (incorporated<br />
by reference to Exhibit 10.1 to the Company’s Current<br />
<strong>Report</strong> on Form 8-K filed on June 1, 2006).<br />
*10.46 Form of Master Stock Option Agreement (2006 Plan) (incorporated<br />
by reference to Exhibit 10.10 to the Company’s<br />
Quarterly <strong>Report</strong> on Form 10-Q for the quarterly period<br />
ended September 30, 2006).<br />
*10.47 Form of Master Stock Option Agreement (2006 Plan Performance<br />
Option (U.S.)) (incorporated by reference to Exhibit<br />
10.54 to the Company’s <strong>Annual</strong> <strong>Report</strong> on Form 10-K<br />
for the year ended December 31, 2007).<br />
*10.48 Form of Master Stock Option Agreement for <strong>Direct</strong>ors<br />
(2006 Plan) (incorporated by reference to Exhibit 10.59 to<br />
the Company’s <strong>Annual</strong> <strong>Report</strong> on Form 10-K for the year<br />
ended December 31, 2008).<br />
*10.49 Form of <strong>Direct</strong>or Restricted Stock Unit Agreement (2006<br />
Plan) (incorporated by reference to Exhibit 10.4 to the Company’s<br />
Quarterly <strong>Report</strong> on Form 10-Q for the quarter ended<br />
June 30, 2007).<br />
*10.50 Form of Master Restricted Stock Unit Agreement (2006<br />
Plan) (incorporated by reference to Exhibit 10.11 to the Company’s<br />
Quarterly <strong>Report</strong> on Form 10-Q for the quarterly<br />
period ended September 30, 2006).<br />
*10.51 <strong>Nu</strong> <strong>Skin</strong> Enterprises, Inc. <strong>2010</strong> Omnibus Incentive Plan (incorporated<br />
by reference to Exhibit 10.1 to the Company’s<br />
Current <strong>Report</strong> on Form 8-K filed on June 2, <strong>2010</strong>).<br />
*10.52 Form of <strong>2010</strong> Plan U.S. Stock Option Master Agreement<br />
and Grant Notice (incorporated by reference to Exhibit 10.1<br />
to the Company’s Current <strong>Report</strong> on Form 8-K filed on July<br />
2, <strong>2010</strong>).<br />
*10.53 Form of <strong>2010</strong> Plan U.S. Restricted Stock Unit Master Agreement<br />
and Grant Notice (incorporated by reference to Exhibit<br />
10.3 to the Company’s Current <strong>Report</strong> on Form 8-K<br />
filed on July 2, <strong>2010</strong>).<br />
*10.54 Form of <strong>2010</strong> Plan U.S. Performance Stock Option Master<br />
Agreement and Grant Notice.<br />
*10.55 Form of <strong>2010</strong> Plan U.S. Performance Restricted Stock Unit<br />
Master Agreement and Grant Notice (incorporated by reference<br />
to Exhibit 10.2 to the Company’s Current <strong>Report</strong> on<br />
Form 8-K filed on July 2, <strong>2010</strong>).<br />
82
*10.56 Form of <strong>2010</strong> Plan <strong>Direct</strong>or Stock Option Master Agreement<br />
and Grant Notice (incorporated by reference to Exhibit<br />
10.7 to the Company’s Quarterly <strong>Report</strong> on Form 10-Q<br />
for the quarterly period ended June 30, <strong>2010</strong>).<br />
*10.57 Form of <strong>2010</strong> Plan <strong>Direct</strong>or Restricted Stock Unit Master<br />
Agreement and Grant Notice (incorporated by reference to<br />
Exhibit 10.8 to the Company’s Quarterly <strong>Report</strong> on Form<br />
10-Q for the quarterly period ended June 30, <strong>2010</strong>).<br />
*10.58 <strong>Nu</strong> <strong>Skin</strong> Enterprises, Inc. 2009 Key Employee Death Benefit<br />
Plan.<br />
*10.59 Employment Letter between the Company and Truman<br />
Hunt dated January 17, 2003 (incorporated by reference to<br />
Exhibit 10.67 to the Company’s <strong>Annual</strong> <strong>Report</strong> on Form<br />
10-K for the year ended December 31, 2007).<br />
*10.60 Summary of Modifications to Truman Hunt’s Employment<br />
Letter (incorporated by reference to Exhibit 10.69 to the<br />
Company’s <strong>Annual</strong> <strong>Report</strong> on Form 10-K for the year ended<br />
December 31, 2008).<br />
*10.61 Joseph Y. Chang Employment Agreement dated November<br />
9, 2009, between Mr. Chang and the Company (incorporated<br />
by reference to Exhibit 10.2 to the Company’s<br />
Quarterly <strong>Report</strong> on Form 10-Q for the quarter ended September<br />
30, 2009).<br />
*10.62 Daniel Chard Employment Agreement effective February<br />
13, 2006 between Mr. Chard and the Company (incorporated<br />
by reference to Exhibit 10.61 to the Company’s <strong>Annual</strong><br />
<strong>Report</strong> on Form 10-K for the year ended December 31,<br />
2006).<br />
*10.63 Summary of Modifications to Dan Chard’s Employment<br />
Letter (incorporated by reference to Exhibit 10.3 to the<br />
Company’s Quarterly <strong>Report</strong> on Form 10-Q for the quarter<br />
ended March 31, 2009).<br />
*10.64 Event Appearance Bonus Guidelines (Approved for Sandra<br />
Tillotson in October 2006) (incorporated by reference to Exhibit<br />
10.68 to the Company’s <strong>Annual</strong> <strong>Report</strong> on Form 10-K<br />
for the year ended December 31, 2006).<br />
*10.65 Ashok Pahwa Settlement and Release Agreement dated<br />
April 1, <strong>2010</strong>, between Mr. Pahwa and the Company (incorporated<br />
by reference to Exhibit 10.2 to the Company’s<br />
Quarterly <strong>Report</strong> on Form 10-Q for the quarter ended June<br />
30, <strong>2010</strong>).<br />
*10.66 Gary Sumihiro Settlement and Release Agreement dated<br />
March 1, 2009, between Mr. Sumihiro and the Company (incorporated<br />
by reference to Exhibit 10.1 to the Company’s<br />
Quarterly <strong>Report</strong> on Form 10-Q for the quarter ended<br />
March 31, 2009).<br />
*10.67 Gary Sumihiro Consulting Agreement dated March 1, 2009,<br />
between Mr. Sumihiro and the Company (incorporated by<br />
reference to Exhibit 10.2 to the Company’s Quarterly <strong>Report</strong><br />
on Form 10-Q for the quarter ended March 31, 2009).<br />
*10.68 Form of Key Employee Covenants (incorporated by reference<br />
to Exhibit 10.2 to the Company’s Quarterly <strong>Report</strong> on<br />
Form 10-Q for the quarter ended June 30, 2007).<br />
21.1 Subsidiaries of the Company.<br />
23.1 Consent of PricewaterhouseCoopers LLP.<br />
31.1 Certification by M. Truman Hunt, President and Chief Executive<br />
Officer, pursuant to Rule 13a-14(a) of the Securities<br />
Exchange Act of 1934, as adopted pursuant to Section 302<br />
of the Sarbanes-Oxley Act of 2002.<br />
31.2 Certification by Ritch N. Wood, Chief Financial Officer, pursuant<br />
to Rule 13a-14(a) of the Securities Exchange Act of<br />
1934, as adopted pursuant to Section 302 of the Sarbanes-<br />
Oxley Act of 2002.<br />
32.1 Certification by M. Truman Hunt, President and Chief Executive<br />
Officer, pursuant to Section 1350, Chapter 63 of Title<br />
18, United States Code, as adopted pursuant to Section 906<br />
of the Sarbanes-Oxley Act of 2002.<br />
32.2 Certification by Ritch N. Wood, Chief Financial Officer, pursuant<br />
to Section 1350, Chapter 63 of Title 18, United States<br />
Code, as adopted pursuant to Section 906 of the Sarbanes-<br />
Oxley Act of 2002.<br />
83
SIGNATURES<br />
Pursuant to the requirements of Section 13 or 15(d) of the Securities Exchange Act of 1934, the Registrant has duly caused this report to be<br />
signed on its behalf by the undersigned, thereunto duly authorized on February 23, 2011.<br />
NU SKIN ENTERPRISES, INC.<br />
By: /s/ M. Truman Hunt<br />
M. Truman Hunt, Chief Executive Officer<br />
Pursuant to the requirements of the Securities Exchange Act of 1934, this report has been signed below by the following persons on<br />
behalf of the Registrant and in the capacities indicated on February 23, 2011.<br />
Signatures<br />
Capacity in Which Signed<br />
/s/ Blake M. Roney<br />
Blake M. Roney<br />
/s/ M. Truman Hunt<br />
M. Truman Hunt<br />
/s/ Ritch N. Wood<br />
Ritch N. Wood<br />
/s/ Sandra N. Tillotson<br />
Sandra N. Tillotson<br />
/s/ Steven J. Lund<br />
Steven J. Lund<br />
/s/ Daniel W. Campbell<br />
Daniel W. Campbell<br />
/s/ E.J. “Jake” Garn<br />
E. J. “Jake” Garn<br />
/s/ Andrew D. Lipman<br />
Andrew D. Lipman<br />
/s/ Patricia A. Negrón<br />
Patricia A. Negrón<br />
/s/ David D. Ussery<br />
David D. Ussery<br />
/s/ Thomas R. Pisano<br />
Thomas R. Pisano<br />
/s/ Nevin N. Andersen<br />
Nevin N. Andersen<br />
Chairman of the Board<br />
Chief Executive Officer and <strong>Direct</strong>or<br />
(Principal Executive Officer)<br />
Chief Financial Officer<br />
(Principal Financial Officer and Accounting Officer)<br />
Senior Vice President, <strong>Direct</strong>or<br />
<strong>Direct</strong>or<br />
<strong>Direct</strong>or<br />
<strong>Direct</strong>or<br />
<strong>Direct</strong>or<br />
<strong>Direct</strong>or<br />
<strong>Direct</strong>or<br />
<strong>Direct</strong>or<br />
<strong>Direct</strong>or<br />
84
BOARD OF DIRECTORS<br />
Blake M. Roney<br />
Executive Chairman of the Board<br />
Steven J. Lund<br />
Vice Chairman of the Board<br />
M. Truman Hunt<br />
President, Chief Executive Officer<br />
Sandie N. Tillotson<br />
Senior Vice President<br />
Senator E.J. “Jake” Garn<br />
United States Senate, Retired<br />
Compensation Committee Member<br />
Nominating and Corporate Governance Committee Member<br />
Nevin N. Andersen<br />
Retired<br />
Audit Committee Chair<br />
Daniel W. Campbell<br />
Managing General Partner, EsNet, Ltd.<br />
Compensation Committee Chair<br />
Audit Committee Member<br />
Andrew D. Lipman<br />
Partner, Bingham McCutchen, LLP<br />
Nominating and Corporate Governance Committee Chair<br />
Compensation Committee Member<br />
Patricia A. Negrón<br />
Independent Consultant, Author<br />
Audit Committee Member<br />
Compensation Committee Member<br />
Thomas R. Pisano<br />
Retired<br />
Audit Committee Member<br />
Nominating and Corporate Governance Committee Member<br />
David D. Ussery<br />
Retired<br />
Compensation Committee Member<br />
Nominating and Corporate Governance Committee Member<br />
85
CORPORATE INFORMATION<br />
TRANSFER AGENT<br />
Inquiries regarding lost stock certificates, consolidation of accounts, and changes in address, name, or ownership should be addressed<br />
to: American Stock Transfer & Trust 59 Maiden Lane New York, New York 10038 Domestic telephone: 877-777-0800 International<br />
telephone: 718-921-8200<br />
CORPORATE HEADQUARTERS<br />
<strong>Nu</strong> <strong>Skin</strong> Enterprises 75 West Center Street Provo, Utah 84601 Telephone: 801-345-2657<br />
COMPANY WEBSITES<br />
<strong>Nu</strong> <strong>Skin</strong> Enterprises: www.nuskinenterprises.com <strong>Nu</strong> <strong>Skin</strong>: www.nuskin.com Pharmanex: www.pharmanex.com<br />
ADDITIONAL STOCKHOLDER INFORMATION<br />
Additional information and news is available at www.nuskinenterprises.com. For investor information, inquiries, annual reports and SEC filings,<br />
call 801-345-6100, email spond@nuskin.com, or write Investor Relations at the corporate headquarters.<br />
FORWARD-LOOKING STATEMENTS<br />
This annual report contains forward-looking statements, which represent our expectations and beliefs about future events and operating results<br />
as of the date of this report, including the outlook for our future performance, strategic initiatives and new products, and the underlying<br />
assumptions described in this annual report. Words or phrases such as “believes,” “expects,” “anticipates,” “plans” and similar words or phrases are<br />
intended to help identify forward-looking statements.<br />
The company’s financial performance and the forward-looking statements contained herein are further qualifi ed by a detailed discussion<br />
of associated risks set forth in the documents filed by the company with the Securities and Exchange Commission, including the company’s<br />
<strong>Annual</strong> <strong>Report</strong> on Form 10-K filed on February 23, 2011. The forward-looking statements set forth the company’s beliefs as of the date of this<br />
release, and the company assumes no duty to update the forward-looking statements contained in this release to reflect any change except<br />
as required by law.<br />
86
18<br />
NU SKIN ENTERPRISES, INC. 75 WEST CENTER STREET PROVO, UTAH 84601 01 007254