Table 1.9a - (TAM10900)- Balance sheet of other MFIs resident in Italy: assets Money and Banking Balance sheet of other MFIs resident in Italy: assets (stocks in millions of euros) Loans Table 1.9a TAM10900 Cash MFIs Residents of Italy General government Other sectors MFIs Residents of other euro-area countries General government Other sectors Rest of the world S562518M S589956M S599104M S612202M S621694M S634800M S645671M S655611M 2012 .......................... 13,360 362,308 267,775 1,727,587 78,337 674 34,210 107,785 2013 - Aug............... 9,906 364,535 259,815 1,677,763 67,750 583 29,682 95,188 Sept.............. 10,407 373,951 260,041 1,677,720 68,923 578 30,457 99,040 Oct. .............. 10,339 377,605 257,874 1,669,713 70,353 583 29,117 99,104 Nov............... 9,735 368,585 258,113 1,681,975 69,361 583 25,302 91,069 Dec............... 13,023 358,684 262,456 1,668,266 67,271 576 24,852 90,166 2014 - Jan. .............. 9,982 390,702 264,686 1,654,625 65,134 679 26,190 92,503 Feb............... 9,676 396,704 264,725 1,650,346 64,414 684 24,801 87,010 Mar. .............. 9,924 397,670 267,991 1,657,431 63,213 672 26,680 90,189 Apr. .............. 10,791 391,480 266,183 1,636,204 61,179 668 24,736 87,803 May .............. 10,026 382,693 267,164 1,625,652 64,728 673 26,565 91,028 June ............. 10,265 386,685 267,900 1,652,564 64,605 652 25,232 93,388 July .............. 9,913 390,455 265,594 1,649,065 61,769 655 25,180 94,863 Aug............... (9,693) (386,440) (263,648) (1,634,991) (63,503) (657) (24,001) (92,761) Holdings of securities other than shares MFIs Residents of Italy General government Other sectors MFIs Residents of other euro-area countries General government Other sectors Rest of the world S953876M S140793M S154530M S184537M S166032M S181158M S665123M 2012 .......................... 382,035 351,618 147,151 16,584 5,086 23,428 12,691 2013 - Aug............... 369,075 417,692 148,467 14,885 5,515 21,192 13,086 Sept.............. 363,642 414,950 147,876 14,519 6,774 21,292 12,951 Oct. .............. 361,762 418,518 145,614 14,641 6,968 21,525 12,245 Nov............... 356,937 420,973 145,239 14,543 6,347 21,529 12,756 Dec............... 352,491 404,497 143,275 14,240 6,482 21,533 13,418 2014 - Jan. .............. 343,964 400,780 143,766 14,195 5,781 21,636 13,034 Feb............... 341,786 410,142 142,779 14,112 5,422 8,364 12,534 Mar. .............. 317,099 413,294 140,428 14,581 6,149 8,679 12,626 Apr. .............. 315,841 422,355 138,544 14,842 7,704 8,738 12,822 May .............. 308,797 420,167 134,266 14,822 5,653 8,951 12,771 June ............. 306,498 416,288 135,837 15,393 8,953 9,161 12,632 July .............. 296,969 413,899 132,547 15,112 10,208 8,665 12,790 Aug............... (290,435) (416,849) (131,185) (15,189) (10,643) (9,304) (12,150) Shares and other equity Residents of Italy Residents of other euro-area countries MFIs Other sectors MFIs Other sectors Rest of the world Fixed assets Other assets Total assets S678647M S687287M S694873M S737997M S745236M S753273M S766152M S200055M 2012 .......................... 57,683 76,199 48,165 8,696 8,995 72,008 418,103 4,220,479 2013 - Aug............... 56,368 78,672 48,181 9,218 7,796 70,825 350,857 4,117,052 Sept.............. 55,252 79,946 48,210 9,625 7,887 70,823 351,919 4,126,786 Oct. .............. 53,243 79,186 48,208 10,090 8,023 69,380 361,087 4,125,178 Nov............... 53,262 78,744 48,217 10,123 7,835 69,511 357,399 4,108,138 Dec............... 52,830 79,888 48,219 9,961 8,103 69,723 338,178 4,048,134 2014 - Jan. .............. 54,379 77,392 48,255 10,312 8,095 69,654 358,321 4,074,063 Feb............... 57,226 77,345 48,269 9,864 8,035 68,887 360,538 4,063,665 Mar. .............. 56,529 77,197 48,288 10,297 7,829 62,872 375,083 4,064,720 Apr. .............. 56,247 77,786 48,315 9,635 7,651 62,917 374,083 4,036,522 May .............. 56,126 77,638 48,325 9,608 7,786 62,860 367,813 4,004,110 June ............. 55,384 77,295 48,226 9,593 8,005 62,858 361,777 4,029,191 July .............. 55,756 76,428 48,222 9,561 8,090 63,005 359,452 4,008,198 Aug............... (55,767) (76,371) (48,236) (10,232) (7,997) (63,079) (376,900) (4,000,031) 20
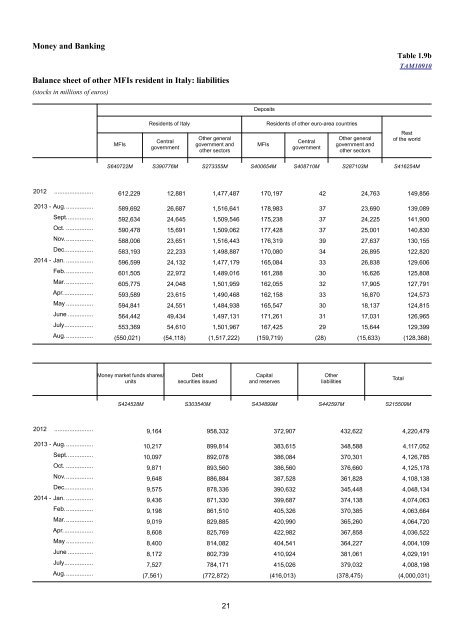
Table 1.9b - (TAM10910) - Balance sheet of other MFIs resident in Italy: liabilities Money and Banking Table 1.9b TAM10910 Balance sheet of other MFIs resident in Italy: liabilities (stocks in millions of euros) Deposits Residents of Italy Residents of other euro-area countries MFIs Central government Other general government and other sectors MFIs Central government Other general government and other sectors Rest of the world S640722M S390776M S273355M S400654M S408710M S287103M S416254M 2012 ....................... 612,229 12,881 1,477,487 170,197 42 24,763 149,856 2013 - Aug................. 589,692 26,687 1,516,641 178,983 37 23,690 139,089 Sept................ 592,634 24,645 1,509,546 175,238 37 24,225 141,900 Oct. ................ 590,478 15,691 1,509,062 177,428 37 25,001 140,830 Nov................. 588,006 23,651 1,516,443 176,319 39 27,637 130,155 Dec................. 583,193 22,233 1,498,887 170,080 34 26,895 122,820 2014 - Jan. ................ 596,599 24,132 1,477,179 165,084 33 26,838 129,606 Feb................. 601,505 22,972 1,489,016 161,288 30 16,626 125,808 Mar. ................ 605,775 24,048 1,501,959 162,055 32 17,905 127,791 Apr.................. 593,589 23,615 1,490,468 162,158 33 16,870 124,573 May ................ 594,841 24,551 1,484,938 165,547 30 18,137 124,815 June ............... 564,442 49,434 1,497,131 171,261 31 17,031 126,965 July................. 553,369 54,610 1,501,967 167,425 29 15,644 129,399 Aug................. (550,021) (54,118) (1,517,222) (159,719) (28) (15,633) (128,368) Money market funds shares/ units Debt securities issued Capital and reserves Other liabilities Total S424528M S303540M S434899M S442597M S215509M 2012 ....................... 9,164 958,332 372,907 432,622 4,220,479 2013 - Aug................. 10,217 899,814 383,615 348,588 4,117,052 Sept................ 10,097 892,078 386,084 370,301 4,126,785 Oct. ................ 9,871 893,560 386,560 376,660 4,125,178 Nov................. 9,648 886,884 387,528 361,828 4,108,138 Dec................. 9,575 878,336 390,632 345,448 4,048,134 2014 - Jan. ................ 9,436 871,330 399,687 374,138 4,074,063 Feb................. 9,198 861,510 405,326 370,385 4,063,664 Mar. ................ 9,019 829,885 420,990 365,260 4,064,720 Apr.................. 8,608 825,769 422,982 367,858 4,036,522 May ................ 8,400 814,082 404,541 364,227 4,004,109 June ............... 8,172 802,739 410,924 381,061 4,029,191 July................. 7,527 784,171 415,026 379,032 4,008,198 Aug................. (7,561) (772,872) (416,013) (378,475) (4,000,031) 21