Twelve Inconvenient Truths About Higher Education - The Center for ...
Twelve Inconvenient Truths About Higher Education - The Center for ...
Twelve Inconvenient Truths About Higher Education - The Center for ...

Create successful ePaper yourself
Turn your PDF publications into a flip-book with our unique Google optimized e-Paper software.
TWELVE INCONVENIENT TRUTHS ABOUT HIGHER EDUCATION<br />
<strong>Inconvenient</strong> Truth #3:<br />
College Degrees Don’t Guarantee Success<br />
High school students are told that they will not be successful in life unless they attend college. To<br />
quote from one July 2009 speech by President Barack Obama, “. . . when we have placed our bet <strong>for</strong><br />
the future in education, we have prospered as a result. ...That is why, at the start of my administration<br />
I set a goal <strong>for</strong> America: by 2020, this nation will once again have the highest proportion of college graduates<br />
in the world.” 5 <strong>The</strong> unspoken assumption is that possessing a college degree is a ticket to a com<strong>for</strong>table<br />
middle class life—if not better.<br />
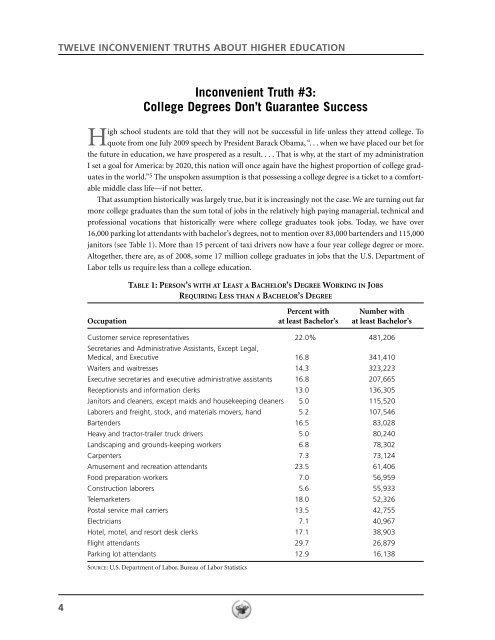
That assumption historically was largely true, but it is increasingly not the case. We are turning out far<br />
more college graduates than the sum total of jobs in the relatively high paying managerial, technical and<br />
professional vocations that historically were where college graduates took jobs. Today, we have over<br />
16,000 parking lot attendants with bachelor’s degrees, not to mention over 83,000 bartenders and 115,000<br />
janitors (see Table 1). More than 15 percent of taxi drivers now have a four year college degree or more.<br />
Altogether, there are, as of 2008, some 17 million college graduates in jobs that the U.S. Department of<br />
Labor tells us require less than a college education.<br />
TABLE 1: PERSON’S WITH AT LEAST A BACHELOR’S DEGREE WORKING IN JOBS<br />
REQUIRING LESS THAN A BACHELOR’S DEGREE<br />
Percent with Number with<br />
Occupation at least Bachelor’s at least Bachelor’s<br />
Customer service representatives 22.0% 481,206<br />
Secretaries and Administrative Assistants, Except Legal,<br />
Medical, and Executive 16.8 341,410<br />
Waiters and waitresses 14.3 323,223<br />
Executive secretaries and executive administrative assistants 16.8 207,665<br />
Receptionists and in<strong>for</strong>mation clerks 13.0 136,305<br />
Janitors and cleaners, except maids and housekeeping cleaners 5.0 115,520<br />
Laborers and freight, stock, and materials movers, hand 5.2 107,546<br />
Bartenders 16.5 83,028<br />
Heavy and tractor-trailer truck drivers 5.0 80,240<br />
Landscaping and grounds-keeping workers 6.8 78,302<br />
Carpenters 7.3 73,124<br />
Amusement and recreation attendants 23.5 61,406<br />
Food preparation workers 7.0 56,959<br />
Construction laborers 5.6 55,933<br />
Telemarketers 18.0 52,326<br />
Postal service mail carriers 13.5 42,755<br />
Electricians 7.1 40,967<br />
Hotel, motel, and resort desk clerks 17.1 38,903<br />
Flight attendants 29.7 26,879<br />
Parking lot attendants 12.9 16,138<br />
SOURCE: U.S. Department of Labor, Bureau of Labor Statistics<br />
4