SMARTPROS LTD. 2010 Annual Report to Shareholders
SMARTPROS LTD. 2010 Annual Report to Shareholders
SMARTPROS LTD. 2010 Annual Report to Shareholders

Create successful ePaper yourself
Turn your PDF publications into a flip-book with our unique Google optimized e-Paper software.
smartpros ltd and subsidiaries<br />
Management’s Discussion and Analysis of Financial Condition and Results of Operation<br />
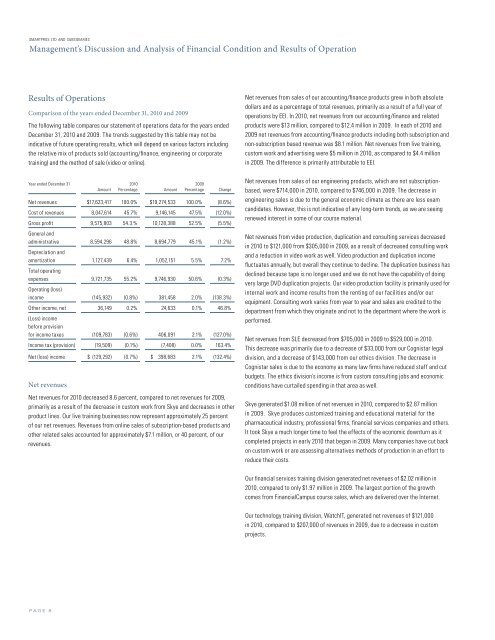
Results of Operations<br />
Comparison of the years ended December 31, <strong>2010</strong> and 2009<br />
The following table compares our statement of operations data for the years ended<br />
December 31, <strong>2010</strong> and 2009. The trends suggested by this table may not be<br />
indicative of future operating results, which will depend on various fac<strong>to</strong>rs including<br />
the relative mix of products sold (accounting/finance, engineering or corporate<br />
training) and the method of sale (video or online).<br />
Net revenues from sales of our accounting/finance products grew in both absolute<br />
dollars and as a percentage of <strong>to</strong>tal revenues, primarily as a result of a full year of<br />
operations by EEI. In <strong>2010</strong>, net revenues from our accounting/finance and related<br />
products were $13 million, compared <strong>to</strong> $12.4 million in 2009. In each of <strong>2010</strong> and<br />
2009 net revenues from accounting/finance products including both subscription and<br />
non-subscription based revenue was $8.1 million. Net revenues from live training,<br />
cus<strong>to</strong>m work and advertising were $5 million in <strong>2010</strong>, as compared <strong>to</strong> $4.4 million<br />
in 2009. The difference is primarily attributable <strong>to</strong> EEI.<br />
Year ended December 31 <strong>2010</strong> 2009<br />
Amount Percentage Amount Percentage Change<br />
Net revenues $17,623,417 100.0% $19,274,533 100.0% (8.6%)<br />
Cost of revenues 8,047,614 45.7% 9,146,145 47.5% (12.0%)<br />
Gross profit 9,575,803 54.3.% 10,128,388 52.5% (5.5%)<br />
General and<br />
administrative 8,594,296 48.8% 8,694,779 45.1% (1.2%)<br />
Depreciation and<br />
amortization 1,127,439 6.4% 1,052,151 5.5% 7.2%<br />
Total operating<br />
expenses 9,721,735 55.2% 9,746,930 50.6% (0.3%)<br />
Operating (loss)<br />
income (145,932) (0.8%) 381,458 2.0% (138.3%)<br />
Other income, net 36,149 0.2% 24,633 0.1% 46.8%<br />
(Loss) income<br />
before provision<br />
for income taxes (109,783) (0.6%) 406,091 2.1% (127.0%)<br />
Income tax (provision) (19,509) (0.1%) (7,408) 0.0% 163.4%<br />
Net (loss) income $ (129,292) (0.7%) $ 398,683 2.1% (132.4%)<br />
Net revenues<br />
Net revenues for <strong>2010</strong> decreased 8.6 percent, compared <strong>to</strong> net revenues for 2009,<br />
primarily as a result of the decrease in cus<strong>to</strong>m work from Skye and decreases in other<br />
product lines. Our live training businesses now represent approximately 25 percent<br />
of our net revenues. Revenues from online sales of subscription-based products and<br />
other related sales accounted for approximately $7.1 million, or 40 percent, of our<br />
revenues.<br />
Net revenues from sales of our engineering products, which are not subscriptionbased,<br />
were $714,000 in <strong>2010</strong>, compared <strong>to</strong> $746,000 in 2009. The decrease in<br />
engineering sales is due <strong>to</strong> the general economic climate as there are less exam<br />
candidates. However, this is not indicative of any long-term trends, as we are seeing<br />
renewed interest in some of our course material.<br />
Net revenues from video production, duplication and consulting services decreased<br />
in <strong>2010</strong> <strong>to</strong> $121,000 from $305,000 in 2009, as a result of decreased consulting work<br />
and a reduction in video work as well. Video production and duplication income<br />
fluctuates annually, but overall they continue <strong>to</strong> decline. The duplication business has<br />
declined because tape is no longer used and we do not have the capability of doing<br />
very large DVD duplication projects. Our video production facility is primarily used for<br />
internal work and income results from the renting of our facilities and/or our<br />
equipment. Consulting work varies from year <strong>to</strong> year and sales are credited <strong>to</strong> the<br />
department from which they originate and not <strong>to</strong> the department where the work is<br />
performed.<br />
Net revenues from SLE decreased from $705,000 in 2009 <strong>to</strong> $529,000 in <strong>2010</strong>.<br />
This decrease was primarily due <strong>to</strong> a decrease of $33,000 from our Cognistar legal<br />
division, and a decrease of $143,000 from our ethics division. The decrease in<br />
Cognistar sales is due <strong>to</strong> the economy as many law firms have reduced staff and cut<br />
budgets. The ethics division’s income is from cus<strong>to</strong>m consulting jobs and economic<br />
conditions have curtailed spending in that area as well.<br />
Skye generated $1.08 million of net revenues in <strong>2010</strong>, compared <strong>to</strong> $2.87 million<br />
in 2009. Skye produces cus<strong>to</strong>mized training and educational material for the<br />
pharmaceutical industry, professional firms, financial services companies and others.<br />
It <strong>to</strong>ok Skye a much longer time <strong>to</strong> feel the effects of the economic downturn as it<br />
completed projects in early <strong>2010</strong> that began in 2009. Many companies have cut back<br />
on cus<strong>to</strong>m work or are assessing alternatives methods of production in an effort <strong>to</strong><br />
reduce their costs.<br />
Our financial services training division generated net revenues of $2.02 million in<br />
<strong>2010</strong>, compared <strong>to</strong> only $1.97 million in 2009. The largest portion of the growth<br />
comes from FinancialCampus course sales, which are delivered over the Internet.<br />
Our technology training division, WatchIT, generated net revenues of $121,000<br />
in <strong>2010</strong>, compared <strong>to</strong> $207,000 of revenues in 2009, due <strong>to</strong> a decrease in cus<strong>to</strong>m<br />
projects.<br />
p a g e 8