M&A - Bloomberg
M&A - Bloomberg
M&A - Bloomberg

Create successful ePaper yourself
Turn your PDF publications into a flip-book with our unique Google optimized e-Paper software.
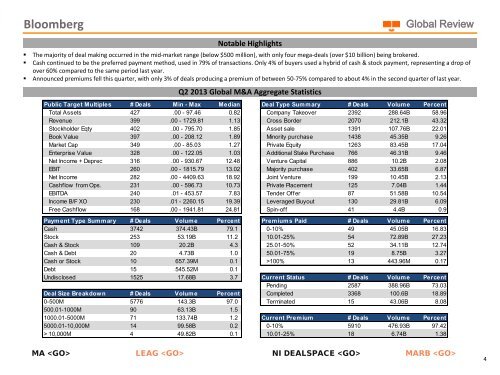
<strong>Bloomberg</strong><br />
Global Review<br />
Notable Highlights<br />
• The majority of deal making occurred in the mid-market range (below $500 million), with only four mega-deals (over $10 billion) being brokered.<br />
• Cash continued to be the preferred payment method, used in 79% of transactions. Only 4% of buyers used a hybrid of cash & stock payment, representing a drop of<br />
over 60% compared to the same period last year.<br />
• Announced premiums fell this quarter, with only 3% of deals producing a premium of between 50-75% compared to about 4% in the second quarter of last year.<br />
Q2 2013 Global M&A Aggregate Statistics<br />
Public Target Multiples # Deals Min - Max Median Deal Type Summary # Deals Volume Percent<br />
Total Assets 427 .00 - 97.46 0.82 Company Takeover 2392 288.64B 58.96<br />
Revenue 399 .00 - 1729.81 1.13 Cross Border 2070 212.1B 43.32<br />
Stockholder Eqty 402 .00 - 795.70 1.85 Asset sale 1391 107.76B 22.01<br />
Book Value 397 .00 - 208.12 1.89 Minority purchase 1438 45.35B 9.26<br />
Market Cap 349 .00 - 85.03 1.27 Private Equity 1263 83.45B 17.04<br />
Enterprise Value 328 .00 - 122.05 1.03 Additional Stake Purchase 766 46.31B 9.46<br />
Net Income + Deprec 316 .00 - 930.67 12.48 Venture Capital 886 10.2B 2.08<br />
EBIT 260 .00 - 1815.79 13.02 Majority purchase 402 33.65B 6.87<br />
Net Income 282 .00 - 4409.63 18.92 Joint Venture 199 10.45B 2.13<br />
Cashflow from Ops. 231 .00 - 596.73 10.73 Private Placement 125 7.04B 1.44<br />
EBITDA 240 .01 - 453.57 7.83 Tender Offer 87 51.58B 10.54<br />
Income B/F XO 230 .01 - 2260.15 19.39 Leveraged Buyout 130 29.81B 6.09<br />
Free Cashflow 168 .00 - 1941.81 24.81 Spin-off 41 4.4B 0.9<br />
Payment Type Summary # Deals Volume Percent Premium s Paid # Deals Volume Percent<br />
Cash 3742 374.43B 79.1 0-10% 49 45.05B 16.83<br />
Stock 253 53.19B 11.2 10.01-25% 54 72.89B 27.23<br />
Cash & Stock 109 20.2B 4.3 25.01-50% 52 34.11B 12.74<br />
Cash & Debt 20 4.73B 1.0 50.01-75% 19 8.75B 3.27<br />
Cash or Stock 10 657.39M 0.1 >100% 13 443.96M 0.17<br />
Debt 15 545.52M 0.1<br />
Undisclosed 1525 17.68B 3.7 Current Status # Deals Volume Percent<br />
Pending 2587 388.96B 73.03<br />
Deal Size Breakdown # Deals Volume Percent Completed 3368 100.6B 18.89<br />
0-500M 5776 143.3B 97.0 Terminated 15 43.06B 8.08<br />
500.01-1000M 90 63.13B 1.5<br />
1000.01-5000M 71 133.74B 1.2 Current Premium # Deals Volume Percent<br />
5000.01-10,000M 14 99.58B 0.2 0-10% 5910 476.93B 97.42<br />
> 10,000M 4 49.82B 0.1 10.01-25% 18 6.74B 1.38<br />
MA LEAG NI DEALSPACE MARB <br />
4