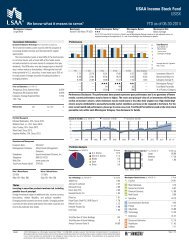
Prospectus - USAA
Prospectus - USAA
Prospectus - USAA

You also want an ePaper? Increase the reach of your titles
YUMPU automatically turns print PDFs into web optimized ePapers that Google loves.
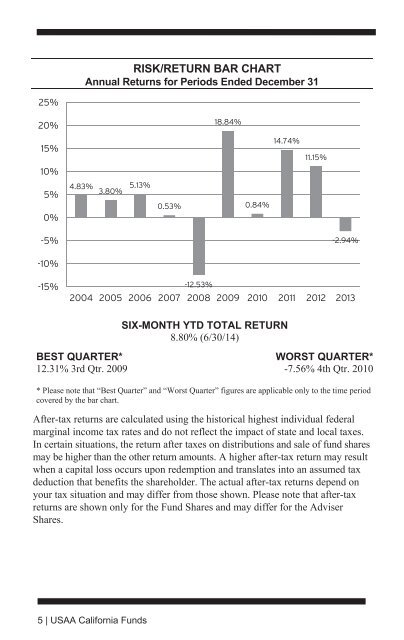
RISK/RETURN BAR CHART<br />
Annual Returns for Periods Ended December 31<br />
25%<br />
20%<br />
18.84%<br />
15%<br />
10%<br />
5%<br />
0%<br />
4.83% 3.80%<br />
5.13%<br />
0.53%<br />
0.84%<br />
14.74%<br />
11.15%<br />
-5%<br />
-2.94%<br />
-10%<br />
-15%<br />
-12.53%<br />
2004 2005 2006 2007 2008 2009 2010 2011 2012 2013<br />
SIX-MONTH YTD TOTAL RETURN<br />
8.80% (6/30/14)<br />
BEST QUARTER*<br />
WORST QUARTER*<br />
12.31% 3rd Qtr. 2009 -7.56% 4th Qtr. 2010<br />
* Please note that “Best Quarter” and “Worst Quarter” figures are applicable only to the time period<br />
covered by the bar chart.<br />
After-tax returns are calculated using the historical highest individual federal<br />
marginal income tax rates and do not reflect the impact of state and local taxes.<br />
In certain situations, the return after taxes on distributions and sale of fund shares<br />
may be higher than the other return amounts. A higher after-tax return may result<br />
when a capital loss occurs upon redemption and translates into an assumed tax<br />
deduction that benefits the shareholder. The actual after-tax returns depend on<br />
your tax situation and may differ from those shown. Please note that after-tax<br />
returns are shown only for the Fund Shares and may differ for the Adviser<br />
Shares.<br />
5 | <strong>USAA</strong> California Funds