East Dunbartonshire - Glasgow Centre for Population Health
East Dunbartonshire - Glasgow Centre for Population Health
East Dunbartonshire - Glasgow Centre for Population Health

You also want an ePaper? Increase the reach of your titles
YUMPU automatically turns print PDFs into web optimized ePapers that Google loves.
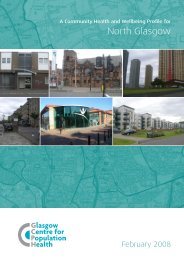
A Community <strong>Health</strong> and Wellbeing Profile <strong>for</strong><br />
<strong>East</strong> <strong>Dunbartonshire</strong><br />
February 2008
Published by<br />
<strong>Glasgow</strong> <strong>Centre</strong> <strong>for</strong> <strong>Population</strong> <strong>Health</strong><br />
Level 6<br />
39 St Vincent Place<br />
<strong>Glasgow</strong><br />
G1 2ER<br />
For further in<strong>for</strong>mation please contact:<br />
Bruce Whyte, <strong>Glasgow</strong> <strong>Centre</strong> <strong>for</strong> <strong>Population</strong> <strong>Health</strong><br />
Tel: 0141 221 9439<br />
Email: bruce.whyte@drs.glasgow.gov.uk<br />
Web: www.gcph.co.uk/communityprofiles
Contents<br />
Introduction 1<br />
Purpose 1<br />
Geographical coverage 2<br />
Content 2<br />
Notes and caveats 4<br />
Local action to improve health and reduce inequalities 5<br />
Evaluation 5<br />
Acknowledgements 5<br />
Web 6<br />
Interpretation 6<br />
Maps 9<br />
Community <strong>Health</strong> Partnership Area Map 11<br />
Greenspace Map 13<br />
Air Quality Map 15<br />
Trend and Spine Graphs 17<br />
Definitions and Sources 77<br />
A Community <strong>Health</strong> and Wellbeing Profile <strong>for</strong> <strong>East</strong> <strong>Dunbartonshire</strong>
Introduction<br />
This profile is one of ten new community health and wellbeing profiles that have been compiled<br />
by the <strong>Glasgow</strong> <strong>Centre</strong> <strong>for</strong> <strong>Population</strong> <strong>Health</strong> (GCPH) <strong>for</strong> the Greater <strong>Glasgow</strong> and Clyde NHS Board<br />
area. Each profile provides indicators <strong>for</strong> a range of health outcomes (e.g. life expectancy, mortality,<br />
hospitalisation) and health determinants (e.g. smoking levels, breastfeeding, income, employment,<br />
crime, education).<br />
These profiles build on the success of both the 2004 community health profiles published by NHS<br />
<strong>Health</strong> Scotland (www.scotpho.org.uk/communityprofiles), and of the ‘Let <strong>Glasgow</strong> Flourish’ report<br />
published by GCPH in April 2006 (www.gcph.co.uk/content/view/17/34/). Whilst these sources<br />
continue to be useful, there has been recognition of the need <strong>for</strong> more up-to-date health data<br />
and <strong>for</strong> in<strong>for</strong>mation pertaining to the new Community <strong>Health</strong> (and Care) Partnership (CH(C)P)<br />
administrative structures.<br />
It is also worth noting that ISD Scotland plans to publish similar profiles <strong>for</strong> CH(C)Ps in the rest of<br />
Scotland later in 2008, and that staff in NHS <strong>Health</strong> Scotland are working on children’s health profiles,<br />
which are also to be published later in the year.<br />
Bearsden Cross<br />
Purpose<br />
This community health and wellbeing profile is intended to in<strong>for</strong>m service providers, planners, policy<br />
makers and the public about public health issues, both locally and at national level. Specifically, we<br />
have designed each profile to:<br />
<br />
<br />
<br />
<br />
<br />
provide organisations and communities with up-to-date and locally-relevant public health<br />
intelligence;<br />
highlight health and social inequalities;<br />
show trends in key indicators;<br />
Auchinairn - playpark<br />
provide local level in<strong>for</strong>mation to aid priority-setting and the targeting of resources; and<br />
develop knowledge of the complex nature of health and its determinants.<br />
While the profile in<strong>for</strong>mation may prove valuable <strong>for</strong> a variety of planning processes, it is not the<br />
intention that these data are seen as part of any <strong>for</strong>mal per<strong>for</strong>mance monitoring system. Rather,<br />
we hope this type of health intelligence will help in<strong>for</strong>m planning priorities and illuminate emergent<br />
issues.<br />
A Community <strong>Health</strong> and Wellbeing Profile <strong>for</strong> <strong>East</strong> <strong>Dunbartonshire</strong>
Geographical coverage<br />
Each profile covers a Community <strong>Health</strong> (and Care) Partnership area within NHS Greater <strong>Glasgow</strong><br />
and Clyde. <strong>Health</strong> indicators are presented <strong>for</strong> the overall ‘community’ but also <strong>for</strong> smaller areas<br />
within each CH(C)P. In <strong>Glasgow</strong> City, these smaller areas are ‘neighbourhood’ localities, while outside<br />
<strong>Glasgow</strong> – in the rest of the Greater <strong>Glasgow</strong> and Clyde area – intermediate zone geographies are<br />
used . These localities were chosen through consultation and enable geographical inequalities in<br />
social circumstances and health within each CH(C)P area to be investigated.<br />
Table 1 describes the intermediate zones within the <strong>East</strong> <strong>Dunbartonshire</strong> community and their<br />
populations.<br />
Table 1: Intermediate zones within the <strong>East</strong> <strong>Dunbartonshire</strong> community and their populations<br />
Neighbourhood <strong>Population</strong> (2006)<br />
Auchinairn 4,922<br />
Barloch 3,084<br />
Bishopbriggs North and Kenmure 5,658<br />
Bishopbriggs West and Cadder 5,703<br />
<strong>East</strong> Clober and Mains Estate 3,489<br />
Harestanes 3,410<br />
Hillhead 3,972<br />
Kessington <strong>East</strong> 2,852<br />
Kessington West 3,222<br />
Keystone and Dougalston 3,957<br />
Kilmardinny <strong>East</strong> 2,833<br />
Kilmardinny West 3,443<br />
Kirkintilloch South 3,126<br />
Kirkintilloch West 3,918<br />
Lennoxtown 4,376<br />
Lenzie North 5,738<br />
Lenzie South 3,545<br />
Milton of Campsie 4,015<br />
North Castlehill and Thorn 4,539<br />
Rosebank and Waterside 3,340<br />
South Castlehill and Thorn 4,328<br />
Torrance and Balmore 2,943<br />
Twechar and Harestanes <strong>East</strong> 2,994<br />
West Clober and Mains Estate 3,037<br />
Westerton <strong>East</strong> 3,217<br />
Westerton West 2,729<br />
Woodhill <strong>East</strong> 2,567<br />
Woodhill West 4,503<br />
Content<br />
Each community profile comprises a series of maps, together with trend and ‘spine’ graphs of health<br />
indicators <strong>for</strong> each neighbourhood/intermediate zone in a community and <strong>for</strong> the community as a<br />
whole. The indicators used are similar to those used in the 2004 profiles, although many of those<br />
used previously have new and slightly different definitions, and thus are not directly comparable<br />
with the previous profiles. A number of new indicators have also been included. Please refer to the<br />
notes pages <strong>for</strong> detailed in<strong>for</strong>mation about all the indicators used in this profile.<br />
<br />
<br />
<br />
There are 55 ‘neighbourhood’ areas (as defined <strong>for</strong> Housing Forums) within <strong>Glasgow</strong> City, ranging in population size from 1,400 to<br />
19,500.<br />
The intermediate zones are aggregations of data zones within local authorities and contain between 2,500 and 6,000 people.<br />
For both neighbourhoods and intermediate zones, and <strong>for</strong> CH(C)Ps, data can be built up by aggregating from data zone level. More<br />
in<strong>for</strong>mation on data zones can be obtained at www.scotland.gov.uk/Publications/2004/02/18917/33243.
Maps<br />
There are three or four maps included in each profile, depending on the community covered:<br />
<br />
a large map of the whole community, showing the locations of GP practices, Social Work offices and<br />
hospitals, and the boundaries (and names) of the neighbourhood/intermediate zones within;<br />
a map of urban greenspace;<br />
smaller maps showing PM10 and NO2 concentrations in the Greater <strong>Glasgow</strong> and Clyde area;<br />
and<br />
a fuel poverty map (only <strong>for</strong> <strong>Glasgow</strong> CHCPs).<br />
Graphs<br />
The trend graphs show trends over time <strong>for</strong> the following indicators:<br />
male life expectancy;<br />
female life expectancy;<br />
population age groups;<br />
worklessness;<br />
breastfeeding; and<br />
rates of hospital admissions <strong>for</strong> alcohol related and attributable conditions, heart disease and<br />
medical emergencies.<br />
The spine graphs show how an area compares to Scotland on a range of indicators covering the<br />
following broad domains:<br />
population demographics;<br />
mortality;<br />
drugs, alcohol and smoking;<br />
hospitalisation and injury;<br />
mental health and function;<br />
Social Work;<br />
prosperity/poverty;<br />
education;<br />
crime;<br />
housing and transport; and<br />
child and maternal health.<br />
For each of the 67 indicators included within these domains the percentage difference from the<br />
Scottish figure is displayed graphically, alongside the value of the indicator itself shown both as<br />
a number (e.g. a population of 19,982 children) and as a percentage or rate (e.g. children as a<br />
percentage of the total population). A summary table with definitions and sources of each indicator<br />
used is provided at the end of the profile. More detailed notes accompany excel workbooks <strong>for</strong> each<br />
indicator, which are available on-line at www.gcph.co.uk/communityprofiles.<br />
<br />
<br />
PM10: particles in ambient air smaller than 10 micrometres across; NO2: Nitrogen Dioxide.<br />
For some indicators, where national in<strong>for</strong>mation is not available, the comparator used is not Scotland but Greater <strong>Glasgow</strong> and Clyde<br />
or <strong>Glasgow</strong> City. This is marked on a column adjacent to the graph e.g. G <strong>for</strong> <strong>Glasgow</strong> City, etc.<br />
A Community <strong>Health</strong> and Wellbeing Profile <strong>for</strong> <strong>East</strong> <strong>Dunbartonshire</strong>
Bearsden - Rannoch Drive Milngavie - West Highland Way Lenzie<br />
Notes and caveats<br />
We would ask the reader to consider the following points when using this profile:<br />
<br />
<br />
<br />
<br />
<br />
<br />
<br />
<br />
Some rates are based on small numbers, particularly in areas with small populations. Large<br />
above/below average percentages <strong>for</strong> these variables should be interpreted with caution and<br />
knowledge of local circumstances should be applied to aid interpretation.<br />
In the main, annualised figures and rates are shown. However, where necessary, an indicator<br />
may have been based on more than one year of data to provide more robust figures <strong>for</strong> small<br />
areas. The notes box at the bottom of each spine chart provides further explanation in relation<br />
to specific indicators.<br />
To avoid disclosure of personal in<strong>for</strong>mation we have in some instances suppressed figures<br />
representing less than five cases but not zero (e.g. between one and four), although in most<br />
instances we have shown a rate <strong>for</strong> the same indicator if this is a standardised rate. Thereby,<br />
the original number of cases cannot be derived.<br />
Some of the variations seen may be due to the structure of the population within an area.<br />
Please refer to the top three population indicators in a spine graph <strong>for</strong> an area to compare the<br />
age structure of each local population with the national average.<br />
Variations in recording/coding practice and proximity to services, particularly in relation to<br />
hospital admissions, may account <strong>for</strong> some of the differences in rates observed between<br />
different areas.<br />
Our approach has been to use, in the first instance, nationally available, comparable data<br />
within each profile. However, in addition, we have included other relevant in<strong>for</strong>mation from<br />
local sources (e.g. some of the crime figures, Social Work clients, and small area household<br />
estimates). Despite this there are still significant ‘data gaps’, where data sources are either not<br />
sufficiently accurate or data are not recorded in enough geographic detail to be shown at a<br />
small area level (e.g. homelessness, physical activity, and obesity).<br />
The indicators used cover different periods (the chart axis labels and notes pages will provide<br />
details) and we have derived several indicators from the 2001 Census if suitable and more upto-date<br />
measures were not available and the indicator was felt to be of sufficient importance<br />
(e.g. percentage of population from a minority ethnic group).<br />
It should be noted that the indicators used in the profile are summary indicators. More detailed<br />
analysis of each would be possible, <strong>for</strong> example producing breakdowns by gender or age or<br />
examining trends. If you wish to analyse particular themes in more detail please contact GCPH<br />
directly by emailing gcphmail@drs.glasgow.gov.uk or telephoning 0141 221 9439.<br />
Finally, any factual inaccuracy in the in<strong>for</strong>mation presented in this profile is the sole responsibility<br />
of GCPH.
Local action to improve health and reduce health inequalities<br />
We have not attempted to describe the range of policies, priorities, services and local health<br />
improvement initiatives that are relevant to each community. Rather, the intention behind publishing<br />
these profiles is to generate a debate on local priorities, currently and <strong>for</strong> the future, and on the<br />
directing of resources towards areas of greatest need. The content of each profile is there<strong>for</strong>e<br />
limited to the presentation and interpretation of key health indicators and trends. ‘A Call to Debate:<br />
a Call to Action’, the 2007/2008 Director of Public <strong>Health</strong> report (www.nhsggc.org.uk/content/<br />
default.asp?page=s1009) was however designed to be a response to Greater <strong>Glasgow</strong> and Clyde’s<br />
well-known health problems, and does highlight a range of health improvement actions currently<br />
in place across NHS Greater <strong>Glasgow</strong> and Clyde.<br />
Evaluation<br />
We plan to disseminate the in<strong>for</strong>mation in each profile widely using a range of approaches including<br />
distribution of the paper-based profiles, provision of additional in<strong>for</strong>mation on our website, and<br />
through a series of presentations and workshops. As part of this process we intend to evaluate their<br />
impact, utility and effectiveness and will seek to find out to what extent the profiles have fulfilled<br />
their purpose. This will help us to improve and develop this type of resource in the future.<br />
Acknowledgements<br />
While GCPH has designed and created these reports, the compilation of data would not have been<br />
possible without the help of many colleagues within a range of other organisations. In particular we<br />
would like to acknowledge the significant contributions of staff from ISD Scotland, particularly the<br />
ScotPHO team, and from NHS Greater <strong>Glasgow</strong> and Clyde.<br />
We do not have the space to mention individually everyone who has helped but we would especially<br />
like to thank: Rosalia Munoz-Arroyo (ISD ScotPHO team) <strong>for</strong> coordinating the provision of much of the<br />
NHS data; Annette Little (NHS Greater <strong>Glasgow</strong> and Clyde) <strong>for</strong> providing Census data and checking<br />
many of the indicator datasets; Paula Barton, (NHS Greater <strong>Glasgow</strong> and Clyde) <strong>for</strong> providing a<br />
range of maps <strong>for</strong> the profiles; and Iain MacDonald (<strong>Glasgow</strong> and Clyde Valley (GCV) Structure Plan<br />
Team) <strong>for</strong> creating the Greenspace maps.<br />
Many organisations have contributed data and advice during this work. We would particularly like to<br />
acknowledge the contribution of the following: ISD Scotland, especially the ScotPHO team; the General<br />
Register Office <strong>for</strong> Scotland; COSLA Strategic Migration Partnership; DRS, <strong>Glasgow</strong> City Council; the<br />
Violence Reduction Unit and Community Safety, Strathclyde Police; Scottish Neighbourhood Statistics;<br />
Pupil, Teacher and School Statistics, Scottish Government; the Analytical Services Department of<br />
the Department of Work and Pensions (DWP); the Office <strong>for</strong> National Statistics (ONS); the Lord<br />
Chancellor’s Department; Professor Graham Moon and colleagues at the University of Portsmouth;<br />
Judith Brown, University of <strong>Glasgow</strong>; Susanne Jeffrey, PEACH Unit; Social Work contacts from each<br />
local council.<br />
We would also like to thank Fiona McGuire and <strong>East</strong> <strong>Dunbartonshire</strong> Council <strong>for</strong> the pictures included<br />
in this profile.<br />
A Community <strong>Health</strong> and Wellbeing Profile <strong>for</strong> <strong>East</strong> <strong>Dunbartonshire</strong>
Web<br />
This profile and those <strong>for</strong> the other nine communities are available to download as PDF files,<br />
and as Excel spreadsheets (<strong>for</strong> specific indicators), on the GCPH website at www.gcph.co.uk/<br />
communityprofiles.<br />
Interpretation<br />
The following brief overview is intended to provide a flavour of what the profile indicators tell us.<br />
While we draw on many of the indicators in the report, this is a partial and selective summary.<br />
Please note that the figures quoted below are generally approximations of the more exact figures<br />
presented in the graphs and tables e.g. the populations quoted are rounded into thousands and<br />
the exact period that each indicator covers is not given, but can be found in the notes. Where a<br />
comparison to a ‘national average’ is quoted this means to the Scottish average.<br />
<strong>East</strong> <strong>Dunbartonshire</strong><br />
<strong>Population</strong><br />
<strong>East</strong> <strong>Dunbartonshire</strong> has a population of approximately 105,000 people, of whom 19% are children,<br />
63% are young and middle-aged adults and over 17% are older people. There has been a fall of<br />
over 3,800 in the size of the overall population in the last ten years. However there have been<br />
different trends in different age bands: the number of children has fallen by nearly 3,000 and the<br />
number of young adults (16-44) by over 6,000; in contrast the number of middle-aged adults and<br />
older people has risen collectively by over 5,400. The proportion of the population from a minority<br />
ethnic community (3.1%) is above the Scottish average. There were over 922 live births in 2006.<br />
Life expectancy and mortality<br />
For men, life expectancy (at birth) is estimated to be 77.4 years, 3.5 years higher than the Scottish<br />
average, and has risen by 2.4 years in the period 1994-98 to 2001-05. Female life expectancy (80.9<br />
years) has risen by 1.6 years in the same period and is approximately 1.8 years higher than the<br />
Scottish average. Comparing different areas of the community, there is a gap in life expectancy<br />
across the neighbourhoods of 15 years <strong>for</strong> men and over 12 years <strong>for</strong> women.<br />
All-cause mortality and mortality rates from cancer, coronary heart disease and cerebrovascular<br />
disease (in the under 75s) are all below the Scottish average and have all fallen considerably in<br />
recent years.<br />
Behaviour<br />
Over 650 patients are admitted to hospital annually <strong>for</strong> alcohol related or attributable causes and<br />
there have been over 100 deaths due to alcohol in the last five years. An estimated 16,000<br />
adults smoke: 19%, compared to 27% nationally. There have been 32 drug related deaths in <strong>East</strong><br />
<strong>Dunbartonshire</strong> over the last ten years.
Hospitalisation/Social Work<br />
Approximately 560 new cancer cases are registered annually and nearly 850 heart disease patients<br />
are admitted to hospital each year. There are approximately 5,800 patients admitted as a medical<br />
emergency annually. There are over 5,400 Social Work clients, 670 of whom are children and over<br />
2,400 of whom are older people.<br />
Mental health and function<br />
There were 65 suicides in the period 2001-2005 and there are nearly 200 new in-patient admissions<br />
to psychiatric specialties annually.<br />
Prosperity/poverty<br />
Over 7,800 people, 7.4% of the population, are defined to be income deprived and 5,250 adults,<br />
8.2% of the working age population, are employment deprived . There are over 2,700 workplaces,<br />
employing over 25,000 people. House price sale values in 2006 were approximately 30% above<br />
the national average.<br />
Crime<br />
In recent years on average 80 serious assaults have been recorded in the area annually, as well<br />
as over 300 domestic abuse incidents and around 60 assault episodes (<strong>for</strong> residents) requiring<br />
overnight hospital treatment.<br />
Child and maternal health<br />
Compared to 24% nationally, 16% of women smoke during pregnancy, and 47% of mothers breast<br />
feed at six to eight weeks following birth (36% nationally). Primary immunisation rates are close<br />
to or slightly above the Scottish average. The rate of low birth-weight babies is 21% below the<br />
Scottish average, while the teenage pregnancy rate (under 18) is 34% below the national average.<br />
Over 170 children are admitted to hospital <strong>for</strong> dental conditions annually.<br />
<br />
The definitions of ‘income deprived’ and ‘employment deprived’ are those applied in the 2006 Scottish Index of Multiple Deprivation<br />
- www.scotland.gov.uk/simd.<br />
A Community <strong>Health</strong> and Wellbeing Profile <strong>for</strong> <strong>East</strong> <strong>Dunbartonshire</strong>
Maps<br />
A Community <strong>Health</strong> and Wellbeing Profile <strong>for</strong> <strong>East</strong> <strong>Dunbartonshire</strong>
Community <strong>Health</strong> Partnership Area Map<br />
<strong>East</strong> <strong>Dunbartonshire</strong><br />
11
Greenspace Map<br />
<strong>East</strong> <strong>Dunbartonshire</strong><br />
NB Any large areas of ‘white’ on the map overleaf<br />
indicate areas not currently mapped <strong>for</strong> greenspace.<br />
13
Bearsden/Milngavie<br />
Compiled from the <strong>Glasgow</strong> and Clyde Valley (GCV) Urban Greenspace Mapping Dataset provided by the GCV Structure Plan Joint Committee. This map is based upon Ordnance Survey material with the permission of Ordnance Survey on behalf of the Controller of Crown Copyright.<br />
© Her Majesty’s Stationery Office, Unauthorised reproduction infringes Crown copyright and may lead to prosecution or civil proceedings. <strong>Glasgow</strong> City Council, 100023379, 2007.
Air Quality Maps of Greater <strong>Glasgow</strong> and Clyde<br />
<strong>East</strong> <strong>Dunbartonshire</strong><br />
Estimated annual mean background PM10 concentration (2002-2004)<br />
Estimated annual mean background NO 2<br />
concentration (2002-2004)<br />
15
Trend and Spine Graphs<br />
A Community <strong>Health</strong> and Wellbeing Profile <strong>for</strong> <strong>East</strong> <strong>Dunbartonshire</strong> 17
<strong>East</strong> <strong>Dunbartonshire</strong> CHP<br />
Key: <strong>East</strong> <strong>Dunbartonshire</strong> CHP 95% Confidence Intervals Scotland<br />
100<br />
Male Life Expectancy<br />
100<br />
Female Life Expectancy<br />
Life expectancy at birth (in years)<br />
95<br />
90<br />
85<br />
80<br />
75<br />
70<br />
65<br />
60<br />
75.0<br />
77.4<br />
Life expectancy at birth (in years)<br />
95<br />
90<br />
85<br />
80<br />
75<br />
70<br />
65<br />
60<br />
79.3<br />
80.9<br />
55<br />
1994-1998 1996-2000 1999-2003 2001-2005<br />
55<br />
1994-1998 1996-2000 1999-2003 2001-2005<br />
45000<br />
40000<br />
35000<br />
30000<br />
25000<br />
20000<br />
15000<br />
10000<br />
5000<br />
0<br />
<strong>Population</strong> by Age Group<br />
0 - 15 years 16 - 44 years<br />
45 - 64 years 65 years and over<br />
1996 1997 1998 1999 2000 2001 2002 2003 2004 2005 2006<br />
36,833<br />
30,143<br />
19,982<br />
18,502<br />
% workless of working age population<br />
50%<br />
45%<br />
40%<br />
35%<br />
30%<br />
25%<br />
20%<br />
15%<br />
10%<br />
5%<br />
0%<br />
Worklessness<br />
11.1%<br />
8.9%<br />
1999 2000 2001 2002 2003 2004 2005 2006<br />
% of mothers breastfeeding at 6/8 weeks<br />
60<br />
50<br />
40<br />
30<br />
20<br />
10<br />
0<br />
Breast Feeding<br />
45.8<br />
46.8<br />
97-99 98-00 99-01 00-02 01-03 02-04 03-05 04-06<br />
Age/sex standardised rate per 100,000<br />
pop<br />
Hospital Patients with Alcohol Attributable & Related<br />
Conditions<br />
1800<br />
1600<br />
1400<br />
1200<br />
1000<br />
800<br />
600<br />
400<br />
200<br />
0<br />
587<br />
97-99 98-00 99-01 00-02 01-03 02-04 03-05 04-06<br />
522<br />
Age/sex standardised rate per 100,000 pop<br />
1400<br />
1200<br />
1000<br />
800<br />
600<br />
400<br />
200<br />
0<br />
Heart Disease Hospital Patients<br />
865<br />
589<br />
96-98 97-99 98-00 99-01 00-02 01-03 02-04 03-05 04-06<br />
Age/sex standardised rate per 100,000 pop<br />
10000<br />
9000<br />
8000<br />
7000<br />
6000<br />
5000<br />
4000<br />
3000<br />
2000<br />
1000<br />
0<br />
Emergency Medical Admission Patients<br />
5324<br />
4670<br />
96-98 97-99 98-00 99-01 00-02 01-03 02-04 03-05 04-06<br />
NB PLEASE NOTE THAT IN SOME CASES RATES/PERCENTAGES MAY BE BASED ON SMALL NUMBERS.<br />
18
Mortality <strong>Population</strong> Demographics<br />
Drugs,<br />
Alcohol and<br />
Smoking<br />
Hospitalisation & Injury<br />
Mental <strong>Health</strong> &<br />
Function<br />
Social<br />
Work<br />
Prosperity - Poverty<br />
Education<br />
Crime<br />
Housing &<br />
Transport<br />
Child & Maternal <strong>Health</strong><br />
Indicator<br />
<strong>East</strong> <strong>Dunbartonshire</strong> CHP<br />
Number<br />
Measure<br />
(Below) Scottish Average (%) 1 (Above)<br />
-70 -60 -50 -40 -30 -20 -10 0 +10 +20 +30 +40 +50 +60 +70<br />
Child population (aged 0-15) 19,982 18.9 % +5<br />
Adult population (aged 16-64) 66,976 63.5 % -3<br />
Elderly population (aged 65+) 18,502 17.5 % +7<br />
Minority ethnic groups 3,350 3.1 % +54 2001 2<br />
Asylum Seekers n/a n/a % G 2007 3<br />
Life expectancy - males - 77.4 yrs +5<br />
Life expectancy - females - 80.9 yrs +2<br />
01-05 4<br />
Live births 922 0.9 cr -19 2006 5<br />
Households - Single adults n/a n/a % G<br />
Single parents n/a n/a %* G<br />
2005 6<br />
Deaths all ages (5 yrs) 2 4,887 636.7 sr -19<br />
Coronary heart disease deaths in under 75s (5 yrs) 2 282 45.0 sr -41<br />
Cancer deaths in under 75s (5 yrs) 2 785 126.7 sr -14<br />
01-05 7<br />
Cerebrovascular disease deaths in under 75s (5 yrs) 2 120 18.5 sr -24<br />
Alcohol related and attributable hospital patients 3 655 521.6 sr -30 04-06 8<br />
Alcohol related deaths (5 yrs) 2 105 16.9 sr -38 01-05 9<br />
Estimated smokers (16+) 16,059 18.6 % -32 03-04 10<br />
Drug related hospital patients 3 26 31.8 sr -59 04-06 11<br />
Drug related deaths (10 yrs) 4 32 29.6 cr2 -53 97-06 12<br />
Patients registered with cancer 3 559 404.2 sr -4 02-04 13<br />
Heart disease patients 3 853 588.9 sr -17<br />
Cerebrovascular disease patients 3 237 150.6 sr -20<br />
Emergency medical admission patients 3 5,798 4,670.4 sr -25 04-06 14<br />
Multiple admission patients 3 1,118 820.7 sr -33<br />
Unintentional Injury patients 3 861 739.7 sr -27<br />
Patients prescribed statins 23,385 20.8 % +14 2006 15<br />
Road accident casualties - adults 3 235 2.7 cr3 -32 01-04 16<br />
Assault discharges 3 61 0.6 cr3 -45 04-06 17<br />
Suicide (5 yrs) 2 65 12.1 sr -23 01-05 18<br />
Self assessed health (classified as "Not Good") 8,686 8.0 % -21 2001 19<br />
First hospital admission - psychiatric 3 198 173.5 sr -32 02-04 20<br />
Patients prescribed drugs <strong>for</strong> anxiety /depression 8,693 7.7 % -4 2006 21<br />
Incapacity Benefit & SDA Claimants 3,905 6.1 % -37 2007 22<br />
Long-term limiting illness 17,938 16.6 % -18 2001 23<br />
Clients aged 0-15 670 3.4 % G* -54<br />
Clients aged 16-64 2,312 3.5 % G* -23 2007 24<br />
Clients aged 65+ 2,445 13.2 % G* -26<br />
'Income deprivedʼ 7,819 7.4 % -47 2006 25<br />
ʻEmployment deprivedʼ 5,249 8.2 % -36 2006 26<br />
Workless 5,765 8.9 % -39 2006 27<br />
JSA - Unemployment 1,095 1.7 % -39 2007 28<br />
Households without access to car/van 8,723 20.7 % -40 2001 29<br />
Children in workless households 2,192 8.7 % -53 2001 30<br />
Social grade E - benefit, unemployed, lowest grade work 13,576 16.0 % -29 2001 31<br />
Workplaces 2,738 42.7 cr3 -21 2005 32<br />
Employees 5 25,000 39.0 cr -48 2005 33<br />
Primary school attendance - 96.4 % +1 05/06 34<br />
S4 Pupils with 5+ GCSE equivalents 1,009 75.0 % +30 05/06 35<br />
Adults without qualifications 19,170 24.2 % -27 2001 36<br />
Serious violent crime 3 81 7.6 cr4 -48 04-06 37<br />
Domestic abuse incidents 3 316 29.8 cr4 -65 04-06 38<br />
Vandalism 3 1,831 172.8 cr4 G GC -36 04-06 39<br />
Drug Offenders 3 350 33.0 cr4 G GC -67 04-06 40<br />
Housing type - tenements n/a n/a % G 2006 41<br />
House prices - 175,751 £ +31 2006 42<br />
Housing tenure - Owner Occupiers n/a n/a % G 2007 43<br />
Overcrowding 3,287 7.8 % -34 2001 44<br />
Travelling to work by foot/bike or public transport 27,228 39.3 % -12 2001 45<br />
Smoking during pregnancy (3 yrs) 2 452 16.4 % -33 02-04 46<br />
Breastfeeding (at 6 - 8 week review) 412 46.8 % +28 04-06 47<br />
Low birth-weight babies (3 yrs) 2 49 1.9 % -21 02-04 48<br />
Infant Deaths (5 yrs) 2 26 5.5 cr5 +6 01-05 49<br />
Immunisation uptake at 24 mths - MMR - 89.9 % 0<br />
- all excl. MMR - 97.8 % +2<br />
04-06 50<br />
Dental hospital admissions <strong>for</strong> children 3 177 0.9 cr -24 03-06 51<br />
Teenage pregnancy - under 18 years (3 yrs) 2 174 26.7 cr3 -34 02-04 52<br />
Road accident casualties - children 3 46 2.2 cr3 -23 01-04 16<br />
-70 -60 -50 -40 -30 -20 -10 0 +10 +20 +30 +40 +50 +60 +70<br />
-<br />
+<br />
Time<br />
Period<br />
2006<br />
Defn<br />
1<br />
Notes<br />
Key<br />
1. The graph shows the "measure" (e.g. crude rate, percentage, years of life) expressed as a percentage below or above the Scottish measure, but using a range from a minimum of -70% to a<br />
maximum of +70% only. The actual plus/minus percentage value is shown in bold to the right of the graph. This is calculated as the area 'measure' minus the Scottish measure, divided by Scottish<br />
measure and multiplied by 100.<br />
2. Numbers presented over a period of years (e.g. 5 years <strong>for</strong> mortality) but rates are annual average rates.<br />
3. Average annual numbers and rates. 4. Numbers and rates presented over a period of years (e.g. 10 years <strong>for</strong> drug deaths).<br />
5. Employee numbers based on location of business, not residence area of employees.<br />
cr - crude rate per 100 population; cr2 - crude rate per 100,000 population; cr3 - crude rate per 1,000 resident population; cr4 - crude rate per 10,000 resident population; cr5 - crude rate per 1,000<br />
live births; sr - age-sex standardised rate per 100,000 population; yrs - years; %* - single parent households as % of households with children. Defn - see table of definitions & sources<br />
The 6th column of the spine chart indicates where an indicator is not compared to the Scottish average but with a local alternative: G - <strong>Glasgow</strong> City average; G* - average of <strong>Glasgow</strong>, E & W<br />
<strong>Dunbartonshire</strong>, Renfrewshire & <strong>East</strong> Renfrewshire; GGC - Greater <strong>Glasgow</strong> and Clyde (excluding Lanarkshire parts); shading on an indicator bar also indicates where a 'local' comparator is<br />
used.<br />
n/a: data not available (usually due to lack of coverage) or cannot be calculated. In addition, <strong>for</strong> particular indicators where the number of cases is below five and not zero, the range is shown i.e.<br />
'1-4'. NB If the number of teenage pregnancies is in the range '1-4' the rate is suppressed to avoid possible disclosure.<br />
A Community <strong>Health</strong> and Wellbeing Profile <strong>for</strong> <strong>East</strong> <strong>Dunbartonshire</strong> 19
Auchinairn<br />
Key: Auchinairn 95% Confidence Intervals Scotland<br />
100<br />
Male Life Expectancy<br />
100<br />
Female Life Expectancy<br />
95<br />
95<br />
Life expectancy in years<br />
90<br />
85<br />
80<br />
75<br />
70<br />
65<br />
72.4 72.7<br />
Life expectancy in years<br />
90<br />
85<br />
80<br />
75<br />
70<br />
65<br />
76.0<br />
77.8<br />
60<br />
60<br />
55<br />
1994-1998 1996-2000 1999-2003 2001-2005<br />
55<br />
1994-1998 1996-2000 1999-2003 2001-2005<br />
3000<br />
2500<br />
2000<br />
1500<br />
1000<br />
500<br />
0<br />
<strong>Population</strong> by Age Group<br />
0 - 15 years 16 - 44 years<br />
45 - 64 years 65 years and over<br />
1996 1997 1998 1999 2000 2001 2002 2003 2004 2005 2006<br />
2062<br />
1120<br />
1003<br />
737<br />
% workless of working age population<br />
35%<br />
30%<br />
25%<br />
20%<br />
15%<br />
10%<br />
5%<br />
0%<br />
Worklessness<br />
23.1%<br />
16.7%<br />
1999 2000 2001 2002 2003 2004 2005 2006<br />
% of mothers breastfeeding at 6/8 weeks<br />
85<br />
80<br />
75<br />
70<br />
65<br />
60<br />
55<br />
50<br />
45<br />
40<br />
35<br />
30<br />
25<br />
20<br />
15<br />
10<br />
5<br />
0<br />
Breast Feeding<br />
34.3<br />
25.6<br />
97-99 98-00 99-01 00-02 01-03 02-04 03-05 04-06<br />
Age/sex standardised rate per 100,000 pop<br />
1800<br />
1600<br />
1400<br />
1200<br />
1000<br />
800<br />
600<br />
400<br />
200<br />
0<br />
Hospital Patients with Alcohol Attributable &<br />
Related Conditions<br />
1105<br />
97-99 98-00 99-01 00-02 01-03 02-04 03-05 04-06<br />
971<br />
Age/sex standardised rate per 100,000 pop<br />
1600<br />
1400<br />
1200<br />
1000<br />
800<br />
600<br />
400<br />
200<br />
0<br />
Heart Disease Hospital Patients<br />
1093<br />
716<br />
96-98 97-99 98-00 99-01 00-02 01-03 02-04 03-05 04-06<br />
Age/sex standardised rate per 100,000 pop<br />
10000<br />
9000<br />
8000<br />
7000<br />
6000<br />
5000<br />
4000<br />
3000<br />
2000<br />
1000<br />
0<br />
Emergency Medical Admission Patients<br />
7475<br />
6359<br />
96-98 97-99 98-00 99-01 00-02 01-03 02-04 03-05 04-06<br />
NB PLEASE NOTE THAT IN SOME CASES RATES/PERCENTAGES MAY BE BASED ON SMALL NUMBERS.<br />
20
<strong>Population</strong> Demographics<br />
Mortality<br />
Drugs,<br />
Alcohol and<br />
Smoking<br />
Social<br />
Crime Prosperity - Poverty<br />
Hospitalisation & Injury<br />
Mental <strong>Health</strong> &<br />
Function<br />
Work<br />
Education<br />
Housing &<br />
Transport<br />
Child & Maternal<br />
<strong>Health</strong><br />
Indicator<br />
Number<br />
Auchinairn<br />
Measure<br />
-70 -60 -50 -40 -30 -20 -10 0 +10+20 +30 +40 +50 +60 +70<br />
Child population (aged 0-15) 1,003 20.4 % +13<br />
Adult population (aged 16-64) 3,182 64.6 % -1<br />
Elderly population (aged 65+) 737 15.0 % -9<br />
Minority ethnic groups 117 2.6 % +30 2001 2<br />
Asylum Seekers n/a n/a % G 2007 3<br />
Life expectancy - males - 72.7 yrs -2<br />
Life expectancy - females - 77.8 yrs -2<br />
01-05 4<br />
Live births 53 1.1 cr -1 2006 5<br />
Households - Single adults n/a n/a % G<br />
Single parents n/a n/a %* G<br />
2005 6<br />
Deaths all ages (5 yrs) 2 313 970.5 sr +23<br />
Coronary heart disease deaths in under 75s (5 yrs) 2 16 74.4 sr -3<br />
Cancer deaths in under 75s (5 yrs) 2 39 166.0 sr +13<br />
01-05 7<br />
Cerebrovascular disease deaths in under 75s (5 yrs) 2 11 42.5 sr +76<br />
Alcohol related and attributable hospital patients 3 47 970.7 sr +79 04-06 8<br />
Alcohol related deaths (5 yrs) 2 9 37.7 sr +39 01-05 9<br />
Estimated smokers (16+) 791 21.9 % -19 03-04 10<br />
Drug related hospital patients 3 1-4 110.6 sr +42 04-06 11<br />
Drug related deaths (10 yrs) 4 3 66.8 cr2 +6 97-06 12<br />
Patients registered with cancer 3 28 502.0 sr +19 02-04 13<br />
Heart disease patients 3 43 716.0 sr 0<br />
Cerebrovascular disease patients 3 13 208.3 sr +11<br />
Emergency medical admission patients 3 338 6,358.7 sr +2 04-06 14<br />
Multiple admission patients 3 76 1,324.8 sr +9<br />
Unintentional Injury patients 3 55 1,114.2 sr +10<br />
Patients prescribed statins 1,187 22.6 % +24 2006 15<br />
Road accident casualties - adults 3 8 2.2 cr3 -46 01-04 16<br />
Assault discharges 3 9 1.9 cr3 +88 04-06 17<br />
Suicide (5 yrs) 2 7 33.5 sr +113 01-05 18<br />
Self assessed health (classified as "Not Good") 605 13.5 % +33 2001 19<br />
First hospital admission - psychiatric 3 13 276.6 sr +8 02-04 20<br />
Patients prescribed drugs <strong>for</strong> anxiety /depression 472 9.0 % +11 2006 21<br />
Incapacity Benefit & SDA Claimants 350 11.4 % +18 2007 22<br />
Long-term limiting illness 1,136 25.3 % +25 2001 23<br />
Clients aged 0-15 41 4.1 % G* -43<br />
Clients aged 16-64 157 4.9 % G* +10 2007 24<br />
Clients aged 65+ 154 20.9 % G* +18<br />
'Income deprivedʼ 788 16.4 % +18 2006 25<br />
ʻEmployment deprivedʼ 440 15.0 % +16 2006 26<br />
Workless 515 16.7 % +14 2006 27<br />
JSA - Unemployment 90 3.1 % +10 2007 28<br />
Households without access to car/van 833 42.3 % +24 2001 29<br />
Children in workless households 206 21.4 % +16 2001 30<br />
Social grade E - benefit, unemployed, lowest grade work 1,007 28.3 % +26 2001 31<br />
Workplaces 123 41.8 cr3 -22 2005 32<br />
Employees 5 900 29.5 cr -61 2005 33<br />
Primary school attendance - 93.2 % -2 05/06 34<br />
S4 Pupils with 5+ GCSE equivalents 34 58.6 % +1 05/06 35<br />
Adults without qualifications 1,303 40.0 % +20 2001 36<br />
Serious violent crime 3 8 17.3 cr4 +18 04-06 37<br />
Domestic abuse incidents 3 12 25.6 cr4 -70 04-06 38<br />
Vandalism 3 135 281.2 cr4 G GC +4 04-06 39<br />
Drug Offenders 3 28 58.9 cr4 G GC -42 04-06 40<br />
Housing type - tenements n/a n/a % G 2006 41<br />
House prices - 127,810 £ -5 2006 42<br />
Housing tenure - Owner Occupiers n/a n/a % G 2007 43<br />
Overcrowding 341 17.3 % +48 2001 44<br />
Travelling to work by foot/bike or public transport 1,232 47.5 % +7 2001 45<br />
Smoking during pregnancy (3 yrs) 2 31 22.8 % -6 02-04 46<br />
Breastfeeding (at 6 - 8 week review) 15 34.3 % -6 04-06 47<br />
Low birth-weight babies ( 3 yrs) 2 1-4 1.6 % -35 02-04 48<br />
Immunisation uptake at 24 mths - MMR - 85.5 % -5<br />
04-06 50<br />
-all excl. MMR - 96.0 % 0<br />
Dental hospital admissions <strong>for</strong> children 3 12 1.2 cr +7 03-06 51<br />
Teenage pregnancy - under 18 years (3 yrs) 2 8 29.6 cr3 -27 02-04 52<br />
Road accident casualties - children 3 1-4 2.3 cr3 -18 01-04 16<br />
-70 -60 -50 -40 -30 -20 -10 0 +10+20 +30 +40 +50 +60 +70<br />
-<br />
(Below) Scottish Average (%) 1 (Above)<br />
+<br />
Time<br />
Period<br />
2006<br />
Defn<br />
1<br />
Notes<br />
Key<br />
1. The graph shows the "measure" (e.g. crude rate, percentage, years of life) expressed as a percentage below or above the Scottish measure, but using a range from a minimum of -70% to<br />
a maximum of +70% only. The actual plus/minus percentage value is shown in bold to the right of the graph. This is calculated as the area 'measure' minus the Scottish measure, divided by<br />
Scottish measure and multiplied by 100.<br />
2. Numbers presented over a period of years (e.g. 5 years <strong>for</strong> mortality) but rates are annual average rates.<br />
3. Average annual numbers and rates. 4. Numbers and rates presented over a period of years (e.g. 10 years <strong>for</strong> drug deaths).<br />
5. Employee numbers based on location of business, not residence area of employees.<br />
cr - crude rate per 100 population; cr2 - crude rate per 100,000 population; cr3 - crude rate per 1,000 resident population; cr4 - crude rate per 10,000 resident population; cr5 - crude rate per<br />
1,000 live births; sr - age-sex standardised rate per 100,000 population; yrs - years; %* - single parent households as % of households with children. Defn - see table of definitions & sources<br />
The 6th column of the spine chart indicates where an indicator is not compared to the Scottish average but with a local alternative: G - <strong>Glasgow</strong> City average; G* - average of <strong>Glasgow</strong>, E &<br />
W <strong>Dunbartonshire</strong>, Renfrewshire & <strong>East</strong> Renfrewshire; GGC - Greater <strong>Glasgow</strong> and Clyde (excluding Lanarkshire parts); shading on an indicator bar also indicates where a 'local' comparator<br />
is used.<br />
n/a: data not available (usually due to lack of coverage) or cannot be calculated. In addition, <strong>for</strong> particular indicators where the number of cases is below five and not zero, the range is shown<br />
i.e. '1-4'. NB If the number of teenage pregnancies is in the range '1-4' the rate is suppressed to avoid possible disclosure.<br />
A Community <strong>Health</strong> and Wellbeing Profile <strong>for</strong> <strong>East</strong> <strong>Dunbartonshire</strong> 21
Barloch<br />
Key: Barloch 95% Confidence Intervals Scotland<br />
100<br />
Male Life Expectancy<br />
100<br />
Female Life Expectancy<br />
95<br />
95<br />
Life expectancy in years<br />
90<br />
85<br />
80<br />
75<br />
70<br />
65<br />
75.7<br />
80.8<br />
Life expectancy in years<br />
90<br />
85<br />
80<br />
75<br />
70<br />
65<br />
82.4<br />
79.8<br />
60<br />
60<br />
55<br />
1994-1998 1996-2000 1999-2003 2001-2005<br />
55<br />
1994-1998 1996-2000 1999-2003 2001-2005<br />
2000<br />
1500<br />
1000<br />
500<br />
0<br />
<strong>Population</strong> by Age Group<br />
0 - 15 years 16 - 44 years<br />
45 - 64 years 65 years and over<br />
1996 1997 1998 1999 2000 2001 2002 2003 2004 2005 2006<br />
935<br />
851<br />
741<br />
557<br />
% workless of working age population<br />
35%<br />
30%<br />
25%<br />
20%<br />
15%<br />
10%<br />
5%<br />
0%<br />
Worklessness<br />
5.2%<br />
5.3%<br />
1999 2000 2001 2002 2003 2004 2005 2006<br />
% of mothers breastfeeding at 6/8 weeks<br />
85<br />
80<br />
75<br />
70<br />
65<br />
60<br />
55<br />
50<br />
45<br />
40<br />
35<br />
30<br />
25<br />
20<br />
15<br />
10<br />
5<br />
0<br />
Breast Feeding<br />
71.1<br />
72.0<br />
97-99 98-00 99-01 00-02 01-03 02-04 03-05 04-06<br />
Age/sex standardised rate per 100,000 pop<br />
1800<br />
1600<br />
1400<br />
1200<br />
1000<br />
800<br />
600<br />
400<br />
200<br />
0<br />
Hospital Patients with Alcohol Attributable &<br />
Related Conditions<br />
307<br />
97-99 98-00 99-01 00-02 01-03 02-04 03-05 04-06<br />
326<br />
Age/sex standardised rate per 100,000 pop<br />
1600<br />
1400<br />
1200<br />
1000<br />
800<br />
600<br />
400<br />
200<br />
0<br />
Heart Disease Hospital Patients<br />
730<br />
583<br />
96-98 97-99 98-00 99-01 00-02 01-03 02-04 03-05 04-06<br />
Age/sex standardised rate per 100,000 pop<br />
10000<br />
9000<br />
8000<br />
7000<br />
6000<br />
5000<br />
4000<br />
3000<br />
2000<br />
1000<br />
0<br />
Emergency Medical Admission Patients<br />
4257<br />
3792<br />
96-98 97-99 98-00 99-01 00-02 01-03 02-04 03-05 04-06<br />
NB PLEASE NOTE THAT IN SOME CASES RATES/PERCENTAGES MAY BE BASED ON SMALL NUMBERS.<br />
22
<strong>Population</strong> Demographics<br />
Mortality<br />
Drugs,<br />
Alcohol and<br />
Smoking<br />
Social<br />
Crime Prosperity - Poverty<br />
Hospitalisation & Injury<br />
Mental <strong>Health</strong> &<br />
Function<br />
Work<br />
Education<br />
Housing &<br />
Transport<br />
Child & Maternal<br />
<strong>Health</strong><br />
Indicator<br />
Number<br />
Barloch<br />
Measure<br />
-70 -60 -50 -40 -30 -20 -10 0 +10+20 +30 +40 +50 +60 +70<br />
Child population (aged 0-15) 557 18.1 % 0<br />
Adult population (aged 16-64) 1,786 57.9 % -12<br />
Elderly population (aged 65+) 741 24.0 % +47<br />
Minority ethnic groups 36 1.2 % -42 2001 2<br />
Asylum Seekers n/a n/a % G 2007 3<br />
Life expectancy - males - 80.8 yrs +9<br />
Life expectancy - females - 79.8 yrs +1<br />
01-05 4<br />
Live births 24 0.8 cr -28 2006 5<br />
Households - Single adults n/a n/a % G<br />
Single parents n/a n/a %* G<br />
2005 6<br />
Deaths all ages (5 yrs) 2 171 557.5 sr -29<br />
Coronary heart disease deaths in under 75s (5 yrs) 2 8 29.5 sr -62<br />
Cancer deaths in under 75s (5 yrs) 2 29 122.3 sr -17<br />
01-05 7<br />
Cerebrovascular disease deaths in under 75s (5 yrs) 2 5 25.3 sr +5<br />
Alcohol related and attributable hospital patients 3 15 325.5 sr -18 04-06 8<br />
Alcohol related deaths (5 yrs) 2 2 n/a sr 01-05 9<br />
Estimated smokers (16+) 363 14.2 % -48 03-04 10<br />
Drug related hospital patients 3 1-4 59.8 sr -23 04-06 11<br />
Drug related deaths (10 yrs) 4 1 32.3 cr2 -49 97-06 12<br />
Patients registered with cancer 3 20 342.9 sr -18 02-04 13<br />
Heart disease patients 3 30 583.2 sr -18<br />
Cerebrovascular disease patients 3 11 172.5 sr -8<br />
Emergency medical admission patients 3 184 4,256.9 sr -32 04-06 14<br />
Multiple admission patients 3 32 553.5 sr -55<br />
Unintentional Injury patients 3 28 746.4 sr -26<br />
Patients prescribed statins 699 21.6 % +18 2006 15<br />
Road accident casualties - adults 3 1-4 1.4 cr3 -65 01-04 16<br />
Assault discharges 3 1-4 0.1 cr3 -90 04-06 17<br />
Suicide (5 yrs) 2 0 0.0 sr -100 01-05 18<br />
Self assessed health (classified as "Not Good") 197 6.4 % -37 2001 19<br />
First hospital admission - psychiatric 3 6 211.4 sr -17 02-04 20<br />
Patients prescribed drugs <strong>for</strong> anxiety /depression 199 6.2 % -24 2006 21<br />
Incapacity Benefit & SDA Claimants 55 3.3 % -66 2007 22<br />
Long-term limiting illness 477 15.4 % -24 2001 23<br />
Clients aged 0-15 13 2.3 % G* -67<br />
Clients aged 16-64 41 2.3 % G* -49 2007 24<br />
Clients aged 65+ 87 11.7 % G* -34<br />
'Income deprivedʼ 115 3.7 % -74 2006 25<br />
ʻEmployment deprivedʼ 75 4.4 % -66 2006 26<br />
Workless 90 5.3 % -64 2006 27<br />
JSA - Unemployment 20 1.2 % -58 2007 28<br />
Households without access to car/van 234 17.3 % -50 2001 29<br />
Children in workless households 24 3.8 % -79 2001 30<br />
Social grade E - benefit, unemployed, lowest grade work 350 13.7 % -39 2001 31<br />
Workplaces 125 73.2 cr3 +36 2005 32<br />
Employees 5 700 43.7 cr -42 2005 33<br />
Primary school attendance - 95.6 % +1 05/06 34<br />
S4 Pupils with 5+ GCSE equivalents 20 95.2 % +65 05/06 35<br />
Adults without qualifications 340 15.2 % -54 2001 36<br />
Serious violent crime 3 0 1.1 cr4 -93 04-06 37<br />
Domestic abuse incidents 3 4 12.7 cr4 -85 04-06 38<br />
Vandalism 3 27 85.0 cr4 G GC -69 04-06 39<br />
Drug Offenders 3 1-4 14.9 cr4 G GC -85 04-06 40<br />
Housing type - tenements n/a n/a % G 2006 41<br />
House prices - 241,636 £ +80 2006 42<br />
Housing tenure - Owner Occupiers n/a n/a % G 2007 43<br />
Overcrowding 52 3.8 % -67 2001 44<br />
Travelling to work by foot/bike or public transport 630 34.7 % -22 2001 45<br />
Smoking during pregnancy (3 yrs) 2 7 8.9 % -64 02-04 46<br />
Breastfeeding (at 6 - 8 week review) 18 72.0 % +98 04-06 47<br />
Low birth-weight babies ( 3 yrs) 2 1-4 1.4 % -41 02-04 48<br />
Immunisation uptake at 24 mths - MMR - 81.3 % -10<br />
04-06 50<br />
-all excl. MMR - 95.8 % 0<br />
Dental hospital admissions <strong>for</strong> children 3 1-4 0.5 cr -54 03-06 51<br />
Teenage pregnancy - under 18 years (3 yrs) 2 1-4 - cr3 02-04 52<br />
Road accident casualties - children 3 1-4 1.3 cr3 -53 01-04 16<br />
-70 -60 -50 -40 -30 -20 -10 0 +10+20 +30 +40 +50 +60 +70<br />
-<br />
(Below) Scottish Average (%) 1 (Above)<br />
+<br />
Time<br />
Period<br />
2006<br />
Defn<br />
1<br />
Notes<br />
Key<br />
1. The graph shows the "measure" (e.g. crude rate, percentage, years of life) expressed as a percentage below or above the Scottish measure, but using a range from a minimum of -70% to<br />
a maximum of +70% only. The actual plus/minus percentage value is shown in bold to the right of the graph. This is calculated as the area 'measure' minus the Scottish measure, divided by<br />
Scottish measure and multiplied by 100.<br />
2. Numbers presented over a period of years (e.g. 5 years <strong>for</strong> mortality) but rates are annual average rates.<br />
3. Average annual numbers and rates. 4. Numbers and rates presented over a period of years (e.g. 10 years <strong>for</strong> drug deaths).<br />
5. Employee numbers based on location of business, not residence area of employees.<br />
cr - crude rate per 100 population; cr2 - crude rate per 100,000 population; cr3 - crude rate per 1,000 resident population; cr4 - crude rate per 10,000 resident population; cr5 - crude rate per<br />
1,000 live births; sr - age-sex standardised rate per 100,000 population; yrs - years; %* - single parent households as % of households with children. Defn - see table of definitions & sources<br />
The 6th column of the spine chart indicates where an indicator is not compared to the Scottish average but with a local alternative: G - <strong>Glasgow</strong> City average; G* - average of <strong>Glasgow</strong>, E &<br />
W <strong>Dunbartonshire</strong>, Renfrewshire & <strong>East</strong> Renfrewshire; GGC - Greater <strong>Glasgow</strong> and Clyde (excluding Lanarkshire parts); shading on an indicator bar also indicates where a 'local' comparator<br />
is used.<br />
n/a: data not available (usually due to lack of coverage) or cannot be calculated. In addition, <strong>for</strong> particular indicators where the number of cases is below five and not zero, the range is shown<br />
i.e. '1-4'. NB If the number of teenage pregnancies is in the range '1-4' the rate is suppressed to avoid possible disclosure.<br />
A Community <strong>Health</strong> and Wellbeing Profile <strong>for</strong> <strong>East</strong> <strong>Dunbartonshire</strong> 23
Bishopbriggs North and Kenmure<br />
Key: Bishopbriggs North and Kenmure 95% Confidence Intervals Scotland<br />
100<br />
Male Life Expectancy<br />
100<br />
Female Life Expectancy<br />
95<br />
95<br />
Life expectancy in years<br />
90<br />
85<br />
80<br />
75<br />
70<br />
65<br />
76.0<br />
77.8<br />
Life expectancy in years<br />
90<br />
85<br />
80<br />
75<br />
70<br />
65<br />
80.1<br />
83.2<br />
60<br />
60<br />
55<br />
1994-1998 1996-2000 1999-2003 2001-2005<br />
55<br />
1994-1998 1996-2000 1999-2003 2001-2005<br />
3000<br />
2500<br />
2000<br />
1500<br />
1000<br />
500<br />
0<br />
<strong>Population</strong> by Age Group<br />
0 - 15 years 16 - 44 years<br />
45 - 64 years 65 years and over<br />
1996 1997 1998 1999 2000 2001 2002 2003 2004 2005 2006<br />
1776<br />
1564<br />
1318<br />
1000<br />
% workless of working age population<br />
35%<br />
30%<br />
25%<br />
20%<br />
15%<br />
10%<br />
5%<br />
0%<br />
Worklessness<br />
8.3%<br />
5.6%<br />
1999 2000 2001 2002 2003 2004 2005 2006<br />
% of mothers breastfeeding at 6/8 weeks<br />
85<br />
80<br />
75<br />
70<br />
65<br />
60<br />
55<br />
50<br />
45<br />
40<br />
35<br />
30<br />
25<br />
20<br />
15<br />
10<br />
5<br />
0<br />
Breast Feeding<br />
56.5<br />
52.8<br />
97-99 98-00 99-01 00-02 01-03 02-04 03-05 04-06<br />
Age/sex standardised rate per 100,000 pop<br />
1800<br />
1600<br />
1400<br />
1200<br />
1000<br />
800<br />
600<br />
400<br />
200<br />
0<br />
Hospital Patients with Alcohol Attributable &<br />
Related Conditions<br />
522<br />
97-99 98-00 99-01 00-02 01-03 02-04 03-05 04-06<br />
394<br />
Age/sex standardised rate per 100,000 pop<br />
1600<br />
1400<br />
1200<br />
1000<br />
800<br />
600<br />
400<br />
200<br />
0<br />
Heart Disease Hospital Patients<br />
834<br />
513<br />
96-98 97-99 98-00 99-01 00-02 01-03 02-04 03-05 04-06<br />
Age/sex standardised rate per 100,000 pop<br />
10000<br />
9000<br />
8000<br />
7000<br />
6000<br />
5000<br />
4000<br />
3000<br />
2000<br />
1000<br />
0<br />
Emergency Medical Admission Patients<br />
4623<br />
4086<br />
96-98 97-99 98-00 99-01 00-02 01-03 02-04 03-05 04-06<br />
NB PLEASE NOTE THAT IN SOME CASES RATES/PERCENTAGES MAY BE BASED ON SMALL NUMBERS.<br />
24
<strong>Population</strong> Demographics<br />
Mortality<br />
Drugs,<br />
Alcohol and<br />
Smoking<br />
Social<br />
Crime Prosperity - Poverty<br />
Hospitalisation & Injury<br />
Mental <strong>Health</strong> &<br />
Function<br />
Work<br />
Education<br />
Housing &<br />
Transport<br />
Child & Maternal<br />
<strong>Health</strong><br />
Indicator<br />
Bishopbriggs North and Kenmure<br />
Number<br />
Measure<br />
-70 -60 -50 -40 -30 -20 -10 0 +10+20 +30 +40 +50 +60 +70<br />
Child population (aged 0-15) 1,000 17.7 % -2<br />
Adult population (aged 16-64) 3,340 59.0 % -10<br />
Elderly population (aged 65+) 1,318 23.3 % +42<br />
Minority ethnic groups 212 3.7 % +83 2001 2<br />
Asylum Seekers n/a n/a % G 2007 3<br />
Life expectancy - males - 77.8 yrs +5<br />
Life expectancy - females - 83.2 yrs +5<br />
01-05 4<br />
Live births 36 0.6 cr -41 2006 5<br />
Households - Single adults n/a n/a % G<br />
Single parents n/a n/a %* G<br />
2005 6<br />
Deaths all ages (5 yrs) 2 216 563.9 sr -28<br />
Coronary heart disease deaths in under 75s (5 yrs) 2 8 21.9 sr -71<br />
Cancer deaths in under 75s (5 yrs) 2 42 105.2 sr -28<br />
01-05 7<br />
Cerebrovascular disease deaths in under 75s (5 yrs) 2 7 14.7 sr -39<br />
Alcohol related and attributable hospital patients 3 30 394.0 sr -17 04-06 8<br />
Alcohol related deaths (5 yrs) 2 4 9.4 sr -65 01-05 9<br />
Estimated smokers (16+) 650 14.1 % -48 03-04 10<br />
Drug related hospital patients 3 1-4 18.3 sr -76 04-06 11<br />
Drug related deaths (10 yrs) 4 0 0.0 cr2 -100 97-06 12<br />
Patients registered with cancer 3 28 359.9 sr -14 02-04 13<br />
Heart disease patients 3 43 513.0 sr -28<br />
Cerebrovascular disease patients 3 14 149.7 sr -20<br />
Emergency medical admission patients 3 289 4,085.6 sr -35 04-06 14<br />
Multiple admission patients 3 57 740.9 sr -39<br />
Unintentional Injury patients 3 39 531.5 sr -47<br />
Patients prescribed statins 1,307 21.6 % +18 2006 15<br />
Road accident casualties - adults 3 9 2.0 cr3 -50 01-04 16<br />
Assault discharges 3 1-4 0.3 cr3 -71 04-06 17<br />
Suicide (5 yrs) 2 1 8.8 sr -44 01-05 18<br />
Self assessed health (classified as "Not Good") 413 7.1 % -30 2001 19<br />
First hospital admission - psychiatric 3 7 119.1 sr -53 02-04 20<br />
Patients prescribed drugs <strong>for</strong> anxiety /depression 472 7.8 % -3 2006 21<br />
Incapacity Benefit & SDA Claimants 140 4.4 % -54 2007 22<br />
Long-term limiting illness 912 15.8 % -22 2001 23<br />
Clients aged 0-15 15 1.5 % G* -79<br />
Clients aged 16-64 57 1.7 % G* -62 2007 24<br />
Clients aged 65+ 129 9.8 % G* -45<br />
'Income deprivedʼ 240 4.3 % -69 2006 25<br />
ʻEmployment deprivedʼ 183 5.8 % -55 2006 26<br />
Workless 180 5.6 % -62 2006 27<br />
JSA - Unemployment 20 0.6 % -77 2007 28<br />
Households without access to car/van 312 14.4 % -58 2001 29<br />
Children in workless households 76 5.9 % -68 2001 30<br />
Social grade E - benefit, unemployed, lowest grade work 817 17.8 % -21 2001 31<br />
Workplaces 83 26.5 cr3 -51 2005 32<br />
Employees 5 1,600 52.2 cr -30 2005 33<br />
Primary school attendance - 95.7 % +1 05/06 34<br />
S4 Pupils with 5+ GCSE equivalents 69 88.5 % +53 05/06 35<br />
Adults without qualifications 1,046 24.4 % -27 2001 36<br />
Serious violent crime 3 3 4.7 cr4 -68 04-06 37<br />
Domestic abuse incidents 3 9 16.0 cr4 -81 04-06 38<br />
Vandalism 3 94 166.2 cr4 G GC -38 04-06 39<br />
Drug Offenders 3 12 20.7 cr4 G GC -79 04-06 40<br />
Housing type - tenements n/a n/a % G 2006 41<br />
House prices - 187,909 £ +40 2006 42<br />
Housing tenure - Owner Occupiers n/a n/a % G 2007 43<br />
Overcrowding 79 3.6 % -69 2001 44<br />
Travelling to work by foot/bike or public transport 1,472 41.1 % -8 2001 45<br />
Smoking during pregnancy (3 yrs) 2 6 5.8 % -76 02-04 46<br />
Breastfeeding (at 6 - 8 week review) 20 56.5 % +55 04-06 47<br />
Low birth-weight babies ( 3 yrs) 2 1-4 1.0 % -58 02-04 48<br />
Immunisation uptake at 24 mths - MMR - 90.8 % +1<br />
04-06 50<br />
-all excl. MMR - 96.7 % +1<br />
Dental hospital admissions <strong>for</strong> children 3 8 0.8 cr -28 03-06 51<br />
Teenage pregnancy - under 18 years (3 yrs) 2 5 12.6 cr3 -69 02-04 52<br />
Road accident casualties - children 3 1-4 2.0 cr3 -27 01-04 16<br />
-70 -60 -50 -40 -30 -20 -10 0 +10+20 +30 +40 +50 +60 +70<br />
-<br />
(Below) Scottish Average (%) 1 (Above)<br />
+<br />
Time<br />
Period<br />
2006<br />
Defn<br />
1<br />
Notes<br />
Key<br />
1. The graph shows the "measure" (e.g. crude rate, percentage, years of life) expressed as a percentage below or above the Scottish measure, but using a range from a minimum of -70% to<br />
a maximum of +70% only. The actual plus/minus percentage value is shown in bold to the right of the graph. This is calculated as the area 'measure' minus the Scottish measure, divided by<br />
Scottish measure and multiplied by 100.<br />
2. Numbers presented over a period of years (e.g. 5 years <strong>for</strong> mortality) but rates are annual average rates.<br />
3. Average annual numbers and rates. 4. Numbers and rates presented over a period of years (e.g. 10 years <strong>for</strong> drug deaths).<br />
5. Employee numbers based on location of business, not residence area of employees.<br />
cr - crude rate per 100 population; cr2 - crude rate per 100,000 population; cr3 - crude rate per 1,000 resident population; cr4 - crude rate per 10,000 resident population; cr5 - crude rate per<br />
1,000 live births; sr - age-sex standardised rate per 100,000 population; yrs - years; %* - single parent households as % of households with children. Defn - see table of definitions & sources<br />
The 6th column of the spine chart indicates where an indicator is not compared to the Scottish average but with a local alternative: G - <strong>Glasgow</strong> City average; G* - average of <strong>Glasgow</strong>, E &<br />
W <strong>Dunbartonshire</strong>, Renfrewshire & <strong>East</strong> Renfrewshire; GGC - Greater <strong>Glasgow</strong> and Clyde (excluding Lanarkshire parts); shading on an indicator bar also indicates where a 'local' comparator<br />
is used.<br />
n/a: data not available (usually due to lack of coverage) or cannot be calculated. In addition, <strong>for</strong> particular indicators where the number of cases is below five and not zero, the range is shown<br />
i.e. '1-4'. NB If the number of teenage pregnancies is in the range '1-4' the rate is suppressed to avoid possible disclosure.<br />
A Community <strong>Health</strong> and Wellbeing Profile <strong>for</strong> <strong>East</strong> <strong>Dunbartonshire</strong> 25
Bishopbriggs West and Cadder<br />
Key: Bishopbriggs West and Cadder 95% Confidence Intervals Scotland<br />
100<br />
Male Life Expectancy<br />
100<br />
Female Life Expectancy<br />
95<br />
95<br />
Life expectancy in years<br />
90<br />
85<br />
80<br />
75<br />
70<br />
65<br />
76.3<br />
77.2<br />
Life expectancy in years<br />
90<br />
85<br />
80<br />
75<br />
70<br />
65<br />
79.6<br />
81.0<br />
60<br />
60<br />
55<br />
1994-1998 1996-2000 1999-2003 2001-2005<br />
55<br />
1994-1998 1996-2000 1999-2003 2001-2005<br />
3000<br />
2500<br />
2000<br />
1500<br />
1000<br />
500<br />
0<br />
<strong>Population</strong> by Age Group<br />
0 - 15 years 16 - 44 years<br />
45 - 64 years 65 years and over<br />
1996 1997 1998 1999 2000 2001 2002 2003 2004 2005 2006<br />
1896<br />
1643<br />
1145<br />
1019<br />
% workless of working age population<br />
35%<br />
30%<br />
25%<br />
20%<br />
15%<br />
10%<br />
5%<br />
0%<br />
Worklessness<br />
8.9%<br />
6.5%<br />
1999 2000 2001 2002 2003 2004 2005 2006<br />
% of mothers breastfeeding at 6/8 weeks<br />
85<br />
80<br />
75<br />
70<br />
65<br />
60<br />
55<br />
50<br />
45<br />
40<br />
35<br />
30<br />
25<br />
20<br />
15<br />
10<br />
5<br />
0<br />
Breast Feeding<br />
57.9<br />
50.0<br />
97-99 98-00 99-01 00-02 01-03 02-04 03-05 04-06<br />
Age/sex standardised rate per 100,000 pop<br />
1800<br />
1600<br />
1400<br />
1200<br />
1000<br />
800<br />
600<br />
400<br />
200<br />
0<br />
Hospital Patients with Alcohol Attributable &<br />
Related Conditions<br />
542<br />
97-99 98-00 99-01 00-02 01-03 02-04 03-05 04-06<br />
546<br />
Age/sex standardised rate per 100,000 pop<br />
1600<br />
1400<br />
1200<br />
1000<br />
800<br />
600<br />
400<br />
200<br />
0<br />
Heart Disease Hospital Patients<br />
1005<br />
511<br />
96-98 97-99 98-00 99-01 00-02 01-03 02-04 03-05 04-06<br />
Age/sex standardised rate per 100,000 pop<br />
10000<br />
9000<br />
8000<br />
7000<br />
6000<br />
5000<br />
4000<br />
3000<br />
2000<br />
1000<br />
0<br />
Emergency Medical Admission Patients<br />
5161<br />
4384<br />
96-98 97-99 98-00 99-01 00-02 01-03 02-04 03-05 04-06<br />
NB PLEASE NOTE THAT IN SOME CASES RATES/PERCENTAGES MAY BE BASED ON SMALL NUMBERS.<br />
26
<strong>Population</strong> Demographics<br />
Mortality<br />
Drugs,<br />
Alcohol and<br />
Smoking<br />
Social<br />
Crime Prosperity - Poverty<br />
Hospitalisation & Injury<br />
Mental <strong>Health</strong> &<br />
Function<br />
Work<br />
Education<br />
Housing &<br />
Transport<br />
Child & Maternal<br />
<strong>Health</strong><br />
Indicator<br />
Bishopbriggs West and Cadder<br />
Number<br />
Measure<br />
-70 -60 -50 -40 -30 -20 -10 0 +10+20 +30 +40 +50 +60 +70<br />
Child population (aged 0-15) 1,019 17.9 % -1<br />
Adult population (aged 16-64) 3,539 62.1 % -5<br />
Elderly population (aged 65+) 1,145 20.1 % +23<br />
Minority ethnic groups 255 4.4 % +119 2001 2<br />
Asylum Seekers n/a n/a % G 2007 3<br />
Life expectancy - males - 77.2 yrs +5<br />
Life expectancy - females - 81.0 yrs +2<br />
01-05 4<br />
Live births 42 0.7 cr -32 2006 5<br />
Households - Single adults n/a n/a % G<br />
Single parents n/a n/a %* G<br />
2005 6<br />
Deaths all ages (5 yrs) 2 266 706.3 sr -10<br />
Coronary heart disease deaths in under 75s (5 yrs) 2 21 53.4 sr -30<br />
Cancer deaths in under 75s (5 yrs) 2 47 127.1 sr -13<br />
01-05 7<br />
Cerebrovascular disease deaths in under 75s (5 yrs) 2 5 11.1 sr -54<br />
Alcohol related and attributable hospital patients 3 37 546.4 sr +7 04-06 8<br />
Alcohol related deaths (5 yrs) 2 6 13.4 sr -51 01-05 9<br />
Estimated smokers (16+) 713 15.2 % -44 03-04 10<br />
Drug related hospital patients 3 1-4 52.3 sr -33 04-06 11<br />
Drug related deaths (10 yrs) 4 2 34.6 cr2 -45 97-06 12<br />
Patients registered with cancer 3 37 477.8 sr +14 02-04 13<br />
Heart disease patients 3 43 510.8 sr -28<br />
Cerebrovascular disease patients 3 12 137.4 sr -27<br />
Emergency medical admission patients 3 287 4,384.4 sr -30 04-06 14<br />
Multiple admission patients 3 54 747.8 sr -39<br />
Unintentional Injury patients 3 38 579.4 sr -43<br />
Patients prescribed statins 1,269 21.1 % +15 2006 15<br />
Road accident casualties - adults 3 20 4.1 cr3 +3 01-04 16<br />
Assault discharges 3 1-4 0.3 cr3 -72 04-06 17<br />
Suicide (5 yrs) 2 3 6.9 sr -56 01-05 18<br />
Self assessed health (classified as "Not Good") 424 7.3 % -28 2001 19<br />
First hospital admission - psychiatric 3 4 52.6 sr -79 02-04 20<br />
Patients prescribed drugs <strong>for</strong> anxiety /depression 465 7.7 % -5 2006 21<br />
Incapacity Benefit & SDA Claimants 150 4.4 % -54 2007 22<br />
Long-term limiting illness 943 16.3 % -20 2001 23<br />
Clients aged 0-15 23 2.3 % G* -68<br />
Clients aged 16-64 91 2.6 % G* -43 2007 24<br />
Clients aged 65+ 109 9.5 % G* -46<br />
'Income deprivedʼ 265 4.6 % -67 2006 25<br />
ʻEmployment deprivedʼ 218 6.5 % -50 2006 26<br />
Workless 220 6.5 % -56 2006 27<br />
JSA - Unemployment 50 1.5 % -47 2007 28<br />
Households without access to car/van 409 18.3 % -47 2001 29<br />
Children in workless households 54 4.2 % -77 2001 30<br />
Social grade E - benefit, unemployed, lowest grade work 691 14.8 % -34 2001 31<br />
Workplaces 193 57.3 cr3 +6 2005 32<br />
Employees 5 2,200 66.2 cr -12 2005 33<br />
Primary school attendance - 95.2 % 0 05/06 34<br />
S4 Pupils with 5+ GCSE equivalents 67 82.7 % +43 05/06 35<br />
Adults without qualifications 1,086 25.1 % -24 2001 36<br />
Serious violent crime 3 6 9.9 cr4 -33 04-06 37<br />
Domestic abuse incidents 3 13 22.1 cr4 -74 04-06 38<br />
Vandalism 3 125 217.9 cr4 G GC -19 04-06 39<br />
Drug Offenders 3 11 19.8 cr4 G GC -80 04-06 40<br />
Housing type - tenements n/a n/a % G 2006 41<br />
House prices - 171,129 £ +28 2006 42<br />
Housing tenure - Owner Occupiers n/a n/a % G 2007 43<br />
Overcrowding 144 6.4 % -45 2001 44<br />
Travelling to work by foot/bike or public transport 1,483 39.8 % -11 2001 45<br />
Smoking during pregnancy (3 yrs) 2 9 6.7 % -72 02-04 46<br />
Breastfeeding (at 6 - 8 week review) 20 50.0 % +37 04-06 47<br />
Low birth-weight babies ( 3 yrs) 2 1-4 0.8 % -67 02-04 48<br />
Immunisation uptake at 24 mths - MMR - 90.2 % 0<br />
04-06 50<br />
-all excl. MMR - 98.6 % +3<br />
Dental hospital admissions <strong>for</strong> children 3 8 0.7 cr -38 03-06 51<br />
Teenage pregnancy - under 18 years (3 yrs) 2 9 26.5 cr3 -34 02-04 52<br />
Road accident casualties - children 3 1-4 2.3 cr3 -17 01-04 16<br />
-70 -60 -50 -40 -30 -20 -10 0 +10+20 +30 +40 +50 +60 +70<br />
-<br />
(Below) Scottish Average (%) 1 (Above)<br />
+<br />
Time<br />
Period<br />
2006<br />
Defn<br />
1<br />
Notes<br />
Key<br />
1. The graph shows the "measure" (e.g. crude rate, percentage, years of life) expressed as a percentage below or above the Scottish measure, but using a range from a minimum of -70% to<br />
a maximum of +70% only. The actual plus/minus percentage value is shown in bold to the right of the graph. This is calculated as the area 'measure' minus the Scottish measure, divided by<br />
Scottish measure and multiplied by 100.<br />
2. Numbers presented over a period of years (e.g. 5 years <strong>for</strong> mortality) but rates are annual average rates.<br />
3. Average annual numbers and rates. 4. Numbers and rates presented over a period of years (e.g. 10 years <strong>for</strong> drug deaths).<br />
5. Employee numbers based on location of business, not residence area of employees.<br />
cr - crude rate per 100 population; cr2 - crude rate per 100,000 population; cr3 - crude rate per 1,000 resident population; cr4 - crude rate per 10,000 resident population; cr5 - crude rate per<br />
1,000 live births; sr - age-sex standardised rate per 100,000 population; yrs - years; %* - single parent households as % of households with children. Defn - see table of definitions & sources<br />
The 6th column of the spine chart indicates where an indicator is not compared to the Scottish average but with a local alternative: G - <strong>Glasgow</strong> City average; G* - average of <strong>Glasgow</strong>, E &<br />
W <strong>Dunbartonshire</strong>, Renfrewshire & <strong>East</strong> Renfrewshire; GGC - Greater <strong>Glasgow</strong> and Clyde (excluding Lanarkshire parts); shading on an indicator bar also indicates where a 'local' comparator<br />
is used.<br />
n/a: data not available (usually due to lack of coverage) or cannot be calculated. In addition, <strong>for</strong> particular indicators where the number of cases is below five and not zero, the range is shown<br />
i.e. '1-4'. NB If the number of teenage pregnancies is in the range '1-4' the rate is suppressed to avoid possible disclosure.<br />
A Community <strong>Health</strong> and Wellbeing Profile <strong>for</strong> <strong>East</strong> <strong>Dunbartonshire</strong> 27
<strong>East</strong> Clober and Mains Estate<br />
Key: <strong>East</strong> Clober and Mains Estate 95% Confidence Intervals Scotland<br />
100<br />
Male Life Expectancy<br />
100<br />
Female Life Expectancy<br />
95<br />
95<br />
Life expectancy in years<br />
90<br />
85<br />
80<br />
75<br />
70<br />
65<br />
75.5<br />
77.4<br />
Life expectancy in years<br />
90<br />
85<br />
80<br />
75<br />
70<br />
65<br />
80.3<br />
86.3<br />
60<br />
60<br />
55<br />
1994-1998 1996-2000 1999-2003 2001-2005<br />
55<br />
1994-1998 1996-2000 1999-2003 2001-2005<br />
2000<br />
1500<br />
1000<br />
500<br />
0<br />
<strong>Population</strong> by Age Group<br />
0 - 15 years 16 - 44 years<br />
45 - 64 years 65 years and over<br />
1996 1997 1998 1999 2000 2001 2002 2003 2004 2005 2006<br />
1292<br />
967<br />
720<br />
510<br />
% workless of working age population<br />
35%<br />
30%<br />
25%<br />
20%<br />
15%<br />
10%<br />
5%<br />
0%<br />
Worklessness<br />
14.9%<br />
11.5%<br />
1999 2000 2001 2002 2003 2004 2005 2006<br />
% of mothers breastfeeding at 6/8 weeks<br />
85<br />
80<br />
75<br />
70<br />
65<br />
60<br />
55<br />
50<br />
45<br />
40<br />
35<br />
30<br />
25<br />
20<br />
15<br />
10<br />
5<br />
0<br />
Breast Feeding<br />
47.5<br />
41.2<br />
97-99 98-00 99-01 00-02 01-03 02-04 03-05 04-06<br />
Age/sex standardised rate per 100,000 pop<br />
1800<br />
1600<br />
1400<br />
1200<br />
1000<br />
800<br />
600<br />
400<br />
200<br />
0<br />
Hospital Patients with Alcohol Attributable &<br />
Related Conditions<br />
567<br />
97-99 98-00 99-01 00-02 01-03 02-04 03-05 04-06<br />
466<br />
Age/sex standardised rate per 100,000 pop<br />
1600<br />
1400<br />
1200<br />
1000<br />
800<br />
600<br />
400<br />
200<br />
0<br />
Heart Disease Hospital Patients<br />
979<br />
638<br />
96-98 97-99 98-00 99-01 00-02 01-03 02-04 03-05 04-06<br />
Age/sex standardised rate per 100,000 pop<br />
10000<br />
9000<br />
8000<br />
7000<br />
6000<br />
5000<br />
4000<br />
3000<br />
2000<br />
1000<br />
0<br />
Emergency Medical Admission Patients<br />
5930<br />
5379<br />
96-98 97-99 98-00 99-01 00-02 01-03 02-04 03-05 04-06<br />
NB PLEASE NOTE THAT IN SOME CASES RATES/PERCENTAGES MAY BE BASED ON SMALL NUMBERS.<br />
28
<strong>Population</strong> Demographics<br />
Mortality<br />
Drugs,<br />
Alcohol and<br />
Smoking<br />
Social<br />
Crime Prosperity - Poverty<br />
Hospitalisation & Injury<br />
Mental <strong>Health</strong> &<br />
Function<br />
Work<br />
Education<br />
Housing &<br />
Transport<br />
Child & Maternal<br />
<strong>Health</strong><br />
Indicator<br />
<strong>East</strong> Clober and Mains Estate<br />
Number<br />
Measure<br />
-70 -60 -50 -40 -30 -20 -10 0 +10+20 +30 +40 +50 +60 +70<br />
Child population (aged 0-15) 720 20.6 % +15<br />
Adult population (aged 16-64) 2,259 64.7 % -1<br />
Elderly population (aged 65+) 510 14.6 % -11<br />
Minority ethnic groups 70 1.9 % -5 2001 2<br />
Asylum Seekers n/a n/a % G 2007 3<br />
Life expectancy - males - 77.4 yrs +5<br />
Life expectancy - females - 86.3 yrs +9<br />
01-05 4<br />
Live births 27 0.8 cr -29 2006 5<br />
Households - Single adults n/a n/a % G<br />
Single parents n/a n/a %* G<br />
2005 6<br />
Deaths all ages (5 yrs) 2 131 626.3 sr -20<br />
Coronary heart disease deaths in under 75s (5 yrs) 2 7 39.7 sr -48<br />
Cancer deaths in under 75s (5 yrs) 2 26 126.6 sr -14<br />
01-05 7<br />
Cerebrovascular disease deaths in under 75s (5 yrs) 2 5 23.8 sr -2<br />
Alcohol related and attributable hospital patients 3 18 465.8 sr +5 04-06 8<br />
Alcohol related deaths (5 yrs) 2 5 21.3 sr -22 01-05 9<br />
Estimated smokers (16+) 592 20.9 % -23 03-04 10<br />
Drug related hospital patients 3 0 0.0 sr -100 04-06 11<br />
Drug related deaths (10 yrs) 4 0 0.0 cr2 -100 97-06 12<br />
Patients registered with cancer 3 19 476.2 sr +13 02-04 13<br />
Heart disease patients 3 26 637.9 sr -11<br />
Cerebrovascular disease patients 3 13 311.8 sr +66<br />
Emergency medical admission patients 3 198 5,378.7 sr -14 04-06 14<br />
Multiple admission patients 3 38 920.5 sr -25<br />
Unintentional Injury patients 3 27 734.3 sr -27<br />
Patients prescribed statins 824 21.7 % +19 2006 15<br />
Road accident casualties - adults 3 1-4 1.4 cr3 -64 01-04 16<br />
Assault discharges 3 1-4 0.7 cr3 -37 04-06 17<br />
Suicide (5 yrs) 2 1 4.8 sr -70 01-05 18<br />
Self assessed health (classified as "Not Good") 315 8.6 % -15 2001 19<br />
First hospital admission - psychiatric 3 8 203.7 sr -20 02-04 20<br />
Patients prescribed drugs <strong>for</strong> anxiety /depression 238 6.3 % -23 2006 21<br />
Incapacity Benefit & SDA Claimants 180 8.1 % -15 2007 22<br />
Long-term limiting illness 580 15.9 % -22 2001 23<br />
Clients aged 0-15 53 7.4 % G* +3<br />
Clients aged 16-64 109 4.8 % G* +8 2007 24<br />
Clients aged 65+ 78 15.3 % G* -14<br />
'Income deprivedʼ 415 11.6 % -16 2006 25<br />
ʻEmployment deprivedʼ 220 9.9 % -23 2006 26<br />
Workless 255 11.5 % -21 2006 27<br />
JSA - Unemployment 60 2.7 % -3 2007 28<br />
Households without access to car/van 400 28.6 % -16 2001 29<br />
Children in workless households 127 13.8 % -25 2001 30<br />
Social grade E - benefit, unemployed, lowest grade work 618 21.9 % -2 2001 31<br />
Workplaces 54 24.3 cr3 -55 2005 32<br />
Employees 5 700 30.8 cr -59 2005 33<br />
Primary school attendance - 93.3 % -2 05/06 34<br />
S4 Pupils with 5+ GCSE equivalents 46 71.9 % +24 05/06 35<br />
Adults without qualifications 841 31.8 % -4 2001 36<br />
Serious violent crime 3 5 14.0 cr4 -5 04-06 37<br />
Domestic abuse incidents 3 24 66.2 cr4 -23 04-06 38<br />
Vandalism 3 84 236.0 cr4 G GC -13 04-06 39<br />
Drug Offenders 3 20 56.0 cr4 G GC -45 04-06 40<br />
Housing type - tenements n/a n/a % G 2006 41<br />
House prices - 125,682 £ -6 2006 42<br />
Housing tenure - Owner Occupiers n/a n/a % G 2007 43<br />
Overcrowding 168 12.0 % +2 2001 44<br />
Travelling to work by foot/bike or public transport 1,128 47.6 % +7 2001 45<br />
Smoking during pregnancy (3 yrs) 2 24 35.8 % +48 02-04 46<br />
Breastfeeding (at 6 - 8 week review) 12 41.2 % +13 04-06 47<br />
Low birth-weight babies ( 3 yrs) 2 1-4 6.3 % +154 02-04 48<br />
Immunisation uptake at 24 mths - MMR - 86.6 % -4<br />
04-06 50<br />
-all excl. MMR - 97.6 % +2<br />
Dental hospital admissions <strong>for</strong> children 3 8 1.1 cr -6 03-06 51<br />
Teenage pregnancy - under 18 years (3 yrs) 2 10 32.1 cr3 -21 02-04 52<br />
Road accident casualties - children 3 1-4 0.9 cr3 -66 01-04 16<br />
-70 -60 -50 -40 -30 -20 -10 0 +10+20 +30 +40 +50 +60 +70<br />
-<br />
(Below) Scottish Average (%) 1 (Above)<br />
+<br />
Time<br />
Period<br />
2006<br />
Defn<br />
1<br />
Notes<br />
Key<br />
1. The graph shows the "measure" (e.g. crude rate, percentage, years of life) expressed as a percentage below or above the Scottish measure, but using a range from a minimum of -70% to<br />
a maximum of +70% only. The actual plus/minus percentage value is shown in bold to the right of the graph. This is calculated as the area 'measure' minus the Scottish measure, divided by<br />
Scottish measure and multiplied by 100.<br />
2. Numbers presented over a period of years (e.g. 5 years <strong>for</strong> mortality) but rates are annual average rates.<br />
3. Average annual numbers and rates. 4. Numbers and rates presented over a period of years (e.g. 10 years <strong>for</strong> drug deaths).<br />
5. Employee numbers based on location of business, not residence area of employees.<br />
cr - crude rate per 100 population; cr2 - crude rate per 100,000 population; cr3 - crude rate per 1,000 resident population; cr4 - crude rate per 10,000 resident population; cr5 - crude rate per<br />
1,000 live births; sr - age-sex standardised rate per 100,000 population; yrs - years; %* - single parent households as % of households with children. Defn - see table of definitions & sources<br />
The 6th column of the spine chart indicates where an indicator is not compared to the Scottish average but with a local alternative: G - <strong>Glasgow</strong> City average; G* - average of <strong>Glasgow</strong>, E &<br />
W <strong>Dunbartonshire</strong>, Renfrewshire & <strong>East</strong> Renfrewshire; GGC - Greater <strong>Glasgow</strong> and Clyde (excluding Lanarkshire parts); shading on an indicator bar also indicates where a 'local' comparator<br />
is used.<br />
n/a: data not available (usually due to lack of coverage) or cannot be calculated. In addition, <strong>for</strong> particular indicators where the number of cases is below five and not zero, the range is shown<br />
i.e. '1-4'. NB If the number of teenage pregnancies is in the range '1-4' the rate is suppressed to avoid possible disclosure.<br />
A Community <strong>Health</strong> and Wellbeing Profile <strong>for</strong> <strong>East</strong> <strong>Dunbartonshire</strong> 29
Harestanes<br />
Key: Harestanes 95% Confidence Intervals Scotland<br />
100<br />
Male Life Expectancy<br />
100<br />
Female Life Expectancy<br />
95<br />
95<br />
Life expectancy in years<br />
90<br />
85<br />
80<br />
75<br />
70<br />
65<br />
69.5<br />
74.5<br />
Life expectancy in years<br />
90<br />
85<br />
80<br />
75<br />
70<br />
65<br />
76.4<br />
80.4<br />
60<br />
60<br />
55<br />
1994-1998 1996-2000 1999-2003 2001-2005<br />
55<br />
1994-1998 1996-2000 1999-2003 2001-2005<br />
2000<br />
1500<br />
1000<br />
500<br />
0<br />
<strong>Population</strong> by Age Group<br />
0 - 15 years 16 - 44 years<br />
45 - 64 years 65 years and over<br />
1996 1997 1998 1999 2000 2001 2002 2003 2004 2005 2006<br />
1240<br />
851<br />
704<br />
615<br />
% workless of working age population<br />
35%<br />
30%<br />
25%<br />
20%<br />
15%<br />
10%<br />
5%<br />
0%<br />
Worklessness<br />
20.7%<br />
16.5%<br />
1999 2000 2001 2002 2003 2004 2005 2006<br />
% of mothers breastfeeding at 6/8 weeks<br />
85<br />
80<br />
75<br />
70<br />
65<br />
60<br />
55<br />
50<br />
45<br />
40<br />
35<br />
30<br />
25<br />
20<br />
15<br />
10<br />
5<br />
0<br />
Breast Feeding<br />
18.8<br />
14.6<br />
97-99 98-00 99-01 00-02 01-03 02-04 03-05 04-06<br />
Age/sex standardised rate per 100,000 pop<br />
1800<br />
1600<br />
1400<br />
1200<br />
1000<br />
800<br />
600<br />
400<br />
200<br />
0<br />
Hospital Patients with Alcohol Attributable &<br />
Related Conditions<br />
961<br />
97-99 98-00 99-01 00-02 01-03 02-04 03-05 04-06<br />
934<br />
Age/sex standardised rate per 100,000 pop<br />
1600<br />
1400<br />
1200<br />
1000<br />
800<br />
600<br />
400<br />
200<br />
0<br />
Heart Disease Hospital Patients<br />
1184<br />
860<br />
96-98 97-99 98-00 99-01 00-02 01-03 02-04 03-05 04-06<br />
Age/sex standardised rate per 100,000 pop<br />
10000<br />
9000<br />
8000<br />
7000<br />
6000<br />
5000<br />
4000<br />
3000<br />
2000<br />
1000<br />
0<br />
Emergency Medical Admission Patients<br />
7142<br />
6474<br />
96-98 97-99 98-00 99-01 00-02 01-03 02-04 03-05 04-06<br />
NB PLEASE NOTE THAT IN SOME CASES RATES/PERCENTAGES MAY BE BASED ON SMALL NUMBERS.<br />
30
<strong>Population</strong> Demographics<br />
Mortality<br />
Drugs,<br />
Alcohol and<br />
Smoking<br />
Social<br />
Crime Prosperity - Poverty<br />
Hospitalisation & Injury<br />
Mental <strong>Health</strong> &<br />
Function<br />
Work<br />
Education<br />
Housing &<br />
Transport<br />
Child & Maternal<br />
<strong>Health</strong><br />
Indicator<br />
Number<br />
Harestanes<br />
Measure<br />
-70 -60 -50 -40 -30 -20 -10 0 +10+20 +30 +40 +50 +60 +70<br />
Child population (aged 0-15) 615 18.0 % 0<br />
Adult population (aged 16-64) 2,091 61.3 % -7<br />
Elderly population (aged 65+) 704 20.6 % +26<br />
Minority ethnic groups 34 1.0 % -51 2001 2<br />
Asylum Seekers n/a n/a % G 2007 3<br />
Life expectancy - males - 74.5 yrs +1<br />
Life expectancy - females - 80.4 yrs +2<br />
01-05 4<br />
Live births 28 0.8 cr -24 2006 5<br />
Households - Single adults n/a n/a % G<br />
Single parents n/a n/a %* G<br />
2005 6<br />
Deaths all ages (5 yrs) 2 200 743.8 sr -5<br />
Coronary heart disease deaths in under 75s (5 yrs) 2 22 96.6 sr +26<br />
Cancer deaths in under 75s (5 yrs) 2 42 183.3 sr +25<br />
01-05 7<br />
Cerebrovascular disease deaths in under 75s (5 yrs) 2 5 19.1 sr -21<br />
Alcohol related and attributable hospital patients 3 36 934.1 sr +84 04-06 8<br />
Alcohol related deaths (5 yrs) 2 3 12.0 sr -56 01-05 9<br />
Estimated smokers (16+) 974 34.2 % +26 03-04 10<br />
Drug related hospital patients 3 1-4 61.6 sr -21 04-06 11<br />
Drug related deaths (10 yrs) 4 1 28.7 cr2 -55 97-06 12<br />
Patients registered with cancer 3 24 483.2 sr +15 02-04 13<br />
Heart disease patients 3 39 859.6 sr +20<br />
Cerebrovascular disease patients 3 12 235.0 sr +25<br />
Emergency medical admission patients 3 262 6,474.3 sr +4 04-06 14<br />
Multiple admission patients 3 67 1,464.7 sr +20<br />
Unintentional Injury patients 3 35 960.5 sr -5<br />
Patients prescribed statins 793 21.6 % +18 2006 15<br />
Road accident casualties - adults 3 1-4 0.4 cr3 -89 01-04 16<br />
Assault discharges 3 1-4 1.2 cr3 +13 04-06 17<br />
Suicide (5 yrs) 2 1 6.1 sr -61 01-05 18<br />
Self assessed health (classified as "Not Good") 468 13.5 % +33 2001 19<br />
First hospital admission - psychiatric 3 12 332.2 sr +30 02-04 20<br />
Patients prescribed drugs <strong>for</strong> anxiety /depression 324 8.8 % +9 2006 21<br />
Incapacity Benefit & SDA Claimants 235 11.8 % +22 2007 22<br />
Long-term limiting illness 835 24.1 % +19 2001 23<br />
Clients aged 0-15 38 6.2 % G* -14<br />
Clients aged 16-64 141 6.7 % G* +51 2007 24<br />
Clients aged 65+ 107 15.2 % G* -14<br />
'Income deprivedʼ 516 15.1 % +9 2006 25<br />
ʻEmployment deprivedʼ 297 14.9 % +16 2006 26<br />
Workless 330 16.5 % +12 2006 27<br />
JSA - Unemployment 60 3.0 % +8 2007 28<br />
Households without access to car/van 577 37.8 % +10 2001 29<br />
Children in workless households 128 18.5 % +1 2001 30<br />
Social grade E - benefit, unemployed, lowest grade work 822 28.9 % +29 2001 31<br />
Workplaces 49 24.7 cr3 -54 2005 32<br />
Employees 5 700 33.9 cr -55 2005 33<br />
Primary school attendance - 92.9 % -2 05/06 34<br />
S4 Pupils with 5+ GCSE equivalents 21 53.8 % -7 05/06 35<br />
Adults without qualifications 1,050 40.4 % +22 2001 36<br />
Serious violent crime 3 2 4.9 cr4 -67 04-06 37<br />
Domestic abuse incidents 3 18 53.7 cr4 -37 04-06 38<br />
Vandalism 3 54 159.1 cr4 G GC -41 04-06 39<br />
Drug Offenders 3 16 45.9 cr4 G GC -55 04-06 40<br />
Housing type - tenements n/a n/a % G 2006 41<br />
House prices - 94,337 £ -30 2006 42<br />
Housing tenure - Owner Occupiers n/a n/a % G 2007 43<br />
Overcrowding 234 15.3 % +31 2001 44<br />
Travelling to work by foot/bike or public transport 815 41.8 % -6 2001 45<br />
Smoking during pregnancy (3 yrs) 2 29 26.9 % +11 02-04 46<br />
Breastfeeding (at 6 - 8 week review) 5 14.6 % -60 04-06 47<br />
Low birth-weight babies ( 3 yrs) 2 1-4 4.1 % +67 02-04 48<br />
Immunisation uptake at 24 mths - MMR - 95.9 % +6<br />
04-06 50<br />
-all excl. MMR - 100.0 % +4<br />
Dental hospital admissions <strong>for</strong> children 3 9 1.5 cr +32 03-06 51<br />
Teenage pregnancy - under 18 years (3 yrs) 2 8 49.4 cr3 +22 02-04 52<br />
Road accident casualties - children 3 1-4 1.6 cr3 -42 01-04 16<br />
-70 -60 -50 -40 -30 -20 -10 0 +10+20 +30 +40 +50 +60 +70<br />
-<br />
(Below) Scottish Average (%) 1 (Above)<br />
+<br />
Time<br />
Period<br />
2006<br />
Defn<br />
1<br />
Notes<br />
Key<br />
1. The graph shows the "measure" (e.g. crude rate, percentage, years of life) expressed as a percentage below or above the Scottish measure, but using a range from a minimum of -70% to<br />
a maximum of +70% only. The actual plus/minus percentage value is shown in bold to the right of the graph. This is calculated as the area 'measure' minus the Scottish measure, divided by<br />
Scottish measure and multiplied by 100.<br />
2. Numbers presented over a period of years (e.g. 5 years <strong>for</strong> mortality) but rates are annual average rates.<br />
3. Average annual numbers and rates. 4. Numbers and rates presented over a period of years (e.g. 10 years <strong>for</strong> drug deaths).<br />
5. Employee numbers based on location of business, not residence area of employees.<br />
cr - crude rate per 100 population; cr2 - crude rate per 100,000 population; cr3 - crude rate per 1,000 resident population; cr4 - crude rate per 10,000 resident population; cr5 - crude rate per<br />
1,000 live births; sr - age-sex standardised rate per 100,000 population; yrs - years; %* - single parent households as % of households with children. Defn - see table of definitions & sources<br />
The 6th column of the spine chart indicates where an indicator is not compared to the Scottish average but with a local alternative: G - <strong>Glasgow</strong> City average; G* - average of <strong>Glasgow</strong>, E &<br />
W <strong>Dunbartonshire</strong>, Renfrewshire & <strong>East</strong> Renfrewshire; GGC - Greater <strong>Glasgow</strong> and Clyde (excluding Lanarkshire parts); shading on an indicator bar also indicates where a 'local' comparator<br />
is used.<br />
n/a: data not available (usually due to lack of coverage) or cannot be calculated. In addition, <strong>for</strong> particular indicators where the number of cases is below five and not zero, the range is shown<br />
i.e. '1-4'. NB If the number of teenage pregnancies is in the range '1-4' the rate is suppressed to avoid possible disclosure.<br />
A Community <strong>Health</strong> and Wellbeing Profile <strong>for</strong> <strong>East</strong> <strong>Dunbartonshire</strong> 31
Hillhead<br />
Key: Hillhead 95% Confidence Intervals Scotland<br />
100<br />
Male Life Expectancy<br />
100<br />
Female Life Expectancy<br />
95<br />
95<br />
Life expectancy in years<br />
90<br />
85<br />
80<br />
75<br />
70<br />
65<br />
70.4<br />
69.3<br />
Life expectancy in years<br />
90<br />
85<br />
80<br />
75<br />
70<br />
65<br />
74.2<br />
77.1<br />
60<br />
60<br />
55<br />
1994-1998 1996-2000 1999-2003 2001-2005<br />
55<br />
1994-1998 1996-2000 1999-2003 2001-2005<br />
3000<br />
2500<br />
2000<br />
1500<br />
1000<br />
500<br />
0<br />
<strong>Population</strong> by Age Group<br />
0 - 15 years 16 - 44 years<br />
45 - 64 years 65 years and over<br />
1996 1997 1998 1999 2000 2001 2002 2003 2004 2005 2006<br />
1627<br />
894<br />
887<br />
564<br />
% workless of working age population<br />
35%<br />
30%<br />
25%<br />
20%<br />
15%<br />
10%<br />
5%<br />
0%<br />
Worklessness<br />
32.9%<br />
27.4%<br />
1999 2000 2001 2002 2003 2004 2005 2006<br />
% of mothers breastfeeding at 6/8 weeks<br />
85<br />
80<br />
75<br />
70<br />
65<br />
60<br />
55<br />
50<br />
45<br />
40<br />
35<br />
30<br />
25<br />
20<br />
15<br />
10<br />
5<br />
0<br />
Breast Feeding<br />
14.7<br />
12.6<br />
97-99 98-00 99-01 00-02 01-03 02-04 03-05 04-06<br />
Age/sex standardised rate per 100,000 pop<br />
1800<br />
1600<br />
1400<br />
1200<br />
1000<br />
800<br />
600<br />
400<br />
200<br />
0<br />
Hospital Patients with Alcohol Attributable &<br />
Related Conditions<br />
1752<br />
97-99 98-00 99-01 00-02 01-03 02-04 03-05 04-06<br />
1344<br />
Age/sex standardised rate per 100,000 pop<br />
1600<br />
1400<br />
1200<br />
1000<br />
800<br />
600<br />
400<br />
200<br />
0<br />
Heart Disease Hospital Patients<br />
1269<br />
896<br />
96-98 97-99 98-00 99-01 00-02 01-03 02-04 03-05 04-06<br />
Age/sex standardised rate per 100,000 pop<br />
10000<br />
9000<br />
8000<br />
7000<br />
6000<br />
5000<br />
4000<br />
3000<br />
2000<br />
1000<br />
0<br />
Emergency Medical Admission Patients<br />
9316<br />
7626<br />
96-98 97-99 98-00 99-01 00-02 01-03 02-04 03-05 04-06<br />
NB PLEASE NOTE THAT IN SOME CASES RATES/PERCENTAGES MAY BE BASED ON SMALL NUMBERS.<br />
32
<strong>Population</strong> Demographics<br />
Mortality<br />
Drugs,<br />
Alcohol and<br />
Smoking<br />
Social<br />
Crime Prosperity - Poverty<br />
Hospitalisation & Injury<br />
Mental <strong>Health</strong> &<br />
Function<br />
Work<br />
Education<br />
Housing &<br />
Transport<br />
Child & Maternal<br />
<strong>Health</strong><br />
Indicator<br />
Number<br />
Hillhead<br />
Measure<br />
-70 -60 -50 -40 -30 -20 -10 0 +10+20 +30 +40 +50 +60 +70<br />
Child population (aged 0-15) 894 22.5 % +25<br />
Adult population (aged 16-64) 2,514 63.3 % -4<br />
Elderly population (aged 65+) 564 14.2 % -13<br />
Minority ethnic groups 35 0.8 % -61 2001 2<br />
Asylum Seekers n/a n/a % G 2007 3<br />
Life expectancy - males - 69.3 yrs -6<br />
Life expectancy - females - 77.1 yrs -3<br />
01-05 4<br />
Live births 62 1.6 cr +44 2006 5<br />
Households - Single adults n/a n/a % G<br />
Single parents n/a n/a %* G<br />
2005 6<br />
Deaths all ages (5 yrs) 2 244 997.8 sr +27<br />
Coronary heart disease deaths in under 75s (5 yrs) 2 22 121.2 sr +58<br />
Cancer deaths in under 75s (5 yrs) 2 46 252.7 sr +72<br />
01-05 7<br />
Cerebrovascular disease deaths in under 75s (5 yrs) 2 5 26.4 sr +9<br />
Alcohol related and attributable hospital patients 3 53 1,343.8 sr +143 04-06 8<br />
Alcohol related deaths (5 yrs) 2 11 59.6 sr +120 01-05 9<br />
Estimated smokers (16+) 1,154 34.1 % +25 03-04 10<br />
Drug related hospital patients 3 1-4 87.0 sr +12 04-06 11<br />
Drug related deaths (10 yrs) 4 4 89.3 cr2 +41 97-06 12<br />
Patients registered with cancer 3 24 492.9 sr +17 02-04 13<br />
Heart disease patients 3 43 896.0 sr +26<br />
Cerebrovascular disease patients 3 12 249.9 sr +33<br />
Emergency medical admission patients 3 340 7,625.8 sr +22 04-06 14<br />
Multiple admission patients 3 68 1,453.1 sr +19<br />
Unintentional Injury patients 3 49 1,169.8 sr +16<br />
Patients prescribed statins 988 21.6 % +18 2006 15<br />
Road accident casualties - adults 3 1-4 1.4 cr3 -65 01-04 16<br />
Assault discharges 3 5 1.3 cr3 +27 04-06 17<br />
Suicide (5 yrs) 2 7 36.6 sr +133 01-05 18<br />
Self assessed health (classified as "Not Good") 623 13.9 % +37 2001 19<br />
First hospital admission - psychiatric 3 19 443.2 sr +73 02-04 20<br />
Patients prescribed drugs <strong>for</strong> anxiety /depression 414 9.1 % +12 2006 21<br />
Incapacity Benefit & SDA Claimants 390 16.0 % +66 2007 22<br />
Long-term limiting illness 1,122 25.1 % +24 2001 23<br />
Clients aged 0-15 98 11.0 % G* +53<br />
Clients aged 16-64 286 11.4 % G* +154 2007 24<br />
Clients aged 65+ 147 26.1 % G* +47<br />
'Income deprivedʼ 1,138 28.0 % +102 2006 25<br />
ʻEmployment deprivedʼ 569 23.3 % +81 2006 26<br />
Workless 670 27.4 % +87 2006 27<br />
JSA - Unemployment 125 5.1 % +83 2007 28<br />
Households without access to car/van 944 48.1 % +41 2001 29<br />
Children in workless households 395 34.1 % +86 2001 30<br />
Social grade E - benefit, unemployed, lowest grade work 1,121 33.1 % +48 2001 31<br />
Workplaces 55 22.5 cr3 -58 2005 32<br />
Employees 5 600 23.1 cr -69 2005 33<br />
Primary school attendance - 91.3 % -4 05/06 34<br />
S4 Pupils with 5+ GCSE equivalents 32 52.5 % -9 05/06 35<br />
Adults without qualifications 1,370 44.5 % +34 2001 36<br />
Serious violent crime 3 9 22.2 cr4 +51 04-06 37<br />
Domestic abuse incidents 3 52 128.1 cr4 +50 04-06 38<br />
Vandalism 3 145 357.2 cr4 G GC +32 04-06 39<br />
Drug Offenders 3 47 116.6 cr4 G GC +16 04-06 40<br />
Housing type - tenements n/a n/a % G 2006 41<br />
House prices - 84,530 £ -37 2006 42<br />
Housing tenure - Owner Occupiers n/a n/a % G 2007 43<br />
Overcrowding 326 16.6 % +42 2001 44<br />
Travelling to work by foot/bike or public transport 1,303 52.7 % +18 2001 45<br />
Smoking during pregnancy (3 yrs) 2 59 33.7 % +39 02-04 46<br />
Breastfeeding (at 6 - 8 week review) 6 12.6 % -65 04-06 47<br />
Low birth-weight babies ( 3 yrs) 2 1-4 2.6 % +7 02-04 48<br />
Immunisation uptake at 24 mths - MMR - 88.6 % -2<br />
04-06 50<br />
-all excl. MMR - 98.9 % +3<br />
Dental hospital admissions <strong>for</strong> children 3 17 1.8 cr +59 03-06 51<br />
Teenage pregnancy - under 18 years (3 yrs) 2 27 87.4 cr3 +116 02-04 52<br />
Road accident casualties - children 3 1-4 4.6 cr3 +64 01-04 16<br />
-70 -60 -50 -40 -30 -20 -10 0 +10+20 +30 +40 +50 +60 +70<br />
-<br />
(Below) Scottish Average (%) 1 (Above)<br />
+<br />
Time<br />
Period<br />
2006<br />
Defn<br />
1<br />
Notes<br />
Key<br />
1. The graph shows the "measure" (e.g. crude rate, percentage, years of life) expressed as a percentage below or above the Scottish measure, but using a range from a minimum of -70% to<br />
a maximum of +70% only. The actual plus/minus percentage value is shown in bold to the right of the graph. This is calculated as the area 'measure' minus the Scottish measure, divided by<br />
Scottish measure and multiplied by 100.<br />
2. Numbers presented over a period of years (e.g. 5 years <strong>for</strong> mortality) but rates are annual average rates.<br />
3. Average annual numbers and rates. 4. Numbers and rates presented over a period of years (e.g. 10 years <strong>for</strong> drug deaths).<br />
5. Employee numbers based on location of business, not residence area of employees.<br />
cr - crude rate per 100 population; cr2 - crude rate per 100,000 population; cr3 - crude rate per 1,000 resident population; cr4 - crude rate per 10,000 resident population; cr5 - crude rate per<br />
1,000 live births; sr - age-sex standardised rate per 100,000 population; yrs - years; %* - single parent households as % of households with children. Defn - see table of definitions & sources<br />
The 6th column of the spine chart indicates where an indicator is not compared to the Scottish average but with a local alternative: G - <strong>Glasgow</strong> City average; G* - average of <strong>Glasgow</strong>, E &<br />
W <strong>Dunbartonshire</strong>, Renfrewshire & <strong>East</strong> Renfrewshire; GGC - Greater <strong>Glasgow</strong> and Clyde (excluding Lanarkshire parts); shading on an indicator bar also indicates where a 'local' comparator<br />
is used.<br />
n/a: data not available (usually due to lack of coverage) or cannot be calculated. In addition, <strong>for</strong> particular indicators where the number of cases is below five and not zero, the range is shown<br />
i.e. '1-4'. NB If the number of teenage pregnancies is in the range '1-4' the rate is suppressed to avoid possible disclosure.<br />
A Community <strong>Health</strong> and Wellbeing Profile <strong>for</strong> <strong>East</strong> <strong>Dunbartonshire</strong> 33
Kessington <strong>East</strong><br />
Key: Kessington <strong>East</strong> 95% Confidence Intervals Scotland<br />
100<br />
Male Life Expectancy<br />
100<br />
Female Life Expectancy<br />
95<br />
95<br />
Life expectancy in years<br />
90<br />
85<br />
80<br />
75<br />
70<br />
65<br />
78.2<br />
81.1<br />
Life expectancy in years<br />
90<br />
85<br />
80<br />
75<br />
70<br />
65<br />
83.8<br />
84.8<br />
60<br />
60<br />
55<br />
1994-1998 1996-2000 1999-2003 2001-2005<br />
55<br />
1994-1998 1996-2000 1999-2003 2001-2005<br />
2000<br />
1500<br />
1000<br />
500<br />
0<br />
<strong>Population</strong> by Age Group<br />
0 - 15 years 16 - 44 years<br />
45 - 64 years 65 years and over<br />
1996 1997 1998 1999 2000 2001 2002 2003 2004 2005 2006<br />
911<br />
887<br />
529<br />
525<br />
% workless of working age population<br />
35%<br />
30%<br />
25%<br />
20%<br />
15%<br />
10%<br />
5%<br />
0%<br />
Worklessness<br />
6.1%<br />
5.0%<br />
1999 2000 2001 2002 2003 2004 2005 2006<br />
% of mothers breastfeeding at 6/8 weeks<br />
85<br />
80<br />
75<br />
70<br />
65<br />
60<br />
55<br />
50<br />
45<br />
40<br />
35<br />
30<br />
25<br />
20<br />
15<br />
10<br />
5<br />
0<br />
Breast Feeding<br />
61.3<br />
61.4<br />
97-99 98-00 99-01 00-02 01-03 02-04 03-05 04-06<br />
Age/sex standardised rate per 100,000 pop<br />
1800<br />
1600<br />
1400<br />
1200<br />
1000<br />
800<br />
600<br />
400<br />
200<br />
0<br />
Hospital Patients with Alcohol Attributable &<br />
Related Conditions<br />
393<br />
97-99 98-00 99-01 00-02 01-03 02-04 03-05 04-06<br />
326<br />
Age/sex standardised rate per 100,000 pop<br />
1600<br />
1400<br />
1200<br />
1000<br />
800<br />
600<br />
400<br />
200<br />
0<br />
Heart Disease Hospital Patients<br />
551<br />
459<br />
96-98 97-99 98-00 99-01 00-02 01-03 02-04 03-05 04-06<br />
Age/sex standardised rate per 100,000 pop<br />
10000<br />
9000<br />
8000<br />
7000<br />
6000<br />
5000<br />
4000<br />
3000<br />
2000<br />
1000<br />
0<br />
Emergency Medical Admission Patients<br />
4146<br />
4018<br />
96-98 97-99 98-00 99-01 00-02 01-03 02-04 03-05 04-06<br />
NB PLEASE NOTE THAT IN SOME CASES RATES/PERCENTAGES MAY BE BASED ON SMALL NUMBERS.<br />
34
<strong>Population</strong> Demographics<br />
Mortality<br />
Drugs,<br />
Alcohol and<br />
Smoking<br />
Social<br />
Crime Prosperity - Poverty<br />
Hospitalisation & Injury<br />
Mental <strong>Health</strong> &<br />
Function<br />
Work<br />
Education<br />
Housing &<br />
Transport<br />
Child & Maternal<br />
<strong>Health</strong><br />
Indicator<br />
Kessington <strong>East</strong><br />
Number<br />
Measure<br />
-70 -60 -50 -40 -30 -20 -10 0 +10+20 +30 +40 +50 +60 +70<br />
Child population (aged 0-15) 525 18.4 % +2<br />
Adult population (aged 16-64) 1,798 63.0 % -4<br />
Elderly population (aged 65+) 529 18.5 % +13<br />
Minority ethnic groups 248 8.6 % +329 2001 2<br />
Asylum Seekers n/a n/a % G 2007 3<br />
Life expectancy - males - 81.1 yrs +10<br />
Life expectancy - females - 84.8 yrs +7<br />
01-05 4<br />
Live births 23 0.8 cr -26 2006 5<br />
Households - Single adults n/a n/a % G<br />
Single parents n/a n/a %* G<br />
2005 6<br />
Deaths all ages (5 yrs) 2 104 501.3 sr -36<br />
Coronary heart disease deaths in under 75s (5 yrs) 2 0 0.0 sr -100<br />
Cancer deaths in under 75s (5 yrs) 2 19 96.5 sr -34<br />
01-05 7<br />
Cerebrovascular disease deaths in under 75s (5 yrs) 2 3 16.1 sr -33<br />
Alcohol related and attributable hospital patients 3 13 325.9 sr -18 04-06 8<br />
Alcohol related deaths (5 yrs) 2 2 9.6 sr -65 01-05 9<br />
Estimated smokers (16+) 262 11.1 % -59 03-04 10<br />
Drug related hospital patients 3 0 0.0 sr -100 04-06 11<br />
Drug related deaths (10 yrs) 4 0 0.0 cr2 -100 97-06 12<br />
Patients registered with cancer 3 17 449.2 sr +7 02-04 13<br />
Heart disease patients 3 20 458.7 sr -36<br />
Cerebrovascular disease patients 3 7 140.1 sr -26<br />
Emergency medical admission patients 3 135 4,018.5 sr -36 04-06 14<br />
Multiple admission patients 3 23 635.6 sr -48<br />
Unintentional Injury patients 3 21 665.3 sr -34<br />
Patients prescribed statins 588 19.1 % +5 2006 15<br />
Road accident casualties - adults 3 12 5.2 cr3 +29 01-04 16<br />
Assault discharges 3 0 0.0 cr3 -100 04-06 17<br />
Suicide (5 yrs) 2 1 4.9 sr -69 01-05 18<br />
Self assessed health (classified as "Not Good") 173 6.0 % -41 2001 19<br />
First hospital admission - psychiatric 3 3 93.4 sr -64 02-04 20<br />
Patients prescribed drugs <strong>for</strong> anxiety /depression 224 7.3 % -10 2006 21<br />
Incapacity Benefit & SDA Claimants 50 2.9 % -70 2007 22<br />
Long-term limiting illness 359 12.5 % -39 2001 23<br />
Clients aged 0-15 13 2.5 % G* -65<br />
Clients aged 16-64 33 1.8 % G* -59 2007 24<br />
Clients aged 65+ 41 7.8 % G* -56<br />
'Income deprivedʼ 84 3.0 % -79 2006 25<br />
ʻEmployment deprivedʼ 81 4.9 % -62 2006 26<br />
Workless 85 5.0 % -66 2006 27<br />
JSA - Unemployment 20 1.2 % -57 2007 28<br />
Households without access to car/van 97 8.8 % -74 2001 29<br />
Children in workless households 24 3.7 % -80 2001 30<br />
Social grade E - benefit, unemployed, lowest grade work 248 10.5 % -53 2001 31<br />
Workplaces 58 34.8 cr3 -36 2005 32<br />
Employees 5 400 24.5 cr -67 2005 33<br />
Primary school attendance - 95.6 % +1 05/06 34<br />
S4 Pupils with 5+ GCSE equivalents 22 84.6 % +46 05/06 35<br />
Adults without qualifications 350 16.1 % -52 2001 36<br />
Serious violent crime 3 1 3.6 cr4 -76 04-06 37<br />
Domestic abuse incidents 3 3 9.5 cr4 -89 04-06 38<br />
Vandalism 3 38 135.1 cr4 G GC -50 04-06 39<br />
Drug Offenders 3 1-4 8.3 cr4 G GC -92 04-06 40<br />
Housing type - tenements n/a n/a % G 2006 41<br />
House prices - 261,289 £ +95 2006 42<br />
Housing tenure - Owner Occupiers n/a n/a % G 2007 43<br />
Overcrowding 30 2.7 % -77 2001 44<br />
Travelling to work by foot/bike or public transport 644 34.4 % -23 2001 45<br />
Smoking during pregnancy (3 yrs) 2 5 7.5 % -69 02-04 46<br />
Breastfeeding (at 6 - 8 week review) 17 61.4 % +69 04-06 47<br />
Low birth-weight babies ( 3 yrs) 2 1-4 4.5 % +85 02-04 48<br />
Immunisation uptake at 24 mths - MMR - 91.9 % +2<br />
04-06 50<br />
-all excl. MMR - 98.8 % +3<br />
Dental hospital admissions <strong>for</strong> children 3 1-4 0.4 cr -66 03-06 51<br />
Teenage pregnancy - under 18 years (3 yrs) 2 0 0.0 cr3 -100 02-04 52<br />
Road accident casualties - children 3 1-4 2.0 cr3 -30 01-04 16<br />
-70 -60 -50 -40 -30 -20 -10 0 +10+20 +30 +40 +50 +60 +70<br />
-<br />
(Below) Scottish Average (%) 1 (Above)<br />
+<br />
Time<br />
Period<br />
2006<br />
Defn<br />
1<br />
Notes<br />
Key<br />
1. The graph shows the "measure" (e.g. crude rate, percentage, years of life) expressed as a percentage below or above the Scottish measure, but using a range from a minimum of -70% to<br />
a maximum of +70% only. The actual plus/minus percentage value is shown in bold to the right of the graph. This is calculated as the area 'measure' minus the Scottish measure, divided by<br />
Scottish measure and multiplied by 100.<br />
2. Numbers presented over a period of years (e.g. 5 years <strong>for</strong> mortality) but rates are annual average rates.<br />
3. Average annual numbers and rates. 4. Numbers and rates presented over a period of years (e.g. 10 years <strong>for</strong> drug deaths).<br />
5. Employee numbers based on location of business, not residence area of employees.<br />
cr - crude rate per 100 population; cr2 - crude rate per 100,000 population; cr3 - crude rate per 1,000 resident population; cr4 - crude rate per 10,000 resident population; cr5 - crude rate per<br />
1,000 live births; sr - age-sex standardised rate per 100,000 population; yrs - years; %* - single parent households as % of households with children. Defn - see table of definitions & sources<br />
The 6th column of the spine chart indicates where an indicator is not compared to the Scottish average but with a local alternative: G - <strong>Glasgow</strong> City average; G* - average of <strong>Glasgow</strong>, E &<br />
W <strong>Dunbartonshire</strong>, Renfrewshire & <strong>East</strong> Renfrewshire; GGC - Greater <strong>Glasgow</strong> and Clyde (excluding Lanarkshire parts); shading on an indicator bar also indicates where a 'local' comparator<br />
is used.<br />
n/a: data not available (usually due to lack of coverage) or cannot be calculated. In addition, <strong>for</strong> particular indicators where the number of cases is below five and not zero, the range is shown<br />
i.e. '1-4'. NB If the number of teenage pregnancies is in the range '1-4' the rate is suppressed to avoid possible disclosure.<br />
A Community <strong>Health</strong> and Wellbeing Profile <strong>for</strong> <strong>East</strong> <strong>Dunbartonshire</strong> 35
Kessington West<br />
Key: Kessington West 95% Confidence Intervals Scotland<br />
100<br />
Male Life Expectancy<br />
100<br />
Female Life Expectancy<br />
95<br />
95<br />
Life expectancy in years<br />
90<br />
85<br />
80<br />
75<br />
70<br />
65<br />
76.5<br />
79.5<br />
Life expectancy in years<br />
90<br />
85<br />
80<br />
75<br />
70<br />
65<br />
83.4<br />
84.0<br />
60<br />
60<br />
55<br />
1994-1998 1996-2000 1999-2003 2001-2005<br />
55<br />
1994-1998 1996-2000 1999-2003 2001-2005<br />
2000<br />
1500<br />
1000<br />
500<br />
0<br />
<strong>Population</strong> by Age Group<br />
0 - 15 years 16 - 44 years<br />
45 - 64 years 65 years and over<br />
1996 1997 1998 1999 2000 2001 2002 2003 2004 2005 2006<br />
1006<br />
908<br />
797<br />
511<br />
% workless of working age population<br />
35%<br />
30%<br />
25%<br />
20%<br />
15%<br />
10%<br />
5%<br />
0%<br />
Worklessness<br />
5.4%<br />
3.9%<br />
1999 2000 2001 2002 2003 2004 2005 2006<br />
% of mothers breastfeeding at 6/8 weeks<br />
85<br />
80<br />
75<br />
70<br />
65<br />
60<br />
55<br />
50<br />
45<br />
40<br />
35<br />
30<br />
25<br />
20<br />
15<br />
10<br />
5<br />
0<br />
Breast Feeding<br />
75.0<br />
63.0<br />
97-99 98-00 99-01 00-02 01-03 02-04 03-05 04-06<br />
Age/sex standardised rate per 100,000 pop<br />
1800<br />
1600<br />
1400<br />
1200<br />
1000<br />
800<br />
600<br />
400<br />
200<br />
0<br />
Hospital Patients with Alcohol Attributable &<br />
Related Conditions<br />
401<br />
97-99 98-00 99-01 00-02 01-03 02-04 03-05 04-06<br />
277<br />
Age/sex standardised rate per 100,000 pop<br />
1600<br />
1400<br />
1200<br />
1000<br />
800<br />
600<br />
400<br />
200<br />
0<br />
Heart Disease Hospital Patients<br />
641<br />
526<br />
96-98 97-99 98-00 99-01 00-02 01-03 02-04 03-05 04-06<br />
Age/sex standardised rate per 100,000 pop<br />
10000<br />
9000<br />
8000<br />
7000<br />
6000<br />
5000<br />
4000<br />
3000<br />
2000<br />
1000<br />
0<br />
Emergency Medical Admission Patients<br />
3798<br />
3657<br />
96-98 97-99 98-00 99-01 00-02 01-03 02-04 03-05 04-06<br />
NB PLEASE NOTE THAT IN SOME CASES RATES/PERCENTAGES MAY BE BASED ON SMALL NUMBERS.<br />
36
<strong>Population</strong> Demographics<br />
Mortality<br />
Drugs,<br />
Alcohol and<br />
Smoking<br />
Social<br />
Crime Prosperity - Poverty<br />
Hospitalisation & Injury<br />
Mental <strong>Health</strong> &<br />
Function<br />
Work<br />
Education<br />
Housing &<br />
Transport<br />
Child & Maternal<br />
<strong>Health</strong><br />
Indicator<br />
Kessington West<br />
Number<br />
Measure<br />
-70 -60 -50 -40 -30 -20 -10 0 +10+20 +30 +40 +50 +60 +70<br />
Child population (aged 0-15) 511 15.9 % -12<br />
Adult population (aged 16-64) 1,914 59.4 % -9<br />
Elderly population (aged 65+) 797 24.7 % +51<br />
Minority ethnic groups 143 4.3 % +114 2001 2<br />
Asylum Seekers n/a n/a % G 2007 3<br />
Life expectancy - males - 79.5 yrs +8<br />
Life expectancy - females - 84.0 yrs +6<br />
01-05 4<br />
Live births 31 1.0 cr -11 2006 5<br />
Households - Single adults n/a n/a % G<br />
Single parents n/a n/a %* G<br />
2005 6<br />
Deaths all ages (5 yrs) 2 179 472.7 sr -40<br />
Coronary heart disease deaths in under 75s (5 yrs) 2 5 18.1 sr -76<br />
Cancer deaths in under 75s (5 yrs) 2 20 90.4 sr -38<br />
01-05 7<br />
Cerebrovascular disease deaths in under 75s (5 yrs) 2 2 7.0 sr -71<br />
Alcohol related and attributable hospital patients 3 16 276.7 sr -30 04-06 8<br />
Alcohol related deaths (5 yrs) 2 2 10.7 sr -60 01-05 9<br />
Estimated smokers (16+) 300 10.8 % -60 03-04 10<br />
Drug related hospital patients 3 1-4 15.4 sr -80 04-06 11<br />
Drug related deaths (10 yrs) 4 0 0.0 cr2 -100 97-06 12<br />
Patients registered with cancer 3 26 513.5 sr +22 02-04 13<br />
Heart disease patients 3 34 526.3 sr -26<br />
Cerebrovascular disease patients 3 11 142.7 sr -24<br />
Emergency medical admission patients 3 183 3,657.2 sr -41 04-06 14<br />
Multiple admission patients 3 38 581.7 sr -52<br />
Unintentional Injury patients 3 29 597.1 sr -41<br />
Patients prescribed statins 657 18.7 % +3 2006 15<br />
Road accident casualties - adults 3 9 3.2 cr3 -20 01-04 16<br />
Assault discharges 3 1-4 0.2 cr3 -80 04-06 17<br />
Suicide (5 yrs) 2 1 10.2 sr -35 01-05 18<br />
Self assessed health (classified as "Not Good") 183 5.5 % -46 2001 19<br />
First hospital admission - psychiatric 3 5 120.4 sr -53 02-04 20<br />
Patients prescribed drugs <strong>for</strong> anxiety /depression 233 6.6 % -18 2006 21<br />
Incapacity Benefit & SDA Claimants 50 2.8 % -71 2007 22<br />
Long-term limiting illness 524 15.8 % -22 2001 23<br />
Clients aged 0-15 8 1.6 % G* -78<br />
Clients aged 16-64 22 1.1 % G* -74 2007 24<br />
Clients aged 65+ 89 11.2 % G* -37<br />
'Income deprivedʼ 87 2.7 % -81 2006 25<br />
ʻEmployment deprivedʼ 64 3.5 % -73 2006 26<br />
Workless 70 3.9 % -74 2006 27<br />
JSA - Unemployment 30 1.6 % -41 2007 28<br />
Households without access to car/van 116 8.9 % -74 2001 29<br />
Children in workless households 28 4.3 % -77 2001 30<br />
Social grade E - benefit, unemployed, lowest grade work 267 9.7 % -57 2001 31<br />
Workplaces 115 62.8 cr3 +16 2005 32<br />
Employees 5 900 50.6 cr -32 2005 33<br />
Primary school attendance - 94.8 % 0 05/06 34<br />
S4 Pupils with 5+ GCSE equivalents 26 89.7 % +55 05/06 35<br />
Adults without qualifications 350 14.5 % -56 2001 36<br />
Serious violent crime 3 1 2.0 cr4 -86 04-06 37<br />
Domestic abuse incidents 3 3 9.2 cr4 -89 04-06 38<br />
Vandalism 3 34 105.1 cr4 G GC -61 04-06 39<br />
Drug Offenders 3 1-4 11.2 cr4 G GC -89 04-06 40<br />
Housing type - tenements n/a n/a % G 2006 41<br />
House prices - 285,026 £ +113 2006 42<br />
Housing tenure - Owner Occupiers n/a n/a % G 2007 43<br />
Overcrowding 40 3.1 % -74 2001 44<br />
Travelling to work by foot/bike or public transport 679 34.4 % -23 2001 45<br />
Smoking during pregnancy (3 yrs) 2 1-4 3.2 % -87 02-04 46<br />
Breastfeeding (at 6 - 8 week review) 19 75.0 % +106 04-06 47<br />
Low birth-weight babies ( 3 yrs) 2 0 0.0 % -100 02-04 48<br />
Immunisation uptake at 24 mths - MMR - 87.6 % -3<br />
04-06 50<br />
-all excl. MMR - 93.3 % -3<br />
Dental hospital admissions <strong>for</strong> children 3 1-4 0.8 cr -30 03-06 51<br />
Teenage pregnancy - under 18 years (3 yrs) 2 0 0.0 cr3 -100 02-04 52<br />
Road accident casualties - children 3 1-4 2.3 cr3 -18 01-04 16<br />
-70 -60 -50 -40 -30 -20 -10 0 +10+20 +30 +40 +50 +60 +70<br />
-<br />
(Below) Scottish Average (%) 1 (Above)<br />
+<br />
Time<br />
Period<br />
2006<br />
Defn<br />
1<br />
Notes<br />
Key<br />
1. The graph shows the "measure" (e.g. crude rate, percentage, years of life) expressed as a percentage below or above the Scottish measure, but using a range from a minimum of -70% to<br />
a maximum of +70% only. The actual plus/minus percentage value is shown in bold to the right of the graph. This is calculated as the area 'measure' minus the Scottish measure, divided by<br />
Scottish measure and multiplied by 100.<br />
2. Numbers presented over a period of years (e.g. 5 years <strong>for</strong> mortality) but rates are annual average rates.<br />
3. Average annual numbers and rates. 4. Numbers and rates presented over a period of years (e.g. 10 years <strong>for</strong> drug deaths).<br />
5. Employee numbers based on location of business, not residence area of employees.<br />
cr - crude rate per 100 population; cr2 - crude rate per 100,000 population; cr3 - crude rate per 1,000 resident population; cr4 - crude rate per 10,000 resident population; cr5 - crude rate per<br />
1,000 live births; sr - age-sex standardised rate per 100,000 population; yrs - years; %* - single parent households as % of households with children. Defn - see table of definitions & sources<br />
The 6th column of the spine chart indicates where an indicator is not compared to the Scottish average but with a local alternative: G - <strong>Glasgow</strong> City average; G* - average of <strong>Glasgow</strong>, E &<br />
W <strong>Dunbartonshire</strong>, Renfrewshire & <strong>East</strong> Renfrewshire; GGC - Greater <strong>Glasgow</strong> and Clyde (excluding Lanarkshire parts); shading on an indicator bar also indicates where a 'local' comparator<br />
is used.<br />
n/a: data not available (usually due to lack of coverage) or cannot be calculated. In addition, <strong>for</strong> particular indicators where the number of cases is below five and not zero, the range is shown<br />
i.e. '1-4'. NB If the number of teenage pregnancies is in the range '1-4' the rate is suppressed to avoid possible disclosure.<br />
A Community <strong>Health</strong> and Wellbeing Profile <strong>for</strong> <strong>East</strong> <strong>Dunbartonshire</strong> 37
Keystone and Dougalston<br />
Key: Keystone and Dougalston 95% Confidence Intervals Scotland<br />
100<br />
Male Life Expectancy<br />
100<br />
Female Life Expectancy<br />
95<br />
95<br />
Life expectancy in years<br />
90<br />
85<br />
80<br />
75<br />
70<br />
65<br />
77.0<br />
75.9<br />
Life expectancy in years<br />
90<br />
85<br />
80<br />
75<br />
70<br />
65<br />
81.3<br />
85.5<br />
60<br />
60<br />
55<br />
1994-1998 1996-2000 1999-2003 2001-2005<br />
55<br />
1994-1998 1996-2000 1999-2003 2001-2005<br />
2000<br />
1500<br />
1000<br />
500<br />
0<br />
<strong>Population</strong> by Age Group<br />
0 - 15 years 16 - 44 years<br />
45 - 64 years 65 years and over<br />
1996 1997 1998 1999 2000 2001 2002 2003 2004 2005 2006<br />
1214<br />
1104<br />
1065<br />
574<br />
% workless of working age population<br />
35%<br />
30%<br />
25%<br />
20%<br />
15%<br />
10%<br />
5%<br />
0%<br />
Worklessness<br />
9.2%<br />
7.2%<br />
1999 2000 2001 2002 2003 2004 2005 2006<br />
% of mothers breastfeeding at 6/8 weeks<br />
85<br />
80<br />
75<br />
70<br />
65<br />
60<br />
55<br />
50<br />
45<br />
40<br />
35<br />
30<br />
25<br />
20<br />
15<br />
10<br />
5<br />
0<br />
Breast Feeding<br />
74.4<br />
65.1<br />
97-99 98-00 99-01 00-02 01-03 02-04 03-05 04-06<br />
Age/sex standardised rate per 100,000 pop<br />
1800<br />
1600<br />
1400<br />
1200<br />
1000<br />
800<br />
600<br />
400<br />
200<br />
0<br />
Hospital Patients with Alcohol Attributable &<br />
Related Conditions<br />
406<br />
97-99 98-00 99-01 00-02 01-03 02-04 03-05 04-06<br />
437<br />
Age/sex standardised rate per 100,000 pop<br />
1600<br />
1400<br />
1200<br />
1000<br />
800<br />
600<br />
400<br />
200<br />
0<br />
Heart Disease Hospital Patients<br />
781<br />
588<br />
96-98 97-99 98-00 99-01 00-02 01-03 02-04 03-05 04-06<br />
Age/sex standardised rate per 100,000 pop<br />
10000<br />
9000<br />
8000<br />
7000<br />
6000<br />
5000<br />
4000<br />
3000<br />
2000<br />
1000<br />
0<br />
Emergency Medical Admission Patients<br />
4426<br />
4264<br />
96-98 97-99 98-00 99-01 00-02 01-03 02-04 03-05 04-06<br />
NB PLEASE NOTE THAT IN SOME CASES RATES/PERCENTAGES MAY BE BASED ON SMALL NUMBERS.<br />
38
<strong>Population</strong> Demographics<br />
Mortality<br />
Drugs,<br />
Alcohol and<br />
Smoking<br />
Social<br />
Crime Prosperity - Poverty<br />
Hospitalisation & Injury<br />
Mental <strong>Health</strong> &<br />
Function<br />
Work<br />
Education<br />
Housing &<br />
Transport<br />
Child & Maternal<br />
<strong>Health</strong><br />
Indicator<br />
Keystone and Dougalston<br />
Number<br />
Measure<br />
-70 -60 -50 -40 -30 -20 -10 0 +10+20 +30 +40 +50 +60 +70<br />
Child population (aged 0-15) 574 14.5 % -19<br />
Adult population (aged 16-64) 2,279 57.6 % -12<br />
Elderly population (aged 65+) 1,104 27.9 % +70<br />
Minority ethnic groups 115 2.8 % +40 2001 2<br />
Asylum Seekers n/a n/a % G 2007 3<br />
Life expectancy - males - 75.9 yrs +3<br />
Life expectancy - females - 85.5 yrs +8<br />
01-05 4<br />
Live births 24 0.6 cr -44 2006 5<br />
Households - Single adults n/a n/a % G<br />
Single parents n/a n/a %* G<br />
2005 6<br />
Deaths all ages (5 yrs) 2 261 553.4 sr -30<br />
Coronary heart disease deaths in under 75s (5 yrs) 2 10 38.8 sr -49<br />
Cancer deaths in under 75s (5 yrs) 2 39 134.7 sr -8<br />
01-05 7<br />
Cerebrovascular disease deaths in under 75s (5 yrs) 2 5 15.4 sr -36<br />
Alcohol related and attributable hospital patients 3 28 436.8 sr -2 04-06 8<br />
Alcohol related deaths (5 yrs) 2 6 19.8 sr -27 01-05 9<br />
Estimated smokers (16+) 521 14.9 % -45 03-04 10<br />
Drug related hospital patients 3 0 0.0 sr -100 04-06 11<br />
Drug related deaths (10 yrs) 4 1 24.4 cr2 -61 97-06 12<br />
Patients registered with cancer 3 33 449.3 sr +7 02-04 13<br />
Heart disease patients 3 45 588.1 sr -18<br />
Cerebrovascular disease patients 3 14 160.2 sr -15<br />
Emergency medical admission patients 3 263 4,263.9 sr -32 04-06 14<br />
Multiple admission patients 3 53 748.6 sr -39<br />
Unintentional Injury patients 3 37 633.2 sr -37<br />
Patients prescribed statins 889 21.2 % +16 2006 15<br />
Road accident casualties - adults 3 21 6.1 cr3 +51 01-04 16<br />
Assault discharges 3 1-4 0.5 cr3 -51 04-06 17<br />
Suicide (5 yrs) 2 3 19.7 sr +25 01-05 18<br />
Self assessed health (classified as "Not Good") 324 7.9 % -22 2001 19<br />
First hospital admission - psychiatric 3 10 222.2 sr -13 02-04 20<br />
Patients prescribed drugs <strong>for</strong> anxiety /depression 265 6.3 % -22 2006 21<br />
Incapacity Benefit & SDA Claimants 110 5.1 % -47 2007 22<br />
Long-term limiting illness 772 18.8 % -7 2001 23<br />
Clients aged 0-15 13 2.3 % G* -68<br />
Clients aged 16-64 88 3.9 % G* -14 2007 24<br />
Clients aged 65+ 193 17.5 % G* -1<br />
'Income deprivedʼ 291 7.4 % -46 2006 25<br />
ʻEmployment deprivedʼ 150 7.1 % -44 2006 26<br />
Workless 155 7.2 % -51 2006 27<br />
JSA - Unemployment 20 1.0 % -66 2007 28<br />
Households without access to car/van 491 26.5 % -23 2001 29<br />
Children in workless households 37 5.0 % -73 2001 30<br />
Social grade E - benefit, unemployed, lowest grade work 615 17.7 % -21 2001 31<br />
Workplaces 201 95.8 cr3 +78 2005 32<br />
Employees 5 2,200 105.9 cr +41 2005 33<br />
Primary school attendance - 94.9 % 0 05/06 34<br />
S4 Pupils with 5+ GCSE equivalents 32 82.1 % +42 05/06 35<br />
Adults without qualifications 621 21.2 % -36 2001 36<br />
Serious violent crime 3 1 2.6 cr4 -83 04-06 37<br />
Domestic abuse incidents 3 11 27.3 cr4 -68 04-06 38<br />
Vandalism 3 57 145.6 cr4 G GC -46 04-06 39<br />
Drug Offenders 3 6 14.5 cr4 G GC -86 04-06 40<br />
Housing type - tenements n/a n/a % G 2006 41<br />
House prices - 212,419 £ +59 2006 42<br />
Housing tenure - Owner Occupiers n/a n/a % G 2007 43<br />
Overcrowding 125 6.7 % -43 2001 44<br />
Travelling to work by foot/bike or public transport 820 35.7 % -20 2001 45<br />
Smoking during pregnancy (3 yrs) 2 6 8.3 % -66 02-04 46<br />
Breastfeeding (at 6 - 8 week review) 21 74.4 % +104 04-06 47<br />
Low birth-weight babies ( 3 yrs) 2 1-4 2.8 % +14 02-04 48<br />
Immunisation uptake at 24 mths - MMR - 89.4 % -1<br />
04-06 50<br />
-all excl. MMR - 97.9 % +2<br />
Dental hospital admissions <strong>for</strong> children 3 1-4 0.6 cr -44 03-06 51<br />
Teenage pregnancy - under 18 years (3 yrs) 2 1-4 - cr3 02-04 52<br />
Road accident casualties - children 3 1-4 1.3 cr3 -52 01-04 16<br />
-70 -60 -50 -40 -30 -20 -10 0 +10+20 +30 +40 +50 +60 +70<br />
-<br />
(Below) Scottish Average (%) 1 (Above)<br />
+<br />
Time<br />
Period<br />
2006<br />
Defn<br />
1<br />
Notes<br />
Key<br />
1. The graph shows the "measure" (e.g. crude rate, percentage, years of life) expressed as a percentage below or above the Scottish measure, but using a range from a minimum of -70% to<br />
a maximum of +70% only. The actual plus/minus percentage value is shown in bold to the right of the graph. This is calculated as the area 'measure' minus the Scottish measure, divided by<br />
Scottish measure and multiplied by 100.<br />
2. Numbers presented over a period of years (e.g. 5 years <strong>for</strong> mortality) but rates are annual average rates.<br />
3. Average annual numbers and rates. 4. Numbers and rates presented over a period of years (e.g. 10 years <strong>for</strong> drug deaths).<br />
5. Employee numbers based on location of business, not residence area of employees.<br />
cr - crude rate per 100 population; cr2 - crude rate per 100,000 population; cr3 - crude rate per 1,000 resident population; cr4 - crude rate per 10,000 resident population; cr5 - crude rate per<br />
1,000 live births; sr - age-sex standardised rate per 100,000 population; yrs - years; %* - single parent households as % of households with children. Defn - see table of definitions & sources<br />
The 6th column of the spine chart indicates where an indicator is not compared to the Scottish average but with a local alternative: G - <strong>Glasgow</strong> City average; G* - average of <strong>Glasgow</strong>, E &<br />
W <strong>Dunbartonshire</strong>, Renfrewshire & <strong>East</strong> Renfrewshire; GGC - Greater <strong>Glasgow</strong> and Clyde (excluding Lanarkshire parts); shading on an indicator bar also indicates where a 'local' comparator<br />
is used.<br />
n/a: data not available (usually due to lack of coverage) or cannot be calculated. In addition, <strong>for</strong> particular indicators where the number of cases is below five and not zero, the range is shown<br />
i.e. '1-4'. NB If the number of teenage pregnancies is in the range '1-4' the rate is suppressed to avoid possible disclosure.<br />
A Community <strong>Health</strong> and Wellbeing Profile <strong>for</strong> <strong>East</strong> <strong>Dunbartonshire</strong> 39
Kilmardinny <strong>East</strong><br />
Key: Kilmardinny <strong>East</strong> 95% Confidence Intervals Scotland<br />
100<br />
Male Life Expectancy<br />
100<br />
Female Life Expectancy<br />
95<br />
95<br />
Life expectancy in years<br />
90<br />
85<br />
80<br />
75<br />
70<br />
65<br />
78.5<br />
82.3<br />
Life expectancy in years<br />
90<br />
85<br />
80<br />
75<br />
70<br />
65<br />
87.7<br />
84.6<br />
60<br />
60<br />
55<br />
1994-1998 1996-2000 1999-2003 2001-2005<br />
55<br />
1994-1998 1996-2000 1999-2003 2001-2005<br />
2000<br />
1500<br />
1000<br />
500<br />
0<br />
<strong>Population</strong> by Age Group<br />
0 - 15 years 16 - 44 years<br />
45 - 64 years 65 years and over<br />
1996 1997 1998 1999 2000 2001 2002 2003 2004 2005 2006<br />
901<br />
838<br />
578<br />
516<br />
% workless of working age population<br />
35%<br />
30%<br />
25%<br />
20%<br />
15%<br />
10%<br />
5%<br />
0%<br />
Worklessness<br />
5.3%<br />
4.6%<br />
1999 2000 2001 2002 2003 2004 2005 2006<br />
% of mothers breastfeeding at 6/8 weeks<br />
85<br />
80<br />
75<br />
70<br />
65<br />
60<br />
55<br />
50<br />
45<br />
40<br />
35<br />
30<br />
25<br />
20<br />
15<br />
10<br />
5<br />
0<br />
Breast Feeding<br />
68.0<br />
64.4<br />
97-99 98-00 99-01 00-02 01-03 02-04 03-05 04-06<br />
Age/sex standardised rate per 100,000 pop<br />
1800<br />
1600<br />
1400<br />
1200<br />
1000<br />
800<br />
600<br />
400<br />
200<br />
0<br />
Hospital Patients with Alcohol Attributable &<br />
Related Conditions<br />
297<br />
97-99 98-00 99-01 00-02 01-03 02-04 03-05 04-06<br />
267<br />
Age/sex standardised rate per 100,000 pop<br />
1600<br />
1400<br />
1200<br />
1000<br />
800<br />
600<br />
400<br />
200<br />
0<br />
Heart Disease Hospital Patients<br />
764<br />
478<br />
96-98 97-99 98-00 99-01 00-02 01-03 02-04 03-05 04-06<br />
Age/sex standardised rate per 100,000 pop<br />
10000<br />
9000<br />
8000<br />
7000<br />
6000<br />
5000<br />
4000<br />
3000<br />
2000<br />
1000<br />
0<br />
Emergency Medical Admission Patients<br />
4108<br />
3308<br />
96-98 97-99 98-00 99-01 00-02 01-03 02-04 03-05 04-06<br />
NB PLEASE NOTE THAT IN SOME CASES RATES/PERCENTAGES MAY BE BASED ON SMALL NUMBERS.<br />
40
<strong>Population</strong> Demographics<br />
Mortality<br />
Drugs,<br />
Alcohol and<br />
Smoking<br />
Social<br />
Crime Prosperity - Poverty<br />
Hospitalisation & Injury<br />
Mental <strong>Health</strong> &<br />
Function<br />
Work<br />
Education<br />
Housing &<br />
Transport<br />
Child & Maternal<br />
<strong>Health</strong><br />
Indicator<br />
Kilmardinny <strong>East</strong><br />
Number<br />
Measure<br />
-70 -60 -50 -40 -30 -20 -10 0 +10+20 +30 +40 +50 +60 +70<br />
Child population (aged 0-15) 516 18.2 % +1<br />
Adult population (aged 16-64) 1,739 61.4 % -6<br />
Elderly population (aged 65+) 578 20.4 % +25<br />
Minority ethnic groups 114 3.8 % +87 2001 2<br />
Asylum Seekers n/a n/a % G 2007 3<br />
Life expectancy - males - 82.3 yrs +11<br />
Life expectancy - females - 84.6 yrs +7<br />
01-05 4<br />
Live births 40 1.4 cr +30 2006 5<br />
Households - Single adults n/a n/a % G<br />
Single parents n/a n/a %* G<br />
2005 6<br />
Deaths all ages (5 yrs) 2 113 465.0 sr -41<br />
Coronary heart disease deaths in under 75s (5 yrs) 2 7 32.1 sr -58<br />
Cancer deaths in under 75s (5 yrs) 2 25 121.5 sr -17<br />
01-05 7<br />
Cerebrovascular disease deaths in under 75s (5 yrs) 2 3 13.4 sr -45<br />
Alcohol related and attributable hospital patients 3 11 266.6 sr -30 04-06 8<br />
Alcohol related deaths (5 yrs) 2 1 4.8 sr -82 01-05 9<br />
Estimated smokers (16+) 272 11.2 % -59 03-04 10<br />
Drug related hospital patients 3 0 0.0 sr -100 04-06 11<br />
Drug related deaths (10 yrs) 4 0 0.0 cr2 -100 97-06 12<br />
Patients registered with cancer 3 14 299.6 sr -29 02-04 13<br />
Heart disease patients 3 21 478.4 sr -33<br />
Cerebrovascular disease patients 3 6 105.6 sr -44<br />
Emergency medical admission patients 3 119 3,308.2 sr -47 04-06 14<br />
Multiple admission patients 3 22 564.0 sr -54<br />
Unintentional Injury patients 3 18 487.9 sr -52<br />
Patients prescribed statins 602 19.2 % +5 2006 15<br />
Road accident casualties - adults 3 1-4 1.3 cr3 -66 01-04 16<br />
Assault discharges 3 1-4 0.1 cr3 -89 04-06 17<br />
Suicide (5 yrs) 2 2 12.3 sr -22 01-05 18<br />
Self assessed health (classified as "Not Good") 167 5.5 % -46 2001 19<br />
First hospital admission - psychiatric 3 6 159.0 sr -38 02-04 20<br />
Patients prescribed drugs <strong>for</strong> anxiety /depression 200 6.4 % -21 2006 21<br />
Incapacity Benefit & SDA Claimants 50 3.0 % -68 2007 22<br />
Long-term limiting illness 406 13.4 % -34 2001 23<br />
Clients aged 0-15 0 0.0 % G* -100<br />
Clients aged 16-64 22 1.3 % G* -72 2007 24<br />
Clients aged 65+ 61 10.6 % G* -40<br />
'Income deprivedʼ 80 2.8 % -80 2006 25<br />
ʻEmployment deprivedʼ 77 4.6 % -64 2006 26<br />
Workless 75 4.6 % -69 2006 27<br />
JSA - Unemployment 20 1.2 % -57 2007 28<br />
Households without access to car/van 121 10.2 % -70 2001 29<br />
Children in workless households 21 3.1 % -83 2001 30<br />
Social grade E - benefit, unemployed, lowest grade work 247 10.2 % -55 2001 31<br />
Workplaces 69 41.2 cr3 -24 2005 32<br />
Employees 5 300 17.9 cr -76 2005 33<br />
Primary school attendance - 95.4 % 0 05/06 34<br />
S4 Pupils with 5+ GCSE equivalents 23 79.3 % +37 05/06 35<br />
Adults without qualifications 316 14.2 % -57 2001 36<br />
Serious violent crime 3 1 4.6 cr4 -69 04-06 37<br />
Domestic abuse incidents 3 3 9.2 cr4 -89 04-06 38<br />
Vandalism 3 19 64.5 cr4 G GC -76 04-06 39<br />
Drug Offenders 3 1-4 16.1 cr4 G GC -84 04-06 40<br />
Housing type - tenements n/a n/a % G 2006 41<br />
House prices - 254,217 £ +90 2006 42<br />
Housing tenure - Owner Occupiers n/a n/a % G 2007 43<br />
Overcrowding 28 2.4 % -80 2001 44<br />
Travelling to work by foot/bike or public transport 679 35.0 % -21 2001 45<br />
Smoking during pregnancy (3 yrs) 2 8 8.2 % -66 02-04 46<br />
Breastfeeding (at 6 - 8 week review) 22 64.4 % +77 04-06 47<br />
Low birth-weight babies ( 3 yrs) 2 1-4 1.1 % -53 02-04 48<br />
Immunisation uptake at 24 mths - MMR - 90.2 % 0<br />
04-06 50<br />
-all excl. MMR - 97.1 % +1<br />
Dental hospital admissions <strong>for</strong> children 3 1-4 0.2 cr -80 03-06 51<br />
Teenage pregnancy - under 18 years (3 yrs) 2 1-4 - cr3 02-04 52<br />
Road accident casualties - children 3 1-4 1.3 cr3 -52 01-04 16<br />
-70 -60 -50 -40 -30 -20 -10 0 +10+20 +30 +40 +50 +60 +70<br />
-<br />
(Below) Scottish Average (%) 1 (Above)<br />
+<br />
Time<br />
Period<br />
2006<br />
Defn<br />
1<br />
Notes<br />
Key<br />
1. The graph shows the "measure" (e.g. crude rate, percentage, years of life) expressed as a percentage below or above the Scottish measure, but using a range from a minimum of -70% to<br />
a maximum of +70% only. The actual plus/minus percentage value is shown in bold to the right of the graph. This is calculated as the area 'measure' minus the Scottish measure, divided by<br />
Scottish measure and multiplied by 100.<br />
2. Numbers presented over a period of years (e.g. 5 years <strong>for</strong> mortality) but rates are annual average rates.<br />
3. Average annual numbers and rates. 4. Numbers and rates presented over a period of years (e.g. 10 years <strong>for</strong> drug deaths).<br />
5. Employee numbers based on location of business, not residence area of employees.<br />
cr - crude rate per 100 population; cr2 - crude rate per 100,000 population; cr3 - crude rate per 1,000 resident population; cr4 - crude rate per 10,000 resident population; cr5 - crude rate per<br />
1,000 live births; sr - age-sex standardised rate per 100,000 population; yrs - years; %* - single parent households as % of households with children. Defn - see table of definitions & sources<br />
The 6th column of the spine chart indicates where an indicator is not compared to the Scottish average but with a local alternative: G - <strong>Glasgow</strong> City average; G* - average of <strong>Glasgow</strong>, E &<br />
W <strong>Dunbartonshire</strong>, Renfrewshire & <strong>East</strong> Renfrewshire; GGC - Greater <strong>Glasgow</strong> and Clyde (excluding Lanarkshire parts); shading on an indicator bar also indicates where a 'local' comparator<br />
is used.<br />
n/a: data not available (usually due to lack of coverage) or cannot be calculated. In addition, <strong>for</strong> particular indicators where the number of cases is below five and not zero, the range is shown<br />
i.e. '1-4'. NB If the number of teenage pregnancies is in the range '1-4' the rate is suppressed to avoid possible disclosure.<br />
A Community <strong>Health</strong> and Wellbeing Profile <strong>for</strong> <strong>East</strong> <strong>Dunbartonshire</strong> 41
Kilmardinny West<br />
Key: Kilmardinny West 95% Confidence Intervals Scotland<br />
100<br />
Male Life Expectancy<br />
100<br />
Female Life Expectancy<br />
95<br />
95<br />
Life expectancy in years<br />
90<br />
85<br />
80<br />
75<br />
70<br />
65<br />
78.9<br />
81.5<br />
Life expectancy in years<br />
90<br />
85<br />
80<br />
75<br />
70<br />
65<br />
80.1<br />
83.3<br />
60<br />
60<br />
55<br />
1994-1998 1996-2000 1999-2003 2001-2005<br />
55<br />
1994-1998 1996-2000 1999-2003 2001-2005<br />
2000<br />
1500<br />
1000<br />
500<br />
0<br />
<strong>Population</strong> by Age Group<br />
0 - 15 years 16 - 44 years<br />
45 - 64 years 65 years and over<br />
1996 1997 1998 1999 2000 2001 2002 2003 2004 2005 2006<br />
982<br />
960<br />
866<br />
635<br />
% workless of working age population<br />
35%<br />
30%<br />
25%<br />
20%<br />
15%<br />
10%<br />
5%<br />
0%<br />
Worklessness<br />
4.8%<br />
3.5%<br />
1999 2000 2001 2002 2003 2004 2005 2006<br />
% of mothers breastfeeding at 6/8 weeks<br />
85<br />
80<br />
75<br />
70<br />
65<br />
60<br />
55<br />
50<br />
45<br />
40<br />
35<br />
30<br />
25<br />
20<br />
15<br />
10<br />
5<br />
0<br />
Breast Feeding<br />
74.0<br />
75.5<br />
97-99 98-00 99-01 00-02 01-03 02-04 03-05 04-06<br />
Age/sex standardised rate per 100,000 pop<br />
1800<br />
1600<br />
1400<br />
1200<br />
1000<br />
800<br />
600<br />
400<br />
200<br />
0<br />
Hospital Patients with Alcohol Attributable &<br />
Related Conditions<br />
391<br />
97-99 98-00 99-01 00-02 01-03 02-04 03-05 04-06<br />
303<br />
Age/sex standardised rate per 100,000 pop<br />
1600<br />
1400<br />
1200<br />
1000<br />
800<br />
600<br />
400<br />
200<br />
0<br />
Heart Disease Hospital Patients<br />
659<br />
576<br />
96-98 97-99 98-00 99-01 00-02 01-03 02-04 03-05 04-06<br />
Age/sex standardised rate per 100,000 pop<br />
10000<br />
9000<br />
8000<br />
7000<br />
6000<br />
5000<br />
4000<br />
3000<br />
2000<br />
1000<br />
0<br />
Emergency Medical Admission Patients<br />
4405<br />
3541<br />
96-98 97-99 98-00 99-01 00-02 01-03 02-04 03-05 04-06<br />
NB PLEASE NOTE THAT IN SOME CASES RATES/PERCENTAGES MAY BE BASED ON SMALL NUMBERS.<br />
42
<strong>Population</strong> Demographics<br />
Mortality<br />
Drugs,<br />
Alcohol and<br />
Smoking<br />
Social<br />
Crime Prosperity - Poverty<br />
Hospitalisation & Injury<br />
Mental <strong>Health</strong> &<br />
Function<br />
Work<br />
Education<br />
Housing &<br />
Transport<br />
Child & Maternal<br />
<strong>Health</strong><br />
Indicator<br />
Kilmardinny West<br />
Number<br />
Measure<br />
-70 -60 -50 -40 -30 -20 -10 0 +10+20 +30 +40 +50 +60 +70<br />
Child population (aged 0-15) 635 18.4 % +2<br />
Adult population (aged 16-64) 1,942 56.4 % -14<br />
Elderly population (aged 65+) 866 25.2 % +54<br />
Minority ethnic groups 140 4.0 % +101 2001 2<br />
Asylum Seekers n/a n/a % G 2007 3<br />
Life expectancy - males - 81.5 yrs +10<br />
Life expectancy - females - 83.3 yrs +5<br />
01-05 4<br />
Live births 16 0.5 cr -57 2006 5<br />
Households - Single adults n/a n/a % G<br />
Single parents n/a n/a %* G<br />
2005 6<br />
Deaths all ages (5 yrs) 2 252 484.4 sr -38<br />
Coronary heart disease deaths in under 75s (5 yrs) 2 7 27.3 sr -64<br />
Cancer deaths in under 75s (5 yrs) 2 20 93.9 sr -36<br />
01-05 7<br />
Cerebrovascular disease deaths in under 75s (5 yrs) 2 1 3.4 sr -86<br />
Alcohol related and attributable hospital patients 3 18 303.1 sr -25 04-06 8<br />
Alcohol related deaths (5 yrs) 2 4 13.5 sr -50 01-05 9<br />
Estimated smokers (16+) 295 10.5 % -62 03-04 10<br />
Drug related hospital patients 3 1-4 14.6 sr -81 04-06 11<br />
Drug related deaths (10 yrs) 4 0 0.0 cr2 -100 97-06 12<br />
Patients registered with cancer 3 20 283.1 sr -33 02-04 13<br />
Heart disease patients 3 40 575.6 sr -19<br />
Cerebrovascular disease patients 3 13 144.8 sr -23<br />
Emergency medical admission patients 3 200 3,540.7 sr -43 04-06 14<br />
Multiple admission patients 3 42 604.0 sr -51<br />
Unintentional Injury patients 3 32 647.8 sr -36<br />
Patients prescribed statins 677 18.3 % 0 2006 15<br />
Road accident casualties - adults 3 7 2.3 cr3 -43 01-04 16<br />
Assault discharges 3 1-4 0.1 cr3 -91 04-06 17<br />
Suicide (5 yrs) 2 1 n/a sr 01-05 18<br />
Self assessed health (classified as "Not Good") 240 6.9 % -32 2001 19<br />
First hospital admission - psychiatric 3 6 123.4 sr -52 02-04 20<br />
Patients prescribed drugs <strong>for</strong> anxiety /depression 216 5.9 % -28 2006 21<br />
Incapacity Benefit & SDA Claimants 45 2.4 % -75 2007 22<br />
Long-term limiting illness 642 18.5 % -9 2001 23<br />
Clients aged 0-15 6 0.9 % G* -87<br />
Clients aged 16-64 27 1.4 % G* -69 2007 24<br />
Clients aged 65+ 118 13.6 % G* -23<br />
'Income deprivedʼ 154 4.4 % -68 2006 25<br />
ʻEmployment deprivedʼ 67 3.6 % -72 2006 26<br />
Workless 65 3.5 % -76 2006 27<br />
JSA - Unemployment 20 1.1 % -61 2007 28<br />
Households without access to car/van 235 16.8 % -51 2001 29<br />
Children in workless households 18 2.4 % -87 2001 30<br />
Social grade E - benefit, unemployed, lowest grade work 329 12.2 % -46 2001 31<br />
Workplaces 163 88.1 cr3 +63 2005 32<br />
Employees 5 1,100 59.4 cr -21 2005 33<br />
Primary school attendance - 96.0 % +1 05/06 34<br />
S4 Pupils with 5+ GCSE equivalents 27 77.1 % +34 05/06 35<br />
Adults without qualifications 274 11.7 % -65 2001 36<br />
Serious violent crime 3 2 4.8 cr4 -67 04-06 37<br />
Domestic abuse incidents 3 5 13.5 cr4 -84 04-06 38<br />
Vandalism 3 66 190.5 cr4 G GC -29 04-06 39<br />
Drug Offenders 3 8 24.1 cr4 G GC -76 04-06 40<br />
Housing type - tenements n/a n/a % G 2006 41<br />
House prices - 284,625 £ +113 2006 42<br />
Housing tenure - Owner Occupiers n/a n/a % G 2007 43<br />
Overcrowding 64 4.6 % -61 2001 44<br />
Travelling to work by foot/bike or public transport 731 36.4 % -18 2001 45<br />
Smoking during pregnancy (3 yrs) 2 9 13.8 % -43 02-04 46<br />
Breastfeeding (at 6 - 8 week review) 13 75.5 % +107 04-06 47<br />
Low birth-weight babies ( 3 yrs) 2 1-4 3.5 % +42 02-04 48<br />
Immunisation uptake at 24 mths - MMR - 89.8 % -1<br />
04-06 50<br />
-all excl. MMR - 96.6 % +1<br />
Dental hospital admissions <strong>for</strong> children 3 1-4 0.3 cr -69 03-06 51<br />
Teenage pregnancy - under 18 years (3 yrs) 2 1-4 - cr3 02-04 52<br />
Road accident casualties - children 3 1-4 0.8 cr3 -72 01-04 16<br />
-70 -60 -50 -40 -30 -20 -10 0 +10+20 +30 +40 +50 +60 +70<br />
-<br />
(Below) Scottish Average (%) 1 (Above)<br />
+<br />
Time<br />
Period<br />
2006<br />
Defn<br />
1<br />
Notes<br />
Key<br />
1. The graph shows the "measure" (e.g. crude rate, percentage, years of life) expressed as a percentage below or above the Scottish measure, but using a range from a minimum of -70% to<br />
a maximum of +70% only. The actual plus/minus percentage value is shown in bold to the right of the graph. This is calculated as the area 'measure' minus the Scottish measure, divided by<br />
Scottish measure and multiplied by 100.<br />
2. Numbers presented over a period of years (e.g. 5 years <strong>for</strong> mortality) but rates are annual average rates.<br />
3. Average annual numbers and rates. 4. Numbers and rates presented over a period of years (e.g. 10 years <strong>for</strong> drug deaths).<br />
5. Employee numbers based on location of business, not residence area of employees.<br />
cr - crude rate per 100 population; cr2 - crude rate per 100,000 population; cr3 - crude rate per 1,000 resident population; cr4 - crude rate per 10,000 resident population; cr5 - crude rate per<br />
1,000 live births; sr - age-sex standardised rate per 100,000 population; yrs - years; %* - single parent households as % of households with children. Defn - see table of definitions & sources<br />
The 6th column of the spine chart indicates where an indicator is not compared to the Scottish average but with a local alternative: G - <strong>Glasgow</strong> City average; G* - average of <strong>Glasgow</strong>, E &<br />
W <strong>Dunbartonshire</strong>, Renfrewshire & <strong>East</strong> Renfrewshire; GGC - Greater <strong>Glasgow</strong> and Clyde (excluding Lanarkshire parts); shading on an indicator bar also indicates where a 'local' comparator<br />
is used.<br />
n/a: data not available (usually due to lack of coverage) or cannot be calculated. In addition, <strong>for</strong> particular indicators where the number of cases is below five and not zero, the range is shown<br />
i.e. '1-4'. NB If the number of teenage pregnancies is in the range '1-4' the rate is suppressed to avoid possible disclosure.<br />
A Community <strong>Health</strong> and Wellbeing Profile <strong>for</strong> <strong>East</strong> <strong>Dunbartonshire</strong> 43
Kirkintilloch South<br />
Key: Kirkintilloch South 95% Confidence Intervals Scotland<br />
100<br />
Male Life Expectancy<br />
100<br />
Female Life Expectancy<br />
95<br />
95<br />
Life expectancy in years<br />
90<br />
85<br />
80<br />
75<br />
70<br />
65<br />
73.7<br />
77.4<br />
Life expectancy in years<br />
90<br />
85<br />
80<br />
75<br />
70<br />
65<br />
74.5<br />
80.2<br />
60<br />
60<br />
55<br />
1994-1998 1996-2000 1999-2003 2001-2005<br />
55<br />
1994-1998 1996-2000 1999-2003 2001-2005<br />
2000<br />
1500<br />
1000<br />
500<br />
0<br />
<strong>Population</strong> by Age Group<br />
0 - 15 years 16 - 44 years<br />
45 - 64 years 65 years and over<br />
1996 1997 1998 1999 2000 2001 2002 2003 2004 2005 2006<br />
1217<br />
896<br />
518<br />
495<br />
% workless of working age population<br />
35%<br />
30%<br />
25%<br />
20%<br />
15%<br />
10%<br />
5%<br />
0%<br />
Worklessness<br />
13.6%<br />
11.7%<br />
1999 2000 2001 2002 2003 2004 2005 2006<br />
% of mothers breastfeeding at 6/8 weeks<br />
85<br />
80<br />
75<br />
70<br />
65<br />
60<br />
55<br />
50<br />
45<br />
40<br />
35<br />
30<br />
25<br />
20<br />
15<br />
10<br />
5<br />
0<br />
Breast Feeding<br />
29.4<br />
23.6<br />
97-99 98-00 99-01 00-02 01-03 02-04 03-05 04-06<br />
Age/sex standardised rate per 100,000 pop<br />
1800<br />
1600<br />
1400<br />
1200<br />
1000<br />
800<br />
600<br />
400<br />
200<br />
0<br />
Hospital Patients with Alcohol Attributable &<br />
Related Conditions<br />
741<br />
97-99 98-00 99-01 00-02 01-03 02-04 03-05 04-06<br />
739<br />
Age/sex standardised rate per 100,000 pop<br />
1600<br />
1400<br />
1200<br />
1000<br />
800<br />
600<br />
400<br />
200<br />
0<br />
Heart Disease Hospital Patients<br />
1114<br />
701<br />
96-98 97-99 98-00 99-01 00-02 01-03 02-04 03-05 04-06<br />
Age/sex standardised rate per 100,000 pop<br />
10000<br />
9000<br />
8000<br />
7000<br />
6000<br />
5000<br />
4000<br />
3000<br />
2000<br />
1000<br />
0<br />
Emergency Medical Admission Patients<br />
6483<br />
5621<br />
96-98 97-99 98-00 99-01 00-02 01-03 02-04 03-05 04-06<br />
NB PLEASE NOTE THAT IN SOME CASES RATES/PERCENTAGES MAY BE BASED ON SMALL NUMBERS.<br />
44
<strong>Population</strong> Demographics<br />
Mortality<br />
Drugs,<br />
Alcohol and<br />
Smoking<br />
Social<br />
Crime Prosperity - Poverty<br />
Hospitalisation & Injury<br />
Mental <strong>Health</strong> &<br />
Function<br />
Work<br />
Education<br />
Housing &<br />
Transport<br />
Child & Maternal<br />
<strong>Health</strong><br />
Indicator<br />
Kirkintilloch South<br />
Number<br />
Measure<br />
-70 -60 -50 -40 -30 -20 -10 0 +10+20 +30 +40 +50 +60 +70<br />
Child population (aged 0-15) 495 15.8 % -12<br />
Adult population (aged 16-64) 2,113 67.6 % +3<br />
Elderly population (aged 65+) 518 16.6 % +1<br />
Minority ethnic groups 50 1.6 % -22 2001 2<br />
Asylum Seekers n/a n/a % G 2007 3<br />
Life expectancy - males - 77.4 yrs +5<br />
Life expectancy - females - 80.2 yrs +1<br />
01-05 4<br />
Live births 33 1.1 cr -3 2006 5<br />
Households - Single adults n/a n/a % G<br />
Single parents n/a n/a %* G<br />
2005 6<br />
Deaths all ages (5 yrs) 2 132 636.5 sr -19<br />
Coronary heart disease deaths in under 75s (5 yrs) 2 5 25.1 sr -67<br />
Cancer deaths in under 75s (5 yrs) 2 15 80.3 sr -45<br />
01-05 7<br />
Cerebrovascular disease deaths in under 75s (5 yrs) 2 5 28.6 sr +18<br />
Alcohol related and attributable hospital patients 3 26 738.6 sr +53 04-06 8<br />
Alcohol related deaths (5 yrs) 2 1 5.2 sr -81 01-05 9<br />
Estimated smokers (16+) 568 21.7 % -20 03-04 10<br />
Drug related hospital patients 3 1-4 43.0 sr -45 04-06 11<br />
Drug related deaths (10 yrs) 4 0 0.0 cr2 -100 97-06 12<br />
Patients registered with cancer 3 17 439.7 sr +5 02-04 13<br />
Heart disease patients 3 28 701.3 sr -2<br />
Cerebrovascular disease patients 3 5 134.5 sr -29<br />
Emergency medical admission patients 3 195 5,621.5 sr -10 04-06 14<br />
Multiple admission patients 3 40 1,113.9 sr -9<br />
Unintentional Injury patients 3 30 926.4 sr -8<br />
Patients prescribed statins 726 21.8 % +19 2006 15<br />
Road accident casualties - adults 3 11 4.1 cr3 +2 01-04 16<br />
Assault discharges 3 1-4 0.2 cr3 -79 04-06 17<br />
Suicide (5 yrs) 2 6 36.6 sr +133 01-05 18<br />
Self assessed health (classified as "Not Good") 305 9.5 % -6 2001 19<br />
First hospital admission - psychiatric 3 7 203.6 sr -20 02-04 20<br />
Patients prescribed drugs <strong>for</strong> anxiety /depression 292 8.8 % +8 2006 21<br />
Incapacity Benefit & SDA Claimants 175 8.5 % -11 2007 22<br />
Long-term limiting illness 646 20.1 % -1 2001 23<br />
Clients aged 0-15 29 5.9 % G* -18<br />
Clients aged 16-64 114 5.4 % G* +20 2007 24<br />
Clients aged 65+ 69 13.3 % G* -25<br />
'Income deprivedʼ 287 9.2 % -33 2006 25<br />
ʻEmployment deprivedʼ 216 10.9 % -15 2006 26<br />
Workless 240 11.7 % -20 2006 27<br />
JSA - Unemployment 40 2.0 % -28 2007 28<br />
Households without access to car/van 388 28.1 % -18 2001 29<br />
Children in workless households 72 10.4 % -43 2001 30<br />
Social grade E - benefit, unemployed, lowest grade work 553 21.1 % -6 2001 31<br />
Workplaces 66 33.2 cr3 -38 2005 32<br />
Employees 5 900 45.1 cr -40 2005 33<br />
Primary school attendance - 94.5 % 0 05/06 34<br />
S4 Pupils with 5+ GCSE equivalents 24 70.6 % +22 05/06 35<br />
Adults without qualifications 660 27.4 % -18 2001 36<br />
Serious violent crime 3 4 14.0 cr4 -5 04-06 37<br />
Domestic abuse incidents 3 7 23.6 cr4 -72 04-06 38<br />
Vandalism 3 83 266.3 cr4 G GC -1 04-06 39<br />
Drug Offenders 3 16 52.6 cr4 G GC -48 04-06 40<br />
Housing type - tenements n/a n/a % G 2006 41<br />
House prices - 102,265 £ -24 2006 42<br />
Housing tenure - Owner Occupiers n/a n/a % G 2007 43<br />
Overcrowding 156 11.3 % -4 2001 44<br />
Travelling to work by foot/bike or public transport 819 40.0 % -10 2001 45<br />
Smoking during pregnancy (3 yrs) 2 17 19.3 % -20 02-04 46<br />
Breastfeeding (at 6 - 8 week review) 6 23.6 % -35 04-06 47<br />
Low birth-weight babies ( 3 yrs) 2 1-4 1.4 % -45 02-04 48<br />
Immunisation uptake at 24 mths - MMR - 83.7 % -7<br />
04-06 50<br />
-all excl. MMR - 98.8 % +3<br />
Dental hospital admissions <strong>for</strong> children 3 1-4 0.7 cr -40 03-06 51<br />
Teenage pregnancy - under 18 years (3 yrs) 2 9 47.6 cr3 +18 02-04 52<br />
Road accident casualties - children 3 1-4 5.0 cr3 +78 01-04 16<br />
-70 -60 -50 -40 -30 -20 -10 0 +10+20 +30 +40 +50 +60 +70<br />
-<br />
(Below) Scottish Average (%) 1 (Above)<br />
+<br />
Time<br />
Period<br />
2006<br />
Defn<br />
1<br />
Notes<br />
Key<br />
1. The graph shows the "measure" (e.g. crude rate, percentage, years of life) expressed as a percentage below or above the Scottish measure, but using a range from a minimum of -70% to<br />
a maximum of +70% only. The actual plus/minus percentage value is shown in bold to the right of the graph. This is calculated as the area 'measure' minus the Scottish measure, divided by<br />
Scottish measure and multiplied by 100.<br />
2. Numbers presented over a period of years (e.g. 5 years <strong>for</strong> mortality) but rates are annual average rates.<br />
3. Average annual numbers and rates. 4. Numbers and rates presented over a period of years (e.g. 10 years <strong>for</strong> drug deaths).<br />
5. Employee numbers based on location of business, not residence area of employees.<br />
cr - crude rate per 100 population; cr2 - crude rate per 100,000 population; cr3 - crude rate per 1,000 resident population; cr4 - crude rate per 10,000 resident population; cr5 - crude rate per<br />
1,000 live births; sr - age-sex standardised rate per 100,000 population; yrs - years; %* - single parent households as % of households with children. Defn - see table of definitions & sources<br />
The 6th column of the spine chart indicates where an indicator is not compared to the Scottish average but with a local alternative: G - <strong>Glasgow</strong> City average; G* - average of <strong>Glasgow</strong>, E &<br />
W <strong>Dunbartonshire</strong>, Renfrewshire & <strong>East</strong> Renfrewshire; GGC - Greater <strong>Glasgow</strong> and Clyde (excluding Lanarkshire parts); shading on an indicator bar also indicates where a 'local' comparator<br />
is used.<br />
n/a: data not available (usually due to lack of coverage) or cannot be calculated. In addition, <strong>for</strong> particular indicators where the number of cases is below five and not zero, the range is shown<br />
i.e. '1-4'. NB If the number of teenage pregnancies is in the range '1-4' the rate is suppressed to avoid possible disclosure.<br />
A Community <strong>Health</strong> and Wellbeing Profile <strong>for</strong> <strong>East</strong> <strong>Dunbartonshire</strong> 45
Kirkintilloch West<br />
Key: Kirkintilloch West 95% Confidence Intervals Scotland<br />
100<br />
Male Life Expectancy<br />
100<br />
Female Life Expectancy<br />
95<br />
95<br />
Life expectancy in years<br />
90<br />
85<br />
80<br />
75<br />
70<br />
65<br />
72.3<br />
73.4<br />
Life expectancy in years<br />
90<br />
85<br />
80<br />
75<br />
70<br />
65<br />
78.3<br />
78.0<br />
60<br />
60<br />
55<br />
1994-1998 1996-2000 1999-2003 2001-2005<br />
55<br />
1994-1998 1996-2000 1999-2003 2001-2005<br />
3000<br />
2500<br />
2000<br />
1500<br />
1000<br />
500<br />
0<br />
<strong>Population</strong> by Age Group<br />
0 - 15 years 16 - 44 years<br />
45 - 64 years 65 years and over<br />
1996 1997 1998 1999 2000 2001 2002 2003 2004 2005 2006<br />
1465<br />
993<br />
784<br />
676<br />
% workless of working age population<br />
35%<br />
30%<br />
25%<br />
20%<br />
15%<br />
10%<br />
5%<br />
0%<br />
Worklessness<br />
15.3%<br />
14.1%<br />
1999 2000 2001 2002 2003 2004 2005 2006<br />
% of mothers breastfeeding at 6/8 weeks<br />
85<br />
80<br />
75<br />
70<br />
65<br />
60<br />
55<br />
50<br />
45<br />
40<br />
35<br />
30<br />
25<br />
20<br />
15<br />
10<br />
5<br />
0<br />
Breast Feeding<br />
31.3<br />
32.8<br />
97-99 98-00 99-01 00-02 01-03 02-04 03-05 04-06<br />
Age/sex standardised rate per 100,000 pop<br />
1800<br />
1600<br />
1400<br />
1200<br />
1000<br />
800<br />
600<br />
400<br />
200<br />
0<br />
Hospital Patients with Alcohol Attributable &<br />
Related Conditions<br />
763<br />
97-99 98-00 99-01 00-02 01-03 02-04 03-05 04-06<br />
764<br />
Age/sex standardised rate per 100,000 pop<br />
1600<br />
1400<br />
1200<br />
1000<br />
800<br />
600<br />
400<br />
200<br />
0<br />
Heart Disease Hospital Patients<br />
858<br />
624<br />
96-98 97-99 98-00 99-01 00-02 01-03 02-04 03-05 04-06<br />
Age/sex standardised rate per 100,000 pop<br />
10000<br />
9000<br />
8000<br />
7000<br />
6000<br />
5000<br />
4000<br />
3000<br />
2000<br />
1000<br />
0<br />
Emergency Medical Admission Patients<br />
6512<br />
5558<br />
96-98 97-99 98-00 99-01 00-02 01-03 02-04 03-05 04-06<br />
NB PLEASE NOTE THAT IN SOME CASES RATES/PERCENTAGES MAY BE BASED ON SMALL NUMBERS.<br />
46
<strong>Population</strong> Demographics<br />
Mortality<br />
Drugs,<br />
Alcohol and<br />
Smoking<br />
Social<br />
Crime Prosperity - Poverty<br />
Hospitalisation & Injury<br />
Mental <strong>Health</strong> &<br />
Function<br />
Work<br />
Education<br />
Housing &<br />
Transport<br />
Child & Maternal<br />
<strong>Health</strong><br />
Indicator<br />
Kirkintilloch West<br />
Number<br />
Measure<br />
-70 -60 -50 -40 -30 -20 -10 0 +10+20 +30 +40 +50 +60 +70<br />
Child population (aged 0-15) 676 17.3 % -4<br />
Adult population (aged 16-64) 2,458 62.7 % -4<br />
Elderly population (aged 65+) 784 20.0 % +22<br />
Minority ethnic groups 43 1.1 % -46 2001 2<br />
Asylum Seekers n/a n/a % G 2007 3<br />
Life expectancy - males - 73.4 yrs -1<br />
Life expectancy - females - 78.0 yrs -1<br />
01-05 4<br />
Live births 43 1.1 cr +1 2006 5<br />
Households - Single adults n/a n/a % G<br />
Single parents n/a n/a %* G<br />
2005 6<br />
Deaths all ages (5 yrs) 2 294 877.6 sr +12<br />
Coronary heart disease deaths in under 75s (5 yrs) 2 10 40.9 sr -47<br />
Cancer deaths in under 75s (5 yrs) 2 32 141.9 sr -3<br />
01-05 7<br />
Cerebrovascular disease deaths in under 75s (5 yrs) 2 11 46.4 sr +92<br />
Alcohol related and attributable hospital patients 3 36 764.4 sr +51 04-06 8<br />
Alcohol related deaths (5 yrs) 2 6 29.8 sr +10 01-05 9<br />
Estimated smokers (16+) 705 21.2 % -22 03-04 10<br />
Drug related hospital patients 3 1-4 34.5 sr -56 04-06 11<br />
Drug related deaths (10 yrs) 4 3 75.5 cr2 +20 97-06 12<br />
Patients registered with cancer 3 26 463.2 sr +10 02-04 13<br />
Heart disease patients 3 36 624.4 sr -12<br />
Cerebrovascular disease patients 3 8 127.8 sr -32<br />
Emergency medical admission patients 3 280 5,558.2 sr -11 04-06 14<br />
Multiple admission patients 3 55 959.0 sr -21<br />
Unintentional Injury patients 3 45 1,009.8 sr 0<br />
Patients prescribed statins 934 22.0 % +21 2006 15<br />
Road accident casualties - adults 3 18 5.4 cr3 +35 01-04 16<br />
Assault discharges 3 6 1.5 cr3 +46 04-06 17<br />
Suicide (5 yrs) 2 5 25.7 sr +64 01-05 18<br />
Self assessed health (classified as "Not Good") 483 12.2 % +20 2001 19<br />
First hospital admission - psychiatric 3 11 251.6 sr -2 02-04 20<br />
Patients prescribed drugs <strong>for</strong> anxiety /depression 399 9.4 % +16 2006 21<br />
Incapacity Benefit & SDA Claimants 230 9.8 % +2 2007 22<br />
Long-term limiting illness 841 21.2 % +4 2001 23<br />
Clients aged 0-15 24 3.6 % G* -50<br />
Clients aged 16-64 151 6.1 % G* +37 2007 24<br />
Clients aged 65+ 158 20.2 % G* +14<br />
'Income deprivedʼ 438 11.0 % -21 2006 25<br />
ʻEmployment deprivedʼ 296 12.4 % -3 2006 26<br />
Workless 330 14.1 % -4 2006 27<br />
JSA - Unemployment 55 2.3 % -17 2007 28<br />
Households without access to car/van 526 28.4 % -17 2001 29<br />
Children in workless households 69 9.6 % -48 2001 30<br />
Social grade E - benefit, unemployed, lowest grade work 570 17.7 % -21 2001 31<br />
Workplaces 421 176.5 cr3 +227 2005 32<br />
Employees 5 4,800 201.2 cr +168 2005 33<br />
Primary school attendance - 94.6 % 0 05/06 34<br />
S4 Pupils with 5+ GCSE equivalents 27 65.9 % +14 05/06 35<br />
Adults without qualifications 704 23.5 % -29 2001 36<br />
Serious violent crime 3 10 25.2 cr4 +72 04-06 37<br />
Domestic abuse incidents 3 25 63.0 cr4 -26 04-06 38<br />
Vandalism 3 119 300.6 cr4 G GC +11 04-06 39<br />
Drug Offenders 3 14 34.4 cr4 G GC -66 04-06 40<br />
Housing type - tenements n/a n/a % G 2006 41<br />
House prices - 120,798 £ -10 2006 42<br />
Housing tenure - Owner Occupiers n/a n/a % G 2007 43<br />
Overcrowding 180 9.7 % -17 2001 44<br />
Travelling to work by foot/bike or public transport 843 34.6 % -22 2001 45<br />
Smoking during pregnancy (3 yrs) 2 23 17.8 % -27 02-04 46<br />
Breastfeeding (at 6 - 8 week review) 13 32.8 % -10 04-06 47<br />
Low birth-weight babies ( 3 yrs) 2 1-4 1.7 % -31 02-04 48<br />
Immunisation uptake at 24 mths - MMR - 90.3 % 0<br />
04-06 50<br />
-all excl. MMR - 97.8 % +2<br />
Dental hospital admissions <strong>for</strong> children 3 7 1.0 cr -9 03-06 51<br />
Teenage pregnancy - under 18 years (3 yrs) 2 6 38.5 cr3 -5 02-04 52<br />
Road accident casualties - children 3 1-4 5.0 cr3 +81 01-04 16<br />
-70 -60 -50 -40 -30 -20 -10 0 +10+20 +30 +40 +50 +60 +70<br />
-<br />
(Below) Scottish Average (%) 1 (Above)<br />
+<br />
Time<br />
Period<br />
2006<br />
Defn<br />
1<br />
Notes<br />
Key<br />
1. The graph shows the "measure" (e.g. crude rate, percentage, years of life) expressed as a percentage below or above the Scottish measure, but using a range from a minimum of -70% to<br />
a maximum of +70% only. The actual plus/minus percentage value is shown in bold to the right of the graph. This is calculated as the area 'measure' minus the Scottish measure, divided by<br />
Scottish measure and multiplied by 100.<br />
2. Numbers presented over a period of years (e.g. 5 years <strong>for</strong> mortality) but rates are annual average rates.<br />
3. Average annual numbers and rates. 4. Numbers and rates presented over a period of years (e.g. 10 years <strong>for</strong> drug deaths).<br />
5. Employee numbers based on location of business, not residence area of employees.<br />
cr - crude rate per 100 population; cr2 - crude rate per 100,000 population; cr3 - crude rate per 1,000 resident population; cr4 - crude rate per 10,000 resident population; cr5 - crude rate per<br />
1,000 live births; sr - age-sex standardised rate per 100,000 population; yrs - years; %* - single parent households as % of households with children. Defn - see table of definitions & sources<br />
The 6th column of the spine chart indicates where an indicator is not compared to the Scottish average but with a local alternative: G - <strong>Glasgow</strong> City average; G* - average of <strong>Glasgow</strong>, E &<br />
W <strong>Dunbartonshire</strong>, Renfrewshire & <strong>East</strong> Renfrewshire; GGC - Greater <strong>Glasgow</strong> and Clyde (excluding Lanarkshire parts); shading on an indicator bar also indicates where a 'local' comparator<br />
is used.<br />
n/a: data not available (usually due to lack of coverage) or cannot be calculated. In addition, <strong>for</strong> particular indicators where the number of cases is below five and not zero, the range is shown<br />
i.e. '1-4'. NB If the number of teenage pregnancies is in the range '1-4' the rate is suppressed to avoid possible disclosure.<br />
A Community <strong>Health</strong> and Wellbeing Profile <strong>for</strong> <strong>East</strong> <strong>Dunbartonshire</strong> 47
Lennoxtown<br />
Key: Lennoxtown 95% Confidence Intervals Scotland<br />
100<br />
Male Life Expectancy<br />
100<br />
Female Life Expectancy<br />
95<br />
95<br />
Life expectancy in years<br />
90<br />
85<br />
80<br />
75<br />
70<br />
65<br />
68.9<br />
73.8<br />
Life expectancy in years<br />
90<br />
85<br />
80<br />
75<br />
70<br />
65<br />
72.3<br />
77.5<br />
60<br />
60<br />
55<br />
1994-1998 1996-2000 1999-2003 2001-2005<br />
55<br />
1994-1998 1996-2000 1999-2003 2001-2005<br />
3000<br />
2500<br />
2000<br />
1500<br />
1000<br />
500<br />
0<br />
<strong>Population</strong> by Age Group<br />
0 - 15 years 16 - 44 years<br />
45 - 64 years 65 years and over<br />
1996 1997 1998 1999 2000 2001 2002 2003 2004 2005 2006<br />
1690<br />
1172<br />
859<br />
655<br />
% workless of working age population<br />
35%<br />
30%<br />
25%<br />
20%<br />
15%<br />
10%<br />
5%<br />
0%<br />
Worklessness<br />
16.3%<br />
13.2%<br />
1999 2000 2001 2002 2003 2004 2005 2006<br />
% of mothers breastfeeding at 6/8 weeks<br />
85<br />
80<br />
75<br />
70<br />
65<br />
60<br />
55<br />
50<br />
45<br />
40<br />
35<br />
30<br />
25<br />
20<br />
15<br />
10<br />
5<br />
0<br />
Breast Feeding<br />
33.3<br />
30.8<br />
97-99 98-00 99-01 00-02 01-03 02-04 03-05 04-06<br />
Age/sex standardised rate per 100,000 pop<br />
1800<br />
1600<br />
1400<br />
1200<br />
1000<br />
800<br />
600<br />
400<br />
200<br />
0<br />
Hospital Patients with Alcohol Attributable &<br />
Related Conditions<br />
929<br />
97-99 98-00 99-01 00-02 01-03 02-04 03-05 04-06<br />
875<br />
Age/sex standardised rate per 100,000 pop<br />
1600<br />
1400<br />
1200<br />
1000<br />
800<br />
600<br />
400<br />
200<br />
0<br />
Heart Disease Hospital Patients<br />
1009<br />
648<br />
96-98 97-99 98-00 99-01 00-02 01-03 02-04 03-05 04-06<br />
Age/sex standardised rate per 100,000 pop<br />
10000<br />
9000<br />
8000<br />
7000<br />
6000<br />
5000<br />
4000<br />
3000<br />
2000<br />
1000<br />
0<br />
Emergency Medical Admission Patients<br />
6152<br />
5391<br />
96-98 97-99 98-00 99-01 00-02 01-03 02-04 03-05 04-06<br />
NB PLEASE NOTE THAT IN SOME CASES RATES/PERCENTAGES MAY BE BASED ON SMALL NUMBERS.<br />
48
<strong>Population</strong> Demographics<br />
Mortality<br />
Drugs,<br />
Alcohol and<br />
Smoking<br />
Social<br />
Crime Prosperity - Poverty<br />
Hospitalisation & Injury<br />
Mental <strong>Health</strong> &<br />
Function<br />
Work<br />
Education<br />
Housing &<br />
Transport<br />
Child & Maternal<br />
<strong>Health</strong><br />
Indicator<br />
Lennoxtown<br />
Number<br />
Measure<br />
-70 -60 -50 -40 -30 -20 -10 0 +10+20 +30 +40 +50 +60 +70<br />
Child population (aged 0-15) 859 19.6 % +9<br />
Adult population (aged 16-64) 2,862 65.4 % 0<br />
Elderly population (aged 65+) 655 15.0 % -9<br />
Minority ethnic groups 47 1.1 % -47 2001 2<br />
Asylum Seekers n/a n/a % G 2007 3<br />
Life expectancy - males - 73.8 yrs 0<br />
Life expectancy - females - 77.5 yrs -2<br />
01-05 4<br />
Live births 44 1.0 cr -7 2006 5<br />
Households - Single adults n/a n/a % G<br />
Single parents n/a n/a %* G<br />
2005 6<br />
Deaths all ages (5 yrs) 2 252 843.4 sr +7<br />
Coronary heart disease deaths in under 75s (5 yrs) 2 19 88.0 sr +15<br />
Cancer deaths in under 75s (5 yrs) 2 32 148.3 sr +1<br />
01-05 7<br />
Cerebrovascular disease deaths in under 75s (5 yrs) 2 7 30.7 sr +27<br />
Alcohol related and attributable hospital patients 3 41 874.8 sr +66 04-06 8<br />
Alcohol related deaths (5 yrs) 2 6 27.0 sr 0 01-05 9<br />
Estimated smokers (16+) 930 26.8 % -2 03-04 10<br />
Drug related hospital patients 3 1-4 55.1 sr -29 04-06 11<br />
Drug related deaths (10 yrs) 4 4 90.3 cr2 +43 97-06 12<br />
Patients registered with cancer 3 19 371.1 sr -12 02-04 13<br />
Heart disease patients 3 35 648.1 sr -9<br />
Cerebrovascular disease patients 3 8 131.4 sr -30<br />
Emergency medical admission patients 3 255 5,390.5 sr -14 04-06 14<br />
Multiple admission patients 3 47 971.1 sr -20<br />
Unintentional Injury patients 3 46 996.1 sr -1<br />
Patients prescribed statins 822 18.9 % +3 2006 15<br />
Road accident casualties - adults 3 15 4.1 cr3 +3 01-04 16<br />
Assault discharges 3 1-4 0.7 cr3 -34 04-06 17<br />
Suicide (5 yrs) 2 0 0.0 sr -100 01-05 18<br />
Self assessed health (classified as "Not Good") 462 10.5 % +3 2001 19<br />
First hospital admission - psychiatric 3 8 154.9 sr -39 02-04 20<br />
Patients prescribed drugs <strong>for</strong> anxiety /depression 332 7.6 % -6 2006 21<br />
Incapacity Benefit & SDA Claimants 245 8.8 % -9 2007 22<br />
Long-term limiting illness 940 21.3 % +5 2001 23<br />
Clients aged 0-15 46 5.4 % G* -25<br />
Clients aged 16-64 155 5.4 % G* +21 2007 24<br />
Clients aged 65+ 107 16.3 % G* -8<br />
'Income deprivedʼ 541 12.3 % -12 2006 25<br />
ʻEmployment deprivedʼ 320 11.5 % -11 2006 26<br />
Workless 370 13.2 % -10 2006 27<br />
JSA - Unemployment 85 3.0 % +9 2007 28<br />
Households without access to car/van 495 28.7 % -16 2001 29<br />
Children in workless households 136 13.0 % -29 2001 30<br />
Social grade E - benefit, unemployed, lowest grade work 704 21.6 % -4 2001 31<br />
Workplaces 92 33.0 cr3 -39 2005 32<br />
Employees 5 700 23.9 cr -68 2005 33<br />
Primary school attendance - 93.1 % -2 05/06 34<br />
S4 Pupils with 5+ GCSE equivalents 42 62.7 % +9 05/06 35<br />
Adults without qualifications 1,073 33.4 % +1 2001 36<br />
Serious violent crime 3 6 12.9 cr4 -12 04-06 37<br />
Domestic abuse incidents 3 23 51.4 cr4 -40 04-06 38<br />
Vandalism 3 110 250.4 cr4 G GC -7 04-06 39<br />
Drug Offenders 3 16 36.3 cr4 G GC -64 04-06 40<br />
Housing type - tenements n/a n/a % G 2006 41<br />
House prices - 125,176 £ -6 2006 42<br />
Housing tenure - Owner Occupiers n/a n/a % G 2007 43<br />
Overcrowding 188 10.9 % -7 2001 44<br />
Travelling to work by foot/bike or public transport 1,010 36.9 % -17 2001 45<br />
Smoking during pregnancy (3 yrs) 2 45 31.5 % +30 02-04 46<br />
Breastfeeding (at 6 - 8 week review) 13 30.8 % -16 04-06 47<br />
Low birth-weight babies ( 3 yrs) 2 1-4 0.7 % -71 02-04 48<br />
Immunisation uptake at 24 mths - MMR - 91.2 % +1<br />
04-06 50<br />
-all excl. MMR - 95.9 % 0<br />
Dental hospital admissions <strong>for</strong> children 3 11 1.2 cr +7 03-06 51<br />
Teenage pregnancy - under 18 years (3 yrs) 2 11 47.0 cr3 +16 02-04 52<br />
Road accident casualties - children 3 1-4 3.8 cr3 +35 01-04 16<br />
-70 -60 -50 -40 -30 -20 -10 0 +10+20 +30 +40 +50 +60 +70<br />
-<br />
(Below) Scottish Average (%) 1 (Above)<br />
+<br />
Time<br />
Period<br />
2006<br />
Defn<br />
1<br />
Notes<br />
Key<br />
1. The graph shows the "measure" (e.g. crude rate, percentage, years of life) expressed as a percentage below or above the Scottish measure, but using a range from a minimum of -70% to<br />
a maximum of +70% only. The actual plus/minus percentage value is shown in bold to the right of the graph. This is calculated as the area 'measure' minus the Scottish measure, divided by<br />
Scottish measure and multiplied by 100.<br />
2. Numbers presented over a period of years (e.g. 5 years <strong>for</strong> mortality) but rates are annual average rates.<br />
3. Average annual numbers and rates. 4. Numbers and rates presented over a period of years (e.g. 10 years <strong>for</strong> drug deaths).<br />
5. Employee numbers based on location of business, not residence area of employees.<br />
cr - crude rate per 100 population; cr2 - crude rate per 100,000 population; cr3 - crude rate per 1,000 resident population; cr4 - crude rate per 10,000 resident population; cr5 - crude rate per<br />
1,000 live births; sr - age-sex standardised rate per 100,000 population; yrs - years; %* - single parent households as % of households with children. Defn - see table of definitions & sources<br />
The 6th column of the spine chart indicates where an indicator is not compared to the Scottish average but with a local alternative: G - <strong>Glasgow</strong> City average; G* - average of <strong>Glasgow</strong>, E &<br />
W <strong>Dunbartonshire</strong>, Renfrewshire & <strong>East</strong> Renfrewshire; GGC - Greater <strong>Glasgow</strong> and Clyde (excluding Lanarkshire parts); shading on an indicator bar also indicates where a 'local' comparator<br />
is used.<br />
n/a: data not available (usually due to lack of coverage) or cannot be calculated. In addition, <strong>for</strong> particular indicators where the number of cases is below five and not zero, the range is shown<br />
i.e. '1-4'. NB If the number of teenage pregnancies is in the range '1-4' the rate is suppressed to avoid possible disclosure.<br />
A Community <strong>Health</strong> and Wellbeing Profile <strong>for</strong> <strong>East</strong> <strong>Dunbartonshire</strong> 49
Lenzie North<br />
Key: Lenzie North 95% Confidence Intervals Scotland<br />
100<br />
Male Life Expectancy<br />
100<br />
Female Life Expectancy<br />
95<br />
95<br />
Life expectancy in years<br />
90<br />
85<br />
80<br />
75<br />
70<br />
65<br />
77.4<br />
81.5<br />
Life expectancy in years<br />
90<br />
85<br />
80<br />
75<br />
70<br />
65<br />
83.0<br />
81.5<br />
60<br />
60<br />
55<br />
1994-1998 1996-2000 1999-2003 2001-2005<br />
55<br />
1994-1998 1996-2000 1999-2003 2001-2005<br />
3000<br />
2500<br />
2000<br />
1500<br />
1000<br />
500<br />
0<br />
<strong>Population</strong> by Age Group<br />
0 - 15 years 16 - 44 years<br />
45 - 64 years 65 years and over<br />
1996 1997 1998 1999 2000 2001 2002 2003 2004 2005 2006<br />
2037<br />
1661<br />
1036<br />
1004<br />
% workless of working age population<br />
35%<br />
30%<br />
25%<br />
20%<br />
15%<br />
10%<br />
5%<br />
0%<br />
Worklessness<br />
10.1%<br />
7.4%<br />
1999 2000 2001 2002 2003 2004 2005 2006<br />
% of mothers breastfeeding at 6/8 weeks<br />
85<br />
80<br />
75<br />
70<br />
65<br />
60<br />
55<br />
50<br />
45<br />
40<br />
35<br />
30<br />
25<br />
20<br />
15<br />
10<br />
5<br />
0<br />
Breast Feeding<br />
50.7<br />
53.2<br />
97-99 98-00 99-01 00-02 01-03 02-04 03-05 04-06<br />
Age/sex standardised rate per 100,000 pop<br />
1800<br />
1600<br />
1400<br />
1200<br />
1000<br />
800<br />
600<br />
400<br />
200<br />
0<br />
Hospital Patients with Alcohol Attributable &<br />
Related Conditions<br />
575<br />
97-99 98-00 99-01 00-02 01-03 02-04 03-05 04-06<br />
453<br />
Age/sex standardised rate per 100,000 pop<br />
1600<br />
1400<br />
1200<br />
1000<br />
800<br />
600<br />
400<br />
200<br />
0<br />
Heart Disease Hospital Patients<br />
969<br />
668<br />
96-98 97-99 98-00 99-01 00-02 01-03 02-04 03-05 04-06<br />
Age/sex standardised rate per 100,000 pop<br />
10000<br />
9000<br />
8000<br />
7000<br />
6000<br />
5000<br />
4000<br />
3000<br />
2000<br />
1000<br />
0<br />
Emergency Medical Admission Patients<br />
5841<br />
4521<br />
96-98 97-99 98-00 99-01 00-02 01-03 02-04 03-05 04-06<br />
NB PLEASE NOTE THAT IN SOME CASES RATES/PERCENTAGES MAY BE BASED ON SMALL NUMBERS.<br />
50
<strong>Population</strong> Demographics<br />
Mortality<br />
Drugs,<br />
Alcohol and<br />
Smoking<br />
Social<br />
Crime Prosperity - Poverty<br />
Hospitalisation & Injury<br />
Mental <strong>Health</strong> &<br />
Function<br />
Work<br />
Education<br />
Housing &<br />
Transport<br />
Child & Maternal<br />
<strong>Health</strong><br />
Indicator<br />
Lenzie North<br />
Number<br />
Measure<br />
-70 -60 -50 -40 -30 -20 -10 0 +10+20 +30 +40 +50 +60 +70<br />
Child population (aged 0-15) 1,004 17.5 % -3<br />
Adult population (aged 16-64) 3,698 64.4 % -2<br />
Elderly population (aged 65+) 1,036 18.1 % +10<br />
Minority ethnic groups 118 2.0 % 0 2001 2<br />
Asylum Seekers n/a n/a % G 2007 3<br />
Life expectancy - males - 81.5 yrs +10<br />
Life expectancy - females - 81.5 yrs +3<br />
01-05 4<br />
Live births 51 0.9 cr -18 2006 5<br />
Households - Single adults n/a n/a % G<br />
Single parents n/a n/a %* G<br />
2005 6<br />
Deaths all ages (5 yrs) 2 238 534.6 sr -32<br />
Coronary heart disease deaths in under 75s (5 yrs) 2 18 48.7 sr -36<br />
Cancer deaths in under 75s (5 yrs) 2 47 132.6 sr -10<br />
01-05 7<br />
Cerebrovascular disease deaths in under 75s (5 yrs) 2 5 14.4 sr -41<br />
Alcohol related and attributable hospital patients 3 32 452.8 sr -9 04-06 8<br />
Alcohol related deaths (5 yrs) 2 4 5.4 sr -80 01-05 9<br />
Estimated smokers (16+) 841 17.5 % -36 03-04 10<br />
Drug related hospital patients 3 1-4 26.4 sr -66 04-06 11<br />
Drug related deaths (10 yrs) 4 3 51.0 cr2 -19 97-06 12<br />
Patients registered with cancer 3 30 368.8 sr -12 02-04 13<br />
Heart disease patients 3 52 667.5 sr -6<br />
Cerebrovascular disease patients 3 6 69.8 sr -63<br />
Emergency medical admission patients 3 310 4,521.0 sr -28 04-06 14<br />
Multiple admission patients 3 53 707.7 sr -42<br />
Unintentional Injury patients 3 37 581.7 sr -42<br />
Patients prescribed statins 1,282 21.6 % +18 2006 15<br />
Road accident casualties - adults 3 16 3.2 cr3 -19 01-04 16<br />
Assault discharges 3 1-4 0.5 cr3 -55 04-06 17<br />
Suicide (5 yrs) 2 3 8.7 sr -45 01-05 18<br />
Self assessed health (classified as "Not Good") 496 8.4 % -17 2001 19<br />
First hospital admission - psychiatric 3 10 138.6 sr -46 02-04 20<br />
Patients prescribed drugs <strong>for</strong> anxiety /depression 515 8.7 % +7 2006 21<br />
Incapacity Benefit & SDA Claimants 195 5.5 % -42 2007 22<br />
Long-term limiting illness 1,021 17.3 % -15 2001 23<br />
Clients aged 0-15 35 3.5 % G* -51<br />
Clients aged 16-64 109 2.9 % G* -34 2007 24<br />
Clients aged 65+ 113 10.9 % G* -38<br />
'Income deprivedʼ 331 5.8 % -58 2006 25<br />
ʻEmployment deprivedʼ 273 7.8 % -40 2006 26<br />
Workless 260 7.4 % -50 2006 27<br />
JSA - Unemployment 50 1.4 % -49 2007 28<br />
Households without access to car/van 378 17.6 % -49 2001 29<br />
Children in workless households 78 6.2 % -66 2001 30<br />
Social grade E - benefit, unemployed, lowest grade work 749 16.5 % -27 2001 31<br />
Workplaces 129 36.6 cr3 -32 2005 32<br />
Employees 5 2,200 61.6 cr -18 2005 33<br />
Primary school attendance - 95.3 % 0 05/06 34<br />
S4 Pupils with 5+ GCSE equivalents 61 84.7 % +47 05/06 35<br />
Adults without qualifications 1,080 24.6 % -26 2001 36<br />
Serious violent crime 3 5 8.7 cr4 -40 04-06 37<br />
Domestic abuse incidents 3 13 22.7 cr4 -73 04-06 38<br />
Vandalism 3 66 114.7 cr4 G GC -58 04-06 39<br />
Drug Offenders 3 13 22.1 cr4 G GC -78 04-06 40<br />
Housing type - tenements n/a n/a % G 2006 41<br />
House prices - 175,124 £ +31 2006 42<br />
Housing tenure - Owner Occupiers n/a n/a % G 2007 43<br />
Overcrowding 115 5.4 % -54 2001 44<br />
Travelling to work by foot/bike or public transport 1,485 40.7 % -9 2001 45<br />
Smoking during pregnancy (3 yrs) 2 16 12.8 % -47 02-04 46<br />
Breastfeeding (at 6 - 8 week review) 25 53.2 % +46 04-06 47<br />
Low birth-weight babies ( 3 yrs) 2 1-4 1.8 % -28 02-04 48<br />
Immunisation uptake at 24 mths - MMR - 91.0 % +1<br />
04-06 50<br />
-all excl. MMR - 99.3 % +3<br />
Dental hospital admissions <strong>for</strong> children 3 6 0.6 cr -46 03-06 51<br />
Teenage pregnancy - under 18 years (3 yrs) 2 1-4 - cr3 02-04 52<br />
Road accident casualties - children 3 1-4 3.8 cr3 +37 01-04 16<br />
-70 -60 -50 -40 -30 -20 -10 0 +10+20 +30 +40 +50 +60 +70<br />
-<br />
(Below) Scottish Average (%) 1 (Above)<br />
+<br />
Time<br />
Period<br />
2006<br />
Defn<br />
1<br />
Notes<br />
Key<br />
1. The graph shows the "measure" (e.g. crude rate, percentage, years of life) expressed as a percentage below or above the Scottish measure, but using a range from a minimum of -70% to<br />
a maximum of +70% only. The actual plus/minus percentage value is shown in bold to the right of the graph. This is calculated as the area 'measure' minus the Scottish measure, divided by<br />
Scottish measure and multiplied by 100.<br />
2. Numbers presented over a period of years (e.g. 5 years <strong>for</strong> mortality) but rates are annual average rates.<br />
3. Average annual numbers and rates. 4. Numbers and rates presented over a period of years (e.g. 10 years <strong>for</strong> drug deaths).<br />
5. Employee numbers based on location of business, not residence area of employees.<br />
cr - crude rate per 100 population; cr2 - crude rate per 100,000 population; cr3 - crude rate per 1,000 resident population; cr4 - crude rate per 10,000 resident population; cr5 - crude rate per<br />
1,000 live births; sr - age-sex standardised rate per 100,000 population; yrs - years; %* - single parent households as % of households with children. Defn - see table of definitions & sources<br />
The 6th column of the spine chart indicates where an indicator is not compared to the Scottish average but with a local alternative: G - <strong>Glasgow</strong> City average; G* - average of <strong>Glasgow</strong>, E &<br />
W <strong>Dunbartonshire</strong>, Renfrewshire & <strong>East</strong> Renfrewshire; GGC - Greater <strong>Glasgow</strong> and Clyde (excluding Lanarkshire parts); shading on an indicator bar also indicates where a 'local' comparator<br />
is used.<br />
n/a: data not available (usually due to lack of coverage) or cannot be calculated. In addition, <strong>for</strong> particular indicators where the number of cases is below five and not zero, the range is shown<br />
i.e. '1-4'. NB If the number of teenage pregnancies is in the range '1-4' the rate is suppressed to avoid possible disclosure.<br />
A Community <strong>Health</strong> and Wellbeing Profile <strong>for</strong> <strong>East</strong> <strong>Dunbartonshire</strong> 51
Lenzie South<br />
Key: Lenzie South 95% Confidence Intervals Scotland<br />
100<br />
Male Life Expectancy<br />
100<br />
Female Life Expectancy<br />
95<br />
95<br />
Life expectancy in years<br />
90<br />
85<br />
80<br />
75<br />
70<br />
65<br />
75.0<br />
84.3<br />
Life expectancy in years<br />
90<br />
85<br />
80<br />
75<br />
70<br />
65<br />
80.0<br />
85.4<br />
60<br />
60<br />
55<br />
1994-1998 1996-2000 1999-2003 2001-2005<br />
55<br />
1994-1998 1996-2000 1999-2003 2001-2005<br />
2000<br />
1500<br />
1000<br />
500<br />
0<br />
<strong>Population</strong> by Age Group<br />
0 - 15 years 16 - 44 years<br />
45 - 64 years 65 years and over<br />
1996 1997 1998 1999 2000 2001 2002 2003 2004 2005 2006<br />
1280<br />
1122<br />
675<br />
468<br />
% workless of working age population<br />
35%<br />
30%<br />
25%<br />
20%<br />
15%<br />
10%<br />
5%<br />
0%<br />
Worklessness<br />
5.3%<br />
4.8%<br />
1999 2000 2001 2002 2003 2004 2005 2006<br />
% of mothers breastfeeding at 6/8 weeks<br />
85<br />
80<br />
75<br />
70<br />
65<br />
60<br />
55<br />
50<br />
45<br />
40<br />
35<br />
30<br />
25<br />
20<br />
15<br />
10<br />
5<br />
0<br />
Breast Feeding<br />
71.3<br />
55.8<br />
97-99 98-00 99-01 00-02 01-03 02-04 03-05 04-06<br />
Age/sex standardised rate per 100,000 pop<br />
1800<br />
1600<br />
1400<br />
1200<br />
1000<br />
800<br />
600<br />
400<br />
200<br />
0<br />
Hospital Patients with Alcohol Attributable &<br />
Related Conditions<br />
405<br />
97-99 98-00 99-01 00-02 01-03 02-04 03-05 04-06<br />
358<br />
Age/sex standardised rate per 100,000 pop<br />
1600<br />
1400<br />
1200<br />
1000<br />
800<br />
600<br />
400<br />
200<br />
0<br />
Heart Disease Hospital Patients<br />
1046<br />
463<br />
96-98 97-99 98-00 99-01 00-02 01-03 02-04 03-05 04-06<br />
Age/sex standardised rate per 100,000 pop<br />
10000<br />
9000<br />
8000<br />
7000<br />
6000<br />
5000<br />
4000<br />
3000<br />
2000<br />
1000<br />
0<br />
Emergency Medical Admission Patients<br />
4677<br />
4100<br />
96-98 97-99 98-00 99-01 00-02 01-03 02-04 03-05 04-06<br />
NB PLEASE NOTE THAT IN SOME CASES RATES/PERCENTAGES MAY BE BASED ON SMALL NUMBERS.<br />
52
<strong>Population</strong> Demographics<br />
Mortality<br />
Drugs,<br />
Alcohol and<br />
Smoking<br />
Social<br />
Crime Prosperity - Poverty<br />
Hospitalisation & Injury<br />
Mental <strong>Health</strong> &<br />
Function<br />
Work<br />
Education<br />
Housing &<br />
Transport<br />
Child & Maternal<br />
<strong>Health</strong><br />
Indicator<br />
Lenzie South<br />
Number<br />
Measure<br />
-70 -60 -50 -40 -30 -20 -10 0 +10+20 +30 +40 +50 +60 +70<br />
Child population (aged 0-15) 675 19.0 % +6<br />
Adult population (aged 16-64) 2,402 67.8 % +3<br />
Elderly population (aged 65+) 468 13.2 % -19<br />
Minority ethnic groups 89 2.4 % +22 2001 2<br />
Asylum Seekers n/a n/a % G 2007 3<br />
Life expectancy - males - 84.3 yrs +14<br />
Life expectancy - females - 85.4 yrs +8<br />
01-05 4<br />
Live births 32 0.9 cr -17 2006 5<br />
Households - Single adults n/a n/a % G<br />
Single parents n/a n/a %* G<br />
2005 6<br />
Deaths all ages (5 yrs) 2 75 398.6 sr -49<br />
Coronary heart disease deaths in under 75s (5 yrs) 2 3 16.5 sr -78<br />
Cancer deaths in under 75s (5 yrs) 2 17 91.0 sr -38<br />
01-05 7<br />
Cerebrovascular disease deaths in under 75s (5 yrs) 2 0 0.0 sr -100<br />
Alcohol related and attributable hospital patients 3 14 357.5 sr -12 04-06 8<br />
Alcohol related deaths (5 yrs) 2 3 13.7 sr -49 01-05 9<br />
Estimated smokers (16+) 370 12.8 % -53 03-04 10<br />
Drug related hospital patients 3 0 0.0 sr -100 04-06 11<br />
Drug related deaths (10 yrs) 4 1 27.6 cr2 -56 97-06 12<br />
Patients registered with cancer 3 15 430.1 sr +2 02-04 13<br />
Heart disease patients 3 21 462.6 sr -35<br />
Cerebrovascular disease patients 3 4 108.4 sr -42<br />
Emergency medical admission patients 3 150 4,099.5 sr -34 04-06 14<br />
Multiple admission patients 3 22 570.9 sr -53<br />
Unintentional Injury patients 3 16 464.9 sr -54<br />
Patients prescribed statins 814 21.7 % +19 2006 15<br />
Road accident casualties - adults 3 11 3.7 cr3 -9 01-04 16<br />
Assault discharges 3 1-4 0.1 cr3 -91 04-06 17<br />
Suicide (5 yrs) 2 3 15.9 sr +1 01-05 18<br />
Self assessed health (classified as "Not Good") 177 4.9 % -52 2001 19<br />
First hospital admission - psychiatric 3 3 70.0 sr -73 02-04 20<br />
Patients prescribed drugs <strong>for</strong> anxiety /depression 326 8.7 % +8 2006 21<br />
Incapacity Benefit & SDA Claimants 75 3.3 % -66 2007 22<br />
Long-term limiting illness 414 11.4 % -44 2001 23<br />
Clients aged 0-15 5 0.7 % G* -90<br />
Clients aged 16-64 27 1.1 % G* -75 2007 24<br />
Clients aged 65+ 48 10.3 % G* -42<br />
'Income deprivedʼ 74 2.1 % -85 2006 25<br />
ʻEmployment deprivedʼ 102 4.4 % -66 2006 26<br />
Workless 110 4.8 % -67 2006 27<br />
JSA - Unemployment 15 0.6 % -77 2007 28<br />
Households without access to car/van 101 7.6 % -78 2001 29<br />
Children in workless households 14 1.6 % -91 2001 30<br />
Social grade E - benefit, unemployed, lowest grade work 196 6.8 % -70 2001 31<br />
Workplaces 68 29.4 cr3 -45 2005 32<br />
Employees 5 300 14.1 cr -81 2005 33<br />
Primary school attendance - 96.5 % +2 05/06 34<br />
S4 Pupils with 5+ GCSE equivalents 41 93.2 % +61 05/06 35<br />
Adults without qualifications 358 13.0 % -61 2001 36<br />
Serious violent crime 3 0 0.0 cr4 -100 04-06 37<br />
Domestic abuse incidents 3 4 11.2 cr4 -87 04-06 38<br />
Vandalism 3 34 95.6 cr4 G GC -65 04-06 39<br />
Drug Offenders 3 6 16.9 cr4 G GC -83 04-06 40<br />
Housing type - tenements n/a n/a % G 2006 41<br />
House prices - 227,883 £ +70 2006 42<br />
Housing tenure - Owner Occupiers n/a n/a % G 2007 43<br />
Overcrowding 40 3.0 % -74 2001 44<br />
Travelling to work by foot/bike or public transport 1,035 39.6 % -11 2001 45<br />
Smoking during pregnancy (3 yrs) 2 7 8.0 % -67 02-04 46<br />
Breastfeeding (at 6 - 8 week review) 21 71.3 % +96 04-06 47<br />
Low birth-weight babies ( 3 yrs) 2 1-4 3.6 % +47 02-04 48<br />
Immunisation uptake at 24 mths - MMR - 89.9 % 0<br />
04-06 50<br />
-all excl. MMR - 98.9 % +3<br />
Dental hospital admissions <strong>for</strong> children 3 1-4 0.6 cr -49 03-06 51<br />
Teenage pregnancy - under 18 years (3 yrs) 2 1-4 - cr3 02-04 52<br />
Road accident casualties - children 3 1-4 0.3 cr3 -88 01-04 16<br />
-70 -60 -50 -40 -30 -20 -10 0 +10+20 +30 +40 +50 +60 +70<br />
-<br />
(Below) Scottish Average (%) 1 (Above)<br />
+<br />
Time<br />
Period<br />
2006<br />
Defn<br />
1<br />
Notes<br />
Key<br />
1. The graph shows the "measure" (e.g. crude rate, percentage, years of life) expressed as a percentage below or above the Scottish measure, but using a range from a minimum of -70% to<br />
a maximum of +70% only. The actual plus/minus percentage value is shown in bold to the right of the graph. This is calculated as the area 'measure' minus the Scottish measure, divided by<br />
Scottish measure and multiplied by 100.<br />
2. Numbers presented over a period of years (e.g. 5 years <strong>for</strong> mortality) but rates are annual average rates.<br />
3. Average annual numbers and rates. 4. Numbers and rates presented over a period of years (e.g. 10 years <strong>for</strong> drug deaths).<br />
5. Employee numbers based on location of business, not residence area of employees.<br />
cr - crude rate per 100 population; cr2 - crude rate per 100,000 population; cr3 - crude rate per 1,000 resident population; cr4 - crude rate per 10,000 resident population; cr5 - crude rate per<br />
1,000 live births; sr - age-sex standardised rate per 100,000 population; yrs - years; %* - single parent households as % of households with children. Defn - see table of definitions & sources<br />
The 6th column of the spine chart indicates where an indicator is not compared to the Scottish average but with a local alternative: G - <strong>Glasgow</strong> City average; G* - average of <strong>Glasgow</strong>, E &<br />
W <strong>Dunbartonshire</strong>, Renfrewshire & <strong>East</strong> Renfrewshire; GGC - Greater <strong>Glasgow</strong> and Clyde (excluding Lanarkshire parts); shading on an indicator bar also indicates where a 'local' comparator<br />
is used.<br />
n/a: data not available (usually due to lack of coverage) or cannot be calculated. In addition, <strong>for</strong> particular indicators where the number of cases is below five and not zero, the range is shown<br />
i.e. '1-4'. NB If the number of teenage pregnancies is in the range '1-4' the rate is suppressed to avoid possible disclosure.<br />
A Community <strong>Health</strong> and Wellbeing Profile <strong>for</strong> <strong>East</strong> <strong>Dunbartonshire</strong> 53
Milton of Campsie<br />
Key: Milton of Campsie 95% Confidence Intervals Scotland<br />
100<br />
Male Life Expectancy<br />
100<br />
Female Life Expectancy<br />
95<br />
95<br />
Life expectancy in years<br />
90<br />
85<br />
80<br />
75<br />
70<br />
65<br />
79.6<br />
74.0<br />
Life expectancy in years<br />
90<br />
85<br />
80<br />
75<br />
70<br />
65<br />
79.1<br />
78.5<br />
60<br />
60<br />
55<br />
1994-1998 1996-2000 1999-2003 2001-2005<br />
55<br />
1994-1998 1996-2000 1999-2003 2001-2005<br />
3000<br />
2500<br />
2000<br />
1500<br />
1000<br />
500<br />
0<br />
<strong>Population</strong> by Age Group<br />
0 - 15 years 16 - 44 years<br />
45 - 64 years 65 years and over<br />
1996 1997 1998 1999 2000 2001 2002 2003 2004 2005 2006<br />
1407<br />
1258<br />
771<br />
579<br />
% workless of working age population<br />
35%<br />
30%<br />
25%<br />
20%<br />
15%<br />
10%<br />
5%<br />
0%<br />
Worklessness<br />
11.1%<br />
8.1%<br />
1999 2000 2001 2002 2003 2004 2005 2006<br />
% of mothers breastfeeding at 6/8 weeks<br />
85<br />
80<br />
75<br />
70<br />
65<br />
60<br />
55<br />
50<br />
45<br />
40<br />
35<br />
30<br />
25<br />
20<br />
15<br />
10<br />
5<br />
0<br />
Breast Feeding<br />
45.3<br />
41.2<br />
97-99 98-00 99-01 00-02 01-03 02-04 03-05 04-06<br />
Age/sex standardised rate per 100,000 pop<br />
1800<br />
1600<br />
1400<br />
1200<br />
1000<br />
800<br />
600<br />
400<br />
200<br />
0<br />
Hospital Patients with Alcohol Attributable &<br />
Related Conditions<br />
612<br />
97-99 98-00 99-01 00-02 01-03 02-04 03-05 04-06<br />
585<br />
Age/sex standardised rate per 100,000 pop<br />
1600<br />
1400<br />
1200<br />
1000<br />
800<br />
600<br />
400<br />
200<br />
0<br />
Heart Disease Hospital Patients<br />
570<br />
515<br />
96-98 97-99 98-00 99-01 00-02 01-03 02-04 03-05 04-06<br />
Age/sex standardised rate per 100,000 pop<br />
10000<br />
9000<br />
8000<br />
7000<br />
6000<br />
5000<br />
4000<br />
3000<br />
2000<br />
1000<br />
0<br />
Emergency Medical Admission Patients<br />
5517<br />
5227<br />
96-98 97-99 98-00 99-01 00-02 01-03 02-04 03-05 04-06<br />
NB PLEASE NOTE THAT IN SOME CASES RATES/PERCENTAGES MAY BE BASED ON SMALL NUMBERS.<br />
54
<strong>Population</strong> Demographics<br />
Mortality<br />
Drugs,<br />
Alcohol and<br />
Smoking<br />
Social<br />
Crime Prosperity - Poverty<br />
Hospitalisation & Injury<br />
Mental <strong>Health</strong> &<br />
Function<br />
Work<br />
Education<br />
Housing &<br />
Transport<br />
Child & Maternal<br />
<strong>Health</strong><br />
Indicator<br />
Milton of Campsie<br />
Number<br />
Measure<br />
-70 -60 -50 -40 -30 -20 -10 0 +10+20 +30 +40 +50 +60 +70<br />
Child population (aged 0-15) 771 19.2 % +7<br />
Adult population (aged 16-64) 2,665 66.4 % +1<br />
Elderly population (aged 65+) 579 14.4 % -12<br />
Minority ethnic groups 20 0.5 % -76 2001 2<br />
Asylum Seekers n/a n/a % G 2007 3<br />
Life expectancy - males - 74.0 yrs 0<br />
Life expectancy - females - 78.5 yrs -1<br />
01-05 4<br />
Live births 38 0.9 cr -13 2006 5<br />
Households - Single adults n/a n/a % G<br />
Single parents n/a n/a %* G<br />
2005 6<br />
Deaths all ages (5 yrs) 2 227 857.0 sr +9<br />
Coronary heart disease deaths in under 75s (5 yrs) 2 14 68.0 sr -11<br />
Cancer deaths in under 75s (5 yrs) 2 28 135.6 sr -7<br />
01-05 7<br />
Cerebrovascular disease deaths in under 75s (5 yrs) 2 10 47.5 sr +96<br />
Alcohol related and attributable hospital patients 3 27 584.6 sr +22 04-06 8<br />
Alcohol related deaths (5 yrs) 2 5 19.6 sr -28 01-05 9<br />
Estimated smokers (16+) 585 17.7 % -35 03-04 10<br />
Drug related hospital patients 3 1-4 13.2 sr -83 04-06 11<br />
Drug related deaths (10 yrs) 4 0 0.0 cr2 -100 97-06 12<br />
Patients registered with cancer 3 20 394.0 sr -6 02-04 13<br />
Heart disease patients 3 26 515.1 sr -28<br />
Cerebrovascular disease patients 3 8 145.6 sr -23<br />
Emergency medical admission patients 3 238 5,227.0 sr -16 04-06 14<br />
Multiple admission patients 3 46 973.8 sr -20<br />
Unintentional Injury patients 3 41 909.6 sr -10<br />
Patients prescribed statins 898 21.3 % +17 2006 15<br />
Road accident casualties - adults 3 7 2.1 cr3 -48 01-04 16<br />
Assault discharges 3 1-4 0.5 cr3 -52 04-06 17<br />
Suicide (5 yrs) 2 3 14.0 sr -11 01-05 18<br />
Self assessed health (classified as "Not Good") 332 7.9 % -22 2001 19<br />
First hospital admission - psychiatric 3 7 173.6 sr -32 02-04 20<br />
Patients prescribed drugs <strong>for</strong> anxiety /depression 371 8.8 % +9 2006 21<br />
Incapacity Benefit & SDA Claimants 145 5.6 % -42 2007 22<br />
Long-term limiting illness 670 16.0 % -21 2001 23<br />
Clients aged 0-15 17 2.2 % G* -69<br />
Clients aged 16-64 88 3.3 % G* -26 2007 24<br />
Clients aged 65+ 87 15.0 % G* -15<br />
'Income deprivedʼ 245 6.1 % -56 2006 25<br />
ʻEmployment deprivedʼ 176 6.8 % -47 2006 26<br />
Workless 210 8.1 % -45 2006 27<br />
JSA - Unemployment 35 1.4 % -51 2007 28<br />
Households without access to car/van 263 16.8 % -51 2001 29<br />
Children in workless households 96 9.3 % -49 2001 30<br />
Social grade E - benefit, unemployed, lowest grade work 403 12.4 % -45 2001 31<br />
Workplaces 58 22.5 cr3 -58 2005 32<br />
Employees 5 400 16.5 cr -78 2005 33<br />
Primary school attendance - 94.4 % -1 05/06 34<br />
S4 Pupils with 5+ GCSE equivalents 37 68.5 % +19 05/06 35<br />
Adults without qualifications 690 22.5 % -32 2001 36<br />
Serious violent crime 3 2 4.1 cr4 -72 04-06 37<br />
Domestic abuse incidents 3 11 27.2 cr4 -68 04-06 38<br />
Vandalism 3 59 144.9 cr4 G GC -46 04-06 39<br />
Drug Offenders 3 13 31.3 cr4 G GC -69 04-06 40<br />
Housing type - tenements n/a n/a % G 2006 41<br />
House prices - 139,338 £ +4 2006 42<br />
Housing tenure - Owner Occupiers n/a n/a % G 2007 43<br />
Overcrowding 95 6.1 % -48 2001 44<br />
Travelling to work by foot/bike or public transport 1,012 35.3 % -21 2001 45<br />
Smoking during pregnancy (3 yrs) 2 13 12.6 % -48 02-04 46<br />
Breastfeeding (at 6 - 8 week review) 13 41.2 % +13 04-06 47<br />
Low birth-weight babies ( 3 yrs) 2 1-4 3.2 % +30 02-04 48<br />
Immunisation uptake at 24 mths - MMR - 94.3 % +4<br />
04-06 50<br />
-all excl. MMR - 99.1 % +3<br />
Dental hospital admissions <strong>for</strong> children 3 8 1.0 cr -11 03-06 51<br />
Teenage pregnancy - under 18 years (3 yrs) 2 9 38.0 cr3 -6 02-04 52<br />
Road accident casualties - children 3 1-4 1.8 cr3 -35 01-04 16<br />
-70 -60 -50 -40 -30 -20 -10 0 +10+20 +30 +40 +50 +60 +70<br />
-<br />
(Below) Scottish Average (%) 1 (Above)<br />
+<br />
Time<br />
Period<br />
2006<br />
Defn<br />
1<br />
Notes<br />
Key<br />
1. The graph shows the "measure" (e.g. crude rate, percentage, years of life) expressed as a percentage below or above the Scottish measure, but using a range from a minimum of -70% to<br />
a maximum of +70% only. The actual plus/minus percentage value is shown in bold to the right of the graph. This is calculated as the area 'measure' minus the Scottish measure, divided by<br />
Scottish measure and multiplied by 100.<br />
2. Numbers presented over a period of years (e.g. 5 years <strong>for</strong> mortality) but rates are annual average rates.<br />
3. Average annual numbers and rates. 4. Numbers and rates presented over a period of years (e.g. 10 years <strong>for</strong> drug deaths).<br />
5. Employee numbers based on location of business, not residence area of employees.<br />
cr - crude rate per 100 population; cr2 - crude rate per 100,000 population; cr3 - crude rate per 1,000 resident population; cr4 - crude rate per 10,000 resident population; cr5 - crude rate per<br />
1,000 live births; sr - age-sex standardised rate per 100,000 population; yrs - years; %* - single parent households as % of households with children. Defn - see table of definitions & sources<br />
The 6th column of the spine chart indicates where an indicator is not compared to the Scottish average but with a local alternative: G - <strong>Glasgow</strong> City average; G* - average of <strong>Glasgow</strong>, E &<br />
W <strong>Dunbartonshire</strong>, Renfrewshire & <strong>East</strong> Renfrewshire; GGC - Greater <strong>Glasgow</strong> and Clyde (excluding Lanarkshire parts); shading on an indicator bar also indicates where a 'local' comparator<br />
is used.<br />
n/a: data not available (usually due to lack of coverage) or cannot be calculated. In addition, <strong>for</strong> particular indicators where the number of cases is below five and not zero, the range is shown<br />
i.e. '1-4'. NB If the number of teenage pregnancies is in the range '1-4' the rate is suppressed to avoid possible disclosure.<br />
A Community <strong>Health</strong> and Wellbeing Profile <strong>for</strong> <strong>East</strong> <strong>Dunbartonshire</strong> 55
North Castlehill and Thorn<br />
Key: North Castlehill and Thorn 95% Confidence Intervals Scotland<br />
100<br />
Male Life Expectancy<br />
100<br />
Female Life Expectancy<br />
95<br />
95<br />
Life expectancy in years<br />
90<br />
85<br />
80<br />
75<br />
70<br />
65<br />
80.1 79.7<br />
Life expectancy in years<br />
90<br />
85<br />
80<br />
75<br />
70<br />
65<br />
80.6<br />
79.3<br />
60<br />
60<br />
55<br />
1994-1998 1996-2000 1999-2003 2001-2005<br />
55<br />
1994-1998 1996-2000 1999-2003 2001-2005<br />
3000<br />
2500<br />
2000<br />
1500<br />
1000<br />
500<br />
0<br />
<strong>Population</strong> by Age Group<br />
0 - 15 years 16 - 44 years<br />
45 - 64 years 65 years and over<br />
1996 1997 1998 1999 2000 2001 2002 2003 2004 2005 2006<br />
1647<br />
1305<br />
929<br />
658<br />
% workless of working age population<br />
35%<br />
30%<br />
25%<br />
20%<br />
15%<br />
10%<br />
5%<br />
0%<br />
Worklessness<br />
5.1%<br />
3.7%<br />
1999 2000 2001 2002 2003 2004 2005 2006<br />
% of mothers breastfeeding at 6/8 weeks<br />
85<br />
80<br />
75<br />
70<br />
65<br />
60<br />
55<br />
50<br />
45<br />
40<br />
35<br />
30<br />
25<br />
20<br />
15<br />
10<br />
5<br />
0<br />
Breast Feeding<br />
50.8<br />
47.7<br />
97-99 98-00 99-01 00-02 01-03 02-04 03-05 04-06<br />
Age/sex standardised rate per 100,000 pop<br />
1800<br />
1600<br />
1400<br />
1200<br />
1000<br />
800<br />
600<br />
400<br />
200<br />
0<br />
Hospital Patients with Alcohol Attributable &<br />
Related Conditions<br />
289<br />
97-99 98-00 99-01 00-02 01-03 02-04 03-05 04-06<br />
246<br />
Age/sex standardised rate per 100,000 pop<br />
1600<br />
1400<br />
1200<br />
1000<br />
800<br />
600<br />
400<br />
200<br />
0<br />
Heart Disease Hospital Patients<br />
711<br />
631<br />
96-98 97-99 98-00 99-01 00-02 01-03 02-04 03-05 04-06<br />
Age/sex standardised rate per 100,000 pop<br />
10000<br />
9000<br />
8000<br />
7000<br />
6000<br />
5000<br />
4000<br />
3000<br />
2000<br />
1000<br />
0<br />
Emergency Medical Admission Patients<br />
3789<br />
3492<br />
96-98 97-99 98-00 99-01 00-02 01-03 02-04 03-05 04-06<br />
NB PLEASE NOTE THAT IN SOME CASES RATES/PERCENTAGES MAY BE BASED ON SMALL NUMBERS.<br />
56
<strong>Population</strong> Demographics<br />
Mortality<br />
Drugs,<br />
Alcohol and<br />
Smoking<br />
Social<br />
Crime Prosperity - Poverty<br />
Hospitalisation & Injury<br />
Mental <strong>Health</strong> &<br />
Function<br />
Work<br />
Education<br />
Housing &<br />
Transport<br />
Child & Maternal<br />
<strong>Health</strong><br />
Indicator<br />
North Castlehill and Thorn<br />
Number<br />
Measure<br />
-70 -60 -50 -40 -30 -20 -10 0 +10+20 +30 +40 +50 +60 +70<br />
Child population (aged 0-15) 929 20.5 % +14<br />
Adult population (aged 16-64) 2,952 65.0 % -1<br />
Elderly population (aged 65+) 658 14.5 % -11<br />
Minority ethnic groups 322 7.0 % +246 2001 2<br />
Asylum Seekers n/a n/a % G 2007 3<br />
Life expectancy - males - 79.7 yrs +8<br />
Life expectancy - females - 79.3 yrs 0<br />
01-05 4<br />
Live births 31 0.7 cr -37 2006 5<br />
Households - Single adults n/a n/a % G<br />
Single parents n/a n/a %* G<br />
2005 6<br />
Deaths all ages (5 yrs) 2 214 630.2 sr -20<br />
Coronary heart disease deaths in under 75s (5 yrs) 2 7 35.0 sr -54<br />
Cancer deaths in under 75s (5 yrs) 2 22 107.6 sr -27<br />
01-05 7<br />
Cerebrovascular disease deaths in under 75s (5 yrs) 2 1 5.2 sr -78<br />
Alcohol related and attributable hospital patients 3 14 245.7 sr -39 04-06 8<br />
Alcohol related deaths (5 yrs) 2 2 9.0 sr -67 01-05 9<br />
Estimated smokers (16+) 471 13.3 % -51 03-04 10<br />
Drug related hospital patients 3 0 0.0 sr -100 04-06 11<br />
Drug related deaths (10 yrs) 4 0 0.0 cr2 -100 97-06 12<br />
Patients registered with cancer 3 14 303.8 sr -28 02-04 13<br />
Heart disease patients 3 32 630.6 sr -12<br />
Cerebrovascular disease patients 3 7 113.3 sr -40<br />
Emergency medical admission patients 3 180 3,491.9 sr -44 04-06 14<br />
Multiple admission patients 3 31 586.7 sr -52<br />
Unintentional Injury patients 3 27 517.6 sr -49<br />
Patients prescribed statins 868 18.9 % +4 2006 15<br />
Road accident casualties - adults 3 1-4 1.0 cr3 -76 01-04 16<br />
Assault discharges 3 1-4 0.6 cr3 -43 04-06 17<br />
Suicide (5 yrs) 2 4 19.2 sr +22 01-05 18<br />
Self assessed health (classified as "Not Good") 224 4.8 % -52 2001 19<br />
First hospital admission - psychiatric 3 7 134.9 sr -47 02-04 20<br />
Patients prescribed drugs <strong>for</strong> anxiety /depression 297 6.5 % -20 2006 21<br />
Incapacity Benefit & SDA Claimants 70 2.4 % -75 2007 22<br />
Long-term limiting illness 472 10.2 % -50 2001 23<br />
Clients aged 0-15 11 1.2 % G* -83<br />
Clients aged 16-64 32 1.1 % G* -76 2007 24<br />
Clients aged 65+ 63 9.6 % G* -46<br />
'Income deprivedʼ 108 2.4 % -83 2006 25<br />
ʻEmployment deprivedʼ 104 3.6 % -72 2006 26<br />
Workless 105 3.7 % -75 2006 27<br />
JSA - Unemployment 25 0.9 % -69 2007 28<br />
Households without access to car/van 94 6.1 % -82 2001 29<br />
Children in workless households 34 2.9 % -84 2001 30<br />
Social grade E - benefit, unemployed, lowest grade work 239 7.1 % -68 2001 31<br />
Workplaces 77 26.9 cr3 -50 2005 32<br />
Employees 5 400 15.0 cr -80 2005 33<br />
Primary school attendance - 95.7 % +1 05/06 34<br />
S4 Pupils with 5+ GCSE equivalents 43 78.2 % +35 05/06 35<br />
Adults without qualifications 497 14.7 % -56 2001 36<br />
Serious violent crime 3 1 1.5 cr4 -90 04-06 37<br />
Domestic abuse incidents 3 2 4.4 cr4 -95 04-06 38<br />
Vandalism 3 40 87.0 cr4 G GC -68 04-06 39<br />
Drug Offenders 3 1-4 4.4 cr4 G GC -96 04-06 40<br />
Housing type - tenements n/a n/a % G 2006 41<br />
House prices - 204,108 £ +52 2006 42<br />
Housing tenure - Owner Occupiers n/a n/a % G 2007 43<br />
Overcrowding 92 5.9 % -49 2001 44<br />
Travelling to work by foot/bike or public transport 1,174 34.8 % -22 2001 45<br />
Smoking during pregnancy (3 yrs) 2 16 11.7 % -52 02-04 46<br />
Breastfeeding (at 6 - 8 week review) 20 50.8 % +40 04-06 47<br />
Low birth-weight babies ( 3 yrs) 2 1-4 0.8 % -68 02-04 48<br />
Immunisation uptake at 24 mths - MMR - 90.2 % 0<br />
04-06 50<br />
-all excl. MMR - 99.3 % +3<br />
Dental hospital admissions <strong>for</strong> children 3 8 0.8 cr -27 03-06 51<br />
Teenage pregnancy - under 18 years (3 yrs) 2 1-4 - cr3 02-04 52<br />
Road accident casualties - children 3 1-4 1.3 cr3 -54 01-04 16<br />
-70 -60 -50 -40 -30 -20 -10 0 +10+20 +30 +40 +50 +60 +70<br />
-<br />
(Below) Scottish Average (%) 1 (Above)<br />
+<br />
Time<br />
Period<br />
2006<br />
Defn<br />
1<br />
Notes<br />
Key<br />
1. The graph shows the "measure" (e.g. crude rate, percentage, years of life) expressed as a percentage below or above the Scottish measure, but using a range from a minimum of -70% to<br />
a maximum of +70% only. The actual plus/minus percentage value is shown in bold to the right of the graph. This is calculated as the area 'measure' minus the Scottish measure, divided by<br />
Scottish measure and multiplied by 100.<br />
2. Numbers presented over a period of years (e.g. 5 years <strong>for</strong> mortality) but rates are annual average rates.<br />
3. Average annual numbers and rates. 4. Numbers and rates presented over a period of years (e.g. 10 years <strong>for</strong> drug deaths).<br />
5. Employee numbers based on location of business, not residence area of employees.<br />
cr - crude rate per 100 population; cr2 - crude rate per 100,000 population; cr3 - crude rate per 1,000 resident population; cr4 - crude rate per 10,000 resident population; cr5 - crude rate per<br />
1,000 live births; sr - age-sex standardised rate per 100,000 population; yrs - years; %* - single parent households as % of households with children. Defn - see table of definitions & sources<br />
The 6th column of the spine chart indicates where an indicator is not compared to the Scottish average but with a local alternative: G - <strong>Glasgow</strong> City average; G* - average of <strong>Glasgow</strong>, E &<br />
W <strong>Dunbartonshire</strong>, Renfrewshire & <strong>East</strong> Renfrewshire; GGC - Greater <strong>Glasgow</strong> and Clyde (excluding Lanarkshire parts); shading on an indicator bar also indicates where a 'local' comparator<br />
is used.<br />
n/a: data not available (usually due to lack of coverage) or cannot be calculated. In addition, <strong>for</strong> particular indicators where the number of cases is below five and not zero, the range is shown<br />
i.e. '1-4'. NB If the number of teenage pregnancies is in the range '1-4' the rate is suppressed to avoid possible disclosure.<br />
A Community <strong>Health</strong> and Wellbeing Profile <strong>for</strong> <strong>East</strong> <strong>Dunbartonshire</strong> 57
Rosebank and Waterside<br />
Key: Rosebank and Waterside 95% Confidence Intervals Scotland<br />
100<br />
Male Life Expectancy<br />
100<br />
Female Life Expectancy<br />
95<br />
95<br />
Life expectancy in years<br />
90<br />
85<br />
80<br />
75<br />
70<br />
65<br />
70.3<br />
78.9<br />
Life expectancy in years<br />
90<br />
85<br />
80<br />
75<br />
70<br />
65<br />
74.5<br />
84.1<br />
60<br />
60<br />
55<br />
1994-1998 1996-2000 1999-2003 2001-2005<br />
55<br />
1994-1998 1996-2000 1999-2003 2001-2005<br />
3000<br />
2500<br />
2000<br />
1500<br />
1000<br />
500<br />
0<br />
<strong>Population</strong> by Age Group<br />
0 - 15 years 16 - 44 years<br />
45 - 64 years 65 years and over<br />
1996 1997 1998 1999 2000 2001 2002 2003 2004 2005 2006<br />
1228<br />
996<br />
653<br />
463<br />
% workless of working age population<br />
35%<br />
30%<br />
25%<br />
20%<br />
15%<br />
10%<br />
5%<br />
0%<br />
Worklessness<br />
11.0%<br />
9.6%<br />
1999 2000 2001 2002 2003 2004 2005 2006<br />
% of mothers breastfeeding at 6/8 weeks<br />
85<br />
80<br />
75<br />
70<br />
65<br />
60<br />
55<br />
50<br />
45<br />
40<br />
35<br />
30<br />
25<br />
20<br />
15<br />
10<br />
5<br />
0<br />
Breast Feeding<br />
30.6<br />
27.3<br />
97-99 98-00 99-01 00-02 01-03 02-04 03-05 04-06<br />
Age/sex standardised rate per 100,000 pop<br />
1800<br />
1600<br />
1400<br />
1200<br />
1000<br />
800<br />
600<br />
400<br />
200<br />
0<br />
Hospital Patients with Alcohol Attributable &<br />
Related Conditions<br />
692<br />
97-99 98-00 99-01 00-02 01-03 02-04 03-05 04-06<br />
515<br />
Age/sex standardised rate per 100,000 pop<br />
1600<br />
1400<br />
1200<br />
1000<br />
800<br />
600<br />
400<br />
200<br />
0<br />
Heart Disease Hospital Patients<br />
1092<br />
612<br />
96-98 97-99 98-00 99-01 00-02 01-03 02-04 03-05 04-06<br />
Age/sex standardised rate per 100,000 pop<br />
10000<br />
9000<br />
8000<br />
7000<br />
6000<br />
5000<br />
4000<br />
3000<br />
2000<br />
1000<br />
0<br />
Emergency Medical Admission Patients<br />
6227<br />
4876<br />
96-98 97-99 98-00 99-01 00-02 01-03 02-04 03-05 04-06<br />
NB PLEASE NOTE THAT IN SOME CASES RATES/PERCENTAGES MAY BE BASED ON SMALL NUMBERS.<br />
58
<strong>Population</strong> Demographics<br />
Mortality<br />
Drugs,<br />
Alcohol and<br />
Smoking<br />
Social<br />
Crime Prosperity - Poverty<br />
Hospitalisation & Injury<br />
Mental <strong>Health</strong> &<br />
Function<br />
Work<br />
Education<br />
Housing &<br />
Transport<br />
Child & Maternal<br />
<strong>Health</strong><br />
Indicator<br />
Rosebank and Waterside<br />
Number<br />
Measure<br />
-70 -60 -50 -40 -30 -20 -10 0 +10+20 +30 +40 +50 +60 +70<br />
Child population (aged 0-15) 653 19.6 % +9<br />
Adult population (aged 16-64) 2,224 66.6 % +1<br />
Elderly population (aged 65+) 463 13.9 % -15<br />
Minority ethnic groups 25 0.7 % -65 2001 2<br />
Asylum Seekers n/a n/a % G 2007 3<br />
Life expectancy - males - 78.9 yrs +7<br />
Life expectancy - females - 84.1 yrs +6<br />
01-05 4<br />
Live births 35 1.0 cr -3 2006 5<br />
Households - Single adults n/a n/a % G<br />
Single parents n/a n/a %* G<br />
2005 6<br />
Deaths all ages (5 yrs) 2 89 523.2 sr -34<br />
Coronary heart disease deaths in under 75s (5 yrs) 2 5 25.7 sr -66<br />
Cancer deaths in under 75s (5 yrs) 2 25 129.3 sr -12<br />
01-05 7<br />
Cerebrovascular disease deaths in under 75s (5 yrs) 2 2 9.9 sr -59<br />
Alcohol related and attributable hospital patients 3 18 515.4 sr +17 04-06 8<br />
Alcohol related deaths (5 yrs) 2 5 30.9 sr +14 01-05 9<br />
Estimated smokers (16+) 599 21.8 % -20 03-04 10<br />
Drug related hospital patients 3 1-4 14.7 sr -81 04-06 11<br />
Drug related deaths (10 yrs) 4 2 55.9 cr2 -12 97-06 12<br />
Patients registered with cancer 3 16 417.8 sr -1 02-04 13<br />
Heart disease patients 3 23 612.4 sr -14<br />
Cerebrovascular disease patients 3 7 183.1 sr -3<br />
Emergency medical admission patients 3 171 4,876.1 sr -22 04-06 14<br />
Multiple admission patients 3 29 810.0 sr -34<br />
Unintentional Injury patients 3 23 717.4 sr -29<br />
Patients prescribed statins 787 21.8 % +20 2006 15<br />
Road accident casualties - adults 3 11 4.1 cr3 +1 01-04 16<br />
Assault discharges 3 1-4 0.7 cr3 -32 04-06 17<br />
Suicide (5 yrs) 2 1 5.5 sr -65 01-05 18<br />
Self assessed health (classified as "Not Good") 272 7.6 % -25 2001 19<br />
First hospital admission - psychiatric 3 6 161.1 sr -37 02-04 20<br />
Patients prescribed drugs <strong>for</strong> anxiety /depression 316 8.8 % +8 2006 21<br />
Incapacity Benefit & SDA Claimants 155 7.3 % -24 2007 22<br />
Long-term limiting illness 535 15.0 % -26 2001 23<br />
Clients aged 0-15 26 4.0 % G* -44<br />
Clients aged 16-64 85 3.8 % G* -15 2007 24<br />
Clients aged 65+ 43 9.3 % G* -48<br />
'Income deprivedʼ 198 5.9 % -57 2006 25<br />
ʻEmployment deprivedʼ 175 8.2 % -36 2006 26<br />
Workless 205 9.6 % -35 2006 27<br />
JSA - Unemployment 45 2.1 % -24 2007 28<br />
Households without access to car/van 205 16.0 % -53 2001 29<br />
Children in workless households 85 9.4 % -49 2001 30<br />
Social grade E - benefit, unemployed, lowest grade work 376 13.7 % -39 2001 31<br />
Workplaces 47 22.1 cr3 -59 2005 32<br />
Employees 5 500 21.3 cr -72 2005 33<br />
Primary school attendance - 94.5 % -1 05/06 34<br />
S4 Pupils with 5+ GCSE equivalents 26 56.5 % -2 05/06 35<br />
Adults without qualifications 673 25.4 % -24 2001 36<br />
Serious violent crime 3 1 4.0 cr4 -73 04-06 37<br />
Domestic abuse incidents 3 14 42.9 cr4 -50 04-06 38<br />
Vandalism 3 49 145.8 cr4 G GC -46 04-06 39<br />
Drug Offenders 3 14 42.9 cr4 G GC -57 04-06 40<br />
Housing type - tenements n/a n/a % G 2006 41<br />
House prices - 130,861 £ -2 2006 42<br />
Housing tenure - Owner Occupiers n/a n/a % G 2007 43<br />
Overcrowding 103 8.1 % -31 2001 44<br />
Travelling to work by foot/bike or public transport 945 38.6 % -13 2001 45<br />
Smoking during pregnancy (3 yrs) 2 17 17.9 % -26 02-04 46<br />
Breastfeeding (at 6 - 8 week review) 8 27.3 % -25 04-06 47<br />
Low birth-weight babies ( 3 yrs) 2 1-4 2.3 % -7 02-04 48<br />
Immunisation uptake at 24 mths - MMR - 86.2 % -5<br />
04-06 50<br />
-all excl. MMR - 98.9 % +3<br />
Dental hospital admissions <strong>for</strong> children 3 7 1.1 cr -7 03-06 51<br />
Teenage pregnancy - under 18 years (3 yrs) 2 9 37.0 cr3 -8 02-04 52<br />
Road accident casualties - children 3 1-4 5.9 cr3 +110 01-04 16<br />
-70 -60 -50 -40 -30 -20 -10 0 +10+20 +30 +40 +50 +60 +70<br />
-<br />
(Below) Scottish Average (%) 1 (Above)<br />
+<br />
Time<br />
Period<br />
2006<br />
Defn<br />
1<br />
Notes<br />
Key<br />
1. The graph shows the "measure" (e.g. crude rate, percentage, years of life) expressed as a percentage below or above the Scottish measure, but using a range from a minimum of -70% to<br />
a maximum of +70% only. The actual plus/minus percentage value is shown in bold to the right of the graph. This is calculated as the area 'measure' minus the Scottish measure, divided by<br />
Scottish measure and multiplied by 100.<br />
2. Numbers presented over a period of years (e.g. 5 years <strong>for</strong> mortality) but rates are annual average rates.<br />
3. Average annual numbers and rates. 4. Numbers and rates presented over a period of years (e.g. 10 years <strong>for</strong> drug deaths).<br />
5. Employee numbers based on location of business, not residence area of employees.<br />
cr - crude rate per 100 population; cr2 - crude rate per 100,000 population; cr3 - crude rate per 1,000 resident population; cr4 - crude rate per 10,000 resident population; cr5 - crude rate per<br />
1,000 live births; sr - age-sex standardised rate per 100,000 population; yrs - years; %* - single parent households as % of households with children. Defn - see table of definitions & sources<br />
The 6th column of the spine chart indicates where an indicator is not compared to the Scottish average but with a local alternative: G - <strong>Glasgow</strong> City average; G* - average of <strong>Glasgow</strong>, E &<br />
W <strong>Dunbartonshire</strong>, Renfrewshire & <strong>East</strong> Renfrewshire; GGC - Greater <strong>Glasgow</strong> and Clyde (excluding Lanarkshire parts); shading on an indicator bar also indicates where a 'local' comparator<br />
is used.<br />
n/a: data not available (usually due to lack of coverage) or cannot be calculated. In addition, <strong>for</strong> particular indicators where the number of cases is below five and not zero, the range is shown<br />
i.e. '1-4'. NB If the number of teenage pregnancies is in the range '1-4' the rate is suppressed to avoid possible disclosure.<br />
A Community <strong>Health</strong> and Wellbeing Profile <strong>for</strong> <strong>East</strong> <strong>Dunbartonshire</strong> 59
South Castlehill and Thorn<br />
Key: South Castlehill and Thorn 95% Confidence Intervals Scotland<br />
100<br />
Male Life Expectancy<br />
100<br />
Female Life Expectancy<br />
95<br />
95<br />
Life expectancy in years<br />
90<br />
85<br />
80<br />
75<br />
70<br />
65<br />
75.7<br />
82.0<br />
Life expectancy in years<br />
90<br />
85<br />
80<br />
75<br />
70<br />
65<br />
78.5<br />
87.4<br />
60<br />
60<br />
55<br />
1994-1998 1996-2000 1999-2003 2001-2005<br />
55<br />
1994-1998 1996-2000 1999-2003 2001-2005<br />
3000<br />
2500<br />
2000<br />
1500<br />
1000<br />
500<br />
0<br />
<strong>Population</strong> by Age Group<br />
0 - 15 years 16 - 44 years<br />
45 - 64 years 65 years and over<br />
1996 1997 1998 1999 2000 2001 2002 2003 2004 2005 2006<br />
1394<br />
1250<br />
992<br />
692<br />
% workless of working age population<br />
35%<br />
30%<br />
25%<br />
20%<br />
15%<br />
10%<br />
5%<br />
0%<br />
Worklessness<br />
7.3%<br />
6.1%<br />
1999 2000 2001 2002 2003 2004 2005 2006<br />
% of mothers breastfeeding at 6/8 weeks<br />
85<br />
80<br />
75<br />
70<br />
65<br />
60<br />
55<br />
50<br />
45<br />
40<br />
35<br />
30<br />
25<br />
20<br />
15<br />
10<br />
5<br />
0<br />
Breast Feeding<br />
66.3<br />
66.3<br />
97-99 98-00 99-01 00-02 01-03 02-04 03-05 04-06<br />
Age/sex standardised rate per 100,000 pop<br />
1800<br />
1600<br />
1400<br />
1200<br />
1000<br />
800<br />
600<br />
400<br />
200<br />
0<br />
Hospital Patients with Alcohol Attributable &<br />
Related Conditions<br />
384<br />
97-99 98-00 99-01 00-02 01-03 02-04 03-05 04-06<br />
375<br />
Age/sex standardised rate per 100,000 pop<br />
1600<br />
1400<br />
1200<br />
1000<br />
800<br />
600<br />
400<br />
200<br />
0<br />
Heart Disease Hospital Patients<br />
815<br />
486<br />
96-98 97-99 98-00 99-01 00-02 01-03 02-04 03-05 04-06<br />
Age/sex standardised rate per 100,000 pop<br />
10000<br />
9000<br />
8000<br />
7000<br />
6000<br />
5000<br />
4000<br />
3000<br />
2000<br />
1000<br />
0<br />
Emergency Medical Admission Patients<br />
4727<br />
4044<br />
96-98 97-99 98-00 99-01 00-02 01-03 02-04 03-05 04-06<br />
NB PLEASE NOTE THAT IN SOME CASES RATES/PERCENTAGES MAY BE BASED ON SMALL NUMBERS.<br />
60
<strong>Population</strong> Demographics<br />
Mortality<br />
Drugs,<br />
Alcohol and<br />
Smoking<br />
Social<br />
Crime Prosperity - Poverty<br />
Hospitalisation & Injury<br />
Mental <strong>Health</strong> &<br />
Function<br />
Work<br />
Education<br />
Housing &<br />
Transport<br />
Child & Maternal<br />
<strong>Health</strong><br />
Indicator<br />
South Castlehill and Thorn<br />
Number<br />
Measure<br />
-70 -60 -50 -40 -30 -20 -10 0 +10+20 +30 +40 +50 +60 +70<br />
Child population (aged 0-15) 992 22.9 % +27<br />
Adult population (aged 16-64) 2,644 61.1 % -7<br />
Elderly population (aged 65+) 692 16.0 % -2<br />
Minority ethnic groups 185 4.1 % +105 2001 2<br />
Asylum Seekers n/a n/a % G 2007 3<br />
Life expectancy - males - 82.0 yrs +11<br />
Life expectancy - females - 87.4 yrs +11<br />
01-05 4<br />
Live births 29 0.7 cr -38 2006 5<br />
Households - Single adults n/a n/a % G<br />
Single parents n/a n/a %* G<br />
2005 6<br />
Deaths all ages (5 yrs) 2 116 420.7 sr -47<br />
Coronary heart disease deaths in under 75s (5 yrs) 2 7 29.2 sr -62<br />
Cancer deaths in under 75s (5 yrs) 2 21 84.3 sr -42<br />
01-05 7<br />
Cerebrovascular disease deaths in under 75s (5 yrs) 2 3 11.6 sr -52<br />
Alcohol related and attributable hospital patients 3 18 374.8 sr -13 04-06 8<br />
Alcohol related deaths (5 yrs) 2 4 15.2 sr -44 01-05 9<br />
Estimated smokers (16+) 440 12.9 % -52 03-04 10<br />
Drug related hospital patients 3 1-4 18.2 sr -77 04-06 11<br />
Drug related deaths (10 yrs) 4 1 22.2 cr2 -65 97-06 12<br />
Patients registered with cancer 3 19 346.5 sr -18 02-04 13<br />
Heart disease patients 3 26 486.1 sr -32<br />
Cerebrovascular disease patients 3 7 123.5 sr -34<br />
Emergency medical admission patients 3 192 4,043.9 sr -35 04-06 14<br />
Multiple admission patients 3 33 653.9 sr -46<br />
Unintentional Injury patients 3 28 675.9 sr -33<br />
Patients prescribed statins 868 18.2 % 0 2006 15<br />
Road accident casualties - adults 3 7 2.1 cr3 -48 01-04 16<br />
Assault discharges 3 1-4 0.2 cr3 -85 04-06 17<br />
Suicide (5 yrs) 2 0 0.0 sr -100 01-05 18<br />
Self assessed health (classified as "Not Good") 233 5.2 % -49 2001 19<br />
First hospital admission - psychiatric 3 9 181.4 sr -29 02-04 20<br />
Patients prescribed drugs <strong>for</strong> anxiety /depression 283 5.9 % -27 2006 21<br />
Incapacity Benefit & SDA Claimants 100 3.9 % -59 2007 22<br />
Long-term limiting illness 503 11.2 % -45 2001 23<br />
Clients aged 0-15 22 2.2 % G* -69<br />
Clients aged 16-64 82 3.1 % G* -31 2007 24<br />
Clients aged 65+ 85 12.3 % G* -31<br />
'Income deprivedʼ 233 5.4 % -61 2006 25<br />
ʻEmployment deprivedʼ 129 5.1 % -60 2006 26<br />
Workless 155 6.1 % -58 2006 27<br />
JSA - Unemployment 30 1.2 % -57 2007 28<br />
Households without access to car/van 188 11.7 % -66 2001 29<br />
Children in workless households 127 10.1 % -45 2001 30<br />
Social grade E - benefit, unemployed, lowest grade work 344 10.2 % -54 2001 31<br />
Workplaces 105 41.6 cr3 -23 2005 32<br />
Employees 5 400 16.9 cr -77 2005 33<br />
Primary school attendance - 95.0 % 0 05/06 34<br />
S4 Pupils with 5+ GCSE equivalents 46 82.1 % +42 05/06 35<br />
Adults without qualifications 448 14.2 % -57 2001 36<br />
Serious violent crime 3 2 5.4 cr4 -63 04-06 37<br />
Domestic abuse incidents 3 12 27.7 cr4 -68 04-06 38<br />
Vandalism 3 64 148.3 cr4 G GC -45 04-06 39<br />
Drug Offenders 3 17 39.9 cr4 G GC -60 04-06 40<br />
Housing type - tenements n/a n/a % G 2006 41<br />
House prices - 292,090 £ +118 2006 42<br />
Housing tenure - Owner Occupiers n/a n/a % G 2007 43<br />
Overcrowding 82 5.1 % -56 2001 44<br />
Travelling to work by foot/bike or public transport 1,192 40.1 % -10 2001 45<br />
Smoking during pregnancy (3 yrs) 2 15 14.7 % -39 02-04 46<br />
Breastfeeding (at 6 - 8 week review) 23 66.3 % +82 04-06 47<br />
Low birth-weight babies ( 3 yrs) 2 0 0.0 % -100 02-04 48<br />
Immunisation uptake at 24 mths - MMR - 88.5 % -2<br />
04-06 50<br />
-all excl. MMR - 96.2 % 0<br />
Dental hospital admissions <strong>for</strong> children 3 8 0.8 cr -32 03-06 51<br />
Teenage pregnancy - under 18 years (3 yrs) 2 1-4 - cr3 02-04 52<br />
Road accident casualties - children 3 0 0.0 cr3 -100 01-04 16<br />
-70 -60 -50 -40 -30 -20 -10 0 +10+20 +30 +40 +50 +60 +70<br />
-<br />
(Below) Scottish Average (%) 1 (Above)<br />
+<br />
Time<br />
Period<br />
2006<br />
Defn<br />
1<br />
Notes<br />
Key<br />
1. The graph shows the "measure" (e.g. crude rate, percentage, years of life) expressed as a percentage below or above the Scottish measure, but using a range from a minimum of -70% to<br />
a maximum of +70% only. The actual plus/minus percentage value is shown in bold to the right of the graph. This is calculated as the area 'measure' minus the Scottish measure, divided by<br />
Scottish measure and multiplied by 100.<br />
2. Numbers presented over a period of years (e.g. 5 years <strong>for</strong> mortality) but rates are annual average rates.<br />
3. Average annual numbers and rates. 4. Numbers and rates presented over a period of years (e.g. 10 years <strong>for</strong> drug deaths).<br />
5. Employee numbers based on location of business, not residence area of employees.<br />
cr - crude rate per 100 population; cr2 - crude rate per 100,000 population; cr3 - crude rate per 1,000 resident population; cr4 - crude rate per 10,000 resident population; cr5 - crude rate per<br />
1,000 live births; sr - age-sex standardised rate per 100,000 population; yrs - years; %* - single parent households as % of households with children. Defn - see table of definitions & sources<br />
The 6th column of the spine chart indicates where an indicator is not compared to the Scottish average but with a local alternative: G - <strong>Glasgow</strong> City average; G* - average of <strong>Glasgow</strong>, E &<br />
W <strong>Dunbartonshire</strong>, Renfrewshire & <strong>East</strong> Renfrewshire; GGC - Greater <strong>Glasgow</strong> and Clyde (excluding Lanarkshire parts); shading on an indicator bar also indicates where a 'local' comparator<br />
is used.<br />
n/a: data not available (usually due to lack of coverage) or cannot be calculated. In addition, <strong>for</strong> particular indicators where the number of cases is below five and not zero, the range is shown<br />
i.e. '1-4'. NB If the number of teenage pregnancies is in the range '1-4' the rate is suppressed to avoid possible disclosure.<br />
A Community <strong>Health</strong> and Wellbeing Profile <strong>for</strong> <strong>East</strong> <strong>Dunbartonshire</strong> 61
Torrance and Balmore<br />
Key: Torrance and Balmore 95% Confidence Intervals Scotland<br />
100<br />
Male Life Expectancy<br />
100<br />
Female Life Expectancy<br />
95<br />
95<br />
Life expectancy in years<br />
90<br />
85<br />
80<br />
75<br />
70<br />
65<br />
75.6<br />
77.4<br />
Life expectancy in years<br />
90<br />
85<br />
80<br />
75<br />
70<br />
65<br />
83.7<br />
81.9<br />
60<br />
60<br />
55<br />
1994-1998 1996-2000 1999-2003 2001-2005<br />
55<br />
1994-1998 1996-2000 1999-2003 2001-2005<br />
2000<br />
1500<br />
1000<br />
500<br />
0<br />
<strong>Population</strong> by Age Group<br />
0 - 15 years 16 - 44 years<br />
45 - 64 years 65 years and over<br />
1996 1997 1998 1999 2000 2001 2002 2003 2004 2005 2006<br />
1011<br />
943<br />
646<br />
343<br />
% workless of working age population<br />
35%<br />
30%<br />
25%<br />
20%<br />
15%<br />
10%<br />
5%<br />
0%<br />
Worklessness<br />
8.6%<br />
7.6%<br />
1999 2000 2001 2002 2003 2004 2005 2006<br />
% of mothers breastfeeding at 6/8 weeks<br />
85<br />
80<br />
75<br />
70<br />
65<br />
60<br />
55<br />
50<br />
45<br />
40<br />
35<br />
30<br />
25<br />
20<br />
15<br />
10<br />
5<br />
0<br />
Breast Feeding<br />
49.6<br />
48.6<br />
97-99 98-00 99-01 00-02 01-03 02-04 03-05 04-06<br />
Age/sex standardised rate per 100,000 pop<br />
1800<br />
1600<br />
1400<br />
1200<br />
1000<br />
800<br />
600<br />
400<br />
200<br />
0<br />
Hospital Patients with Alcohol Attributable &<br />
Related Conditions<br />
516<br />
97-99 98-00 99-01 00-02 01-03 02-04 03-05 04-06<br />
494<br />
Age/sex standardised rate per 100,000 pop<br />
1600<br />
1400<br />
1200<br />
1000<br />
800<br />
600<br />
400<br />
200<br />
0<br />
Heart Disease Hospital Patients<br />
928<br />
683<br />
96-98 97-99 98-00 99-01 00-02 01-03 02-04 03-05 04-06<br />
Age/sex standardised rate per 100,000 pop<br />
10000<br />
9000<br />
8000<br />
7000<br />
6000<br />
5000<br />
4000<br />
3000<br />
2000<br />
1000<br />
0<br />
Emergency Medical Admission Patients<br />
6004<br />
4629<br />
96-98 97-99 98-00 99-01 00-02 01-03 02-04 03-05 04-06<br />
NB PLEASE NOTE THAT IN SOME CASES RATES/PERCENTAGES MAY BE BASED ON SMALL NUMBERS.<br />
62
<strong>Population</strong> Demographics<br />
Mortality<br />
Drugs,<br />
Alcohol and<br />
Smoking<br />
Social<br />
Crime Prosperity - Poverty<br />
Hospitalisation & Injury<br />
Mental <strong>Health</strong> &<br />
Function<br />
Work<br />
Education<br />
Housing &<br />
Transport<br />
Child & Maternal<br />
<strong>Health</strong><br />
Indicator<br />
Torrance and Balmore<br />
Number<br />
Measure<br />
-70 -60 -50 -40 -30 -20 -10 0 +10+20 +30 +40 +50 +60 +70<br />
Child population (aged 0-15) 646 22.0 % +22<br />
Adult population (aged 16-64) 1,954 66.4 % +1<br />
Elderly population (aged 65+) 343 11.7 % -29<br />
Minority ethnic groups 30 1.0 % -50 2001 2<br />
Asylum Seekers n/a n/a % G 2007 3<br />
Life expectancy - males - 77.4 yrs +5<br />
Life expectancy - females - 81.9 yrs +4<br />
01-05 4<br />
Live births 23 0.8 cr -28 2006 5<br />
Households - Single adults n/a n/a % G<br />
Single parents n/a n/a %* G<br />
2005 6<br />
Deaths all ages (5 yrs) 2 94 703.5 sr -11<br />
Coronary heart disease deaths in under 75s (5 yrs) 2 5 37.7 sr -51<br />
Cancer deaths in under 75s (5 yrs) 2 18 132.7 sr -10<br />
01-05 7<br />
Cerebrovascular disease deaths in under 75s (5 yrs) 2 1 8.4 sr -65<br />
Alcohol related and attributable hospital patients 3 15 493.9 sr +20 04-06 8<br />
Alcohol related deaths (5 yrs) 2 2 11.3 sr -59 01-05 9<br />
Estimated smokers (16+) 403 17.4 % -36 03-04 10<br />
Drug related hospital patients 3 1-4 20.8 sr -73 04-06 11<br />
Drug related deaths (10 yrs) 4 0 0.0 cr2 -100 97-06 12<br />
Patients registered with cancer 3 11 383.3 sr -9 02-04 13<br />
Heart disease patients 3 21 682.8 sr -4<br />
Cerebrovascular disease patients 3 7 251.3 sr +34<br />
Emergency medical admission patients 3 132 4,628.7 sr -26 04-06 14<br />
Multiple admission patients 3 24 913.1 sr -25<br />
Unintentional Injury patients 3 24 840.6 sr -17<br />
Patients prescribed statins 644 21.0 % +15 2006 15<br />
Road accident casualties - adults 3 7 3.2 cr3 -20 01-04 16<br />
Assault discharges 3 1-4 0.5 cr3 -56 04-06 17<br />
Suicide (5 yrs) 2 1 8.2 sr -48 01-05 18<br />
Self assessed health (classified as "Not Good") 189 6.3 % -38 2001 19<br />
First hospital admission - psychiatric 3 3 98.1 sr -62 02-04 20<br />
Patients prescribed drugs <strong>for</strong> anxiety /depression 232 7.6 % -6 2006 21<br />
Incapacity Benefit & SDA Claimants 105 5.5 % -43 2007 22<br />
Long-term limiting illness 426 14.2 % -30 2001 23<br />
Clients aged 0-15 10 1.5 % G* -78<br />
Clients aged 16-64 55 2.8 % G* -37 2007 24<br />
Clients aged 65+ 36 10.5 % G* -41<br />
'Income deprivedʼ 171 5.8 % -58 2006 25<br />
ʻEmployment deprivedʼ 139 7.3 % -43 2006 26<br />
Workless 145 7.6 % -48 2006 27<br />
JSA - Unemployment 20 1.1 % -62 2007 28<br />
Households without access to car/van 145 13.4 % -61 2001 29<br />
Children in workless households 35 4.5 % -76 2001 30<br />
Social grade E - benefit, unemployed, lowest grade work 291 12.6 % -44 2001 31<br />
Workplaces 87 45.9 cr3 -15 2005 32<br />
Employees 5 500 25.4 cr -66 2005 33<br />
Primary school attendance - 95.2 % 0 05/06 34<br />
S4 Pupils with 5+ GCSE equivalents 30 81.1 % +40 05/06 35<br />
Adults without qualifications 519 23.8 % -28 2001 36<br />
Serious violent crime 3 2 6.8 cr4 -54 04-06 37<br />
Domestic abuse incidents 3 9 31.6 cr4 -63 04-06 38<br />
Vandalism 3 25 85.8 cr4 G GC -68 04-06 39<br />
Drug Offenders 3 11 36.1 cr4 G GC -64 04-06 40<br />
Housing type - tenements n/a n/a % G 2006 41<br />
House prices - 185,371 £ +38 2006 42<br />
Housing tenure - Owner Occupiers n/a n/a % G 2007 43<br />
Overcrowding 61 5.6 % -52 2001 44<br />
Travelling to work by foot/bike or public transport 722 34.8 % -22 2001 45<br />
Smoking during pregnancy (3 yrs) 2 6 9.1 % -63 02-04 46<br />
Breastfeeding (at 6 - 8 week review) 12 48.6 % +33 04-06 47<br />
Low birth-weight babies ( 3 yrs) 2 0 0.0 % -100 02-04 48<br />
Immunisation uptake at 24 mths - MMR - 90.7 % 0<br />
04-06 50<br />
-all excl. MMR - 97.7 % +2<br />
Dental hospital admissions <strong>for</strong> children 3 1-4 0.5 cr -56 03-06 51<br />
Teenage pregnancy - under 18 years (3 yrs) 2 6 28.6 cr3 -29 02-04 52<br />
Road accident casualties - children 3 1-4 1.1 cr3 -60 01-04 16<br />
-70 -60 -50 -40 -30 -20 -10 0 +10+20 +30 +40 +50 +60 +70<br />
-<br />
(Below) Scottish Average (%) 1 (Above)<br />
+<br />
Time<br />
Period<br />
2006<br />
Defn<br />
1<br />
Notes<br />
Key<br />
1. The graph shows the "measure" (e.g. crude rate, percentage, years of life) expressed as a percentage below or above the Scottish measure, but using a range from a minimum of -70% to<br />
a maximum of +70% only. The actual plus/minus percentage value is shown in bold to the right of the graph. This is calculated as the area 'measure' minus the Scottish measure, divided by<br />
Scottish measure and multiplied by 100.<br />
2. Numbers presented over a period of years (e.g. 5 years <strong>for</strong> mortality) but rates are annual average rates.<br />
3. Average annual numbers and rates. 4. Numbers and rates presented over a period of years (e.g. 10 years <strong>for</strong> drug deaths).<br />
5. Employee numbers based on location of business, not residence area of employees.<br />
cr - crude rate per 100 population; cr2 - crude rate per 100,000 population; cr3 - crude rate per 1,000 resident population; cr4 - crude rate per 10,000 resident population; cr5 - crude rate per<br />
1,000 live births; sr - age-sex standardised rate per 100,000 population; yrs - years; %* - single parent households as % of households with children. Defn - see table of definitions & sources<br />
The 6th column of the spine chart indicates where an indicator is not compared to the Scottish average but with a local alternative: G - <strong>Glasgow</strong> City average; G* - average of <strong>Glasgow</strong>, E &<br />
W <strong>Dunbartonshire</strong>, Renfrewshire & <strong>East</strong> Renfrewshire; GGC - Greater <strong>Glasgow</strong> and Clyde (excluding Lanarkshire parts); shading on an indicator bar also indicates where a 'local' comparator<br />
is used.<br />
n/a: data not available (usually due to lack of coverage) or cannot be calculated. In addition, <strong>for</strong> particular indicators where the number of cases is below five and not zero, the range is shown<br />
i.e. '1-4'. NB If the number of teenage pregnancies is in the range '1-4' the rate is suppressed to avoid possible disclosure.<br />
A Community <strong>Health</strong> and Wellbeing Profile <strong>for</strong> <strong>East</strong> <strong>Dunbartonshire</strong> 63
Twechar and Harestanes <strong>East</strong><br />
Key: Twechar and Harestanes <strong>East</strong> 95% Confidence Intervals Scotland<br />
100<br />
Male Life Expectancy<br />
100<br />
Female Life Expectancy<br />
95<br />
95<br />
Life expectancy in years<br />
90<br />
85<br />
80<br />
75<br />
70<br />
65<br />
68.3<br />
73.1<br />
Life expectancy in years<br />
90<br />
85<br />
80<br />
75<br />
70<br />
65<br />
77.2<br />
75.0<br />
60<br />
60<br />
55<br />
1994-1998 1996-2000 1999-2003 2001-2005<br />
55<br />
1994-1998 1996-2000 1999-2003 2001-2005<br />
2000<br />
1500<br />
1000<br />
500<br />
0<br />
<strong>Population</strong> by Age Group<br />
0 - 15 years 16 - 44 years<br />
45 - 64 years 65 years and over<br />
1996 1997 1998 1999 2000 2001 2002 2003 2004 2005 2006<br />
1175<br />
918<br />
539<br />
362<br />
% workless of working age population<br />
35%<br />
30%<br />
25%<br />
20%<br />
15%<br />
10%<br />
5%<br />
0%<br />
Worklessness<br />
20.0%<br />
18.1%<br />
1999 2000 2001 2002 2003 2004 2005 2006<br />
% of mothers breastfeeding at 6/8 weeks<br />
85<br />
80<br />
75<br />
70<br />
65<br />
60<br />
55<br />
50<br />
45<br />
40<br />
35<br />
30<br />
25<br />
20<br />
15<br />
10<br />
5<br />
0<br />
Breast Feeding<br />
19.4<br />
12.7<br />
97-99 98-00 99-01 00-02 01-03 02-04 03-05 04-06<br />
Age/sex standardised rate per 100,000 pop<br />
1800<br />
1600<br />
1400<br />
1200<br />
1000<br />
800<br />
600<br />
400<br />
200<br />
0<br />
Hospital Patients with Alcohol Attributable &<br />
Related Conditions<br />
801<br />
97-99 98-00 99-01 00-02 01-03 02-04 03-05 04-06<br />
803<br />
Age/sex standardised rate per 100,000 pop<br />
1600<br />
1400<br />
1200<br />
1000<br />
800<br />
600<br />
400<br />
200<br />
0<br />
Heart Disease Hospital Patients<br />
1559<br />
766<br />
96-98 97-99 98-00 99-01 00-02 01-03 02-04 03-05 04-06<br />
Age/sex standardised rate per 100,000 pop<br />
10000<br />
9000<br />
8000<br />
7000<br />
6000<br />
5000<br />
4000<br />
3000<br />
2000<br />
1000<br />
0<br />
Emergency Medical Admission Patients<br />
7014<br />
6794<br />
96-98 97-99 98-00 99-01 00-02 01-03 02-04 03-05 04-06<br />
NB PLEASE NOTE THAT IN SOME CASES RATES/PERCENTAGES MAY BE BASED ON SMALL NUMBERS.<br />
64
<strong>Population</strong> Demographics<br />
Mortality<br />
Drugs,<br />
Alcohol and<br />
Smoking<br />
Social<br />
Crime Prosperity - Poverty<br />
Hospitalisation & Injury<br />
Mental <strong>Health</strong> &<br />
Function<br />
Work<br />
Education<br />
Housing &<br />
Transport<br />
Child & Maternal<br />
<strong>Health</strong><br />
Indicator<br />
Twechar and Harestanes <strong>East</strong><br />
Number<br />
Measure<br />
-70 -60 -50 -40 -30 -20 -10 0 +10+20 +30 +40 +50 +60 +70<br />
Child population (aged 0-15) 539 18.0 % 0<br />
Adult population (aged 16-64) 2,093 69.9 % +7<br />
Elderly population (aged 65+) 362 12.1 % -26<br />
Minority ethnic groups 14 0.4 % -78 2001 2<br />
Asylum Seekers n/a n/a % G 2007 3<br />
Life expectancy - males - 73.1 yrs -1<br />
Life expectancy - females - 75.0 yrs -5<br />
01-05 4<br />
Live births 28 0.9 cr -14 2006 5<br />
Households - Single adults n/a n/a % G<br />
Single parents n/a n/a %* G<br />
2005 6<br />
Deaths all ages (5 yrs) 2 156 999.0 sr +27<br />
Coronary heart disease deaths in under 75s (5 yrs) 2 21 141.8 sr +85<br />
Cancer deaths in under 75s (5 yrs) 2 35 220.1 sr +50<br />
01-05 7<br />
Cerebrovascular disease deaths in under 75s (5 yrs) 2 5 30.1 sr +24<br />
Alcohol related and attributable hospital patients 3 25 803.3 sr +68 04-06 8<br />
Alcohol related deaths (5 yrs) 2 4 22.0 sr -19 01-05 9<br />
Estimated smokers (16+) 904 35.2 % +29 03-04 10<br />
Drug related hospital patients 3 1-4 79.9 sr +3 04-06 11<br />
Drug related deaths (10 yrs) 4 1 31.2 cr2 -51 97-06 12<br />
Patients registered with cancer 3 15 438.7 sr +4 02-04 13<br />
Heart disease patients 3 25 766.2 sr +7<br />
Cerebrovascular disease patients 3 7 223.0 sr +18<br />
Emergency medical admission patients 3 207 6,794.5 sr +9 04-06 14<br />
Multiple admission patients 3 40 1,317.9 sr +8<br />
Unintentional Injury patients 3 27 905.0 sr -10<br />
Patients prescribed statins 723 22.6 % +24 2006 15<br />
Road accident casualties - adults 3 7 2.5 cr3 -37 01-04 16<br />
Assault discharges 3 1-4 1.1 cr3 +7 04-06 17<br />
Suicide (5 yrs) 2 3 18.0 sr +15 01-05 18<br />
Self assessed health (classified as "Not Good") 402 12.5 % +23 2001 19<br />
First hospital admission - psychiatric 3 10 331.6 sr +30 02-04 20<br />
Patients prescribed drugs <strong>for</strong> anxiety /depression 298 9.3 % +15 2006 21<br />
Incapacity Benefit & SDA Claimants 235 11.7 % +21 2007 22<br />
Long-term limiting illness 703 21.8 % +7 2001 23<br />
Clients aged 0-15 50 9.3 % G* +30<br />
Clients aged 16-64 138 6.6 % G* +47 2007 24<br />
Clients aged 65+ 83 22.9 % G* +30<br />
'Income deprivedʼ 418 13.8 % 0 2006 25<br />
ʻEmployment deprivedʼ 311 15.4 % +20 2006 26<br />
Workless 365 18.1 % +23 2006 27<br />
JSA - Unemployment 60 3.0 % +6 2007 28<br />
Households without access to car/van 461 34.8 % +2 2001 29<br />
Children in workless households 125 17.0 % -7 2001 30<br />
Social grade E - benefit, unemployed, lowest grade work 628 24.4 % +9 2001 31<br />
Workplaces 38 18.8 cr3 -65 2005 32<br />
Employees 5 300 15.3 cr -80 2005 33<br />
Primary school attendance - 92.5 % -3 05/06 34<br />
S4 Pupils with 5+ GCSE equivalents 26 55.3 % -4 05/06 35<br />
Adults without qualifications 971 39.6 % +19 2001 36<br />
Serious violent crime 3 4 12.1 cr4 -17 04-06 37<br />
Domestic abuse incidents 3 10 32.0 cr4 -63 04-06 38<br />
Vandalism 3 55 181.9 cr4 G GC -33 04-06 39<br />
Drug Offenders 3 22 71.7 cr4 G GC -29 04-06 40<br />
Housing type - tenements n/a n/a % G 2006 41<br />
House prices - 98,307 £ -27 2006 42<br />
Housing tenure - Owner Occupiers n/a n/a % G 2007 43<br />
Overcrowding 182 13.7 % +17 2001 44<br />
Travelling to work by foot/bike or public transport 875 42.4 % -5 2001 45<br />
Smoking during pregnancy (3 yrs) 2 31 35.2 % +45 02-04 46<br />
Breastfeeding (at 6 - 8 week review) 4 19.4 % -47 04-06 47<br />
Low birth-weight babies ( 3 yrs) 2 1-4 3.7 % +50 02-04 48<br />
Immunisation uptake at 24 mths - MMR - 84.4 % -6<br />
04-06 50<br />
-all excl. MMR - 98.9 % +3<br />
Dental hospital admissions <strong>for</strong> children 3 12 2.2 cr +89 03-06 51<br />
Teenage pregnancy - under 18 years (3 yrs) 2 11 48.9 cr3 +21 02-04 52<br />
Road accident casualties - children 3 1-4 2.6 cr3 -9 01-04 16<br />
-70 -60 -50 -40 -30 -20 -10 0 +10+20 +30 +40 +50 +60 +70<br />
-<br />
(Below) Scottish Average (%) 1 (Above)<br />
+<br />
Time<br />
Period<br />
2006<br />
Defn<br />
1<br />
Notes<br />
Key<br />
1. The graph shows the "measure" (e.g. crude rate, percentage, years of life) expressed as a percentage below or above the Scottish measure, but using a range from a minimum of -70% to<br />
a maximum of +70% only. The actual plus/minus percentage value is shown in bold to the right of the graph. This is calculated as the area 'measure' minus the Scottish measure, divided by<br />
Scottish measure and multiplied by 100.<br />
2. Numbers presented over a period of years (e.g. 5 years <strong>for</strong> mortality) but rates are annual average rates.<br />
3. Average annual numbers and rates. 4. Numbers and rates presented over a period of years (e.g. 10 years <strong>for</strong> drug deaths).<br />
5. Employee numbers based on location of business, not residence area of employees.<br />
cr - crude rate per 100 population; cr2 - crude rate per 100,000 population; cr3 - crude rate per 1,000 resident population; cr4 - crude rate per 10,000 resident population; cr5 - crude rate per<br />
1,000 live births; sr - age-sex standardised rate per 100,000 population; yrs - years; %* - single parent households as % of households with children. Defn - see table of definitions & sources<br />
The 6th column of the spine chart indicates where an indicator is not compared to the Scottish average but with a local alternative: G - <strong>Glasgow</strong> City average; G* - average of <strong>Glasgow</strong>, E &<br />
W <strong>Dunbartonshire</strong>, Renfrewshire & <strong>East</strong> Renfrewshire; GGC - Greater <strong>Glasgow</strong> and Clyde (excluding Lanarkshire parts); shading on an indicator bar also indicates where a 'local' comparator<br />
is used.<br />
n/a: data not available (usually due to lack of coverage) or cannot be calculated. In addition, <strong>for</strong> particular indicators where the number of cases is below five and not zero, the range is shown<br />
i.e. '1-4'. NB If the number of teenage pregnancies is in the range '1-4' the rate is suppressed to avoid possible disclosure.<br />
A Community <strong>Health</strong> and Wellbeing Profile <strong>for</strong> <strong>East</strong> <strong>Dunbartonshire</strong> 65
West Clober and Mains Estate<br />
Key: West Clober and Mains Estate 95% Confidence Intervals Scotland<br />
100<br />
Male Life Expectancy<br />
100<br />
Female Life Expectancy<br />
95<br />
95<br />
Life expectancy in years<br />
90<br />
85<br />
80<br />
75<br />
70<br />
65<br />
73.4<br />
81.7<br />
Life expectancy in years<br />
90<br />
85<br />
80<br />
75<br />
70<br />
65<br />
85.3<br />
82.8<br />
60<br />
60<br />
55<br />
1994-1998 1996-2000 1999-2003 2001-2005<br />
55<br />
1994-1998 1996-2000 1999-2003 2001-2005<br />
2000<br />
1500<br />
1000<br />
500<br />
0<br />
<strong>Population</strong> by Age Group<br />
0 - 15 years 16 - 44 years<br />
45 - 64 years 65 years and over<br />
1996 1997 1998 1999 2000 2001 2002 2003 2004 2005 2006<br />
1116<br />
888<br />
736<br />
297<br />
% workless of working age population<br />
35%<br />
30%<br />
25%<br />
20%<br />
15%<br />
10%<br />
5%<br />
0%<br />
Worklessness<br />
3.1%<br />
4.3%<br />
1999 2000 2001 2002 2003 2004 2005 2006<br />
% of mothers breastfeeding at 6/8 weeks<br />
85<br />
80<br />
75<br />
70<br />
65<br />
60<br />
55<br />
50<br />
45<br />
40<br />
35<br />
30<br />
25<br />
20<br />
15<br />
10<br />
5<br />
0<br />
Breast Feeding<br />
59.8<br />
49.3<br />
97-99 98-00 99-01 00-02 01-03 02-04 03-05 04-06<br />
Age/sex standardised rate per 100,000 pop<br />
1800<br />
1600<br />
1400<br />
1200<br />
1000<br />
800<br />
600<br />
400<br />
200<br />
0<br />
Hospital Patients with Alcohol Attributable &<br />
Related Conditions<br />
355<br />
97-99 98-00 99-01 00-02 01-03 02-04 03-05 04-06<br />
361<br />
Age/sex standardised rate per 100,000 pop<br />
1600<br />
1400<br />
1200<br />
1000<br />
800<br />
600<br />
400<br />
200<br />
0<br />
Heart Disease Hospital Patients<br />
796<br />
372<br />
96-98 97-99 98-00 99-01 00-02 01-03 02-04 03-05 04-06<br />
Age/sex standardised rate per 100,000 pop<br />
10000<br />
9000<br />
8000<br />
7000<br />
6000<br />
5000<br />
4000<br />
3000<br />
2000<br />
1000<br />
0<br />
Emergency Medical Admission Patients<br />
4342<br />
3329<br />
96-98 97-99 98-00 99-01 00-02 01-03 02-04 03-05 04-06<br />
NB PLEASE NOTE THAT IN SOME CASES RATES/PERCENTAGES MAY BE BASED ON SMALL NUMBERS.<br />
66
<strong>Population</strong> Demographics<br />
Mortality<br />
Drugs,<br />
Alcohol and<br />
Smoking<br />
Social<br />
Crime Prosperity - Poverty<br />
Hospitalisation & Injury<br />
Mental <strong>Health</strong> &<br />
Function<br />
Work<br />
Education<br />
Housing &<br />
Transport<br />
Child & Maternal<br />
<strong>Health</strong><br />
Indicator<br />
West Clober and Mains Estate<br />
Number<br />
Measure<br />
-70 -60 -50 -40 -30 -20 -10 0 +10+20 +30 +40 +50 +60 +70<br />
Child population (aged 0-15) 736 24.2 % +35<br />
Adult population (aged 16-64) 2,004 66.0 % +1<br />
Elderly population (aged 65+) 297 9.8 % -40<br />
Minority ethnic groups 86 2.9 % +43 2001 2<br />
Asylum Seekers n/a n/a % G 2007 3<br />
Life expectancy - males - 81.7 yrs +11<br />
Life expectancy - females - 82.8 yrs +5<br />
01-05 4<br />
Live births 26 0.9 cr -21 2006 5<br />
Households - Single adults n/a n/a % G<br />
Single parents n/a n/a %* G<br />
2005 6<br />
Deaths all ages (5 yrs) 2 46 469.7 sr -40<br />
Coronary heart disease deaths in under 75s (5 yrs) 2 2 13.4 sr -83<br />
Cancer deaths in under 75s (5 yrs) 2 12 95.5 sr -35<br />
01-05 7<br />
Cerebrovascular disease deaths in under 75s (5 yrs) 2 1 5.1 sr -79<br />
Alcohol related and attributable hospital patients 3 9 361.2 sr +15 04-06 8<br />
Alcohol related deaths (5 yrs) 2 2 12.5 sr -54 01-05 9<br />
Estimated smokers (16+) 447 20.6 % -24 03-04 10<br />
Drug related hospital patients 3 1-4 10.1 sr -87 04-06 11<br />
Drug related deaths (10 yrs) 4 0 0.0 cr2 -100 97-06 12<br />
Patients registered with cancer 3 9 343.0 sr -18 02-04 13<br />
Heart disease patients 3 10 371.6 sr -48<br />
Cerebrovascular disease patients 3 2 124.1 sr -34<br />
Emergency medical admission patients 3 88 3,328.9 sr -47 04-06 14<br />
Multiple admission patients 3 10 372.4 sr -69<br />
Unintentional Injury patients 3 15 571.9 sr -43<br />
Patients prescribed statins 633 20.9 % +15 2006 15<br />
Road accident casualties - adults 3 1-4 1.6 cr3 -61 01-04 16<br />
Assault discharges 3 0 0.0 cr3 -100 04-06 17<br />
Suicide (5 yrs) 2 3 17.3 sr +10 01-05 18<br />
Self assessed health (classified as "Not Good") 119 4.0 % -61 2001 19<br />
First hospital admission - psychiatric 3 3 98.0 sr -62 02-04 20<br />
Patients prescribed drugs <strong>for</strong> anxiety /depression 191 6.3 % -22 2006 21<br />
Incapacity Benefit & SDA Claimants 50 2.6 % -73 2007 22<br />
Long-term limiting illness 254 8.5 % -58 2001 23<br />
Clients aged 0-15 17 2.3 % G* -68<br />
Clients aged 16-64 41 2.0 % G* -54 2007 24<br />
Clients aged 65+ 14 4.7 % G* -73<br />
'Income deprivedʼ 67 2.2 % -84 2006 25<br />
ʻEmployment deprivedʼ 71 3.7 % -71 2006 26<br />
Workless 85 4.3 % -70 2006 27<br />
JSA - Unemployment 15 0.8 % -72 2007 28<br />
Households without access to car/van 74 7.1 % -79 2001 29<br />
Children in workless households 30 3.3 % -82 2001 30<br />
Social grade E - benefit, unemployed, lowest grade work 144 6.6 % -70 2001 31<br />
Workplaces 61 31.6 cr3 -42 2005 32<br />
Employees 5 300 14.1 cr -81 2005 33<br />
Primary school attendance - 95.4 % 0 05/06 34<br />
S4 Pupils with 5+ GCSE equivalents 44 84.6 % +46 05/06 35<br />
Adults without qualifications 301 14.3 % -57 2001 36<br />
Serious violent crime 3 0 0.0 cr4 -100 04-06 37<br />
Domestic abuse incidents 3 6 18.5 cr4 -78 04-06 38<br />
Vandalism 3 44 143.9 cr4 G GC -47 04-06 39<br />
Drug Offenders 3 8 26.2 cr4 G GC -74 04-06 40<br />
Housing type - tenements n/a n/a % G 2006 41<br />
House prices - 211,764 £ +58 2006 42<br />
Housing tenure - Owner Occupiers n/a n/a % G 2007 43<br />
Overcrowding 40 3.8 % -67 2001 44<br />
Travelling to work by foot/bike or public transport 676 31.3 % -30 2001 45<br />
Smoking during pregnancy (3 yrs) 2 15 15.5 % -36 02-04 46<br />
Breastfeeding (at 6 - 8 week review) 12 49.3 % +35 04-06 47<br />
Low birth-weight babies ( 3 yrs) 2 1-4 1.1 % -56 02-04 48<br />
Immunisation uptake at 24 mths - MMR - 93.9 % +4<br />
04-06 50<br />
-all excl. MMR - 96.9 % +1<br />
Dental hospital admissions <strong>for</strong> children 3 1-4 0.4 cr -63 03-06 51<br />
Teenage pregnancy - under 18 years (3 yrs) 2 1-4 - cr3 02-04 52<br />
Road accident casualties - children 3 1-4 0.3 cr3 -89 01-04 16<br />
-70 -60 -50 -40 -30 -20 -10 0 +10+20 +30 +40 +50 +60 +70<br />
-<br />
(Below) Scottish Average (%) 1 (Above)<br />
+<br />
Time<br />
Period<br />
2006<br />
Defn<br />
1<br />
Notes<br />
Key<br />
1. The graph shows the "measure" (e.g. crude rate, percentage, years of life) expressed as a percentage below or above the Scottish measure, but using a range from a minimum of -70% to<br />
a maximum of +70% only. The actual plus/minus percentage value is shown in bold to the right of the graph. This is calculated as the area 'measure' minus the Scottish measure, divided by<br />
Scottish measure and multiplied by 100.<br />
2. Numbers presented over a period of years (e.g. 5 years <strong>for</strong> mortality) but rates are annual average rates.<br />
3. Average annual numbers and rates. 4. Numbers and rates presented over a period of years (e.g. 10 years <strong>for</strong> drug deaths).<br />
5. Employee numbers based on location of business, not residence area of employees.<br />
cr - crude rate per 100 population; cr2 - crude rate per 100,000 population; cr3 - crude rate per 1,000 resident population; cr4 - crude rate per 10,000 resident population; cr5 - crude rate per<br />
1,000 live births; sr - age-sex standardised rate per 100,000 population; yrs - years; %* - single parent households as % of households with children. Defn - see table of definitions & sources<br />
The 6th column of the spine chart indicates where an indicator is not compared to the Scottish average but with a local alternative: G - <strong>Glasgow</strong> City average; G* - average of <strong>Glasgow</strong>, E &<br />
W <strong>Dunbartonshire</strong>, Renfrewshire & <strong>East</strong> Renfrewshire; GGC - Greater <strong>Glasgow</strong> and Clyde (excluding Lanarkshire parts); shading on an indicator bar also indicates where a 'local' comparator<br />
is used.<br />
n/a: data not available (usually due to lack of coverage) or cannot be calculated. In addition, <strong>for</strong> particular indicators where the number of cases is below five and not zero, the range is shown<br />
i.e. '1-4'. NB If the number of teenage pregnancies is in the range '1-4' the rate is suppressed to avoid possible disclosure.<br />
A Community <strong>Health</strong> and Wellbeing Profile <strong>for</strong> <strong>East</strong> <strong>Dunbartonshire</strong> 67
Westerton <strong>East</strong><br />
Key: Westerton <strong>East</strong> 95% Confidence Intervals Scotland<br />
100<br />
Male Life Expectancy<br />
100<br />
Female Life Expectancy<br />
95<br />
95<br />
Life expectancy in years<br />
90<br />
85<br />
80<br />
75<br />
70<br />
65<br />
76.0<br />
77.3<br />
Life expectancy in years<br />
90<br />
85<br />
80<br />
75<br />
70<br />
65<br />
79.1<br />
80.5<br />
60<br />
60<br />
55<br />
1994-1998 1996-2000 1999-2003 2001-2005<br />
55<br />
1994-1998 1996-2000 1999-2003 2001-2005<br />
2000<br />
1500<br />
1000<br />
500<br />
0<br />
<strong>Population</strong> by Age Group<br />
0 - 15 years 16 - 44 years<br />
45 - 64 years 65 years and over<br />
1996 1997 1998 1999 2000 2001 2002 2003 2004 2005 2006<br />
1024<br />
983<br />
663<br />
547<br />
% workless of working age population<br />
35%<br />
30%<br />
25%<br />
20%<br />
15%<br />
10%<br />
5%<br />
0%<br />
Worklessness<br />
5.4%<br />
3.4%<br />
1999 2000 2001 2002 2003 2004 2005 2006<br />
% of mothers breastfeeding at 6/8 weeks<br />
85<br />
80<br />
75<br />
70<br />
65<br />
60<br />
55<br />
50<br />
45<br />
40<br />
35<br />
30<br />
25<br />
20<br />
15<br />
10<br />
5<br />
0<br />
Breast Feeding<br />
56.0<br />
58.1<br />
97-99 98-00 99-01 00-02 01-03 02-04 03-05 04-06<br />
Age/sex standardised rate per 100,000 pop<br />
1800<br />
1600<br />
1400<br />
1200<br />
1000<br />
800<br />
600<br />
400<br />
200<br />
0<br />
Hospital Patients with Alcohol Attributable &<br />
Related Conditions<br />
359<br />
97-99 98-00 99-01 00-02 01-03 02-04 03-05 04-06<br />
269<br />
Age/sex standardised rate per 100,000 pop<br />
1600<br />
1400<br />
1200<br />
1000<br />
800<br />
600<br />
400<br />
200<br />
0<br />
Heart Disease Hospital Patients<br />
512<br />
468<br />
96-98 97-99 98-00 99-01 00-02 01-03 02-04 03-05 04-06<br />
Age/sex standardised rate per 100,000 pop<br />
10000<br />
9000<br />
8000<br />
7000<br />
6000<br />
5000<br />
4000<br />
3000<br />
2000<br />
1000<br />
0<br />
Emergency Medical Admission Patients<br />
4048<br />
3980<br />
96-98 97-99 98-00 99-01 00-02 01-03 02-04 03-05 04-06<br />
NB PLEASE NOTE THAT IN SOME CASES RATES/PERCENTAGES MAY BE BASED ON SMALL NUMBERS.<br />
68
<strong>Population</strong> Demographics<br />
Mortality<br />
Drugs,<br />
Alcohol and<br />
Smoking<br />
Social<br />
Crime Prosperity - Poverty<br />
Hospitalisation & Injury<br />
Mental <strong>Health</strong> &<br />
Function<br />
Work<br />
Education<br />
Housing &<br />
Transport<br />
Child & Maternal<br />
<strong>Health</strong><br />
Indicator<br />
Westerton <strong>East</strong><br />
Number<br />
Measure<br />
-70 -60 -50 -40 -30 -20 -10 0 +10+20 +30 +40 +50 +60 +70<br />
Child population (aged 0-15) 663 20.6 % +14<br />
Adult population (aged 16-64) 2,007 62.4 % -5<br />
Elderly population (aged 65+) 547 17.0 % +4<br />
Minority ethnic groups 224 6.9 % +245 2001 2<br />
Asylum Seekers n/a n/a % G 2007 3<br />
Life expectancy - males - 77.3 yrs +5<br />
Life expectancy - females - 80.5 yrs +2<br />
01-05 4<br />
Live births 37 1.2 cr +6 2006 5<br />
Households - Single adults n/a n/a % G<br />
Single parents n/a n/a %* G<br />
2005 6<br />
Deaths all ages (5 yrs) 2 215 742.1 sr -6<br />
Coronary heart disease deaths in under 75s (5 yrs) 2 8 35.5 sr -54<br />
Cancer deaths in under 75s (5 yrs) 2 18 95.5 sr -35<br />
01-05 7<br />
Cerebrovascular disease deaths in under 75s (5 yrs) 2 5 25.7 sr +6<br />
Alcohol related and attributable hospital patients 3 11 268.7 sr -27 04-06 8<br />
Alcohol related deaths (5 yrs) 2 2 8.5 sr -69 01-05 9<br />
Estimated smokers (16+) 359 14.0 % -49 03-04 10<br />
Drug related hospital patients 3 0 0.0 sr -100 04-06 11<br />
Drug related deaths (10 yrs) 4 0 0.0 cr2 -100 97-06 12<br />
Patients registered with cancer 3 15 333.9 sr -21 02-04 13<br />
Heart disease patients 3 23 512.3 sr -28<br />
Cerebrovascular disease patients 3 6 122.7 sr -35<br />
Emergency medical admission patients 3 155 3,980.4 sr -36 04-06 14<br />
Multiple admission patients 3 28 593.9 sr -51<br />
Unintentional Injury patients 3 23 564.8 sr -44<br />
Patients prescribed statins 643 18.9 % +4 2006 15<br />
Road accident casualties - adults 3 8 3.2 cr3 -19 01-04 16<br />
Assault discharges 3 1-4 0.3 cr3 -70 04-06 17<br />
Suicide (5 yrs) 2 1 5.0 sr -68 01-05 18<br />
Self assessed health (classified as "Not Good") 200 6.2 % -39 2001 19<br />
First hospital admission - psychiatric 3 3 54.0 sr -79 02-04 20<br />
Patients prescribed drugs <strong>for</strong> anxiety /depression 262 7.7 % -5 2006 21<br />
Incapacity Benefit & SDA Claimants 50 2.6 % -73 2007 22<br />
Long-term limiting illness 468 14.5 % -29 2001 23<br />
Clients aged 0-15 11 1.7 % G* -77<br />
Clients aged 16-64 30 1.5 % G* -67 2007 24<br />
Clients aged 65+ 60 11.0 % G* -38<br />
'Income deprivedʼ 83 2.6 % -81 2006 25<br />
ʻEmployment deprivedʼ 71 3.7 % -71 2006 26<br />
Workless 65 3.4 % -77 2006 27<br />
JSA - Unemployment 10 0.5 % -81 2007 28<br />
Households without access to car/van 132 11.2 % -67 2001 29<br />
Children in workless households 34 4.4 % -76 2001 30<br />
Social grade E - benefit, unemployed, lowest grade work 212 8.6 % -62 2001 31<br />
Workplaces 75 39.4 cr3 -27 2005 32<br />
Employees 5 300 16.5 cr -78 2005 33<br />
Primary school attendance - 95.8 % +1 05/06 34<br />
S4 Pupils with 5+ GCSE equivalents 26 83.9 % +45 05/06 35<br />
Adults without qualifications 375 16.3 % -51 2001 36<br />
Serious violent crime 3 1 3.1 cr4 -79 04-06 37<br />
Domestic abuse incidents 3 5 15.6 cr4 -82 04-06 38<br />
Vandalism 3 60 186.5 cr4 G GC -31 04-06 39<br />
Drug Offenders 3 1-4 10.4 cr4 G GC -90 04-06 40<br />
Housing type - tenements n/a n/a % G 2006 41<br />
House prices - 250,490 £ +87 2006 42<br />
Housing tenure - Owner Occupiers n/a n/a % G 2007 43<br />
Overcrowding 22 1.9 % -84 2001 44<br />
Travelling to work by foot/bike or public transport 730 35.3 % -21 2001 45<br />
Smoking during pregnancy (3 yrs) 2 8 8.8 % -64 02-04 46<br />
Breastfeeding (at 6 - 8 week review) 18 58.1 % +59 04-06 47<br />
Low birth-weight babies ( 3 yrs) 2 0 0.0 % -100 02-04 48<br />
Immunisation uptake at 24 mths - MMR - 93.5 % +3<br />
04-06 50<br />
-all excl. MMR - 99.1 % +3<br />
Dental hospital admissions <strong>for</strong> children 3 1-4 0.3 cr -70 03-06 51<br />
Teenage pregnancy - under 18 years (3 yrs) 2 1-4 - cr3 02-04 52<br />
Road accident casualties - children 3 1-4 1.6 cr3 -44 01-04 16<br />
-70 -60 -50 -40 -30 -20 -10 0 +10+20 +30 +40 +50 +60 +70<br />
-<br />
(Below) Scottish Average (%) 1 (Above)<br />
+<br />
Time<br />
Period<br />
2006<br />
Defn<br />
1<br />
Notes<br />
Key<br />
1. The graph shows the "measure" (e.g. crude rate, percentage, years of life) expressed as a percentage below or above the Scottish measure, but using a range from a minimum of -70% to<br />
a maximum of +70% only. The actual plus/minus percentage value is shown in bold to the right of the graph. This is calculated as the area 'measure' minus the Scottish measure, divided by<br />
Scottish measure and multiplied by 100.<br />
2. Numbers presented over a period of years (e.g. 5 years <strong>for</strong> mortality) but rates are annual average rates.<br />
3. Average annual numbers and rates. 4. Numbers and rates presented over a period of years (e.g. 10 years <strong>for</strong> drug deaths).<br />
5. Employee numbers based on location of business, not residence area of employees.<br />
cr - crude rate per 100 population; cr2 - crude rate per 100,000 population; cr3 - crude rate per 1,000 resident population; cr4 - crude rate per 10,000 resident population; cr5 - crude rate per<br />
1,000 live births; sr - age-sex standardised rate per 100,000 population; yrs - years; %* - single parent households as % of households with children. Defn - see table of definitions & sources<br />
The 6th column of the spine chart indicates where an indicator is not compared to the Scottish average but with a local alternative: G - <strong>Glasgow</strong> City average; G* - average of <strong>Glasgow</strong>, E &<br />
W <strong>Dunbartonshire</strong>, Renfrewshire & <strong>East</strong> Renfrewshire; GGC - Greater <strong>Glasgow</strong> and Clyde (excluding Lanarkshire parts); shading on an indicator bar also indicates where a 'local' comparator<br />
is used.<br />
n/a: data not available (usually due to lack of coverage) or cannot be calculated. In addition, <strong>for</strong> particular indicators where the number of cases is below five and not zero, the range is shown<br />
i.e. '1-4'. NB If the number of teenage pregnancies is in the range '1-4' the rate is suppressed to avoid possible disclosure.<br />
A Community <strong>Health</strong> and Wellbeing Profile <strong>for</strong> <strong>East</strong> <strong>Dunbartonshire</strong> 69
Westerton West<br />
Key: Westerton West 95% Confidence Intervals Scotland<br />
100<br />
Male Life Expectancy<br />
100<br />
Female Life Expectancy<br />
95<br />
95<br />
Life expectancy in years<br />
90<br />
85<br />
80<br />
75<br />
70<br />
65<br />
77.3 76.9<br />
Life expectancy in years<br />
90<br />
85<br />
80<br />
75<br />
70<br />
65<br />
80.2<br />
83.8<br />
60<br />
60<br />
55<br />
1994-1998 1996-2000 1999-2003 2001-2005<br />
55<br />
1994-1998 1996-2000 1999-2003 2001-2005<br />
2000<br />
1500<br />
1000<br />
500<br />
0<br />
<strong>Population</strong> by Age Group<br />
0 - 15 years 16 - 44 years<br />
45 - 64 years 65 years and over<br />
1996 1997 1998 1999 2000 2001 2002 2003 2004 2005 2006<br />
974<br />
856<br />
477<br />
422<br />
% workless of working age population<br />
35%<br />
30%<br />
25%<br />
20%<br />
15%<br />
10%<br />
5%<br />
0%<br />
Worklessness<br />
8.4%<br />
7.5%<br />
1999 2000 2001 2002 2003 2004 2005 2006<br />
% of mothers breastfeeding at 6/8 weeks<br />
85<br />
80<br />
75<br />
70<br />
65<br />
60<br />
55<br />
50<br />
45<br />
40<br />
35<br />
30<br />
25<br />
20<br />
15<br />
10<br />
5<br />
0<br />
Breast Feeding<br />
55.9<br />
39.6<br />
97-99 98-00 99-01 00-02 01-03 02-04 03-05 04-06<br />
Age/sex standardised rate per 100,000 pop<br />
1800<br />
1600<br />
1400<br />
1200<br />
1000<br />
800<br />
600<br />
400<br />
200<br />
0<br />
Hospital Patients with Alcohol Attributable &<br />
Related Conditions<br />
483<br />
97-99 98-00 99-01 00-02 01-03 02-04 03-05 04-06<br />
403<br />
Age/sex standardised rate per 100,000 pop<br />
1600<br />
1400<br />
1200<br />
1000<br />
800<br />
600<br />
400<br />
200<br />
0<br />
Heart Disease Hospital Patients<br />
817<br />
567<br />
96-98 97-99 98-00 99-01 00-02 01-03 02-04 03-05 04-06<br />
Age/sex standardised rate per 100,000 pop<br />
10000<br />
9000<br />
8000<br />
7000<br />
6000<br />
5000<br />
4000<br />
3000<br />
2000<br />
1000<br />
0<br />
Emergency Medical Admission Patients<br />
5071<br />
4137<br />
96-98 97-99 98-00 99-01 00-02 01-03 02-04 03-05 04-06<br />
NB PLEASE NOTE THAT IN SOME CASES RATES/PERCENTAGES MAY BE BASED ON SMALL NUMBERS.<br />
70
<strong>Population</strong> Demographics<br />
Mortality<br />
Drugs,<br />
Alcohol and<br />
Smoking<br />
Social<br />
Crime Prosperity - Poverty<br />
Hospitalisation & Injury<br />
Mental <strong>Health</strong> &<br />
Function<br />
Work<br />
Education<br />
Housing &<br />
Transport<br />
Child & Maternal<br />
<strong>Health</strong><br />
Indicator<br />
Westerton West<br />
Number<br />
Measure<br />
-70 -60 -50 -40 -30 -20 -10 0 +10+20 +30 +40 +50 +60 +70<br />
Child population (aged 0-15) 477 17.5 % -3<br />
Adult population (aged 16-64) 1,830 67.1 % +2<br />
Elderly population (aged 65+) 422 15.5 % -6<br />
Minority ethnic groups 112 3.9 % +92 2001 2<br />
Asylum Seekers n/a n/a % G 2007 3<br />
Life expectancy - males - 76.9 yrs +4<br />
Life expectancy - females - 83.8 yrs +6<br />
01-05 4<br />
Live births 21 0.8 cr -29 2006 5<br />
Households - Single adults n/a n/a % G<br />
Single parents n/a n/a %* G<br />
2005 6<br />
Deaths all ages (5 yrs) 2 100 656.8 sr -17<br />
Coronary heart disease deaths in under 75s (5 yrs) 2 5 30.8 sr -60<br />
Cancer deaths in under 75s (5 yrs) 2 23 137.1 sr -6<br />
01-05 7<br />
Cerebrovascular disease deaths in under 75s (5 yrs) 2 2 12.4 sr -49<br />
Alcohol related and attributable hospital patients 3 14 403.4 sr -2 04-06 8<br />
Alcohol related deaths (5 yrs) 2 3 11.2 sr -59 01-05 9<br />
Estimated smokers (16+) 339 14.6 % -46 03-04 10<br />
Drug related hospital patients 3 0 0.0 sr -100 04-06 11<br />
Drug related deaths (10 yrs) 4 1 34.5 cr2 -45 97-06 12<br />
Patients registered with cancer 3 16 456.5 sr +9 02-04 13<br />
Heart disease patients 3 20 567.3 sr -20<br />
Cerebrovascular disease patients 3 6 174.8 sr -7<br />
Emergency medical admission patients 3 126 4,137.0 sr -34 04-06 14<br />
Multiple admission patients 3 27 859.4 sr -30<br />
Unintentional Injury patients 3 19 665.3 sr -34<br />
Patients prescribed statins 603 20.9 % +15 2006 15<br />
Road accident casualties - adults 3 1-4 1.6 cr3 -59 01-04 16<br />
Assault discharges 3 1-4 0.7 cr3 -30 04-06 17<br />
Suicide (5 yrs) 2 2 11.2 sr -28 01-05 18<br />
Self assessed health (classified as "Not Good") 203 7.0 % -31 2001 19<br />
First hospital admission - psychiatric 3 3 106.3 sr -58 02-04 20<br />
Patients prescribed drugs <strong>for</strong> anxiety /depression 241 8.4 % +3 2006 21<br />
Incapacity Benefit & SDA Claimants 95 5.5 % -43 2007 22<br />
Long-term limiting illness 393 13.6 % -33 2001 23<br />
Clients aged 0-15 12 2.5 % G* -65<br />
Clients aged 16-64 44 2.4 % G* -46 2007 24<br />
Clients aged 65+ 43 10.2 % G* -42<br />
'Income deprivedʼ 115 4.2 % -70 2006 25<br />
ʻEmployment deprivedʼ 141 8.0 % -38 2006 26<br />
Workless 130 7.5 % -49 2006 27<br />
JSA - Unemployment 25 1.4 % -49 2007 28<br />
Households without access to car/van 175 15.9 % -53 2001 29<br />
Children in workless households 40 6.0 % -67 2001 30<br />
Social grade E - benefit, unemployed, lowest grade work 321 13.9 % -38 2001 31<br />
Workplaces 31 17.6 cr3 -67 2005 32<br />
Employees 5 100 6.0 cr -92 2005 33<br />
Primary school attendance - 95.5 % 0 05/06 34<br />
S4 Pupils with 5+ GCSE equivalents 22 73.3 % +27 05/06 35<br />
Adults without qualifications 513 23.4 % -30 2001 36<br />
Serious violent crime 3 2 7.3 cr4 -50 04-06 37<br />
Domestic abuse incidents 3 4 13.3 cr4 -84 04-06 38<br />
Vandalism 3 41 147.7 cr4 G GC -45 04-06 39<br />
Drug Offenders 3 11 41.2 cr4 G GC -59 04-06 40<br />
Housing type - tenements n/a n/a % G 2006 41<br />
House prices - 164,695 £ +23 2006 42<br />
Housing tenure - Owner Occupiers n/a n/a % G 2007 43<br />
Overcrowding 112 10.2 % -13 2001 44<br />
Travelling to work by foot/bike or public transport 870 44.7 % 0 2001 45<br />
Smoking during pregnancy (3 yrs) 2 14 22.2 % -8 02-04 46<br />
Breastfeeding (at 6 - 8 week review) 11 55.9 % +54 04-06 47<br />
Low birth-weight babies ( 3 yrs) 2 1-4 1.7 % -30 02-04 48<br />
Immunisation uptake at 24 mths - MMR - 93.8 % +4<br />
04-06 50<br />
-all excl. MMR - 98.4 % +3<br />
Dental hospital admissions <strong>for</strong> children 3 1-4 0.8 cr -33 03-06 51<br />
Teenage pregnancy - under 18 years (3 yrs) 2 8 45.2 cr3 +12 02-04 52<br />
Road accident casualties - children 3 1-4 1.9 cr3 -33 01-04 16<br />
-70 -60 -50 -40 -30 -20 -10 0 +10+20 +30 +40 +50 +60 +70<br />
-<br />
(Below) Scottish Average (%) 1 (Above)<br />
+<br />
Time<br />
Period<br />
2006<br />
Defn<br />
1<br />
Notes<br />
Key<br />
1. The graph shows the "measure" (e.g. crude rate, percentage, years of life) expressed as a percentage below or above the Scottish measure, but using a range from a minimum of -70% to<br />
a maximum of +70% only. The actual plus/minus percentage value is shown in bold to the right of the graph. This is calculated as the area 'measure' minus the Scottish measure, divided by<br />
Scottish measure and multiplied by 100.<br />
2. Numbers presented over a period of years (e.g. 5 years <strong>for</strong> mortality) but rates are annual average rates.<br />
3. Average annual numbers and rates. 4. Numbers and rates presented over a period of years (e.g. 10 years <strong>for</strong> drug deaths).<br />
5. Employee numbers based on location of business, not residence area of employees.<br />
cr - crude rate per 100 population; cr2 - crude rate per 100,000 population; cr3 - crude rate per 1,000 resident population; cr4 - crude rate per 10,000 resident population; cr5 - crude rate per<br />
1,000 live births; sr - age-sex standardised rate per 100,000 population; yrs - years; %* - single parent households as % of households with children. Defn - see table of definitions & sources<br />
The 6th column of the spine chart indicates where an indicator is not compared to the Scottish average but with a local alternative: G - <strong>Glasgow</strong> City average; G* - average of <strong>Glasgow</strong>, E &<br />
W <strong>Dunbartonshire</strong>, Renfrewshire & <strong>East</strong> Renfrewshire; GGC - Greater <strong>Glasgow</strong> and Clyde (excluding Lanarkshire parts); shading on an indicator bar also indicates where a 'local' comparator<br />
is used.<br />
n/a: data not available (usually due to lack of coverage) or cannot be calculated. In addition, <strong>for</strong> particular indicators where the number of cases is below five and not zero, the range is shown<br />
i.e. '1-4'. NB If the number of teenage pregnancies is in the range '1-4' the rate is suppressed to avoid possible disclosure.<br />
A Community <strong>Health</strong> and Wellbeing Profile <strong>for</strong> <strong>East</strong> <strong>Dunbartonshire</strong> 71
Woodhill <strong>East</strong><br />
Key: Woodhill <strong>East</strong> 95% Confidence Intervals Scotland<br />
100<br />
Male Life Expectancy<br />
100<br />
Female Life Expectancy<br />
95<br />
95<br />
Life expectancy in years<br />
90<br />
85<br />
80<br />
75<br />
70<br />
65<br />
73.2<br />
81.9<br />
Life expectancy in years<br />
90<br />
85<br />
80<br />
75<br />
70<br />
65<br />
79.3<br />
87.6<br />
60<br />
60<br />
55<br />
1994-1998 1996-2000 1999-2003 2001-2005<br />
55<br />
1994-1998 1996-2000 1999-2003 2001-2005<br />
2000<br />
1500<br />
1000<br />
500<br />
0<br />
<strong>Population</strong> by Age Group<br />
0 - 15 years 16 - 44 years<br />
45 - 64 years 65 years and over<br />
1996 1997 1998 1999 2000 2001 2002 2003 2004 2005 2006<br />
1074<br />
722<br />
513<br />
258<br />
% workless of working age population<br />
35%<br />
30%<br />
25%<br />
20%<br />
15%<br />
10%<br />
5%<br />
0%<br />
Worklessness<br />
8.7%<br />
5.7%<br />
1999 2000 2001 2002 2003 2004 2005 2006<br />
% of mothers breastfeeding at 6/8 weeks<br />
85<br />
80<br />
75<br />
70<br />
65<br />
60<br />
55<br />
50<br />
45<br />
40<br />
35<br />
30<br />
25<br />
20<br />
15<br />
10<br />
5<br />
0<br />
Breast Feeding<br />
45.1<br />
33.0<br />
97-99 98-00 99-01 00-02 01-03 02-04 03-05 04-06<br />
Age/sex standardised rate per 100,000 pop<br />
1800<br />
1600<br />
1400<br />
1200<br />
1000<br />
800<br />
600<br />
400<br />
200<br />
0<br />
Hospital Patients with Alcohol Attributable &<br />
Related Conditions<br />
555<br />
97-99 98-00 99-01 00-02 01-03 02-04 03-05 04-06<br />
471<br />
Age/sex standardised rate per 100,000 pop<br />
1600<br />
1400<br />
1200<br />
1000<br />
800<br />
600<br />
400<br />
200<br />
0<br />
Heart Disease Hospital Patients<br />
863<br />
408<br />
96-98 97-99 98-00 99-01 00-02 01-03 02-04 03-05 04-06<br />
Age/sex standardised rate per 100,000 pop<br />
10000<br />
9000<br />
8000<br />
7000<br />
6000<br />
5000<br />
4000<br />
3000<br />
2000<br />
1000<br />
0<br />
Emergency Medical Admission Patients<br />
5706<br />
4505<br />
96-98 97-99 98-00 99-01 00-02 01-03 02-04 03-05 04-06<br />
NB PLEASE NOTE THAT IN SOME CASES RATES/PERCENTAGES MAY BE BASED ON SMALL NUMBERS.<br />
72
<strong>Population</strong> Demographics<br />
Mortality<br />
Drugs,<br />
Alcohol and<br />
Smoking<br />
Social<br />
Crime Prosperity - Poverty<br />
Hospitalisation & Injury<br />
Mental <strong>Health</strong> &<br />
Function<br />
Work<br />
Education<br />
Housing &<br />
Transport<br />
Child & Maternal<br />
<strong>Health</strong><br />
Indicator<br />
Woodhill <strong>East</strong><br />
Number<br />
Measure<br />
-70 -60 -50 -40 -30 -20 -10 0 +10+20 +30 +40 +50 +60 +70<br />
Child population (aged 0-15) 513 20.0 % +11<br />
Adult population (aged 16-64) 1,796 70.0 % +7<br />
Elderly population (aged 65+) 258 10.1 % -39<br />
Minority ethnic groups 166 6.2 % +207 2001 2<br />
Asylum Seekers n/a n/a % G 2007 3<br />
Life expectancy - males - 81.9 yrs +11<br />
Life expectancy - females - 87.6 yrs +11<br />
01-05 4<br />
Live births 20 0.8 cr -28 2006 5<br />
Households - Single adults n/a n/a % G<br />
Single parents n/a n/a %* G<br />
2005 6<br />
Deaths all ages (5 yrs) 2 43 414.7 sr -47<br />
Coronary heart disease deaths in under 75s (5 yrs) 2 5 51.3 sr -33<br />
Cancer deaths in under 75s (5 yrs) 2 18 160.6 sr +10<br />
01-05 7<br />
Cerebrovascular disease deaths in under 75s (5 yrs) 2 0 0.0 sr -100<br />
Alcohol related and attributable hospital patients 3 12 470.7 sr +19 04-06 8<br />
Alcohol related deaths (5 yrs) 2 0 0.0 sr -100 01-05 9<br />
Estimated smokers (16+) 441 21.8 % -20 03-04 10<br />
Drug related hospital patients 3 1-4 8.2 sr -89 04-06 11<br />
Drug related deaths (10 yrs) 4 1 37.3 cr2 -41 97-06 12<br />
Patients registered with cancer 3 7 288.3 sr -31 02-04 13<br />
Heart disease patients 3 10 407.8 sr -43<br />
Cerebrovascular disease patients 3 2 89.5 sr -52<br />
Emergency medical admission patients 3 113 4,505.0 sr -28 04-06 14<br />
Multiple admission patients 3 19 718.7 sr -41<br />
Unintentional Injury patients 3 20 859.1 sr -15<br />
Patients prescribed statins 625 22.5 % +23 2006 15<br />
Road accident casualties - adults 3 1-4 1.3 cr3 -66 01-04 16<br />
Assault discharges 3 1-4 1.1 cr3 +10 04-06 17<br />
Suicide (5 yrs) 2 1 8.8 sr -44 01-05 18<br />
Self assessed health (classified as "Not Good") 159 5.9 % -42 2001 19<br />
First hospital admission - psychiatric 3 4 139.2 sr -46 02-04 20<br />
Patients prescribed drugs <strong>for</strong> anxiety /depression 237 8.5 % +6 2006 21<br />
Incapacity Benefit & SDA Claimants 70 4.0 % -58 2007 22<br />
Long-term limiting illness 314 11.7 % -42 2001 23<br />
Clients aged 0-15 10 1.9 % G* -73<br />
Clients aged 16-64 31 1.7 % G* -61 2007 24<br />
Clients aged 65+ 17 6.6 % G* -63<br />
'Income deprivedʼ 122 4.6 % -67 2006 25<br />
ʻEmployment deprivedʼ 102 5.7 % -55 2006 26<br />
Workless 100 5.7 % -61 2006 27<br />
JSA - Unemployment 20 1.1 % -60 2007 28<br />
Households without access to car/van 81 9.0 % -74 2001 29<br />
Children in workless households 30 3.9 % -79 2001 30<br />
Social grade E - benefit, unemployed, lowest grade work 144 7.1 % -68 2001 31<br />
Workplaces 31 17.5 cr3 -68 2005 32<br />
Employees 5 100 4.5 cr -94 2005 33<br />
Primary school attendance - 94.1 % -1 05/06 34<br />
S4 Pupils with 5+ GCSE equivalents 36 83.7 % +45 05/06 35<br />
Adults without qualifications 456 23.0 % -31 2001 36<br />
Serious violent crime 3 2 7.6 cr4 -48 04-06 37<br />
Domestic abuse incidents 3 5 19.0 cr4 -78 04-06 38<br />
Vandalism 3 31 117.8 cr4 G GC -56 04-06 39<br />
Drug Offenders 3 9 32.9 cr4 G GC -67 04-06 40<br />
Housing type - tenements n/a n/a % G 2006 41<br />
House prices - 139,437 £ +4 2006 42<br />
Housing tenure - Owner Occupiers n/a n/a % G 2007 43<br />
Overcrowding 66 7.3 % -38 2001 44<br />
Travelling to work by foot/bike or public transport 842 41.3 % -7 2001 45<br />
Smoking during pregnancy (3 yrs) 2 5 6.4 % -74 02-04 46<br />
Breastfeeding (at 6 - 8 week review) 12 45.1 % +24 04-06 47<br />
Low birth-weight babies ( 3 yrs) 2 1-4 2.9 % +16 02-04 48<br />
Immunisation uptake at 24 mths - MMR - 94.6 % +5<br />
04-06 50<br />
-all excl. MMR - 97.8 % +2<br />
Dental hospital admissions <strong>for</strong> children 3 5 0.9 cr -20 03-06 51<br />
Teenage pregnancy - under 18 years (3 yrs) 2 1-4 - cr3 02-04 52<br />
Road accident casualties - children 3 1-4 0.9 cr3 -70 01-04 16<br />
-70 -60 -50 -40 -30 -20 -10 0 +10+20 +30 +40 +50 +60 +70<br />
-<br />
(Below) Scottish Average (%) 1 (Above)<br />
+<br />
Time<br />
Period<br />
2006<br />
Defn<br />
1<br />
Notes<br />
Key<br />
1. The graph shows the "measure" (e.g. crude rate, percentage, years of life) expressed as a percentage below or above the Scottish measure, but using a range from a minimum of -70% to<br />
a maximum of +70% only. The actual plus/minus percentage value is shown in bold to the right of the graph. This is calculated as the area 'measure' minus the Scottish measure, divided by<br />
Scottish measure and multiplied by 100.<br />
2. Numbers presented over a period of years (e.g. 5 years <strong>for</strong> mortality) but rates are annual average rates.<br />
3. Average annual numbers and rates. 4. Numbers and rates presented over a period of years (e.g. 10 years <strong>for</strong> drug deaths).<br />
5. Employee numbers based on location of business, not residence area of employees.<br />
cr - crude rate per 100 population; cr2 - crude rate per 100,000 population; cr3 - crude rate per 1,000 resident population; cr4 - crude rate per 10,000 resident population; cr5 - crude rate per<br />
1,000 live births; sr - age-sex standardised rate per 100,000 population; yrs - years; %* - single parent households as % of households with children. Defn - see table of definitions & sources<br />
The 6th column of the spine chart indicates where an indicator is not compared to the Scottish average but with a local alternative: G - <strong>Glasgow</strong> City average; G* - average of <strong>Glasgow</strong>, E &<br />
W <strong>Dunbartonshire</strong>, Renfrewshire & <strong>East</strong> Renfrewshire; GGC - Greater <strong>Glasgow</strong> and Clyde (excluding Lanarkshire parts); shading on an indicator bar also indicates where a 'local' comparator<br />
is used.<br />
n/a: data not available (usually due to lack of coverage) or cannot be calculated. In addition, <strong>for</strong> particular indicators where the number of cases is below five and not zero, the range is shown<br />
i.e. '1-4'. NB If the number of teenage pregnancies is in the range '1-4' the rate is suppressed to avoid possible disclosure.<br />
A Community <strong>Health</strong> and Wellbeing Profile <strong>for</strong> <strong>East</strong> <strong>Dunbartonshire</strong> 73
Woodhill West<br />
Key: Woodhill West 95% Confidence Intervals Scotland<br />
100<br />
Male Life Expectancy<br />
100<br />
Female Life Expectancy<br />
95<br />
95<br />
Life expectancy in years<br />
90<br />
85<br />
80<br />
75<br />
70<br />
65<br />
78.7<br />
77.8<br />
Life expectancy in years<br />
90<br />
85<br />
80<br />
75<br />
70<br />
65<br />
81.3<br />
84.6<br />
60<br />
60<br />
55<br />
1994-1998 1996-2000 1999-2003 2001-2005<br />
55<br />
1994-1998 1996-2000 1999-2003 2001-2005<br />
3000<br />
2500<br />
2000<br />
1500<br />
1000<br />
500<br />
0<br />
<strong>Population</strong> by Age Group<br />
0 - 15 years 16 - 44 years<br />
45 - 64 years 65 years and over<br />
1996 1997 1998 1999 2000 2001 2002 2003 2004 2005 2006<br />
1607<br />
1284<br />
827<br />
785<br />
% workless of working age population<br />
35%<br />
30%<br />
25%<br />
20%<br />
15%<br />
10%<br />
5%<br />
0%<br />
Worklessness<br />
8.6%<br />
6.4%<br />
1999 2000 2001 2002 2003 2004 2005 2006<br />
% of mothers breastfeeding at 6/8 weeks<br />
85<br />
80<br />
75<br />
70<br />
65<br />
60<br />
55<br />
50<br />
45<br />
40<br />
35<br />
30<br />
25<br />
20<br />
15<br />
10<br />
5<br />
0<br />
Breast Feeding<br />
48.8<br />
38.8<br />
97-99 98-00 99-01 00-02 01-03 02-04 03-05 04-06<br />
Age/sex standardised rate per 100,000 pop<br />
1800<br />
1600<br />
1400<br />
1200<br />
1000<br />
800<br />
600<br />
400<br />
200<br />
0<br />
Hospital Patients with Alcohol Attributable &<br />
Related Conditions<br />
532<br />
97-99 98-00 99-01 00-02 01-03 02-04 03-05 04-06<br />
399<br />
Age/sex standardised rate per 100,000 pop<br />
1600<br />
1400<br />
1200<br />
1000<br />
800<br />
600<br />
400<br />
200<br />
0<br />
Heart Disease Hospital Patients<br />
887<br />
663<br />
96-98 97-99 98-00 99-01 00-02 01-03 02-04 03-05 04-06<br />
Age/sex standardised rate per 100,000 pop<br />
10000<br />
9000<br />
8000<br />
7000<br />
6000<br />
5000<br />
4000<br />
3000<br />
2000<br />
1000<br />
0<br />
Emergency Medical Admission Patients<br />
5963<br />
4176<br />
96-98 97-99 98-00 99-01 00-02 01-03 02-04 03-05 04-06<br />
NB PLEASE NOTE THAT IN SOME CASES RATES/PERCENTAGES MAY BE BASED ON SMALL NUMBERS.<br />
74
<strong>Population</strong> Demographics<br />
Mortality<br />
Drugs,<br />
Alcohol and<br />
Smoking<br />
Social<br />
Crime Prosperity - Poverty<br />
Hospitalisation & Injury<br />
Mental <strong>Health</strong> &<br />
Function<br />
Work<br />
Education<br />
Housing &<br />
Transport<br />
Child & Maternal<br />
<strong>Health</strong><br />
Indicator<br />
Woodhill West<br />
Number<br />
Measure<br />
-70 -60 -50 -40 -30 -20 -10 0 +10+20 +30 +40 +50 +60 +70<br />
Child population (aged 0-15) 785 17.4 % -3<br />
Adult population (aged 16-64) 2,891 64.2 % -2<br />
Elderly population (aged 65+) 827 18.4 % +12<br />
Minority ethnic groups 300 6.4 % +221 2001 2<br />
Asylum Seekers n/a n/a % G 2007 3<br />
Life expectancy - males - 77.8 yrs +5<br />
Life expectancy - females - 84.6 yrs +7<br />
01-05 4<br />
Live births 25 0.6 cr -49 2006 5<br />
Households - Single adults n/a n/a % G<br />
Single parents n/a n/a %* G<br />
2005 6<br />
Deaths all ages (5 yrs) 2 146 599.9 sr -24<br />
Coronary heart disease deaths in under 75s (5 yrs) 2 15 56.9 sr -26<br />
Cancer deaths in under 75s (5 yrs) 2 28 96.9 sr -34<br />
01-05 7<br />
Cerebrovascular disease deaths in under 75s (5 yrs) 2 5 14.9 sr -38<br />
Alcohol related and attributable hospital patients 3 22 398.5 sr -13 04-06 8<br />
Alcohol related deaths (5 yrs) 2 1 3.3 sr -88 01-05 9<br />
Estimated smokers (16+) 772 20.8 % -24 03-04 10<br />
Drug related hospital patients 3 1-4 24.6 sr -68 04-06 11<br />
Drug related deaths (10 yrs) 4 3 64.4 cr2 +2 97-06 12<br />
Patients registered with cancer 3 22 396.6 sr -6 02-04 13<br />
Heart disease patients 3 38 663.0 sr -7<br />
Cerebrovascular disease patients 3 8 129.7 sr -31<br />
Emergency medical admission patients 3 207 4,175.8 sr -33 04-06 14<br />
Multiple admission patients 3 42 817.2 sr -33<br />
Unintentional Injury patients 3 32 661.2 sr -35<br />
Patients prescribed statins 1,036 21.6 % +18 2006 15<br />
Road accident casualties - adults 3 1-4 1.1 cr3 -73 01-04 16<br />
Assault discharges 3 1-4 0.4 cr3 -65 04-06 17<br />
Suicide (5 yrs) 2 1 3.4 sr -78 01-05 18<br />
Self assessed health (classified as "Not Good") 298 6.4 % -37 2001 19<br />
First hospital admission - psychiatric 3 5 115.9 sr -55 02-04 20<br />
Patients prescribed drugs <strong>for</strong> anxiety /depression 375 7.8 % -4 2006 21<br />
Incapacity Benefit & SDA Claimants 115 4.1 % -57 2007 22<br />
Long-term limiting illness 630 13.5 % -33 2001 23<br />
Clients aged 0-15 24 3.1 % G* -57<br />
Clients aged 16-64 56 1.9 % G* -57 2007 24<br />
Clients aged 65+ 106 12.8 % G* -28<br />
'Income deprivedʼ 215 4.7 % -66 2006 25<br />
ʻEmployment deprivedʼ 182 6.5 % -49 2006 26<br />
Workless 180 6.4 % -56 2006 27<br />
JSA - Unemployment 30 1.1 % -62 2007 28<br />
Households without access to car/van 248 14.7 % -57 2001 29<br />
Children in workless households 49 4.4 % -76 2001 30<br />
Social grade E - benefit, unemployed, lowest grade work 570 15.4 % -31 2001 31<br />
Workplaces 64 22.9 cr3 -58 2005 32<br />
Employees 5 500 16.8 cr -78 2005 33<br />
Primary school attendance - 94.6 % 0 05/06 34<br />
S4 Pupils with 5+ GCSE equivalents 59 77.6 % +34 05/06 35<br />
Adults without qualifications 905 25.6 % -23 2001 36<br />
Serious violent crime 3 1 2.2 cr4 -85 04-06 37<br />
Domestic abuse incidents 3 10 22.6 cr4 -74 04-06 38<br />
Vandalism 3 74 161.2 cr4 G GC -40 04-06 39<br />
Drug Offenders 3 11 24.8 cr4 G GC -75 04-06 40<br />
Housing type - tenements n/a n/a % G 2006 41<br />
House prices - 144,073 £ +8 2006 42<br />
Housing tenure - Owner Occupiers n/a n/a % G 2007 43<br />
Overcrowding 122 7.2 % -38 2001 44<br />
Travelling to work by foot/bike or public transport 1,382 43.6 % -2 2001 45<br />
Smoking during pregnancy (3 yrs) 2 9 9.1 % -63 02-04 46<br />
Breastfeeding (at 6 - 8 week review) 13 48.8 % +34 04-06 47<br />
Low birth-weight babies ( 3 yrs) 2 1-4 2.2 % -10 02-04 48<br />
Immunisation uptake at 24 mths - MMR - 95.6 % +6<br />
04-06 50<br />
-all excl. MMR - 98.2 % +2<br />
Dental hospital admissions <strong>for</strong> children 3 8 0.9 cr -23 03-06 51<br />
Teenage pregnancy - under 18 years (3 yrs) 2 7 24.3 cr3 -40 02-04 52<br />
Road accident casualties - children 3 1-4 1.9 cr3 -32 01-04 16<br />
-70 -60 -50 -40 -30 -20 -10 0 +10+20 +30 +40 +50 +60 +70<br />
-<br />
(Below) Scottish Average (%) 1 (Above)<br />
+<br />
Time<br />
Period<br />
2006<br />
Defn<br />
1<br />
Notes<br />
Key<br />
1. The graph shows the "measure" (e.g. crude rate, percentage, years of life) expressed as a percentage below or above the Scottish measure, but using a range from a minimum of -70% to<br />
a maximum of +70% only. The actual plus/minus percentage value is shown in bold to the right of the graph. This is calculated as the area 'measure' minus the Scottish measure, divided by<br />
Scottish measure and multiplied by 100.<br />
2. Numbers presented over a period of years (e.g. 5 years <strong>for</strong> mortality) but rates are annual average rates.<br />
3. Average annual numbers and rates. 4. Numbers and rates presented over a period of years (e.g. 10 years <strong>for</strong> drug deaths).<br />
5. Employee numbers based on location of business, not residence area of employees.<br />
cr - crude rate per 100 population; cr2 - crude rate per 100,000 population; cr3 - crude rate per 1,000 resident population; cr4 - crude rate per 10,000 resident population; cr5 - crude rate per<br />
1,000 live births; sr - age-sex standardised rate per 100,000 population; yrs - years; %* - single parent households as % of households with children. Defn - see table of definitions & sources<br />
The 6th column of the spine chart indicates where an indicator is not compared to the Scottish average but with a local alternative: G - <strong>Glasgow</strong> City average; G* - average of <strong>Glasgow</strong>, E &<br />
W <strong>Dunbartonshire</strong>, Renfrewshire & <strong>East</strong> Renfrewshire; GGC - Greater <strong>Glasgow</strong> and Clyde (excluding Lanarkshire parts); shading on an indicator bar also indicates where a 'local' comparator<br />
is used.<br />
n/a: data not available (usually due to lack of coverage) or cannot be calculated. In addition, <strong>for</strong> particular indicators where the number of cases is below five and not zero, the range is shown<br />
i.e. '1-4'. NB If the number of teenage pregnancies is in the range '1-4' the rate is suppressed to avoid possible disclosure.<br />
A Community <strong>Health</strong> and Wellbeing Profile <strong>for</strong> <strong>East</strong> <strong>Dunbartonshire</strong> 75
Definitions and Sources<br />
NB More detailed definitions are available in excel files <strong>for</strong> each indicator on the GCPH website <br />
Definition Indicator Description<br />
1 <strong>Population</strong> Number and percentage of total population<br />
in each age band (0-15; 16-64; 65+)<br />
2 Minority ethnic<br />
groups<br />
Number and percentage of total population<br />
categorised as being from a minority ethnic<br />
group<br />
3 Asylum seekers Number and percentage of asylum seekers<br />
in the population (<strong>Glasgow</strong> CH(C)Ps only)<br />
* Data originates from the Home Office<br />
4 Life expectancy Estimated male and female life expectancy<br />
at birth in years (using Chiang (II) method) 3<br />
5 Live births Live births in the period expressed as<br />
a number and percentage of the total<br />
population<br />
6 Households Single adult households (expressed as a<br />
number and percentage of all households);<br />
single parent households (expressed as a<br />
number and percentage of all households<br />
with children) (<strong>Glasgow</strong> CH(C)Ps only)<br />
Time<br />
Period<br />
Source 2<br />
2006 GRO(S)<br />
2001 Census<br />
2007 COSLA Strategic<br />
Migration<br />
Partnership*<br />
1994-98 to<br />
2001-05<br />
GRO(S)<br />
2006 GRO(S)<br />
2005 DRS, GCC<br />
2001-05 GRO(S)<br />
7 Deaths Deaths from all causes (all ages), coronary<br />
100,000 population 3<br />
heart disease 4 , cancer 5 and cerebrovascular<br />
disease 6 (<strong>for</strong> under 75s) over the period,<br />
expressed as a 5 year total and a directly<br />
age-sex standardised annualised rate per<br />
8 Alcohol attributable<br />
and related hospital<br />
patients<br />
9 Alcohol related<br />
deaths<br />
10 Estimated smokers<br />
(16+)<br />
11 Drug related<br />
hospital patients<br />
Patients admitted to hospital with alcohol 1997-99<br />
attributable and related conditions: 3 to<br />
year annual average numbers & age/sex 2004-06<br />
standardised rates per100,000 population 7<br />
Deaths from alcohol related causes 7 (all<br />
ages) over the period, expressed as a 5<br />
year total number and a directly age-sex<br />
standardised annualised rate per 100,000<br />
population 3<br />
Modelled estimates of smoking prevalence,<br />
expressed as a number and percentage of<br />
the adult population<br />
Patients admitted to hospital with drug<br />
related conditions 8 expressed as a 3<br />
year annual average number & age/sex<br />
standardised rate per 100,000 population<br />
ISD Scotland<br />
(SMR1/01,<br />
Linked<br />
Database)<br />
2001-05 GRO(S)<br />
2003-04 NHS <strong>Health</strong><br />
Scotland<br />
2004-06 ISD Scotland<br />
(SMR1/01,<br />
Linked<br />
Database)<br />
www.gcph.co.uk/communityprofiles<br />
2 In some cases this indicates the source of original raw datasets, with that data then manipulated by GCPH to calculate required<br />
measures (e.g. life expectancy at birth, mortality)<br />
3 For life expectancy and measures based on standardised rates, 95% confidence intervals are available on request<br />
4 Coronary Heart disease: ICD9: 410-414; ICD10: I20-I25 (principal diagnosis only)<br />
5 All malignant neoplasms: ICD9: 140-208; ICD10: C00-C97 (principal diagnosis only)<br />
6 Cerebrovascular disease: ICD9: 430-438; ICD10: I60-I69, G45 (principal diagnosis only)<br />
7 For a detailed definition refer to the excel workbook <strong>for</strong> this indicator on the GCPH web site: www.gcph.co.uk/communityprofiles<br />
8 Drug related conditions: ICD9 292, 304, 305.2-305.9; ICD10 F11-F19 (exc. F17), (all diagnostic positions)<br />
A Community <strong>Health</strong> and Wellbeing Profile <strong>for</strong> <strong>East</strong> <strong>Dunbartonshire</strong> 77
Definition Indicator Description<br />
12 Drug related deaths Deaths from drug related conditions 9 expressed<br />
as the total number of deaths over the period<br />
(10 years) and a crude rate per 100,000<br />
population<br />
13 Patients registered<br />
with cancer<br />
Patients registered with cancer 10 expressed as<br />
a 3 year annual average number & age/sex<br />
standardised rate per 100,000 population<br />
14 Hospital Patients Patients discharged from hospital in particular<br />
circumstances and <strong>for</strong> specific conditions (heart<br />
disease 11 , cerebrovascular disease 6 , emergency<br />
medical admission 7 , multiple admission 7 and<br />
unintentional injury 7 ), expressed as a 3 year<br />
annual average number & age/sex standardised<br />
rate per 100,000 population<br />
15 Patients prescribed<br />
statins<br />
16 Road accident<br />
casualties - adults<br />
and children<br />
Time<br />
Period<br />
Source 2<br />
1997-2006 GRO(S)<br />
2002-04 ISD Scotland,<br />
Socrates<br />
1997-99 to<br />
2004-06<br />
ISD Scotland<br />
(SMR1/01,<br />
Linked<br />
Database)<br />
Estimated number and percentage of people<br />
being prescribed statins (Atorvastatin,<br />
Fluvastatin, Pravastatin, Rosuvastatin and<br />
Simvastatin) 7 2006 ISD Scotland<br />
(Prescribing<br />
In<strong>for</strong>mation<br />
System)<br />
Child (under 16) and adult (16+) road accident<br />
casualties, expressed as an annual average<br />
number and rate per 1,000 population<br />
17 Assault discharges Assault discharges 12 (after a hospital admission)<br />
expressed as a three year annual average<br />
number and rate per 1,000 population<br />
18 Suicides Deaths from suicide 13 (all ages) over the period,<br />
expressed as a 5 year total number and a<br />
directly age-sex standardised annualised rate<br />
per 100,000 population<br />
19 Self-assessed health Number and percentage of people who rated<br />
their health as “Not Good”<br />
20 First hospital<br />
admissions<br />
– psychiatric<br />
21 Patients prescribed<br />
drugs <strong>for</strong> anxiety,<br />
depression or<br />
psychosis<br />
22 Incapacity Benefit<br />
and SDA claimants<br />
23 Long term limiting<br />
illness<br />
Average annual numbers and directly age-sex<br />
standardised rates <strong>for</strong> all first (in 3 year period)<br />
psychiatric inpatient episodes (mental health)<br />
2001-04 Strathclyde<br />
Police/PEACH<br />
Unit & SG<br />
2004/05-<br />
2006/07<br />
ISD Scotland<br />
(SMR1/01)<br />
2001-05 GRO(S)<br />
2001 Census<br />
2002-04 ISD Scotland<br />
(SMR4)<br />
Estimated number and percentage of people<br />
being prescribed drugs <strong>for</strong> anxiety, depression or<br />
psychosis 7 2006 ISD Scotland<br />
(Prescribing<br />
In<strong>for</strong>mation<br />
System)<br />
Incapacity Benefit and SDA claimants, expressed<br />
as a number and percentage of the working age<br />
population<br />
Number and percentage of individuals with a<br />
long term limiting illness, health problem or<br />
disability which limits their daily activities or<br />
the work they can do; includes problems due to<br />
old age<br />
2007 DWP<br />
2001 Census<br />
9 For a definition refer to GROS website: http://www.gro-scotland.gov.uk/files1/stats/drug-related-deaths-2006/j883605.htm<br />
10 Cancer registrations: ICD10 C00-C96 excludes C44 (principal diagnosis only)<br />
11 Heart disease: ICD9 390-429; ICD10 I00-I52 (principal diagnosis only)<br />
12 Assault diagnoses: ICD9 E960 - E969; ICD10 X85 - Y09 in any of the six diagnostic positions on SMR1/01<br />
13 Suicide: ICD9 E950-E959; E980-E989 ; ICD10 X60-X84,Y870; Y10-Y34,Y872 (principal diagnosis only)<br />
78
Definition Indicator Description<br />
24 Social work<br />
clients<br />
Child (0-15), adult (16-64) and elderly (65+)<br />
social work clients, expressed as a number and<br />
percentage. (No data <strong>for</strong> Inverclyde)<br />
25 Income deprived The population defined as ‘income deprived’ 7 ,<br />
expressed as a number and percentage of the<br />
population<br />
26 Employment<br />
deprived<br />
Adults defined as ‘employment deprived’ 7 ,<br />
expressed as a number and percentage of the<br />
working age population<br />
27 Workless Workless adults 7 , expressed as a number and<br />
percentage of working age adults<br />
28 Unemployment JSA unemployed expressed as a number and<br />
percentage of the working age population<br />
29 Households<br />
without a car<br />
30 Children in<br />
workless<br />
households<br />
Number and percentage of households without<br />
access to a car or van<br />
Number and percentage of dependent children<br />
living in households where no-one is in<br />
employment<br />
31 Social Grade Number and percentage of adults (16+) in<br />
households classified as E (On state benefit,<br />
unemployed, lowest grade workers)<br />
32 Workplaces Workplaces, expressed as a number and rate per<br />
1000 working age population<br />
33 Employees Total employees expressed as a number and rate<br />
per 100 working age residents. NB employees<br />
assigned to place of work rather than residence<br />
34 Primary School<br />
attendance<br />
35 S4 Pupils<br />
with 5+GCSE<br />
equivalents<br />
36 Adults with no<br />
qualifications<br />
37 Serious violent<br />
crime<br />
38 Domestic abuse<br />
incidents<br />
Primary School attendance rate, expressed as a<br />
percentage (based on pupil residence)<br />
S4 pupils achieving five or more GCSE equivalent<br />
passes, expressed as a number and percentage<br />
(based on pupil residence)<br />
Number and percentage of all adults aged 16-74<br />
with no qualifications<br />
Serious Violent Crime (including serious assault,<br />
attempted murder, murder and culpable<br />
homicide), expressed as an annual average<br />
number and rate per 10,000 population<br />
Domestic abuse incidents, expressed as an annual<br />
average number and rate per 10,000 population<br />
39 Vandalism Crimes of vandalism, expressed as an annual<br />
average number and rate per 10,000 population<br />
40 Drug Offenders Drug offenders, expressed as an annual average<br />
number and rate per 10,000 population<br />
41 Housing type<br />
- tenements<br />
Tenemental properties, expressed as a number<br />
and percentage of all dwellings (<strong>Glasgow</strong><br />
CH(C)Ps only)<br />
42 House prices Annual average house sale prices (in pounds<br />
Sterling)<br />
Time<br />
Period<br />
Source 2<br />
2007 Council<br />
Social Work<br />
departments<br />
2006 SIMD, SG<br />
2006 SIMD, SG<br />
2006 SNS<br />
2007 NOMIS<br />
2001 Census<br />
2001 Census<br />
2001 Census<br />
2005 ABI, DWP<br />
2005 ABI, DWP<br />
2005/06 SG<br />
2005/06 SG<br />
2001 Census<br />
2004-06 VRU,<br />
Strathclyde<br />
Police<br />
2004-06 VRU,<br />
Strathclyde<br />
Police<br />
2004-06 Strathclyde<br />
Police<br />
2004-06 Strathclyde<br />
Police<br />
2006 DRS, GCC<br />
2006 SNS<br />
A Community <strong>Health</strong> and Wellbeing Profile <strong>for</strong> <strong>East</strong> <strong>Dunbartonshire</strong> 79
Definition Indicator Description<br />
43 Housing tenure<br />
-Owner occupiers<br />
Dwellings that are owner occupied, expressed as a<br />
number and percentage of all dwellings (<strong>Glasgow</strong><br />
CH(C)Ps only)<br />
44 Overcrowding Number and percentage of all households termed<br />
as “overcrowded” 14<br />
45 Travel to work/<br />
study by foot/<br />
bike/public<br />
transport<br />
46 Smoking during<br />
pregnancy<br />
47 Breastfeeding at<br />
6-8 weeks<br />
48 Low birth weight<br />
babies<br />
Number and percentage of people travelling to<br />
work/place of study by public transport (bus,<br />
train, underground), bicycle or on foot<br />
Maternal smoking recorded at booking (totalled<br />
over 3 years), expressed as a number and<br />
percentage of all admissions<br />
Children being breastfed at 6-8 week review,<br />
expressed as an average annual number and<br />
percentage<br />
Low weight live full term singleton births<br />
(