A naive Bayes classifier on 1998 KDD Cup
A naive Bayes classifier on 1998 KDD Cup
A naive Bayes classifier on 1998 KDD Cup

Create successful ePaper yourself
Turn your PDF publications into a flip-book with our unique Google optimized e-Paper software.
A <str<strong>on</strong>g>naive</str<strong>on</strong>g> <str<strong>on</strong>g>Bayes</str<strong>on</strong>g> <str<strong>on</strong>g>classifier</str<strong>on</strong>g> <strong>on</strong> <strong>1998</strong> <strong>KDD</strong> <strong>Cup</strong><br />
Chris Fleizach<br />
Department of Computer Science and Engineering<br />
University of California, San Diego<br />
San Diego, CA 92093<br />
cfleizac@cs.ucsd.edu<br />
Satoru Fukushima<br />
Department of Computer Science and Engineering<br />
University of California, San Diego<br />
San Diego, CA 92093<br />
sfukushi@cs.ucsd.edu<br />
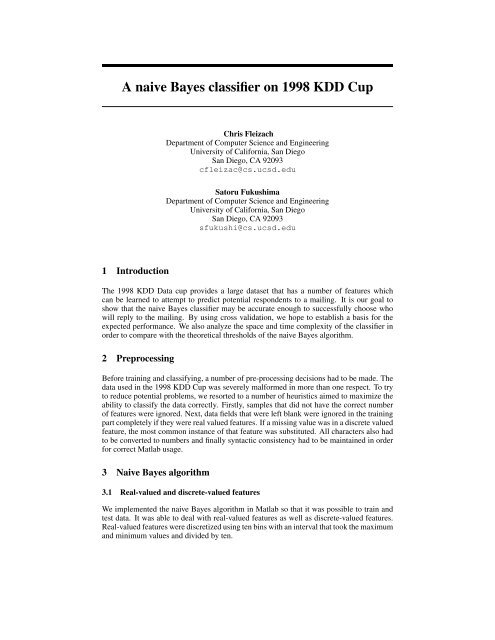
1 Introducti<strong>on</strong><br />
The <strong>1998</strong> <strong>KDD</strong> Data cup provides a large dataset that has a number of features which<br />
can be learned to attempt to predict potential resp<strong>on</strong>dents to a mailing. It is our goal to<br />
show that the <str<strong>on</strong>g>naive</str<strong>on</strong>g> <str<strong>on</strong>g>Bayes</str<strong>on</strong>g> <str<strong>on</strong>g>classifier</str<strong>on</strong>g> may be accurate enough to successfully choose who<br />
will reply to the mailing. By using cross validati<strong>on</strong>, we hope to establish a basis for the<br />
expected performance. We also analyze the space and time complexity of the <str<strong>on</strong>g>classifier</str<strong>on</strong>g> in<br />
order to compare with the theoretical thresholds of the <str<strong>on</strong>g>naive</str<strong>on</strong>g> <str<strong>on</strong>g>Bayes</str<strong>on</strong>g> algorithm.<br />
2 Preprocessing<br />
Before training and classifying, a number of pre-processing decisi<strong>on</strong>s had to be made. The<br />
data used in the <strong>1998</strong> <strong>KDD</strong> <strong>Cup</strong> was severely malformed in more than <strong>on</strong>e respect. To try<br />
to reduce potential problems, we resorted to a number of heuristics aimed to maximize the<br />
ability to classify the data correctly. Firstly, samples that did not have the correct number<br />
of features were ignored. Next, data fields that were left blank were ignored in the training<br />
part completely if they were real valued features. If a missing value was in a discrete valued<br />
feature, the most comm<strong>on</strong> instance of that feature was substituted. All characters also had<br />
to be c<strong>on</strong>verted to numbers and finally syntactic c<strong>on</strong>sistency had to be maintained in order<br />
for correct Matlab usage.<br />
3 Naive <str<strong>on</strong>g>Bayes</str<strong>on</strong>g> algorithm<br />
3.1 Real-valued and discrete-valued features<br />
We implemented the <str<strong>on</strong>g>naive</str<strong>on</strong>g> <str<strong>on</strong>g>Bayes</str<strong>on</strong>g> algorithm in Matlab so that it was possible to train and<br />
test data. It was able to deal with real-valued features as well as discrete-valued features.<br />
Real-valued features were discretized using ten bins with an interval that took the maximum<br />
and minimum values and divided by ten.
3.2 Time complexity<br />
The theoretical time complexity for learning a <str<strong>on</strong>g>naive</str<strong>on</strong>g> <str<strong>on</strong>g>Bayes</str<strong>on</strong>g> <str<strong>on</strong>g>classifier</str<strong>on</strong>g> is O(Np), where N<br />
is the number of training examples and p is the number of features. To empirically test<br />
the implemented algorithm’s time complexity, we used an artificially created data set. We<br />
varied the number of samples with a fixed number of features and the maximum size of<br />
bins, shown in Figure 1. Also, we varied the numbers of features with a fixed number of<br />
samples and the maximum size of bins, shown in Figure 2, and tested varying number of<br />
bin sizes with a fix number of samples and features, shown in Figure 3. The figures show<br />
the time is linear in respect to the number of samples, features, and the maximum size of<br />
bins.<br />
In our algorithm, we first had an outer loop for each feature. Within this loop, we enumerated<br />
the number of samples, finding the correct bin (or discretized bin) based <strong>on</strong> whether<br />
it was a real valued or discrete feature. This led to a running time of O(Np). In our first<br />
iterati<strong>on</strong> of the algorithm, the running time was O(Npq), because all values of the bins had<br />
to be searched in order to find the correct bin for the value of the specific feature, which<br />
was shown in Figure 1-3. Later, we realized that if a different data structure was used we<br />
would not need to search through all q values of each feature because an index could be<br />
used to do a fast lookup. We employed the use of a Java Hashtable through the Java Interface<br />
in Matlab in order to accomplish this task. This was able to reduce the overall time<br />
complexity to meet the theoretical bound. This same format was used in the testing of the<br />
data, which also resulted in an O(Np) running time.<br />
Figure 1: Time complexity regarding to the number of sample<br />
3.3 Space complexity<br />
The theoretical space complexity for <str<strong>on</strong>g>naive</str<strong>on</strong>g> <str<strong>on</strong>g>Bayes</str<strong>on</strong>g> algorithm is O(pqr), where p is the number<br />
of features, q is values for each feature, and r is alternative values for the class.<br />
We were able to achieve the same theoretical space complexity, because in our implementati<strong>on</strong>,<br />
we require the number of features (p) * the maximum number of bins (q) * the number<br />
of classes. Since the number of classes was two for the project, the space complexity of the<br />
implementati<strong>on</strong> is O(2pq ) = O(pq).
Figure 2: Time complexity regarding to the number of feature<br />
Figure 3: Time complexity regarding to the number of bins<br />
4 Results<br />
The success of our <str<strong>on</strong>g>naive</str<strong>on</strong>g> <str<strong>on</strong>g>Bayes</str<strong>on</strong>g> <str<strong>on</strong>g>classifier</str<strong>on</strong>g> was difficult to quantify. In our implementati<strong>on</strong>,<br />
higher accuracy was obtained when a smaller set of training samples were used, whereas<br />
the recall increased as the number of training samples grew. Therefore, we analyzed performance<br />
with regards to both large and small sample sizes to determine the effect it would<br />
have.<br />
For both cases, we estimated the performance by c<strong>on</strong>ducting cross validati<strong>on</strong> <strong>on</strong> the <strong>KDD</strong><br />
learning data set. Ten fold cross validati<strong>on</strong> was used, which trained the <str<strong>on</strong>g>classifier</str<strong>on</strong>g> with<br />
9/10ths of the data and tested with the remaining tenth for each separate segment. Using a<br />
tenth of the data though did not offer as high an accuracy as we had seen with even smaller<br />
training samples.The accuracy and the performance numbers were averaged and are shown<br />
in Table 1 and 3.<br />
Positive Negative<br />
True 216.0 6259.3<br />
False 1758.1 266.6<br />
Table 1: means of true/false - positive/negative with a large training set
Positive Negative<br />
True 1673.3 58766.0<br />
False 22391.0 2670.1<br />
Table 2: means of true/false - positive/negative with a small training set<br />
tenth training set<br />
9/10th training set<br />
Accuracy (mean) 0.7069 0.6816<br />
Recall (mean) 0.3767 0.4267<br />
Precisi<strong>on</strong> (mean) 0.0642 0.0683<br />
F-score (mean) 0.1098 0.1177<br />
F-score (s.d.) 0.0047 0.0110<br />
Table 3: Measurements <strong>on</strong> classificati<strong>on</strong> results<br />
We also ran cross-validati<strong>on</strong> using the opposite strategy, where ten percent of the data was<br />
used to train and ninety percent was used for testing. The results are shown in Table 2 and<br />
3. This strategy aimed to do better in accuracy, whereas the previous strategy was able to<br />
achieve much better recall.<br />
The dichotomy between accuracy and recall was troubling. We c<strong>on</strong>cluded that learning the<br />
dataset with a high degree of accuracy may not be possible. It seemed that as more data<br />
was learned, the <str<strong>on</strong>g>classifier</str<strong>on</strong>g> became aware of new instances that would cause an affirmative<br />
case to be detected. Thus, after learning <strong>on</strong> 80,000 samples, for example, the <str<strong>on</strong>g>classifier</str<strong>on</strong>g> had<br />
a large base of differing possibilities that all lead to a yes predicti<strong>on</strong>. The result was an abnormally<br />
high number of false positives (as well as an increased number of true positives).<br />
This provided better recall, but lower accuracy.<br />
On the other hand, if we <strong>on</strong>ly learned with a few samples, the <str<strong>on</strong>g>classifier</str<strong>on</strong>g> <strong>on</strong>ly knew what a<br />
yes predicti<strong>on</strong> would look like from a limited set. Thus, most predicti<strong>on</strong>s were negative,<br />
and because most of the answers were negative, this provided a higher accuracy.<br />
In this assignment, at least, it seemed more important to achieve a better recall, since we<br />
aimed to discover the people who would be most likely to resp<strong>on</strong>d to the mailing. The<br />
key insight being that we wished to reduce the number of false negatives. In other words,<br />
recall was more important than accuracy, because if a pers<strong>on</strong> was not identified as being a<br />
resp<strong>on</strong>dent, then a potential d<strong>on</strong>ati<strong>on</strong> could be missed, whereas if there were false positives,<br />
it would not negatively affect d<strong>on</strong>ati<strong>on</strong>s.<br />
5 Predicti<strong>on</strong><br />
From our cross validati<strong>on</strong> results menti<strong>on</strong>ed in the previous secti<strong>on</strong>, we obtained a mean<br />
F-score of 0.1098 with its standard deviati<strong>on</strong> of 0.0047 for a tenth training set and a mean<br />
F-score of 0.1177 with its standard deviati<strong>on</strong> of 0.0110 for 9/10th training set, each <strong>on</strong><br />
average. Therefore we decided to use a larger set in training phase. The fact that the size<br />
of the training set used in the cross validati<strong>on</strong> with the 9/10th training set is similar to the<br />
size of the actual hidden test set allows us to say with a degree of certainty (≈ 0.95) that the<br />
F-score will be within 0.1177±0.0110 as l<strong>on</strong>g as the tested set follows similar formatted<br />
patterns. In the CUP98VAL dataset, we predict that there will be 21.0% positive results and<br />
79.0% negative results, which is obviously skewed towards being too optimistic in stating<br />
a predicti<strong>on</strong>, but nevertheless manages to achieve a better F-score.
6 C<strong>on</strong>clusi<strong>on</strong><br />
We observed a number of surprising and sometimes disheartening results. We were not<br />
able to achieve a high accuracy of predicti<strong>on</strong>s, most likely due to the nature of the dataset<br />
and the relative difficulty of selecting appropriate features to learn. On the other hand, we<br />
were able to learn a <str<strong>on</strong>g>classifier</str<strong>on</strong>g> that increased it’s recall as the sample size grew. For example,<br />
if we trained <strong>on</strong> 1000 samples, our recall was around 20%, while using cross validati<strong>on</strong> <strong>on</strong><br />
the entire dataset, our recall improved to about 42%. Unfortunately, this did not extend<br />
to accuracy, which decreased as more samples were learned. Naive <str<strong>on</strong>g>Bayes</str<strong>on</strong>g> <str<strong>on</strong>g>classifier</str<strong>on</strong>g>s are<br />
powerful tools for learning data, but as we have discovered they need to be excessively<br />
coddled and fine tuned, if they are to be useful in all cases of performance.