TRS 2011 Comprehensive Annual Financial Report
TRS 2011 Comprehensive Annual Financial Report
TRS 2011 Comprehensive Annual Financial Report

Create successful ePaper yourself
Turn your PDF publications into a flip-book with our unique Google optimized e-Paper software.
Teacher Retirement System of Texas<br />
<strong>2011</strong><br />
C O M P R E H E N S I V E<br />
A N N U A L<br />
F I N A N C I A L<br />
R E P O R T<br />
A Component Unit of the State of Texas<br />
FISCAL YEAR ENDED AUGUST 31, <strong>2011</strong>
<strong>TRS</strong> Mission Statement<br />
The mission of the Teacher Retirement System of Texas is:<br />
1. to deliver retirement and related benefits<br />
authorized by law for members<br />
and their beneficiaries; and<br />
2. to prudently invest and manage the assets<br />
held in trust for members and beneficiaries<br />
in an actuarially sound system<br />
administered in accordance<br />
with applicable fiduciary<br />
principles.
TEACHER RETIREMENT SYSTEM OF TEXAS COMPREHENSIVE ANNUAL FINANCIAL REPORT <strong>2011</strong><br />
TEACHER RETIREMENT SYSTEM OF TEXAS<br />
COMPREHENSIVE ANNUAL FINANCIAL REPORT<br />
A Component Unit of the State of Texas<br />
FISCAL YEAR ENDED<br />
August 31, <strong>2011</strong><br />
Brian K. Guthrie, Executive Director<br />
Prepared by<br />
Teacher Retirement System of Texas<br />
1000 Red River Street<br />
Austin, Texas 78701-2698<br />
(512) 542-6400<br />
1-800-223-8778<br />
www.trs.state.tx.us<br />
FINANCIAL SECTION<br />
1
TEACHER RETIREMENT SYSTEM OF TEXAS COMPREHENSIVE ANNUAL FINANCIAL REPORT <strong>2011</strong><br />
Table of Contents<br />
INTRODUCTORY SECTION<br />
Board of Trustees..................................................................................................................................................................................... 3<br />
Professional Awards................................................................................................................................................................................ 4<br />
Letter of Transmittal................................................................................................................................................................................ 6<br />
Organization Chart................................................................................................................................................................................... 8<br />
Staff and Advisors................................................................................................................................................................................... 9<br />
Membership.......................................................................................................................................................................................... 10<br />
Communications.................................................................................................................................................................................... 11<br />
FINANCIAL SECTION<br />
Independent Auditor’s <strong>Report</strong>................................................................................................................................................................ 14<br />
Management’s Discussion and Analysis................................................................................................................................................ 16<br />
Basic <strong>Financial</strong> Statements<br />
Exhibit I - Statement of Fiduciary Net Assets................................................................................................................................ 24<br />
Exhibit II - Statement of Changes in Fiduciary Net Assets............................................................................................................. 28<br />
Exhibit III - Statement of Net Assets - Proprietary Funds............................................................................................................... 32<br />
Exhibit IV - Statement of Revenues, Expenses and Changes in Fund Net Assets - Proprietary Funds............................................ 34<br />
Exhibit V - Statement of Cash Flows - Proprietary Funds............................................................................................................... 36<br />
Notes to the <strong>Financial</strong> Statements................................................................................................................................................ 39<br />
Required Supplementary Information..................................................................................................................................................... 64<br />
Exhibit A - Combining Statement of Changes in Assets and Liabilities - Agency Funds.......................................................................... 66<br />
Supporting Schedules<br />
Schedule 1 - Comparative Schedule of Changes in Account Balance - Pension Trust Fund<br />
Interest Account.................................................................................................................................................................. 68<br />
Member Savings Account.................................................................................................................................................... 69<br />
State Contribution Account.................................................................................................................................................. 70<br />
Retired Reserve Account...................................................................................................................................................... 71<br />
Deferred Retirement Option Account................................................................................................................................... 72<br />
Expense Account................................................................................................................................................................. 73<br />
Schedule 2 - Schedule of Administrative and Capital Expenses - Budget and Actual on<br />
Budgetary Basis - All Fund Types......................................................................................................................................... 74<br />
Schedule 3 - Comparative Schedule of Investing Activity Expenses - Pension Trust Fund............................................................. 78<br />
Schedule 4 - Schedule of Professional and Consulting Fees - Budgetary Basis - All Fund Types.................................................... 79<br />
INVESTMENT SECTION<br />
Investment Overview............................................................................................................................................................................. 83<br />
Total Time-Weighted Returns................................................................................................................................................................ 84<br />
Asset Allocation.................................................................................................................................................................................... 85<br />
Investment Summary............................................................................................................................................................................ 86<br />
Largest Holdings.................................................................................................................................................................................... 88<br />
Schedule of Fees and Commissions....................................................................................................................................................... 90<br />
ACTUARIAL SECTION<br />
Pension Trust Fund<br />
Actuary’s Certification Letter...................................................................................................................................................... 110<br />
Actuarial Present Value of Future Benefits.................................................................................................................................. 112<br />
Actuarial Methods and Assumptions.......................................................................................................................................... 113<br />
Other Actuarial Information......................................................................................................................................................... 117<br />
<strong>TRS</strong>-Care<br />
Actuary’s Certification Letter...................................................................................................................................................... 120<br />
Actuarial Present Value of Future Benefits.................................................................................................................................. 121<br />
Actuarial Methods and Assumptions.......................................................................................................................................... 122<br />
STATISTICAL SECTION<br />
Statistical Section Overview................................................................................................................................................................ 127<br />
<strong>Financial</strong> Trends Information<br />
Ten-Year Summary Changes in Fiduciary Net Assets and Revenues, Expenses, and Changes in<br />
Net Assets......................................................................................................................................................................... 128<br />
Benefits and Refund Deductions from Net Assets by Type and Health Care Claims Deductions/<br />
Expenses from Net Assets by Type.................................................................................................................................... 136<br />
Operating Information<br />
Average Benefit Payments.......................................................................................................................................................... 138<br />
Average Health Care Claims........................................................................................................................................................ 139<br />
Retired Members by Type of Benefit and Health Care Claims by Benefit Range.......................................................................... 140<br />
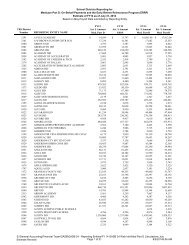
Principal Participating <strong>Report</strong>ing Entities..................................................................................................................................... 142<br />
Listing of Participating <strong>Report</strong>ing Entities............................................................................................................................................. 144<br />
BENEFITS SECTION<br />
<strong>2011</strong> Changes in <strong>TRS</strong> Law................................................................................................................................................................... 150<br />
Summary of Benefits........................................................................................................................................................................... 153<br />
Average Monthly Benefit..................................................................................................................................................................... 157<br />
Growth of the System......................................................................................................................................................................... 158<br />
2 FINANCIAL SECTION
INTRODUCTORY SECTION
TEACHER RETIREMENT SYSTEM OF TEXAS COMPREHENSIVE ANNUAL FINANCIAL REPORT <strong>2011</strong><br />
Board of Trustees<br />
This page is intentionally left blank.<br />
2 INTRODUCTORY SECTION
TEACHER RETIREMENT SYSTEM OF TEXAS COMPREHENSIVE ANNUAL FINANCIAL REPORT <strong>2011</strong><br />
Board of Trustees<br />
R. David Kelly<br />
(Chair)<br />
Managing Partner, Straight<br />
Line Realty Partners, Plano<br />
Direct appointment of<br />
the governor<br />
Term expires <strong>2011</strong><br />
Linus D. Wright<br />
(Vice Chair)<br />
Retired educator and<br />
administrator, Dallas<br />
Retiree position<br />
Term expires <strong>2011</strong><br />
Todd Barth<br />
President, Bowers<br />
Properties Inc., Houston<br />
Direct appointment of<br />
the governor<br />
Term expires 2015<br />
Charlotte Clifton<br />
Teacher, Snyder ISD<br />
Snyder<br />
Active public<br />
education position<br />
Term expires 2013<br />
Robert P. Gauntt<br />
Partner, Avalon<br />
Advisors L.P., Houston<br />
Direct appointment of<br />
the governor<br />
Term expires 2013<br />
Eric C. McDonald<br />
Owner and CIO, McDonald<br />
Capital Management<br />
Lubbock<br />
Position nominated by the<br />
State Board of Education<br />
Term expires 2013<br />
Christopher Moss<br />
Vice President<br />
The Advanced <strong>Financial</strong><br />
Group, Lufkin<br />
Position nominated by the<br />
State Board of Education<br />
Term expires 2015<br />
Philip Mullins<br />
Power Plant Operator<br />
University of Texas<br />
Austin<br />
Higher education position<br />
Term expires <strong>2011</strong><br />
Nanette Sissney<br />
Counselor<br />
Whitesboro ISD<br />
Whitesboro<br />
Active public education<br />
position<br />
Term expires 2015<br />
The <strong>TRS</strong> Board of Trustees is responsible for administration of the system under provisions of the state constitution and<br />
laws. The board is comprised of nine trustees, all of whom are appointed by the governor to staggered six-year terms.<br />
Three trustees are direct appointments of the governor. Two trustees are appointed from a list prepared by the State<br />
Board of Education. Two trustees are appointed from the three public school district active member candidates who<br />
have been nominated for each position by employees of public school districts. One trustee is appointed from the three<br />
higher education active member candidates nominated by employees of institutions of higher education. One trustee<br />
is appointed from the three retired member candidates who are nominated by <strong>TRS</strong> retirees. Appointments are subject<br />
to confirmation by the Senate. Board member terms expire August 31 of odd numbered years.<br />
In August <strong>2011</strong>, Governor Perry reappointed R. David Kelly of Plano as board chair for a term ending August 31, 2017.<br />
He also appointed two new trustees to six-year terms ending August 31, 2017 – T. Karen Charleston of Houston (replacing<br />
Philip Mullins) and Anita Palmer of Wichita Falls (replacing Linus D. Wright). In addition, Joe Colonnetta of Dallas<br />
was appointed by Governor Perry to fill the position formerly held by Robert P. Gauntt who resigned from the board in<br />
August <strong>2011</strong>.<br />
INTRODUCTORY SECTION<br />
3
TEACHER RETIREMENT SYSTEM OF TEXAS COMPREHENSIVE ANNUAL FINANCIAL REPORT <strong>2011</strong><br />
Professional Awards<br />
4 INTRODUCTORY SECTION
TEACHER RETIREMENT SYSTEM OF TEXAS COMPREHENSIVE ANNUAL FINANCIAL REPORT <strong>2011</strong><br />
Professional Awards<br />
INTRODUCTORY SECTION<br />
5
TEACHER RETIREMENT SYSTEM OF TEXAS COMPREHENSIVE ANNUAL FINANCIAL REPORT <strong>2011</strong><br />
Letter of Transmittal<br />
November 10, <strong>2011</strong><br />
The Honorable Rick Perry<br />
The Honorable David Dewhurst<br />
The Honorable Joe Straus<br />
The Board of Trustees and Members<br />
of the Teacher Retirement System<br />
Dear Governor Perry, Lieutenant Governor Dewhurst, Speaker Straus,<br />
<strong>TRS</strong> Board of Trustees, and Members of the Teacher Retirement System:<br />
On behalf of the board of trustees, I am pleased to present this <strong>Comprehensive</strong><br />
<strong>Annual</strong> <strong>Financial</strong> <strong>Report</strong> (CAFR) of the Teacher Retirement<br />
System of Texas (<strong>TRS</strong> or System) for the fiscal year ended August<br />
31, <strong>2011</strong>, the System’s 74th year of operation. During the past fiscal<br />
year, the System experienced steady growth as membership grew to<br />
more than 1,316,500 participants. The pension trust fund continued<br />
to rebound from the stock market decline of 2008-2009 ending the<br />
<strong>2011</strong> fiscal year with net assets of $107.4 billion compared to $95.7<br />
billion at the close of the 2010 fiscal year. Although continued funding<br />
progress is needed to return the fund to a fully funded status, <strong>TRS</strong> is<br />
well positioned to ensure that benefits are secure for our current and<br />
future retirees. Benefit payments continued to grow as <strong>TRS</strong> paid out<br />
$7.18 billion to annuitants during fiscal year <strong>2011</strong>.<br />
MANAGEMENT RESPONSIBILITY<br />
This report consists of management’s representations concerning <strong>TRS</strong><br />
finances. Management assumes full responsibility for the completeness<br />
and reliability of all information presented in this report. To provide<br />
a reasonable basis for making these representations, management<br />
has established a comprehensive internal control framework that is<br />
designed both to protect the assets from loss, theft, or misuse and<br />
to compile sufficient, reliable information for the preparation of <strong>TRS</strong><br />
financial statements in conformity with generally accepted accounting<br />
principles. The internal control framework has been designed to<br />
provide reasonable rather than absolute assurance that the financial<br />
statements will be free from material misstatement. As management,<br />
we assert that, to the best of our knowledge and belief, this financial<br />
report is complete and reliable in all material respects.<br />
CERTIFICATE OF ACHIEVEMENT FOR EXCELLENCE IN<br />
FINANCIAL REPORTING<br />
The Government Finance Officers Association of the United States<br />
and Canada (GFOA) awarded <strong>TRS</strong> the Certificate of Achievement<br />
for Excellence in <strong>Financial</strong> <strong>Report</strong>ing for its <strong>Comprehensive</strong> <strong>Annual</strong><br />
<strong>Financial</strong> <strong>Report</strong> for the previous fiscal year. To be awarded the certificate,<br />
a report must meet or exceed program standards and must<br />
satisfy both generally accepted accounting principles and applicable<br />
legal requirements. <strong>TRS</strong> has received a Certificate of Achievement<br />
for the last 21 years. We believe that the current report continues to<br />
meet program requirements, and it is being submitted to the GFOA<br />
for consideration again this year.<br />
FINANCIAL INFORMATION<br />
The basic financial statements have been prepared in accordance with<br />
generally accepted accounting principles applied on a consistent basis<br />
as promulgated by the Governmental Accounting Standards Board. The<br />
Management’s Discussion and Analysis (MD&A), includes a narrative<br />
introduction, overview, and analysis to accompany the basic financial<br />
statements. This transmittal letter is designed to complement the<br />
MD&A and should be read in conjunction with it. The MD&A can be<br />
found immediately following the report of the independent auditors.<br />
INVESTMENTS<br />
For the 12 month period ending August 31, <strong>2011</strong>, the total portfolio<br />
had a return of 15.5 percent, with investment gains totaling $11.8<br />
billion for fiscal year <strong>2011</strong>. For the past 10 years, the time-weighted<br />
compound annual return has been 5.8 percent.<br />
Investment risks are diversified over a very broad range of market<br />
sectors and securities. This strategy reduces portfolio risk to adverse<br />
developments in sectors and issuers experiencing unusual difficulties<br />
and offers opportunity to benefit from future markets. The System has<br />
completed its transition to the long-term asset allocation adopted by<br />
the <strong>TRS</strong> Board in fiscal year 2008. That asset allocation has increased<br />
<strong>TRS</strong> holdings in private markets and reduced holdings in public markets.<br />
This shift in assets is intended to increase investment diversification<br />
and returns without increasing risks to the fund.<br />
PENSION PLAN BENEFITS<br />
For fiscal year <strong>2011</strong>, <strong>TRS</strong> paid pension benefit payments to more than<br />
312,000 retirees and their beneficiaries totaling $7.18 billion. These<br />
6 INTRODUCTORY SECTION
TEACHER RETIREMENT SYSTEM OF TEXAS COMPREHENSIVE ANNUAL FINANCIAL REPORT <strong>2011</strong><br />
Letter of Transmittal<br />
benefits were funded from a combination of cumulative investment<br />
income, member contributions, and state and employer contributions.<br />
ACTUARIAL SOUNDNESS OF THE PENSION TRUST FUND<br />
As of August 31, <strong>2011</strong>, the System had a funded ratio of 82.7% with<br />
an Unfunded Actuarial Accrued Liability of $24.1 billion. However,<br />
because of poor investment performance in fiscal years 2008 and<br />
2009, the System is now deferring net investment losses of $7.8 billion.<br />
Because of the two significant market downturns in the last 10 years,<br />
current contributions are not sufficient to amortize the unfunded liabilities<br />
and therefore the funding period is “never”. Absent ongoing<br />
investment gains in excess of eight percent, adjustments will need to<br />
be made to contributions and/or benefits to bring the fund back into<br />
a position to amortize unfunded liabilities over 30 years.<br />
ACTIVE MEMBER HEALTH BENEFITS PROGRAM<br />
<strong>TRS</strong>-ActiveCare, initiated in 2002, is a self-funded health benefits<br />
program that offers options ranging from catastrophic coverage with<br />
reduced premiums to a comprehensive plan with near first-dollar<br />
coverage at higher premiums. <strong>TRS</strong>-ActiveCare covers members currently<br />
employed by public educational employers that participate in<br />
the plan. <strong>TRS</strong> establishes premiums to pay for the cost of the program.<br />
RETIREE HEALTH BENEFITS PROGRAM<br />
<strong>TRS</strong> also administers <strong>TRS</strong>-Care, a health benefits program for retirees<br />
that was established in 1985. <strong>TRS</strong>-Care is the source of health<br />
benefits coverage, which almost all retired public school employees<br />
rely upon. Funding is provided by premium payments from retiree<br />
participants and contributions from the state, school districts, and<br />
active employees. During <strong>2011</strong>, <strong>TRS</strong>-Care also received additional<br />
revenue from the Medicare Part D prescription drug program and<br />
Early Retiree Reinsurance Program.<br />
An actuarial valuation for <strong>TRS</strong>-Care was conducted as of August 31,<br />
<strong>2011</strong>. The valuation results indicate that <strong>TRS</strong>-Care has an Unfunded<br />
Actuarial Accrued Liability of $28.9 billion. More detailed information<br />
about the valuation results is included in the Notes to the <strong>Financial</strong><br />
Statements and the Required Supplementary Information.<br />
Based on projections, <strong>TRS</strong>-Care is solvent from a cash flow perspective<br />
until FY 2014. As in the past, changes to the benefit structure<br />
and/or funding structure will need to be considered to extend the life<br />
of the program. <strong>TRS</strong> trustees remain focused on the need to balance<br />
revenues and expenses in a fiscally responsible manner, and to offer a<br />
program that best suits all participants’ needs given available resources.<br />
At the conclusion of the 82nd Texas Legislature, a rider was added to<br />
the General Appropriations Act, requiring <strong>TRS</strong> to conduct a study of<br />
<strong>TRS</strong>-Care and report to the legislature on potential changes to improve<br />
the program’s sustainability. Staff will evaluate possible changes, seek<br />
public input, and complete this study in the coming year.<br />
ORGANIZATIONAL CHANGE<br />
On September 1, <strong>2011</strong>, I began serving as executive director of the<br />
retirement system, and Ken Welch assumed his new responsibilities as<br />
the agency’s deputy director. These changes followed Ronnie Jung’s<br />
announcement that he will retire in January 2012, after serving as<br />
the agency’s chief financial<br />
officer, deputy director and<br />
then as executive director<br />
since 2004. <strong>TRS</strong> trustees<br />
and I especially appreciate<br />
his invaluable assistance<br />
during the transition before<br />
his retirement. Mr. Jung<br />
guided <strong>TRS</strong> during one of the<br />
most challenging periods in<br />
the agency’s history, which<br />
included significant growth<br />
in membership, one of the<br />
nation’s deepest recessions<br />
and, most recently, significant<br />
gains in plan net assets.<br />
We wish to acknowledge<br />
his valuable leadership and<br />
considerable contributions<br />
to the agency and all <strong>TRS</strong> members.<br />
ACKNOWLEDGMENTS<br />
Brian K. Guthrie<br />
We wish to express our appreciation for the support of the Governor’s,<br />
Lieutenant Governor’s, and Speaker’s Offices, as well as members<br />
of the legislature, in maintaining a strong retirement system, which<br />
provides valuable benefits for public education employees and retirees.<br />
Trustee willingness to accept the substantial responsibilities of directing<br />
system administration is a great service to the state and to the<br />
members served by <strong>TRS</strong>. We are grateful for the dedicated service<br />
and leadership provided by our outgoing trustees, Robert Gauntt,<br />
Philip Mullins and Linus Wright. We also look forward to the future<br />
contributions of our new trustees, Karen Charleston, Joe Colonnetta<br />
and Anita Smith Palmer.<br />
<strong>TRS</strong> trustees and staff are keenly focused on prudent pension trust<br />
fund portfolio management and efficient, service-oriented delivery of<br />
valuable retirement and related benefits for public education employees<br />
and retirees. We are pleased to report on operational results for the<br />
year and to acknowledge the substantial support of state leadership,<br />
trustees, members, interested associations, and <strong>TRS</strong> staff.<br />
Respectfully submitted,<br />
Brian K. Guthrie<br />
Executive Director<br />
Resp<br />
Bria<br />
Exec<br />
INTRODUCTORY SECTION<br />
7
TEACHER RETIREMENT SYSTEM OF TEXAS COMPREHENSIVE ANNUAL FINANCIAL REPORT <strong>2011</strong><br />
Organization Chart<br />
Effective September 1, <strong>2011</strong><br />
8 INTRODUCTORY SECTION
TEACHER RETIREMENT SYSTEM OF TEXAS COMPREHENSIVE ANNUAL FINANCIAL REPORT <strong>2011</strong><br />
Staff and Advisors<br />
EXECUTIVE ADMINISTRATIVE STAFF<br />
Brian K. Guthrie, Executive Director<br />
Ken Welch, Deputy Director<br />
T. Britton Harris IV, Chief Investment Officer<br />
Conni H. Brennan, General Counsel<br />
Amy L. Barrett, Chief Audit Executive<br />
Marianne Woods Wiley, Chief Benefit Officer<br />
Vacant, Chief <strong>Financial</strong> Officer<br />
Howard J. Goldman, Director, Communications<br />
Ray Spivey, Director, Governmental Relations<br />
Annette Dominguez, Director, Human Resources<br />
Amy L. Morgan, Director, Information Technology<br />
Betsey Jones, Director, Special Projects<br />
GENERAL INVESTMENT CONSULTANT<br />
Hewitt Ennis Knupp, Chicago, IL<br />
CONSULTING ACTUARY<br />
Gabriel, Roeder, Smith & Company, Dallas<br />
INVESTMENT CONSULTANTS<br />
Hamilton Lane Advisors, L.L.C., Bala Cynwyd, PA<br />
(Domestic Private Equity)<br />
Albourne America, L.L.C., San Francisco, CA<br />
(Absolute Return)<br />
The Townsend Group, Inc., Cleveland, OH<br />
(Real Estate)<br />
INVESTMENT ADVISORS<br />
Keith C. Brown, Ph.D., Austin<br />
AUDIT SERVICES<br />
Texas State Auditor’s Office, Austin<br />
FIDUCIARY COUNSEL<br />
Reinhart Boerner Van Deuren, S.C.,<br />
Milwaukee, WI<br />
MEDICAL BOARD<br />
Dr. Alice Cox, Fredericksburg<br />
Dr. James Reinarz, Austin<br />
Dr. Larry D. Wilson, Austin<br />
TEXAS PUBLIC SCHOOL RETIRED<br />
EMPLOYEES GROUP INSURANCE<br />
PROGRAM ADVISORY COMMITTEE<br />
B. Sue Passmore, Chair, Dallas<br />
Wendell Whittenburg, Sweetwater<br />
William (Bill) W. Barnes, Haslet<br />
Kim Kriegel, Red Oak<br />
Dr. Ignacio Salinas, Jr., Benavides<br />
Nelda Van Dyke, Brenham<br />
Beth Wallace, San Antonio<br />
Leona Ellyce Warns, San Antonio<br />
Gary R. Willis, Midland<br />
HEALTH CARE CONSULTANT<br />
Gabriel, Roeder, Smith & Company, Dallas<br />
MASTER CUSTODIAN AND SECURITIES<br />
LENDING AGENT<br />
State Street Bank and Trust Company,<br />
Boston, MA<br />
PERFORMANCE MEASUREMENT<br />
State Street Bank and Trust Company,<br />
Boston, MA<br />
Effective September 1, <strong>2011</strong><br />
INTRODUCTORY SECTION<br />
9
TEACHER RETIREMENT SYSTEM OF TEXAS COMPREHENSIVE ANNUAL FINANCIAL REPORT <strong>2011</strong><br />
Membership<br />
PENSION TRUST FUND<br />
Membership includes employees of state-supported educational<br />
institutions in Texas. At August 31, <strong>2011</strong>, participating entities<br />
included the following:<br />
Independent School Districts 1,030<br />
Charter Schools 197<br />
Community and Junior Colleges 51<br />
Senior Colleges and Universities 46<br />
Regional Education Service Centers 20<br />
Education Districts 5<br />
Medical and Dental Schools 9<br />
State Agencies 2<br />
Total 1,360<br />
Employees and retirees from these entities comprise the membership<br />
of the Teacher Retirement System of Texas.<br />
At August 31, <strong>2011</strong>, and August 31, 2010, membership consisted<br />
of the following:<br />
Year Ended August 31,<br />
<strong>2011</strong> 2010<br />
Current Members:<br />
Active Contributing 847,523 853,984<br />
Active Non-contributing 109,545 107,203<br />
Deferred Retirement Option 324 466<br />
Inactive Non-vested 14,881 13,497<br />
Inactive Vested 31,613 29,039<br />
Total Current Members 1,003,886 1,004,189<br />
Retirement Recipients:<br />
Service 292,838 277,088<br />
Disability 8,785 8,677<br />
Survivor 11,057 10,726<br />
Total Retirement Recipients 312,680 296,491<br />
TOTAL MEMBERSHIP 1,316,566 1,300,680<br />
Membership changes are summarized below:<br />
<strong>2011</strong> 2010<br />
Active Membership:<br />
New Members 66,337 74,780<br />
Members Withdrawing (40,402) (36,140)<br />
Service Retirements (20,401) (16,054)<br />
Disability Retirements (753) (652)<br />
In-Service Deaths (1,266) (1,285)<br />
Other Changes (3,818) (5,428)<br />
Net Increase/(Decrease) (303) 15,221<br />
Retired Membership:<br />
Retirements 21,154 16,706<br />
Deaths After Retirement (6,753) (6,436)<br />
Option Continuations 1,983 1,852<br />
Other Changes (195) (245)<br />
Net Increase 16,189 11,877<br />
Active Member Profile <strong>2011</strong> 2010<br />
Average <strong>Annual</strong> Salary $ 44,392 $ 43,916<br />
Average Age 44.3 44.2<br />
Average Years of Service 9.9 9.7<br />
Annuitant and<br />
Beneficiary Profile <strong>2011</strong> 2010<br />
Average Monthly Annuities<br />
Life Annuities $ 1,897 $ 1,863<br />
Disability Annuities $ 1,174 $ 1,167<br />
Annuities Certain $ 984 $ 1,000<br />
Average Age of Current Retirees 70.2 70.2<br />
Average Age at Retirement<br />
All Retirees 59.8 59.8<br />
Current Year Retirees 61.0 60.7<br />
Average Years of Service<br />
All Retirees 24.6 24.6<br />
Current Year Retirees 24.6 24.0<br />
Average Salary at Retirement<br />
All Retirees $ 39,234 $38,023<br />
Current Year Retirees $ 51,130 $49,345<br />
Ratio of Current Members<br />
to Retirees 3.2 to 1 3.4 to 1<br />
TEXAS PUBLIC SCHOOL RETIRED EMPLOYEES<br />
GROUP INSURANCE PROGRAM (<strong>TRS</strong>-CARE)<br />
Participation for the Retired Plan is summarized below:<br />
<strong>2011</strong> 2010<br />
Retirees 167,726 161,578<br />
Surviving Spouses 5,063 4,802<br />
Surviving Children 70 65<br />
Dependent Spouses 33,701 31,889<br />
TOTAL * 206,560 198,334<br />
* Excludes 6,182 and 5,887 dependent children for <strong>2011</strong> and<br />
2010, respectively.<br />
TEXAS ACTIVE SCHOOL EMPLOYEES UNIFORM<br />
GROUP BENEFITS PROGRAM (<strong>TRS</strong>-ACTIVECARE)<br />
Participation for the Active Plan is summarized below:<br />
<strong>2011</strong> 2010<br />
Employees 270,490 245,686<br />
Dependents 188,110 168,435<br />
TOTAL 458,600 414,121<br />
As of September 1, <strong>2011</strong>, there were 1,120 participating entities.<br />
10 INTRODUCTORY SECTION
TEACHER RETIREMENT SYSTEM OF TEXAS COMPREHENSIVE ANNUAL FINANCIAL REPORT <strong>2011</strong><br />
Communications<br />
During fiscal year <strong>2011</strong>, <strong>TRS</strong> expanded its efforts to improve<br />
communications with its members, retirees, and the general<br />
public.<br />
The year began with a concerted effort to reach out to<br />
members and retirees regarding <strong>TRS</strong>-related matters<br />
throughout the state. <strong>TRS</strong> staff spoke at conferences across<br />
Texas to provide updates on new legislation, investment<br />
performance, pension- and health care-related issues, and<br />
to explain new ways that members and retirees can obtain<br />
the latest information from <strong>TRS</strong>.<br />
Listed below are achievements of the past year, including<br />
those pertaining to the agency’s website, toll-free telephone<br />
service, print publications, benefit presentations and employer<br />
training programs.<br />
PRINT PUBLICATIONS<br />
During fiscal year <strong>2011</strong>, <strong>TRS</strong> published three <strong>TRS</strong> News issues<br />
to provide members, retirees and employers with important<br />
information relating to their benefits. In addition, the agency<br />
introduced a comprehensive new booklet to help those<br />
seeking information on returning to work for a <strong>TRS</strong>-covered<br />
employer after retirement.<br />
Titled Employment After Retirement, the booklet is divided<br />
into three sections – for those who are retired, those who<br />
have not yet retired, and those who have taken disability<br />
retirement. The <strong>TRS</strong> Benefits Handbook continues to be the<br />
primary guide for members and retirees wishing to learn about<br />
their retirement and health care benefits. Featured on the <strong>TRS</strong><br />
website and mailed to members and retirees, the handbook<br />
is also available in Spanish. Additional benefit information<br />
is available to members and retirees through brochures,<br />
newsletters, other print materials and the <strong>TRS</strong> website.<br />
THE INTERNET<br />
During the past year, <strong>TRS</strong> undertook two major website<br />
initiatives: My<strong>TRS</strong>, a new and improved online access section<br />
of the <strong>TRS</strong> website, and the <strong>TRS</strong> Broker Relations Portal.<br />
Prior to My<strong>TRS</strong>, separate web applications had allowed<br />
members to view account information, register for benefit<br />
presentations, and request information from <strong>TRS</strong>. However, in<br />
November 2010, <strong>TRS</strong> launched My<strong>TRS</strong> by mailing temporary<br />
user IDs and passwords to members with the 2010 <strong>TRS</strong> <strong>Annual</strong><br />
Statement of Account. This enabled members to create their<br />
own unique My<strong>TRS</strong> user IDs and passwords.<br />
Once active members select a valid user ID and password<br />
for My<strong>TRS</strong>, they can:<br />
• Obtain personalized retirement estimates using data<br />
on file with <strong>TRS</strong><br />
• View and print a copy of their most recent annual<br />
statement<br />
• View their account balance, including current year<br />
contributions received to date by <strong>TRS</strong><br />
• Request a bill for reinstatement of withdrawn service<br />
• Obtain information on their withdrawn, unreported,<br />
military and out-of-state special service credit<br />
purchases that are already in progress<br />
• Register for group benefit presentations held around<br />
the state<br />
<strong>TRS</strong> annuitants with a valid user ID and password can do<br />
the following:<br />
• View and print a copy of their most recent 1099-R<br />
tax form<br />
• View and calculate their withholding tax amount using<br />
data on file with <strong>TRS</strong><br />
• View a summary of their current annuity payments<br />
• View a summary of health benefit premiums paid in the<br />
prior two years by deduction from their <strong>TRS</strong> annuities<br />
My<strong>TRS</strong> also features an e-mail subscription service that<br />
offers members and retirees the ability to receive <strong>TRS</strong><br />
announcements and various <strong>TRS</strong> publications electronically<br />
when they subscribe for such service. Those who register<br />
not only receive information more quickly than by mail, but<br />
they also help reduce <strong>TRS</strong> printing and postage expenses.<br />
Most recently, My<strong>TRS</strong> introduced options to register to<br />
receive electronic notification of 1099-Rs and <strong>TRS</strong> <strong>Annual</strong><br />
Statements of Account rather than receiving them by mail.<br />
Members were also given the ability to register for field office<br />
visits around the state. By the end of the fiscal year, nearly<br />
170,000 members and retirees had registered for My<strong>TRS</strong>.<br />
Participation is expected to increase significantly as new<br />
My<strong>TRS</strong> features continue to be introduced.<br />
During the past year, <strong>TRS</strong> also introduced the <strong>TRS</strong> Broker<br />
Relations Portal, a Web-based application to manage broker<br />
relations, including numerous compliance and evaluation<br />
documents that are exchanged between brokers and <strong>TRS</strong>’<br />
Trade Management team. The system automates processes<br />
used by brokers and <strong>TRS</strong> traders, reduces paper, and saves<br />
staff time. The annual compliance process with brokers was<br />
successfully completed using the system in the spring of <strong>2011</strong>.<br />
INTRODUCTORY SECTION<br />
11
TEACHER RETIREMENT SYSTEM OF TEXAS COMPREHENSIVE ANNUAL FINANCIAL REPORT <strong>2011</strong><br />
Communications<br />
<strong>TRS</strong> has also begun posting online surveys to its website<br />
that enable visitors to provide feedback regarding the site<br />
and offer suggestions for improvements.This information will<br />
play an important role in helping <strong>TRS</strong> better serve members<br />
and retirees.<br />
During fiscal year <strong>2011</strong>, the <strong>TRS</strong> website received a total<br />
of 1,987,815 visits, representing a 24.18 percent increase<br />
from 1,600,691 visits in the previous fiscal year. In addition,<br />
1,102,462 unique visitors used the site during fiscal year<br />
<strong>2011</strong> — a 29.54 percent increase from 851,070 visitors in<br />
fiscal year 2010.<br />
VIDEO PRODUCTION<br />
Fiscal year <strong>2011</strong> saw <strong>TRS</strong> produce the first in a series of<br />
issue-oriented videos called “<strong>TRS</strong> Today.” The first videos<br />
featured interviews with <strong>TRS</strong> executives on topics such<br />
as <strong>TRS</strong>-Care, <strong>TRS</strong>-ActiveCare and various communication<br />
initiatives. Subsequent videos have focused on new<br />
legislation, actuarial valuations and other topics. More “<strong>TRS</strong><br />
Today” programs are slated for the coming year. In addition<br />
to issue-oriented videos, <strong>TRS</strong> produced instructional videos<br />
on topics such as “Steps to Retirement.” <strong>TRS</strong> also produced<br />
a video to illustrate how <strong>TRS</strong> adds value to its members,<br />
the Texas and local economies, and state’s educational<br />
system. Finally, <strong>TRS</strong> established a video library for use in<br />
future video productions.<br />
WEBCASTING OF BOARD MEETINGS<br />
As part of its commitment towards open and transparent<br />
communication, <strong>TRS</strong> began webcasting all board meetings<br />
during the past year. Meetings are now streamed live so<br />
members and others can watch the proceedings as they<br />
take place from anywhere in Texas or around the world.<br />
Each meeting is also recorded for playback on demand. All<br />
<strong>TRS</strong> Board meetings are archived on the <strong>TRS</strong> website where<br />
individual agenda items can be easily accessed.<br />
ASSOCIATION AND REPORT CARD TOUR MEETINGS<br />
In the fall of 2010, <strong>TRS</strong> continued its outreach to members<br />
and retirees through a series of Texas Retired Teacher<br />
Association meetings. <strong>TRS</strong> officials spoke to retirees at<br />
more than 40 conventions around the state and provided<br />
updates on <strong>TRS</strong> developments. In addition, in November<br />
2010, <strong>TRS</strong> trustees and staff hosted town-hall style <strong>Report</strong><br />
Card Tour meetings in San Antonio, El Paso and Lufkin. The<br />
San Antonio meeting was webcast live and recorded for<br />
on-demand viewing. These meetings provide an opportunity<br />
for trustees and <strong>TRS</strong> executives to meet with members and<br />
retirees face-to-face not only to provide an update on the<br />
fund’s status and other pertinent information, but also to<br />
answer any questions they may have. Legislators or their<br />
representatives from the area typically attend the meetings<br />
as do members of the news media.<br />
GROUP PRESENTATIONS AND INDIVIDUAL<br />
RETIREMENT COUNSELING SESSIONS<br />
Over the past year, <strong>TRS</strong> made a number of group presentations<br />
to professional associations, to employee and retiree groups<br />
and at regional education service centers. Presentations<br />
focused on retirement options, health care benefits for active<br />
and retired members, long-term care insurance, employment<br />
after retirement, and other <strong>TRS</strong> benefits. A total of 15,921<br />
people attended 212 group presentations, and 34,900 people<br />
attended nine conventions where <strong>TRS</strong> was represented.<br />
In addition, 10,088 people visited individually with a <strong>TRS</strong><br />
counselor – 9,645 in Austin and 433 in field office visit<br />
locations. Fiscal year <strong>2011</strong> was the fifth year that one-onone<br />
retirement counseling sessions were offered in limited<br />
field locations throughout Texas (450 available appointments<br />
in 10 cities).<br />
TELECOMMUNICATIONS<br />
In fiscal year <strong>2011</strong>, the agency’s Benefit Counseling<br />
department handled a total of 496,210 calls. In addition,<br />
273,132 calls were completed during the past year within<br />
the agency’s automated telephone system.<br />
<strong>TRS</strong> and its contractors also provided telephone assistance<br />
to a large number of members seeking health care-related<br />
information. <strong>TRS</strong>-ActiveCare staff and contractors responded<br />
to 1,015,102 calls, and <strong>TRS</strong>-Care staff and contractors<br />
responded to 442,559 calls.<br />
COORDINATION WITH REPORTING ENTITIES<br />
The <strong>TRS</strong> <strong>Report</strong>ing and Query System (TRAQS), the agency’s<br />
Internet-based reporting system for employers, had 1,360<br />
reporting entities submit monthly reports to <strong>TRS</strong> by year-end.<br />
TRAQS training was conducted through 10 webinar sessions<br />
with a total of 800 reporting entity staff participating. Some<br />
sessions were recorded and placed in the Employers section<br />
of the <strong>TRS</strong> website. Webinars offer participants greater<br />
convenience than traveling to a central location. They also<br />
save <strong>TRS</strong> staff time and travel expenses. More sessions<br />
are planned in the coming year. <strong>TRS</strong>-ActiveCare training<br />
seminars were conducted in 20 locations around the state for<br />
approximately 1,590 administrators of 987 districts/entities.<br />
These seminars provided information regarding enrollment<br />
and ongoing administrative issues for <strong>TRS</strong>-ActiveCare.<br />
12 INTRODUCTORY SECTION
TEACHER RETIREMENT SYSTEM OF TEXAS COMPREHENSIVE ANNUAL FINANCIAL REPORT <strong>2011</strong><br />
FINANCIAL SECTION<br />
FINANCIAL SECTION<br />
13
TEACHER RETIREMENT SYSTEM OF TEXAS COMPREHENSIVE ANNUAL FINANCIAL REPORT <strong>2011</strong><br />
14 FINANCIAL SECTION
TEACHER RETIREMENT SYSTEM OF TEXAS COMPREHENSIVE ANNUAL FINANCIAL REPORT <strong>2011</strong><br />
FINANCIAL SECTION<br />
15
TEACHER RETIREMENT SYSTEM OF TEXAS COMPREHENSIVE ANNUAL FINANCIAL REPORT <strong>2011</strong><br />
Management’s Discussion and Analysis<br />
The following is Management’s Discussion and Analysis (MD&A)<br />
of the Teacher Retirement System’s (<strong>TRS</strong> or system) financial<br />
performance for the fiscal year ended August 31, <strong>2011</strong>. The<br />
information presented here should be considered in conjunction<br />
with other areas of the <strong>Financial</strong> Section as well as information<br />
presented in the Executive Director’s Letter of Transmittal in<br />
the Introductory Section of the <strong>TRS</strong> <strong>Comprehensive</strong> <strong>Annual</strong><br />
<strong>Financial</strong> <strong>Report</strong>.<br />
FINANCIAL HIGHLIGHTS<br />
• The net assets of the <strong>TRS</strong> Pension Trust Fund were $107.4<br />
billion at August 31, <strong>2011</strong>, an increase of 12.3%, in fiscal year<br />
<strong>2011</strong>.<br />
• As of August 31, <strong>2011</strong>, the date of the most recent actuarial<br />
valuation, the <strong>TRS</strong> Pension Trust Fund’s ratio of actuarial assets,<br />
as a percentage of actuarial liabilities, was 82.7%, which is<br />
lower than the 82.9% level at August 31, 2010.<br />
• The <strong>TRS</strong> annual rate of return on investments for the year<br />
ended August 31, <strong>2011</strong> was 15.5% on a market value basis<br />
and was due to strong performance in private equities and<br />
real assets. The rate of return for fiscal year 2010 was 10.7%.<br />
• Net Assets of <strong>TRS</strong>-Care (Retired Plan) were $890.9 million<br />
at August 31, <strong>2011</strong>, an increase of 9.3% in fiscal year <strong>2011</strong>.<br />
• As of August 31, <strong>2011</strong>, the date of the most recent actuarial<br />
valuation, the <strong>TRS</strong>-Care trust fund’s unfunded actuarial accrued<br />
liability was $28.9 billion, which is greater than the $25.0 billion<br />
reported at August 31, 2010.<br />
• Net assets of <strong>TRS</strong>-ActiveCare (Active plan) were $188.1 million<br />
at August 31, <strong>2011</strong>, a decrease of $111.7 million or 37.3% in fiscal<br />
year <strong>2011</strong>.<br />
OVERVIEW OF THE FINANCIAL STATEMENTS<br />
This discussion and analysis is intended to serve as an introduction<br />
to the <strong>TRS</strong> financial presentation, which consists of the following<br />
components:<br />
• Fund financial statements<br />
• Notes to the financial statements<br />
• Required supplementary information<br />
• Other supplementary schedules<br />
Collectively, this information presents the net assets available<br />
for pension and other post-employment benefits, health care<br />
benefits, and other purposes as of August 31, <strong>2011</strong>, and<br />
summarizes any changes in net assets for the same. The<br />
information available in each of these sections is summarized<br />
as follows:<br />
Fund <strong>Financial</strong> Statements<br />
Individual fund financial statements are presented for all fiduciary<br />
and proprietary funds as of August 31, <strong>2011</strong> and for the year<br />
then ended. Comparative data in total as of August 31, 2010,<br />
and for the year then ended has also been presented with the<br />
exception of agency funds. These financial statements reflect the<br />
resources available to pay benefits to retirees and other beneficiaries,<br />
to pay health care benefits for covered participants, and<br />
to administer the 403(b) Certification Program. Fiduciary funds<br />
presented include the Pension Trust Fund, <strong>TRS</strong>-Care and Agency<br />
Funds. Fiduciary funds are used to account for resources held for<br />
the benefit of parties outside of <strong>TRS</strong>. Proprietary funds account<br />
for business-type activities and include the <strong>TRS</strong>-ActiveCare and<br />
the non-major 403(b) Certification Program enterprise funds.<br />
Notes to the <strong>Financial</strong> Statements<br />
The financial statement notes provide additional information<br />
that is essential to a full understanding of the data provided in<br />
the fund financial statements. Information available in the notes<br />
to the financial statements is described below:<br />
• Note 1 provides a summary of significant accounting policies,<br />
including the basis of accounting, budgets and appropriations,<br />
explanations of major asset and liability classes, and legal reserve<br />
account information. Also included is a general description of<br />
<strong>TRS</strong> as well as a description of each of the funds administered<br />
by <strong>TRS</strong>.<br />
• Note 2 provides information on capital assets.<br />
• Note 3 describes deposits and investments, including investing<br />
authority, investment risk categorizations, and additional<br />
information about cash, derivatives, securities lending, alternative<br />
investments and contingent commitments.<br />
• Note 4 provides information on employee compensable leave.<br />
• Note 5 provides information on the operating lease.<br />
• Note 6 provides information on fringe benefits paid by the<br />
state and federal government on behalf of employees and<br />
participants of the health care plans.<br />
• Note 7 describes deferred compensation plans available to<br />
<strong>TRS</strong> employees.<br />
• Note 8 provides information on contingent liabilities such<br />
as <strong>TRS</strong> employees’ accumulated sick leave, lump sum death<br />
benefits and incentive compensation as well as retiree benefits<br />
and any pending litigation.<br />
• Note 9 addresses <strong>TRS</strong>’ continuance subject to review under<br />
the Texas Sunset Act.<br />
• Note 10 describes other post-employment health care benefits<br />
provided to <strong>TRS</strong>’ employees and retired public school employees,<br />
contributions to the plan and its funded status.<br />
• Note 11 addresses risk management issues related to the<br />
health benefits program for active school district employees.<br />
• Note 12 provides pension disclosure information including<br />
detailed data on the plan description, contributions required<br />
and made, legal reserve balances and funded status.<br />
16 FINANCIAL SECTION
TEACHER RETIREMENT SYSTEM OF TEXAS COMPREHENSIVE ANNUAL FINANCIAL REPORT <strong>2011</strong><br />
Management’s Discussion and Analysis<br />
• Note 13 provides information on subsequent events.<br />
Required Supplementary Information<br />
Required supplementary information consists of schedules<br />
related to the funding progress and the contributions from<br />
employers and other contributing entities of both the pension<br />
plan and the other employee benefit plan administered by <strong>TRS</strong>.<br />
Also included in this component is Management’s Discussion<br />
and Analysis.<br />
Other Supplementary Schedules<br />
Other schedules include information on agency funds, changes<br />
in statutory reserve account balances, budgets for administrative<br />
and capital expenses, investing activity expenses, and<br />
payments to consultants.<br />
FINANCIAL ANALYSIS OF <strong>TRS</strong> FUNDS<br />
Pension and Other Employee<br />
Benefit Trust Funds<br />
Pension Trust Fund<br />
Net assets held in trust for benefits at August 31, <strong>2011</strong>, were<br />
$107.4 billion, an increase of $11.7 billion over the $95.7 billion<br />
at August 31, 2010.<br />
Deductions from <strong>TRS</strong> net assets held in trust for benefits are<br />
predominately retirement, death, and survivor benefits. During<br />
fiscal year <strong>2011</strong>, benefit payments totaled $7.2 billion, an<br />
increase of approximately $570.7 million, or 8.6%, from fiscal<br />
year 2010 benefit payments of $6.7 billion. Other deductions for<br />
fiscal year <strong>2011</strong> include $334.3 million in refunds, an increase of<br />
$69.1 million from fiscal year 2010, and administrative expenses<br />
of $35.8 million, an increase of $5.9 million over fiscal year<br />
2010. Administrative expenses excluding investing activities<br />
expense on a cost per member basis were $27.23 for fiscal year<br />
<strong>2011</strong> as compared to $23.06 in fiscal year 2010. During fiscal<br />
year <strong>2011</strong>, in accordance with Generally Accepted Accounting<br />
Principles (GAAP), a one-time expense adjustment or impairment<br />
for the remaining net book value of a 2001 technology project<br />
was made. Excluding this one-time adjustment, the cost per<br />
member would be $24.46.<br />
Additions to net assets in the form of member, state and reporting<br />
entity contributions for fiscal year <strong>2011</strong> were $2.2 billion, $1.9<br />
billion and $0.4 billion, respectively. Total contributions increased<br />
$77.7 million, or 1.7%, during fiscal year <strong>2011</strong>. A decrease in<br />
active membership offset with overall payroll growth which<br />
resulted in the slight increase in total contributions. The state<br />
contribution rate was 6.644% for fiscal year <strong>2011</strong> as provided<br />
by Section 17.13(c), Article IX of the General Appropriations<br />
Act. The member contribution rate remained at 6.4% for fiscal<br />
year <strong>2011</strong>.<br />
FINANCIAL SECTION<br />
17
TEACHER RETIREMENT SYSTEM OF TEXAS COMPREHENSIVE ANNUAL FINANCIAL REPORT <strong>2011</strong><br />
Net Assets – Pension Trust Fund<br />
(Dollars in Thousands)<br />
Fiscal Year Fiscal Year Dollar Percentage<br />
<strong>2011</strong> 2010 Change Change<br />
Assets<br />
Cash and Receivables $ 2,381,172 $ 1,483,683 $ 897,489 60.5%<br />
Investments 106,048,102 94,925,160 11,122,942 11.7<br />
Invested Securities Lending Collateral 22,760,168 23,601,465 (841,297) -3.6<br />
Capital Assets 29,045 30,998 (1,953) -6.3<br />
TOTAL ASSETS $ 131,218,487 $ 120,041,306 $ 11,177,181 9.3%<br />
Liabilities<br />
Benefits Payable $ 649,897 $ 578,168 $ 71,729 12.4%<br />
Investments Purchased Payable 235,904 119,435 116,469 97.5<br />
Accounts Payable and Other 132,675 73,609 59,066 80.2<br />
Collateral Obligations 22,779,224 23,581,689 (802,465) -3.4<br />
TOTAL LIABILITIES $ 23,797,700 $ 24,352,901 $ (555,201) -2.3%<br />
Net Assets $ 107,420,787 $ 95,688,405 $ 11,732,382 12.3%<br />
Changes in Net Assets – Pension Trust Fund<br />
(Dollars in Thousands)<br />
Management’s Discussion and Analysis<br />
Fiscal Year Fiscal Year Dollar Percentage<br />
<strong>2011</strong> 2010 Change Change<br />
Additions<br />
Member Contributions $ 2,243,955 $ 2,205,017 $ 38,938 1.8%<br />
State Contributions and Other 2,461,638 2,383,453 78,185 3.3<br />
Investment Income 14,636,935 9,411,447 5,225,488 55.5<br />
TOTAL ADDITIONS $ 19,342,528 $ 13,999,917 $ 5,342,611 38.2%<br />
Deductions<br />
Retirement Benefits $ 7,240,027 $ 6,669,305 $ 570,722 8.6%<br />
Refunds of Contributions 334,269 265,186 69,083 26.1<br />
Administrative Expenses 35,850 29,993 5,857 19.5<br />
TOTAL DEDUCTIONS $ 7,610,146 $ 6,964,484 $ 645,662 9.3%<br />
Change in Net Assets $ 11,732,382 $ 7,035,433 $ 4,696,949 66.8%<br />
On a GAAP basis, the overall financial condition of the fund<br />
improved during <strong>2011</strong> due to net investment income during<br />
the year of $14.6 billion – an increase of 55.5% over fiscal<br />
year 2010. This net gain is comprised of net appreciation<br />
in fair value of investments of $12.6 billion, $2.1 billion in<br />
interest and dividends, and net income of $79.5 million from<br />
securities lending reduced by investing activity expenses of<br />
$183.4 million. The net investment gain for fiscal year 2010<br />
was $9.4 billion.<br />
18 FINANCIAL SECTION
TEACHER RETIREMENT SYSTEM OF TEXAS COMPREHENSIVE ANNUAL FINANCIAL REPORT <strong>2011</strong><br />
Management’s Discussion and Analysis<br />
INVESTMENTS<br />
The following investment information is calculated per the<br />
Certified <strong>Financial</strong> Analyst (CFA) Institute guidelines. When<br />
comparing returns, it is important to remember that as a pension<br />
fund, the <strong>TRS</strong> investment performance has a very long<br />
horizon.<br />
Below are rate of return results for the total fund for the periods<br />
ending August 31, <strong>2011</strong>:<br />
• One-Year 15.5%<br />
• Three-Years 3.6%<br />
• Five-Years 4.0%<br />
• Ten-Years 5.8%<br />
The following table presents the actual investment allocations<br />
as of fiscal year end <strong>2011</strong> and 2010 as compared to the target<br />
allocations for <strong>2011</strong> and 2010.<br />
INVESTMENT ALLOCATIONS<br />
Fiscal Year <strong>2011</strong> Fiscal Year 2010<br />
Target Actual Target Actual<br />
Public Equity 50.0% 50.7% 52.0% 51.7%<br />
Private Equity 10.0 10.4 8.0 9.0<br />
TOTAL GLOBAL EQUITY 60.0% 61.1% 60.0% 60.7%<br />
Fixed Income 15.0% 14.1% 15.0% 15.3%<br />
Short-Term 1.0 1.3 1.0 1.0<br />
Hedge Funds 4.0 4.0 4.0 4.2<br />
TOTAL STABLE VALUE 20.0% 19.4% 20.0% 20.5%<br />
Global Inflation Linked Bonds 8.0% 5.3% 8.0% 8.6%<br />
Real Assets 8.0 9.7 2.0 6.0<br />
Commodities 2.0 3.1 8.0 2.2<br />
REITS (Real Estate<br />
Investment Trust) 2.0 1.4 2.0 2.0<br />
TOTAL REAL RETURN 20.0% 19.5% 20.0% 18.8%<br />
TOTAL 100.0% 100.0% 100.0% 100.0%<br />
These asset allocation investment categories and targets are<br />
determined by and subject to the system’s investment policy<br />
guidelines which are reviewed and adjusted by the board as<br />
necessary to aid the fund in achieving the long-term portfolio<br />
return of 8 percent.<br />
<strong>TRS</strong> had an annual rate of return of 15.5 percent for the fiscal<br />
year of <strong>2011</strong> on investments. At the end of fiscal year <strong>2011</strong><br />
the Pension Trust Fund’s investment value was approximately<br />
$11.8 billion more than at the end of fiscal year 2010. <strong>TRS</strong>’<br />
investment strategy is designed to address three different<br />
potential market scenarios and have an advantage in each of<br />
them by allocating 60 percent to global equities, 20 percent<br />
to real return, and 20 percent to stable value. This allocation<br />
provides for good performance in any of the three scenarios.<br />
<strong>TRS</strong> continues to enhance its asset management capabilities<br />
by adding a new strategic partner, an internal gold fund, a<br />
bubble monitor and building a Co-Investment Program for lower<br />
fees and increased transparency. Due to lower interest rates<br />
today and European sovereign debt concerns, the outlook is for<br />
muted returns over the next few years. For additional details<br />
on investments and their performance refer to the Investment<br />
Section. For a reconciliation of the CFA basis to the GAAP basis<br />
investment value refer to the Market Values table also in the<br />
Investment Section.<br />
FINANCIAL SECTION<br />
19
TEACHER RETIREMENT SYSTEM OF TEXAS COMPREHENSIVE ANNUAL FINANCIAL REPORT <strong>2011</strong><br />
Management’s Discussion and Analysis<br />
<strong>TRS</strong>-Care (Retired Plan)<br />
Net assets of the <strong>TRS</strong>-Care (Retired Plan) increased $76 million,<br />
from $814.9 million at the end of fiscal year 2010 to $890.9<br />
million at the end of fiscal year <strong>2011</strong>.<br />
Additions to net assets include health care premiums; active<br />
member, state and reporting entity contributions; investment<br />
earnings and federal revenue. Retiree premiums of $345.2<br />
million for fiscal year <strong>2011</strong> increased $12.7 million over fiscal<br />
year 2010. The total contributions of $625.4 million increased<br />
by 1.4% from the fiscal year 2010 total of $616.7 million due<br />
to overall payroll growth and an increase in plan participation.<br />
Federal revenue payments received in fiscal year <strong>2011</strong> from<br />
the federal government include Medicare Part D retiree drug<br />
subsidy payments totaling $66.3 million and $70.6 million for<br />
the Early Retiree Reinsurance Program (ERRP). This resulted in<br />
an increase in federal revenue of $66.1 million primarily due to<br />
receipt of the new ERRP funds (See Note 6 for more details).<br />
Investment income of $8.2 million decreased $3.5 million from<br />
fiscal year 2010 as a result of lower interest rates in fiscal<br />
year <strong>2011</strong>.<br />
Deductions from net assets include claims payments, claims<br />
processing costs, and administrative expenses. Claims<br />
payments and processing costs during fiscal year <strong>2011</strong> totaled<br />
$1.037 billion and increased $22.7 million or 2.2% over fiscal year<br />
2010 claims of $1.014 billion. The increase is due to the rising<br />
costs of health care and growth in plan participation. A fiscal<br />
year end decrease in the estimated amount for claims incurred<br />
but not reported resulted in an increase of $27.3 million in net<br />
assets. Administrative expenses increased by 3.7% from fiscal<br />
year 2010 primarily due to slight increases in personnel costs.<br />
Net Assets – <strong>TRS</strong>-Care (Retired Plan)<br />
(Dollars in Thousands)<br />
Fiscal Year Fiscal Year Dollar Percentage<br />
<strong>2011</strong> 2010 Change Change<br />
Assets<br />
Cash and Receivables $ 991,128 $ 945,970 $ 45,158 4.8%<br />
TOTAL ASSETS $ 991,128 $ 945,970 $ 45,158 4.8%<br />
Liabilities<br />
Accounts Payable and Other $ 1,323 $ 3,398 $ (2,075) -61.1%<br />
Health Care Claims Payable 98,935 127,608 (28,673) -22.5<br />
TOTAL LIABILITIES $ 100,258 $ 131,006 $ (30,748) -23.5%<br />
Total Net Assets $ 890,870 $ 814,964 $ 75,906 9.3%<br />
20 FINANCIAL SECTION
TEACHER RETIREMENT SYSTEM OF TEXAS COMPREHENSIVE ANNUAL FINANCIAL REPORT <strong>2011</strong><br />
Changes in Net Assets – <strong>TRS</strong>-Care (Retired Plan)<br />
(Dollars in Thousands)<br />
Management’s Discussion and Analysis<br />
Fiscal Year Fiscal Year Dollar Percentage<br />
<strong>2011</strong> 2010 Change Change<br />
Additions<br />
Member Contributions $ 183,809 $ 181,513 $ 2,296 1.3%<br />
State Contributions 256,997 253,626 3,371 1.3<br />
<strong>Report</strong>ing Entities and Other<br />
Contributions 184,617 181,644 2,973 1.6%<br />
Health Care Premiums 345,164 332,482 12,682 3.8<br />
Federal Revenue 136,888 70,796 66,092 93.4<br />
Investment Income 8,169 11,679 (3,510) -30.1<br />
TOTAL ADDITIONS $ 1,115,644 $ 1,031,740 $ 83,904 8.1%<br />
Deductions<br />
Health Care Claims $ 992,478 $ 971,357 $ 21,121 2.2%<br />
Health Care Claims Processing 44,116 42,535 1,581 3.7<br />
Administrative Expenses 3,144 3,032 112 3.7<br />
TOTAL DEDUCTIONS $ 1,039,738 $ 1,016,924 $ 22,814 2.2%<br />
Change in Net Assets $ 75,906 $ 14,816 $ 61,090 412.3%<br />
Enterprise Funds<br />
<strong>TRS</strong>-ActiveCare<br />
The <strong>TRS</strong>-ActiveCare program operates under the authority of<br />
the Texas Insurance Code, Title 8, Subtitle H, Chapter 1579 and<br />
the Texas Administrative Code, Title 34, Part 3, Chapter 41, and<br />
began operations in fiscal year 2003. Net assets of the plan<br />
were $188.1 million at the end of fiscal year <strong>2011</strong>, a decrease<br />
of $111.7 million, or 37.3%, from fiscal year 2010.<br />
Revenues for fiscal year <strong>2011</strong> included $1.5 billion from health<br />
care premiums, an increase of $220.4 million, or 16.6%, over<br />
fiscal year 2010. This increase is due to an increase in plan<br />
participation. Investment income for the year was $3.4 million<br />
which decreased $3.0 million or 47.3% from fiscal year 2010<br />
due to lower interest rates and reduced cash balances in fiscal<br />
year <strong>2011</strong>. Federal revenue reimbursements are related to the<br />
American Recovery and Reinvestment Act (ARRA). Federal and<br />
other revenues for <strong>2011</strong> totaled $871 thousand, a decrease of<br />
$544 thousand from fiscal year 2010. The decrease is primarily<br />
attributable to the ARRA program which is nearing an end.<br />
Health care claims for fiscal year <strong>2011</strong> were $1.5 billion, a<br />
$197.0 million, or 15%, increase over the $1.3 billion in fiscal<br />
year 2010. The increase is due to the rising costs of health care<br />
and pharmacy benefits and to growth in plan participation. Other<br />
expenses included claims processing costs of $77 million, $76.3<br />
million for HMO premium reimbursements, and $2.2 million<br />
for administrative expenses. An upward adjustment to claims<br />
incurred but not reported decreased plan net assets by $3.8<br />
million for fiscal year <strong>2011</strong>.<br />
FINANCIAL SECTION<br />
21
TEACHER RETIREMENT SYSTEM OF TEXAS COMPREHENSIVE ANNUAL FINANCIAL REPORT <strong>2011</strong><br />
Management’s Discussion and Analysis<br />
Net Assets – <strong>TRS</strong>-ActiveCare<br />
(Dollars in Thousands)<br />
Fiscal Year Fiscal Year Dollar Percentage<br />
<strong>2011</strong> 2010 Change Change<br />
Assets<br />
Cash and Receivables $ 365,374 $ 451,561 $ (86,187) -19.1%<br />
TOTAL ASSETS $ 365,374 $ 451,561 $ (86,187) -19.1%<br />
Liabilities<br />
Accounts Payable and Other $ 326 $ 342 $ (16) -4.7%<br />
Premiums Payable to HMO’s 6,238 5,309 929 17.5<br />
Health Care Claims Payable 170,741 146,100 24,641 16.9<br />
TOTAL LIABILITIES $ 177,305 $ 151,751 $ 25,554 16.8%<br />
Total Net Assets $ 188,069 $ 299,810 $ (111,741) -37.3%<br />
Statement of Revenues, Expenses, and Changes in Net Assets - <strong>TRS</strong>-ActiveCare<br />
(Dollars in Thousands)<br />
Fiscal Year Fiscal Year Dollar Percentage<br />
<strong>2011</strong> 2010 Change Change<br />
Revenues (Operating and<br />
Non-Operating)<br />
Health Care Premiums $ 1,549,531 $ 1,329,171 $ 220,360 16.6%<br />
Investment Income 3,387 6,421 (3,034) -47.3<br />
Federal Revenue and Other 871 1,415 (544) -38.4<br />
TOTAL REVENUE $ 1,553,789 $ 1,337,007 $ 216,782 16.2%<br />
Expenses<br />
Health Care Claims $ 1,510,091 $ 1,313,114 $ 196,977 15.0%<br />
Health Care Claims Processing 76,961 67,907 9,054 13.3<br />
Premium Payments to HMO’s 76,271 64,532 11,739 18.2<br />
Administrative Expenses 2,207 1,883 324 17.2<br />
TOTAL EXPENSES $ 1,665,530 $ 1,447,436 $ 218,094 15.1%<br />
Change in Net Assets $ (111,741) $ (110,429) $ (1,312) 1.2%<br />
22 FINANCIAL SECTION
TEACHER RETIREMENT SYSTEM OF TEXAS COMPREHENSIVE ANNUAL FINANCIAL REPORT <strong>2011</strong><br />
Management’s Discussion and Analysis<br />
403(b) Certification Program (Non-Major Fund)<br />
The 403(b) Certification Program began on September 1, 2001,<br />
and operates under the authority of Vernon’s Civil Statutes,<br />
Title 109, Article 6228a-5 and Sections 4-8A. Net assets<br />
were $122.0 thousand for fiscal year <strong>2011</strong> as compared to<br />
$245.8 thousand in fiscal year 2010. The fund’s total revenues<br />
of $24.7 thousand decreased $38.7 thousand from the fiscal<br />
year 2010 total of $63.4 thousand due to fewer companies<br />
seeking product registration for marketing. Deductions from<br />
the fund were administrative expenses of $148.4 thousand for<br />
fiscal year <strong>2011</strong> including personnel costs. This represents a<br />
decrease of $24.4 thousand from the fiscal year 2010 total of<br />
$172.8 thousand which is attributable to reduced program staff.<br />
REQUEST FOR INFORMATION<br />
This financial report is designed to provide a general overview<br />
of the Teacher Retirement System for those with an interest<br />
in the system’s finances.<br />
Questions concerning any of the information provided in this<br />
report or requests for additional information should be addressed<br />
to the Communications Department of the Teacher Retirement<br />
System, 1000 Red River Street, Austin, Texas 78701.<br />
FINANCIAL SECTION<br />
23
TEACHER RETIREMENT SYSTEM OF TEXAS COMPREHENSIVE ANNUAL FINANCIAL REPORT <strong>2011</strong><br />
Statement of Fiduciary Net Assets<br />
AUGUST 31, <strong>2011</strong><br />
(With Comparative Data for Pension and Other Employee Benefit Trust Funds for August 31, 2010)<br />
FIDUCIARY FUND<br />
TYPES<br />
PENSION AND OTHER<br />
EMPLOYEE BENEFIT TRUST FUNDS<br />
Pension<br />
Trust Fund<br />
<strong>TRS</strong>-Care<br />
(Retired Plan)<br />
E X H I B I T I<br />
ASSETS<br />
Cash<br />
Cash in State Treasury $ 891,767,954 $ 928,047,496<br />
Cash in Bank (Note 3A) 184,856,481<br />
Cash on Hand (Note 3B) 2,563,416<br />
TOTAL CASH $ 1,079,187,851 $ 928,047,496<br />
Receivables<br />
Sale of Investments $ 931,132,294 $<br />
Interest and Dividends 244,762,871 657,739<br />
Member and Retiree 80,060,214 39,998,328<br />
<strong>Report</strong>ing Entities 44,574,753 8,680,440<br />
Other 234,809 10,948,726<br />
Due from State’s General Fund 2,795,631<br />
Due from Employees Retirement System of Texas 1,219,459<br />
TOTAL RECEIVABLES $ 1,301,984,400 $ 63,080,864<br />
Investments (Notes 1F and 3E)<br />
Short-Term $ 12,213,781,658 $<br />
Short-Term Foreign Currency Contracts (44,158)<br />
Equities 41,913,520,425<br />
Fixed Income 20,442,247,585<br />
Alternative Investments 26,905,492,896<br />
Derivative Investments (93,266,114)<br />
Pooled Investments 4,666,369,268<br />
TOTAL INVESTMENTS $ 106,048,101,560 $ 0<br />
Invested Securities Lending Collateral $ 22,760,168,002 $ 0<br />
Capital Assets (Note 2)<br />
Intangible Assets $ 8,839,708 $<br />
Less Accumulated Amortization (7,908,543)<br />
Depreciable Assets 46,476,931<br />
Less Accumulated Depreciation (20,692,331)<br />
Non-Depreciable Assets 2,329,417<br />
TOTAL CAPITAL ASSETS $ 29,045,182 $ 0<br />
TOTAL ASSETS $ 131,218,486,995 $ 991,128,360<br />
24 FINANCIAL SECTION
TEACHER RETIREMENT SYSTEM OF TEXAS COMPREHENSIVE ANNUAL FINANCIAL REPORT <strong>2011</strong><br />
TOTAL - PENSION AND OTHER EMPLOYEE<br />
BENEFIT TRUST FUNDS<br />
<strong>2011</strong> 2010<br />
FIDUCIARY FUND<br />
TYPES<br />
Agency<br />
Funds<br />
$ 1,819,815,450 $ 1,735,044,840 $ 3,977<br />
184,856,481 84,868,536<br />
2,563,416 3,672,003<br />
$ 2,007,235,347 $ 1,823,585,379 $ 3,977<br />
$ 931,132,294 $ 147,800,560 $<br />
245,420,610 224,372,715<br />
120,058,542 121,996,630<br />
53,255,193 57,397,895<br />
11,183,535 11,656,975<br />
2,795,631 41,871,897<br />
1,219,459 971,294<br />
$ 1,365,065,264 $ 606,067,966 $ 0<br />
$ 12,213,781,658 $ 8,175,829,363 $<br />
(44,158) (467,338)<br />
41,913,520,425 42,805,497,400<br />
20,442,247,585 19,502,462,264<br />
26,905,492,896 21,070,904,758<br />
(93,266,114) (123,664,947)<br />
4,666,369,268 3,494,599,035<br />
$ 106,048,101,560 $ 94,925,160,535 $ 0<br />
$ 22,760,168,002 $ 23,601,464,926 $ 0<br />
$ 8,839,708 $ 12,853,867 $<br />
(7,908,543) (7,753,817)<br />
46,476,931 40,899,745<br />
(20,692,331) (18,622,169)<br />
2,329,417 3,620,047<br />
$ 29,045,182 $ 30,997,673 $ 0<br />
$ 132,209,615,355 $ 120,987,276,479 $ 3,977<br />
(to next page)<br />
FINANCIAL SECTION<br />
25
TEACHER RETIREMENT SYSTEM OF TEXAS COMPREHENSIVE ANNUAL FINANCIAL REPORT <strong>2011</strong><br />
(concluded)<br />
Statement of Fiduciary Net Assets<br />
AUGUST 31, <strong>2011</strong><br />
(With Comparative Data for Pension and Other Employee Benefit Trust Funds for August 31, 2010)<br />
E X H I B I T I<br />
FIDUCIARY FUND<br />
TYPES<br />
PENSION AND OTHER<br />
EMPLOYEE BENEFIT TRUST FUNDS<br />
Pension<br />
Trust Fund<br />
<strong>TRS</strong>-Care<br />
(Retired Plan)<br />
LIABILITIES (Note 1F)<br />
Accounts Payable $ 7,783,405 $ 977,410<br />
Payroll Payable 3,645,801 162,475<br />
External Manager Fees Payable 44,297,345<br />
Benefits Payable 649,896,558<br />
Health Care Claims Payable 98,934,646<br />
Investments Purchased Payable 235,903,809<br />
Collateral Obligations 22,779,223,912<br />
Due to State’s General Fund 45,577,164<br />
Due to Employees Retirement System of Texas 5,656,783<br />
Purchased Service Installment Receipts 19,563,023<br />
Compensable Absences Payable (Note 4) 4,618,755 183,523<br />
Deferred Rent 1,533,547<br />
Funds Held for Others<br />
TOTAL LIABILITIES $ 23,797,700,102 $ 100,258,054<br />
NET ASSETS HELD IN TRUST<br />
FOR PENSION/OTHER EMPLOYEE BENEFITS $ 107,420,786,893 $ 890,870,306<br />
The accompanying Notes to the <strong>Financial</strong> Statements are an integral part of this financial statement.<br />
26 FINANCIAL SECTION
TEACHER RETIREMENT SYSTEM OF TEXAS COMPREHENSIVE ANNUAL FINANCIAL REPORT <strong>2011</strong><br />
TOTAL - PENSION AND OTHER<br />
EMPLOYEE BENEFIT TRUST FUNDS<br />
<strong>2011</strong> 2010<br />
FIDUCIARY FUND<br />
TYPES<br />
Agency<br />
Funds<br />
$ 8,760,815 $ 4,927,492 $<br />
3,808,276 14,488,487<br />
44,297,345 4,082,409<br />
649,896,558 578,168,075<br />
98,934,646 127,607,686<br />
235,903,809 119,435,388<br />
22,779,223,912 23,581,689,266<br />
45,577,164 19,411,437<br />
5,656,783 5,126,112<br />
19,563,023 21,223,985<br />
4,802,278 5,538,937<br />
1,533,547 2,207,893<br />
3,977<br />
$ 23,897,958,156 $ 24,483,907,167 $ 3,977<br />
$ 108,311,657,199 $ 96,503,369,312 $ 0<br />
FINANCIAL SECTION<br />
27
TEACHER RETIREMENT SYSTEM OF TEXAS COMPREHENSIVE ANNUAL FINANCIAL REPORT <strong>2011</strong><br />
Statement of Changes in Fiduciary Net Assets<br />
FOR THE FISCAL YEAR ENDED AUGUST 31, <strong>2011</strong> (With Comparative Data for August 31, 2010)<br />
PENSION AND OTHER<br />
EMPLOYEE BENEFIT TRUST FUNDS<br />
Pension<br />
Trust Fund<br />
<strong>TRS</strong>-Care<br />
(Retired Plan)<br />
E X H I B I T I I<br />
ADDITIONS<br />
Contributions<br />
Contributions Paid by Member $ 2,243,954,725 $ 183,808,580<br />
Employer (Notes 10 and 12):<br />
Contributions from State’s General Fund 1,595,771,774 256,997,446<br />
Contributions from Federal/Private Funding Sources 324,764,720 25,784,985<br />
Legislative Revenue from State’s General Fund Paid on<br />
Behalf of <strong>TRS</strong> for Employee Fringe Benefits (Note 6) 108,440<br />
<strong>Report</strong>ing Entities 411,889,817 155,471,641<br />
Purchase of Service Credit - Refundable 45,158,612<br />
Purchase of Service Credit - Non-Refundable 60,018,492<br />
Contributions from Employee’s Retirement System of Texas:<br />
For Service Contributions 12,628,712<br />
For 415 Excess Benefit Arrangement 45,053<br />
Contributions from the State for 415 Excess Benefit Arrangement 1,705,535<br />
Employment after Retirement Surcharge paid by<br />
<strong>Report</strong>ing Entities:<br />
Employee 3,983,605<br />
Employer 4,095,094 3,252,369<br />
Health Care Premiums 345,164,271<br />
Federal Revenue (Note 6) 136,887,805<br />
TOTAL CONTRIBUTIONS AND PREMIUMS $ 4,704,016,139 $ 1,107,475,537<br />
Investment Income<br />
From Investing Activities:<br />
Net Appreciation in Fair Value of Investments $ 12,616,681,465 $<br />
Interest 1,003,311,852 8,168,640<br />
Dividends 1,120,858,771<br />
Total Investing Activities Income $ 14,740,852,088 $ 8,168,640<br />
Less: Investing Activity Expenses (Schedule 3) (183,369,775)<br />
Net Income From Investing Activities $ 14,557,482,313 $ 8,168,640<br />
From Securities Lending Activities:<br />
Securities Lending Income $ 135,755,199 $<br />
Securities Lending Expenses:<br />
Borrower Rebates (36,111,713)<br />
Management Fees (20,190,571)<br />
Net Income from Securities Lending Activities $ 79,452,915 $ 0<br />
TOTAL NET INVESTMENT INCOME $ 14,636,935,228 $ 8,168,640<br />
Other Additions<br />
Legislative Appropriations $ $<br />
Miscellaneous Revenues 1,576,613<br />
TOTAL OTHER ADDITIONS $ 1,576,613 $ 0<br />
TOTAL ADDITIONS $ 19,342,527,980 $ 1,115,644,177<br />
28 FINANCIAL SECTION
TEACHER RETIREMENT SYSTEM OF TEXAS COMPREHENSIVE ANNUAL FINANCIAL REPORT <strong>2011</strong><br />
TOTAL - PENSION AND OTHER EMPLOYEE<br />
BENEFIT TRUST FUNDS<br />
<strong>2011</strong> 2010<br />
$ 2,427,763,305 $ 2,386,530,281<br />
1,852,769,220 1,828,247,655<br />
350,549,705 332,407,488<br />
108,440 262,486<br />
567,361,458 559,521,632<br />
45,158,612 37,442,030<br />
60,018,492 47,077,732<br />
12,628,712 11,167,772<br />
45,053 43,562<br />
1,705,535 1,460,948<br />
3,983,605 2,989,345<br />
7,347,463 5,675,767<br />
345,164,271 332,481,933<br />
136,887,805 70,795,686<br />
$ 5,811,491,676 $ 5,616,104,317<br />
$ 12,616,681,465 $ 7,542,738,000<br />
1,011,480,492 924,165,767<br />
1,120,858,771 958,159,970<br />
$ 14,749,020,728 $ 9,425,063,737<br />
(183,369,775) (111,918,654)<br />
$ 14,565,650,953 $ 9,313,145,083<br />
$ 135,755,199 $ 164,683,341<br />
(36,111,713) (40,036,033)<br />
(20,190,571) (16,331,481)<br />
$ 79,452,915 $ 108,315,827<br />
$ 14,645,103,868 $ 9,421,460,910<br />
$ $ 2,805,955<br />
1,576,613 2,453,980<br />
$ 1,576,613 $ 5,259,935<br />
$ 20,458,172,157 $ 15,042,825,162<br />
(to next page)<br />
FINANCIAL SECTION<br />
29
TEACHER RETIREMENT SYSTEM OF TEXAS COMPREHENSIVE ANNUAL FINANCIAL REPORT <strong>2011</strong><br />
Statement of Changes in Fiduciary Net Assets<br />
FOR THE FISCAL YEAR ENDED AUGUST 31, <strong>2011</strong> (With Comparative Data for August 31, 2010)<br />
(concluded)<br />
E X H I B I T I I<br />
PENSION AND OTHER<br />
EMPLOYEE BENEFIT TRUST FUNDS<br />
Pension<br />
Trust Fund<br />
<strong>TRS</strong>-Care<br />
(Retired Plan)<br />
DEDUCTIONS<br />
Benefits $ 7,173,504,788 $<br />
415 Excess Benefit Arrangement 1,547,229<br />
Benefits Paid to Employee’s Retirement System of Texas:<br />
For Service Contributions 64,772,079<br />
For 415 Excess Benefit Arrangement 203,359<br />
Refunds of Contributions - Active 330,284,482<br />
Refunds of Contributions - Death 3,984,340<br />
Health Care Claims 992,478,380<br />
Health Care Claims Processing 44,007,586<br />
Premium Payments to HMO’s 108,286<br />
Administrative Expenses, Excluding<br />
Investing Activity Expenses:<br />
Salaries and Wages 17,207,826 1,679,019<br />
Payroll Related Costs 4,705,791 402,013<br />
Professional Fees and Services 488,028 799,324<br />
Travel 148,784 4,486<br />
Materials and Supplies 4,824,890 118,957<br />
Communications and Utilities 474,586 1,466<br />
Repairs and Maintenance 794,811<br />
Rentals and Leases 252,570 116,564<br />
Printing and Reproduction 291,769 14,276<br />
Depreciation 1,128,178<br />
Amortization 154,726<br />
Loss on Impairment of Capital Asset 4,477,619<br />
Other Expenses 900,241 7,817<br />
TOTAL DEDUCTIONS $ 7,610,146,096 $ 1,039,738,174<br />
Change in Net Assets $ 11,732,381,884 $ 75,906,003<br />
NET ASSETS HELD IN TRUST FOR PENSION/OTHER<br />
EMPLOYEE BENEFITS - BEGINNING OF YEAR $ 95,688,405,009 $ 814,964,303<br />
NET ASSETS HELD IN TRUST FOR PENSION/OTHER<br />
EMPLOYEE BENEFITS - END OF YEAR $ 107,420,786,893 $ 890,870,306<br />
The accompanying Notes to the <strong>Financial</strong> Statements are an integral part of this financial statement.<br />
30 FINANCIAL SECTION
TEACHER RETIREMENT SYSTEM OF TEXAS COMPREHENSIVE ANNUAL FINANCIAL REPORT <strong>2011</strong><br />
TOTAL - PENSION AND OTHER<br />
EMPLOYEE BENEFIT TRUST FUNDS<br />
<strong>2011</strong> 2010<br />
$ 7,173,504,788 $ 6,617,397,376<br />
1,547,229 1,301,151<br />
64,772,079 61,570,749<br />
203,359 203,359<br />
330,284,482 261,475,649<br />
3,984,340 3,710,940<br />
992,478,380 971,356,805<br />
44,007,586 42,435,939<br />
108,286 99,662<br />
18,886,845 17,680,495<br />
5,107,804 4,896,860<br />
1,287,352 2,238,578<br />
153,270 23,974<br />
4,943,847 2,277,466<br />
476,052 845,934<br />
794,811 2,081,982<br />
369,134 419,804<br />
306,045 518,411<br />
1,128,178 659,943<br />
154,726 824,572<br />
4,477,619<br />
908,058 556,275<br />
$ 8,649,884,270 $ 7,992,575,924<br />
$ 11,808,287,887 $ 7,050,249,238<br />
$ 96,503,369,312 $ 89,453,120,074<br />
$ 108,311,657,199 $ 96,503,369,312<br />
FINANCIAL SECTION<br />
31
TEACHER RETIREMENT SYSTEM OF TEXAS COMPREHENSIVE ANNUAL FINANCIAL REPORT <strong>2011</strong><br />
Statement of Net Assets<br />
PROPRIETARY FUNDS<br />
AUGUST 31, <strong>2011</strong> (With Comparative Data for August 31, 2010)<br />
E X H I B I T I I I<br />
Major Fund<br />
<strong>TRS</strong>-ActiveCare<br />
Enterprise Funds<br />
Non-Major Fund<br />
403(b)<br />
Certification<br />
Program<br />
ASSETS<br />
Current Assets<br />
Cash<br />
Cash in State Treasury $ 259,110,267 $ 146,859<br />
TOTAL CASH $ 259,110,267 $ 146,859<br />
Accounts Receivable<br />
Interest $ 224,584 $ 99<br />
Health Care Premiums 105,994,766<br />
ARRA Cobra Premiums 44,519<br />
TOTAL ACCOUNTS RECEIVABLE $ 106,263,869 $ 99<br />
TOTAL ASSETS $ 365,374,136 $ 146,958<br />
LIABILITIES (Note 1F)<br />
Current Liabilities<br />
Accounts Payable $ 84,790 $<br />
Payroll Payable 113,364 11,737<br />
Premiums Payable to HMOs 6,238,055<br />
Health Care Claims Payable 170,741,328<br />
Compensable Absences Payable (Note 4) 80,504 8,501<br />
TOTAL CURRENT LIABILITIES $ 177,258,041 $ 20,238<br />
Non-Current Liabilities<br />
Compensable Absences Payable (Note 4) $ 46,668 $ 4,688<br />
TOTAL NON-CURRENT LIABILITIES $ 46,668 $ 4,688<br />
TOTAL LIABILITIES $ 177,304,709 $ 24,926<br />
NET ASSETS<br />
Restricted for Health Care Programs $ 188,069,427 $<br />
Restricted for 403(b) Program Administration 122,032<br />
TOTAL NET ASSETS $ 188,069,427 $ 122,032<br />
The accompanying Notes to the <strong>Financial</strong> Statements are an integral part of this financial statement.<br />
32 FINANCIAL SECTION
TEACHER RETIREMENT SYSTEM OF TEXAS COMPREHENSIVE ANNUAL FINANCIAL REPORT <strong>2011</strong><br />
Total Enterprise Funds<br />
<strong>2011</strong> 2010<br />
$ 259,257,126 $ 387,561,788<br />
$ 259,257,126 $ 387,561,788<br />
$ 224,683 $ 419,236<br />
105,994,766 63,350,046<br />
44,519 446,080<br />
$ 106,263,968 $ 64,215,362<br />
$ 365,521,094 $ 451,777,150<br />
$ 84,790 $ 63,636<br />
125,101 115,771<br />
6,238,055 5,308,671<br />
170,741,328 146,100,209<br />
89,005 85,369<br />
$ 177,278,279 $ 151,673,656<br />
$ 51,356 $ 47,590<br />
$ 51,356 $ 47,590<br />
$ 177,329,635 $ 151,721,246<br />
$ 188,069,427 $ 299,810,127<br />
122,032 245,777<br />
$ 188,191,459 $ 300,055,904<br />
FINANCIAL SECTION<br />
33
TEACHER RETIREMENT SYSTEM OF TEXAS COMPREHENSIVE ANNUAL FINANCIAL REPORT <strong>2011</strong><br />
Statement of Revenues, Expenses and<br />
Changes in Fund Net Assets<br />
PROPRIETARY FUNDS<br />
FOR THE FISCAL YEAR ENDED AUGUST 31, <strong>2011</strong> (With Comparative Data for August 31, 2010)<br />
Enterprise Funds<br />
Major Fund<br />
Non-Major Fund<br />
E X H I B I T I V<br />
<strong>TRS</strong>-ActiveCare<br />
403(b)<br />
Certification<br />
Program<br />
OPERATING REVENUES<br />
Health Care Premiums $ 1,549,530,891 $<br />
Administrative Fees 135,917<br />
Certification Fees 12,000<br />
Product Registration Fees 3,000<br />
TOTAL OPERATING REVENUES $ 1,549,666,808 $ 15,000<br />
OPERATING EXPENSES<br />
Health Care Claims $ 1,510,090,981 $<br />
Health Care Claims Processing 76,960,951<br />
Premium Payments to HMOs 76,270,706<br />
Administrative Expenses<br />
Salaries and Wages 1,144,484 115,014<br />
Payroll Related Cost 257,632 33,430<br />
Professional Fees and Services 726,115<br />
Materials and Supplies 4,390<br />
Communication and Utilities 883<br />
Travel 2,221<br />
Rental and Leases 65,140<br />
Printing and Reproduction 885<br />
Other Operating Expenses 5,301<br />
TOTAL OPERATING EXPENSES $ 1,665,529,689 $ 148,444<br />
OPERATING (LOSS) $ (115,862,881) $ (133,444)<br />
NON-OPERATING REVENUES<br />
Investment Income $ 3,387,062 $ 1,801<br />
Federal Revenue - ARRA Cobra Reimbursements 667,746<br />
On Behalf Fringe Benefits Paid by<br />
the State (Note 6) 67,373 7,898<br />
TOTAL NON-OPERATING REVENUES $ 4,122,181 $ 9,699<br />
Change in Net Assets $ (111,740,700) $ (123,745)<br />
TOTAL NET ASSETS - BEGINNING $ 299,810,127 $ 245,777<br />
TOTAL NET ASSETS - ENDING $ 188,069,427 $ 122,032<br />
The accompanying Notes to the <strong>Financial</strong> Statements are an integral part of this financial statement.<br />
34 FINANCIAL SECTION
TEACHER RETIREMENT SYSTEM OF TEXAS COMPREHENSIVE ANNUAL FINANCIAL REPORT <strong>2011</strong><br />
Total Enterprise Funds<br />
<strong>2011</strong> 2010<br />
$ 1,549,530,891 $ 1,329,171,411<br />
135,917 125,321<br />
12,000 30,000<br />
3,000 21,000<br />
$ 1,549,681,808 $ 1,329,347,732<br />
$ 1,510,090,981 $ 1,313,114,197<br />
76,960,951 67,906,654<br />
76,270,706 64,532,253<br />
1,259,498 1,217,962<br />
291,062 275,858<br />
726,115 478,581<br />
4,390 9,121<br />
883 1,021<br />
2,221 3,358<br />
65,140 65,745<br />
885 209<br />
5,301 4,128<br />
$ 1,665,678,133 $ 1,447,609,087<br />
$ (115,996,325) $ (118,261,355)<br />
$ 3,388,863 $ 6,425,587<br />
667,746 1,225,158<br />
75,271 72,362<br />
$ 4,131,880 $ 7,723,107<br />
$ (111,864,445) $ (110,538,248)<br />
$ 300,055,904 $ 410,594,152<br />
$ 188,191,459 $ 300,055,904<br />
FINANCIAL SECTION<br />
35
TEACHER RETIREMENT SYSTEM OF TEXAS COMPREHENSIVE ANNUAL FINANCIAL REPORT <strong>2011</strong><br />
Statement of Cash Flows<br />
PROPRIETARY FUNDS<br />
FOR THE FISCAL YEAR ENDED AUGUST 31, <strong>2011</strong> (With Comparative Data for August 31, 2010)<br />
Enterprise Funds<br />
Major Fund<br />
<strong>TRS</strong>-ActiveCare<br />
Non-Major Fund<br />
403(b)<br />
Certification<br />
Program<br />
E X H I B I T V<br />
CASH FLOWS FROM OPERATING ACTIVITIES<br />
Receipts from Health Care Premiums $ 1,506,886,171 $<br />
Receipts from Long-Term Care Administrative Fees 135,917<br />
Receipts from Certification/Product Registration Fees 15,000<br />
Payments for Administrative Expenses (2,164,504) (153,105)<br />
Payments for Health Care Claims (1,485,449,862)<br />
Payments for Health Care Claims Processing (76,960,951)<br />
Payments for HMO Premiums (75,341,322)<br />
NET CASH (USED) BY<br />
OPERATING ACTIVITIES $ (132,894,551) $ (138,105)<br />
CASH FLOWS FROM NON-CAPITAL<br />
FINANCING ACTIVITIES<br />
Proceeds from Federal Revenue $ 1,069,307 $<br />
Proceeds from on Behalf Fringe Benefits Paid<br />
by the State 67,373 7,898<br />
NET CASH PROVIDED BY<br />
NON-CAPITAL FINANCING ACTIVITIES $ 1,136,680 $ 7,898<br />
CASH FLOWS FROM INVESTING ACTIVITIES<br />
Interest Received $ 3,581,445 $ 1,971<br />
NET CASH PROVIDED BY<br />
INVESTING ACTIVITIES $ 3,581,445 $ 1,971<br />
Net (Decrease) in Cash $ (128,176,426) $ (128,236)<br />
CASH AND CASH EQUIVALENTS - SEPTEMBER 1 $ 387,286,693 $ 275,095<br />
CASH AND CASH EQUIVALENTS - AUGUST 31 $ 259,110,267 $ 146,859<br />
RECONCILIATION OF OPERATING (LOSS) TO<br />
NET CASH (USED) BY OPERATING ACTIVITIES<br />
Operating (Loss) $ (115,862,881) $ (133,444)<br />
Adjustments to Reconcile Operating (Loss) to<br />
Net Cash (Used) by Operating Activities:<br />
Changes in Assets and Liabilities:<br />
(Increase) in Health Care Premiums Receivable $ (42,644,720) $<br />
Increase (Decrease) in Premiums Payable to HMOs 929,384<br />
Increase in Health Care Claims Payable 24,641,119<br />
Increase (Decrease) in Accounts Payable 21,154<br />
Increase (Decrease) in Payroll Payable 9,955 (625)<br />
Increase (Decrease) in Compensable Absences<br />
Payable 11,438 (4,036)<br />
Total Adjustments $ (17,031,670) $ (4,661)<br />
Net Cash (Used) by Operating Activities $ (132,894,551) $ (138,105)<br />
The accompanying Notes to the <strong>Financial</strong> Statements are an integral part of this financial statement.<br />
36 FINANCIAL SECTION
TEACHER RETIREMENT SYSTEM OF TEXAS COMPREHENSIVE ANNUAL FINANCIAL REPORT <strong>2011</strong><br />
Total Enterprise Funds<br />
<strong>2011</strong> 2010<br />
$ 1,506,886,171 $ 1,322,251,502<br />
135,917 125,321<br />
15,000 51,000<br />
(2,317,609) (2,075,599)<br />
(1,485,449,862) (1,295,363,008)<br />
(76,960,951) (67,812,825)<br />
(75,341,322) (64,559,935)<br />
$ (133,032,656) $ (107,383,544)<br />
$ 1,069,307 $ 949,297<br />
75,271 72,362<br />
$ 1,144,578 $ 1,021,659<br />
$ 3,583,416 $ 6,795,240<br />
$ 3,583,416 $ 6,795,240<br />
$ (128,304,662) $ (99,566,645)<br />
$ 387,561,788 $ 487,128,433<br />
$ 259,257,126 $ 387,561,788<br />
$ (115,996,325) $ (118,261,355)<br />
$ (42,644,720) $ (6,765,305)<br />
929,384 (27,682)<br />
24,641,119 17,845,019<br />
21,154 (196,612)<br />
9,330 3,309<br />
7,402 19,082<br />
$ (17,036,331) $ 10,877,811<br />
$ (133,032,656) $ (107,383,544)<br />
FINANCIAL SECTION<br />
37
TEACHER RETIREMENT SYSTEM OF TEXAS COMPREHENSIVE ANNUAL FINANCIAL REPORT <strong>2011</strong><br />
This page is intentionally left blank.<br />
38 FINANCIAL SECTION
TEACHER RETIREMENT SYSTEM OF TEXAS COMPREHENSIVE ANNUAL FINANCIAL REPORT <strong>2011</strong><br />
Notes to the <strong>Financial</strong> Statements<br />
NOTE 1 - Summary of Significant Accounting Policies....................................................40<br />
NOTE 2 - Capital Assets.................................................................................................43<br />
NOTE 3 - Deposits and Investments...............................................................................44<br />
NOTE 4 - Employee Compensable Leave........................................................................56<br />
NOTE 5 - Operating Leases............................................................................................56<br />
NOTE 6 - Fringe Benefits Paid by the State of Texas and the Federal Government..........56<br />
NOTE 7 - Deferred Compensation..................................................................................57<br />
NOTE 8 - Contingent Liabilities.......................................................................................57<br />
NOTE 9 - Continuance Subject to Review......................................................................57<br />
NOTE 10 - Post-employment Health Care Benefits...........................................................57<br />
NOTE 11 - Risk Management...........................................................................................60<br />
NOTE 12 - Pension Disclosure..........................................................................................60<br />
NOTE 13 - Subsequent Events.........................................................................................63<br />
FINANCIAL SECTION<br />
39
TEACHER RETIREMENT SYSTEM OF TEXAS COMPREHENSIVE ANNUAL FINANCIAL REPORT <strong>2011</strong><br />
Notes to the <strong>Financial</strong> Statements<br />
NOTE 1: SUMMARY OF SIGNIFICANT ACCOUNTING POLICIES<br />
A. REPORTING ENTITY<br />
The Teacher Retirement System of Texas (<strong>TRS</strong> or system) is governed by a nine member board of trustees which has significant<br />
independence in the operations and management of the system. The state legislature confirms trustees appointed by the governor,<br />
establishes laws with regard to structure, benefits and contributions, and authorizes Pension Trust Fund administrative expenses. State<br />
contributions and appropriations received by <strong>TRS</strong> are determined by the legislature. <strong>TRS</strong> is a separate legal entity and considered a<br />
discrete component unit of the State of Texas.<br />
This report includes all activities and programs for which <strong>TRS</strong> exercises fiscal control and responsibility and includes all funds that<br />
comprise the system’s legal entity.<br />
<strong>TRS</strong> administers retirement and related benefits to employees and beneficiaries of employees of the public, state-supported,<br />
educational institutions of Texas. It operates primarily under the provisions of Texas Constitution, Article XVI, Section 67 and Texas<br />
Government Code, Title 8, Subtitle C. The pension trust fund is a defined benefit retirement plan that is a qualified pension trust under<br />
Section 401(a) of the Internal Revenue Code.<br />
The system administers the Texas Public School Retired Employees Group Insurance Program and the Texas Active School Employees<br />
Uniform Group Benefits Program. These programs provide two separate health care plans, <strong>TRS</strong>-Care (Retired Plan) and <strong>TRS</strong>-ActiveCare<br />
(Active Plan), respectively.<br />
<strong>TRS</strong>-Care is considered an employee benefit trust fund and provides health care coverage for certain persons (and their dependents)<br />
who retire under <strong>TRS</strong>. The statutory authority for the program is Texas Insurance Code, Chapter 1575 and Texas Administrative Code,<br />
Title 34, Part 3, Chapter 41. The inception of the plan was fiscal year 1986.<br />
<strong>TRS</strong>-ActiveCare provides health care coverage to employees (and their dependents) of participating public education entities. Optional<br />
life and long-term care insurance which are provided to active members and retirees are also accounted for in the fund. Authority<br />
for the plan can be found in the Texas Insurance Code, Title 8, Subtitle H, Chapter 1579 and in the Texas Administrative Code, Title 34,<br />
Part 3, Chapter 41. The plan began operations on September 1, 2002.<br />
The system also administers a 403(b) Certification Program in which companies must be certified by <strong>TRS</strong> to offer to public education<br />
employees a qualified investment product under IRS Code 403(b) through payroll deduction. Authority for the program can be found<br />
in Vernon’s Civil Statutes, Title 109, Article 6228a-5, Sections 4-8A and in the Texas Administrative Code, Title 34, Part 3, Chapter 53.<br />
The program began operations on September 1, 2001.<br />
Agency funds are used to account for the purchase of savings bonds by participating <strong>TRS</strong> employees and also garnishments of<br />
salaries and wages for child support payments from <strong>TRS</strong> employees.<br />
B. MEASUREMENT FOCUS, BASIS OF ACCOUNTING, AND BASIS OF PRESENTATION<br />
The accounts of <strong>TRS</strong> are organized on the basis of funds, each of which is considered a separate accounting entity. The operations<br />
of each fund are accounted for with a complete set of self-balancing accounts that comprise its assets, liabilities, additions/revenues<br />
and deductions/expenses. The following fund types are used to reflect the system’s transactions:<br />
• Fiduciary Funds – include the Pension Trust Fund, <strong>TRS</strong>-Care (Retired Plan or the employee benefit trust fund) and Agency Funds.<br />
• Proprietary Funds – include <strong>TRS</strong>-ActiveCare and the 403(b) Certification Program which is not considered a major fund. Both<br />
are Enterprise Funds.<br />
Fiduciary funds are used to report assets held in a trustee or agency capacity on behalf of others. The reporting focus is on net assets and<br />
changes in net assets. The pension and other employee benefit trust funds are used to report resources held in trust for the members<br />
and beneficiaries of the defined benefit pension plan and the other employee benefit plan. Agency funds are used to report resources<br />
held in a purely custodial capacity by the reporting government.<br />
The proprietary, enterprise funds account for business-type activities. The reporting focus is on the determination of operating<br />
income, changes in net assets, financial position, and cash flows.<br />
Separate financial statements are provided for each fund. The fiduciary (excluding agency funds) and proprietary financial statements<br />
are reported using the economic resources measurement focus and the accrual basis of accounting. Additions are recognized<br />
when earned, and deductions are recognized when the liability is incurred, regardless of the timing of related cash flows. Contributions<br />
are recognized in the period in which amounts are due, pursuant to state law. Benefits and refunds of contributions are recognized<br />
when due and payable in accordance with the terms of the plan. All economic resources, including financial and capital assets, and<br />
related liabilities, both current and long-term, and the changes therein are reported in the funds’ financial statements. Capital assets are<br />
depreciated or amortized if appropriate.<br />
Agency funds are custodial in nature and do not measure the results of operations. Assets and liabilities are recorded using the<br />
accrual basis of accounting. Agency funds are used to report assets collected and transferred to the state or other entities.<br />
Private-sector standards of accounting and financial reporting issued prior to December 1, 1989, generally are followed in the<br />
proprietary funds’ financial statements to the extent that those standards do not conflict with or contradict guidance of the Governmen-<br />
40 FINANCIAL SECTION
TEACHER RETIREMENT SYSTEM OF TEXAS COMPREHENSIVE ANNUAL FINANCIAL REPORT <strong>2011</strong><br />
Notes to the <strong>Financial</strong> Statements<br />
tal Accounting Standards Board (GASB). Governments also have the option of following subsequent private-sector guidance for their<br />
enterprise funds, subject to the same limitation. <strong>TRS</strong> has elected not to follow subsequent private-sector guidance.<br />
C. NEW ACCOUNTING PRONOUNCEMENTS<br />
GASB Statement No. 59, <strong>Financial</strong> Instruments Omnibus was issued in June 2010, and is effective for periods beginning after June<br />
15, 2010. The objective of this Statement is to update and improve existing standards regarding financial reporting and disclosure<br />
requirements of certain financial instruments and external investment pools for which significant issues have been identified in practice.<br />
The requirements of this statement were implemented by <strong>TRS</strong> during fiscal year <strong>2011</strong>.<br />
D. COMPARATIVE DATA IN TOTAL<br />
The basic financial statements include certain prior-year summarized comparative data in total but not at the level of detail required<br />
for a presentation in conformity with generally accepted accounting principles. Accordingly, such information should be read in conjunction<br />
with the system’s financial statements for the fiscal year ended August 31, 2010, from which the summarized information was<br />
derived. Certain items from the prior year’s financial statements have been reclassified to conform to the presentation in the current<br />
year’s financial statements. These reclassifications had no effect on previously reported net assets.<br />
E. BUDGETS AND APPROPRIATIONS<br />
The administrative costs and capital outlay for each of the system’s funds and programs are controlled by annual budgets approved<br />
by the board of trustees.<br />
The Pension Trust Fund receives state contributions for retirement benefits from general revenue appropriations. In fiscal years<br />
<strong>2011</strong> and 2010, contributions were made to the retirement system at the rate of 6.644% of the aggregate compensation paid to active<br />
retirement system members for each year. Although appropriated by the legislature, administrative expenses and capital outlay for the<br />
Pension Trust Fund are paid from the fund’s Expense Account, and not from the state’s General Fund. However, for each fiscal year of<br />
the 2010-<strong>2011</strong> biennium, the 81st Legislature, Regular Session appropriated $3.7 million of general revenue to fund exempt salary positions.<br />
In response to the letter from the Governor, Lieutenant Governor and Speaker of the House dated January 15, 2010, requesting a<br />
reduction in General Revenue and General Revenue-Dedicated spending by five percent, <strong>TRS</strong> returned all of the appropriations as a part<br />
of this statewide cost saving effort.<br />
<strong>TRS</strong>-Care (Retired Plan) receives appropriations from the state’s General Fund equal to 1.0% of the salaries of public education<br />
employees. Administrative expenses for this program are paid from the trust fund.<br />
The two Enterprise Funds, <strong>TRS</strong>-ActiveCare and the 403(b) Certification Program, are supported by fees and receive no appropriations<br />
from the state for administrative expenses.<br />
Effective September 1, 1997, legislation authorized <strong>TRS</strong> to administer a governmental excess benefit arrangement under section<br />
415(m) of the Internal Revenue Code of 1986 (26 U.S.C. section 415(m)). This legislation created a separate, non-qualified, unfunded<br />
excess benefit arrangement outside the trust fund of the retirement system. Contributions to this arrangement are made from the state’s<br />
general revenue appropriations. These contributions are not held in trust and may not be commingled with other funds of the retirement<br />
system. They yield no net assets; therefore, for reporting purposes only the contributions and benefits are reflected on Exhibit II, Statement<br />
of Changes in Fiduciary Net Assets.<br />
F. ASSETS, LIABILITIES AND LEGAL RESERVES<br />
Investments<br />
Short-term investments are those maturing within one year of purchase date. Included in short-term investments are foreign currency<br />
contracts. At the time the system is notified that an international trade has been consummated, the system trader will buy or<br />
sell a foreign currency exchange contract in the currency native to the security transaction for settlement date. These foreign exchange<br />
contracts are reported at the spot rate and the net difference between the value of the foreign currency and the U.S. dollar is reported<br />
in the net appreciation (depreciation) in fair value of investments. Risks associated with such contracts include movement in the value<br />
of the foreign currency related to the U.S. dollar and the ability of the counterparty to perform. Transactions involving foreign currency<br />
are accounted for in accordance with FASB Accounting Standards Codification (ASC) 946-830; the subtopic “Foreign Currency Matters”<br />
of the topic “<strong>Financial</strong> Services – Investment Companies”.<br />
Investments are reported at fair value. The framework for measuring fair value is based on a hierarchy that gives the highest priority<br />
to the use of observable inputs in an active market and the lowest priority to the use of unobservable inputs. Management’s estimated<br />
market values for investments without readily ascertainable market values could differ significantly if a ready market for these assets<br />
existed. Because of the inherent uncertainties in estimating fair value, it is at least reasonably possible that the estimates will change<br />
in the near-term.<br />
Global foreign exchange holdings are translated using the London 4 O’clock Closing Spot Rate from a third party vendor.<br />
The fair value of equity investments is measured based on the primary exchange last sale price or the official close price from the<br />
FINANCIAL SECTION<br />
41
TEACHER RETIREMENT SYSTEM OF TEXAS COMPREHENSIVE ANNUAL FINANCIAL REPORT <strong>2011</strong><br />
Notes to the <strong>Financial</strong> Statements<br />
pricing vendor for all exchange listed equities. For delisted securities, the last available close price is utilized. The fair value of local<br />
access products, including equity-linked certificates and participation notes which replicate the performance of an underlying security,<br />
index, or market for which investment in the local market or in the American Depository Receipt (ADR) or Global Depository Receipt<br />
(GDR), or the total return swap market would be difficult or costly, or both, is estimated using a proprietary pricing service.<br />
The fair value of fixed income investments is measured based on exchange quotes or vendor sourced evaluated bid prices. Where<br />
constituent data is available, the system will also use a benchmark source. Mortgage backed securities are priced on a pool specific<br />
basis or, if not available, using the income method which considers the prepayment speed.<br />
The system has ownership interests in the form of Limited Partnerships (LP). These LPs include equity securities of companies<br />
that have not “gone public” (i.e., private equity), various investment vehicles in real estate companies (i.e., real estate), and diversified<br />
baskets of investments in collective vehicles whose returns are intended to be largely independent of the returns of the public markets<br />
(i.e., absolute return). These investments are generally illiquid, and the system’s ability to gain insight into the underlying portfolios of<br />
some of the LPs may be limited. The fair value of these LPs is measured based on the Net Asset Value (NAV) of the entity as provided<br />
from the General Partner (GP). The system determines whether the NAV is in accordance with the Investment Companies Guide and is<br />
in phase with <strong>TRS</strong>’ fiscal year end. If these conditions are not met, the system adjusts the NAV accordingly or performs further analysis<br />
to estimate fair value of its LP interest. A NAV that is out of phase may be adjusted for subsequent contributions, distributions, management<br />
fees and reserves, material changes in fair value of the underlying investments which make up the NAV, or an updated valuation<br />
obtained from the GP.<br />
A commingled fund is a pool of assets from multiple investors which are under the direction of an external fund manager. These<br />
instruments are typically entered into by executing an Investment Management Agreement or are registered, publicly traded pools that<br />
are accessible by many investors. The fair value of commingled funds is generally estimated by the fund administrator retained by the<br />
fund manager.<br />
Investment derivative instruments are reported at fair value. When the fund holds investment derivatives with offsetting market<br />
risks, it nets the offsetting positions.<br />
The fair value of option and future contracts traded in active markets is estimated based on the current exchange close price. For<br />
option contracts, if a current day close price is not available, a fully vetted valuation model to estimate fair value is discerned through<br />
coordination with the portfolio manager and/or the independent clearing broker. <strong>TRS</strong> did not enter into any option contracts during<br />
fiscal year <strong>2011</strong>. For future contracts, if a current day close price is not available, the last price or settlement price may also be used,<br />
depending on availability; or if quoted prices are not available, a fully vetted valuation model to estimate fair value is discerned through<br />
coordination with the portfolio manager and/or the independent clearing broker. Futures contracts are marked to market daily. The net<br />
offsetting positions are reported as accruals, with a daily variation margin (the gain or loss) recorded between the daily value of the<br />
contracts and the value on the previous day.<br />
The fair value of fairly generic credit default swap and interest rate swap arrangements are estimated using appropriate pricing<br />
models. At each day’s close, if the variables required to successfully complete the pricing model are not available, the system utilizes a<br />
“proxy price” to estimate the fair value at the closing day. Once the variables are available, the system corrects the proxy price. These<br />
arrangements are priced “clean” meaning the fair values do not include accrued interest. The fair value of total return and other more<br />
complex swap arrangements are estimated using a pricing model or a proprietary pricing agent.<br />
The fair value of forward contracts is estimated by adding the forward points to the corresponding spot rate. These rates are then<br />
applied to the outstanding currency exchange to derive a change in valuation.<br />
Securities Lending<br />
The system reports loaned securities, the invested cash collateral, and the related liabilities resulting from securities lending transactions<br />
on Exhibit I, Statement of Fiduciary Net Assets. The system also reports the earned income from securities lending on Exhibit<br />
II, Statement of Changes in Fiduciary Net Assets. Both the loaned securities and the invested cash collateral are reported at quoted<br />
market prices.<br />
Liabilities<br />
Accounts payable represents the liability for assets or services received at fiscal year end for which payment is pending.<br />
Benefits payable for the Pension Trust Fund represents the liability for retirement, disability, and death benefits due at fiscal year<br />
end and payable within the next 30 days. The health care claims payable for <strong>TRS</strong>-Care and <strong>TRS</strong>-ActiveCare includes an estimate for<br />
health care claims incurred but not reported to the system at August 31, <strong>2011</strong>.<br />
Investments purchased payable represents the liability for securities purchased prior to fiscal year end for which cash payment will<br />
be made after fiscal year end. Foreign investments purchased payable is reported at current exchange rates.<br />
Purchased service installment receipts are payments for service purchases establishing additional creditable service. Payments<br />
are made on a monthly basis for up to five years until sufficient to cover the total cost of the service purchased. Amounts paid, less<br />
administrative expenses, are refundable on demand. Revenues will be reported at the time the payments are sufficient to cover the<br />
42 FINANCIAL SECTION
TEACHER RETIREMENT SYSTEM OF TEXAS COMPREHENSIVE ANNUAL FINANCIAL REPORT <strong>2011</strong><br />
Notes to the <strong>Financial</strong> Statements<br />
total cost. Until that time, these funds are a deferred revenue.<br />
Compensable absences payable represents the liability that becomes due upon the occurrence of relevant events such as resignation,<br />
retirement and use of leave balances by covered employees. These obligations are normally paid from the same funding source<br />
from which each employee’s salary or wage compensation was paid. Liabilities are reported separately as either current or non-current<br />
in the statement of net assets for enterprise funds, if appropriate.<br />
Deferred rent represents a reduction to rental expenses for the rent abatement and incentives received from the non-cancelable<br />
operating lease that are being amortized over the lease term.<br />
Collateral Obligations represent both collateral associated with securities lending and that associated with derivative instrument<br />
activity.<br />
Interfund/Interagency Transactions And Balances<br />
Transactions between the system’s funds have been classified in accordance with the following criteria that are consistent with<br />
generally accepted accounting principles (GAAP).<br />
The Pension Trust Fund provides various administrative services to other <strong>TRS</strong> programs and accounts for these services as reciprocal<br />
interfund activity. These transactions are reported using the appropriate classification accounts for additions/revenues or deductions/<br />
expenses as if transacted with parties external to the state, i.e., they are not presented as transfers. The interfund receivables and<br />
payables related to reciprocal interfund activity are classified as accounts receivable and accounts payable on the financial statements.<br />
Interagency transactions have been classified using the above criteria for reciprocal interfund activity.<br />
Legal Reserve Accounts<br />
The Pension Trust Fund has five statutorily required reserves. The Member Savings Account reserve represents the accumulation<br />
of active member deposits plus interest. The State Contribution Account consists of reserves available to fund future active member<br />
retirement, death, and survivor benefits. The Retired Reserve Account represents reserves to pay retirement, death, survivor benefits<br />
and post-retirement benefit increases. The Deferred Retirement Option Account consists of the accumulation of participating member<br />
deposits plus interest less benefits paid out. Net investment gains or losses are accumulated in the Interest Account and transferred<br />
to the State Contribution Account together with any other balance remaining in the Interest Account. The Expense Account represents<br />
reserves to pay administrative expenses of the Pension Trust Fund that exceed the state’s appropriations and that are required to perform<br />
the fiduciary duties of the board. The statutory accounts are a requirement of the Texas Government Code, Chapter 825, Sections<br />
307-313.<br />
NOTE 2:<br />
CAPITAL ASSETS<br />
Capital assets are presented at historical cost or, if not purchased, at fair value at the date of acquisition. When appropriate, depreciation<br />
and amortization have been charged over the estimated useful lives of the assets or lease period, whichever is shorter, using<br />
the straight-line method. All capital assets belong to the Pension Trust Fund. Capitalization thresholds for all capital asset classes and<br />
useful lives for exhaustible assets are as follows:n<br />
Useful<br />
Capitalization<br />
Threshold<br />
Depreciable<br />
Asset Class in Dollars Life<br />
Land $ 0 - -<br />
Construction in Progress $ 0 - -<br />
Buildings $ 100,000 50 years<br />
Building Improvements $ 100,000 15 years<br />
Facilities and Other Improvements $ 100,000 10 years<br />
Leasehold Improvements $ 100,000 6 years<br />
Furniture and Equipment $ 5,000 5 years<br />
Internally Generated Computer Software $ 1,000,000 5 years<br />
Other Computer Software $ 100,000 5 years<br />
Other Capital Assets Various Various<br />
Capital asset balances and current year transactions are presented in the table on the following page.<br />
FINANCIAL SECTION<br />
43
TEACHER RETIREMENT SYSTEM OF TEXAS COMPREHENSIVE ANNUAL FINANCIAL REPORT <strong>2011</strong><br />
Notes to the <strong>Financial</strong> Statements<br />
Reclassifications<br />
Balance<br />
Balance and 08/31/<strong>2011</strong><br />
Asset Class 09/01/2010 Completed CIP Additions Deletions (Exhibit I)<br />
Non-Depreciable Assets:<br />
Land and Land Improvements $ 1,658,310 $ $ $ $ 1,658,310<br />
Construction in Progress 1,837,601 (1,776,610) 485,980 546,971<br />
Other Tangible Capital Assets 124,136 124,136<br />
Total Non-Depreciable Assets $ 3,620,047 $ (1,776,610) $ 485,980 $ 0 $ 2,329,417<br />
Depreciable Assets:<br />
Buildings and Building Improvements $ 31,087,285 $ 1,635,003 $ 2,161,468 $ 34,883,756<br />
Furniture and Equipment 6,422,928 1,592,784 (185,123) 7,830,589<br />
Vehicles, Boats and Aircraft 45,721 45,721<br />
Leasehold Improvements 3,096,189 3,096,189<br />
Other Capital Assets 247,622 29,432 277,054<br />
Facilities and Other Improvements 141,607 202,015 343,622<br />
Total Depreciable Assets at<br />
Historical Cost $ 40,899,745 $ 1,776,610 $ 3,985,699 $ (185,123) $ 46,476,931<br />
Less Accumulated Depreciation for:<br />
Buildings and Building Improvements $ (13,677,060) $ $ (927,383) $ $ (14,604,443)<br />
Furniture and Equipment (3,953,629) (789,218) 184,576 (4,558,271)<br />
Vehicles, Boats and Aircraft (45,721) (45,721)<br />
Leasehold Improvements (774,047) (516,031) (1,290,078)<br />
Other Capital Assets (171,712) (9,142) (180,854)<br />
Facilities and Other Improvements (12,964) (12,964)<br />
Total Accumulated Depreciation $ (18,622,169) $ 0 $ (2,254,738) $ 184,576 $ (20,692,331)<br />
Depreciable Assets, Net $ 22,277,576 $ 1,776,610 $ 1,730,961 $ (547) $ 25,784,600<br />
Intangible Assets:<br />
Computer Software $ 12,853,867 $ $ 462,913 $ (4,477,072) $ 8,839,708<br />
Total Amortizable Assets at<br />
Historical Cost $ 12,853,867 $ 0 $ 462,913 $ (4,477,072) $ 8,839,708<br />
Less Accumulated Amortization for:<br />
Computer Software $ (7,753,817) $ $ (154,726) $ $ (7,908,543)<br />
Total Accumulated Amortization $ (7,753,817) $ 0 $ (154,726) $ 0 $ (7,908,543)<br />
Intangible Assets, Net $ 5,100,050 $ 0 $ 308,187 $ (4,477,072) $ 931,165<br />
Fiduciary Capital Assets, Net of<br />
Accumulated Depreciation/Amortization $ 30,997,673 $ 0 $ 2,525,128 $ (4,477,619) $ 29,045,182<br />
NOTE 3:<br />
DEPOSITS AND INVESTMENTS<br />
A. CASH IN BANK AND DEPOSITS<br />
Cash and deposits of the system are maintained in bank accounts or in the State Treasury. Foreign bank deposits are reported at<br />
current exchange rates. At August 31, <strong>2011</strong>, the carrying amount totaled $184,856,481 and the bank balance totaled $184,854,794.<br />
The State Treasury invests funds in time deposits, repurchase and reverse repurchase agreements, obligations of the United States,<br />
and obligations of various federal credit organizations. The State Treasury has an arrangement with financial institutions to collateralize<br />
state deposits in excess of depository insurance.<br />
44 FINANCIAL SECTION
TEACHER RETIREMENT SYSTEM OF TEXAS COMPREHENSIVE ANNUAL FINANCIAL REPORT <strong>2011</strong><br />
Notes to the <strong>Financial</strong> Statements<br />
B. CASH ON HAND AND CASH EQUIVALENTS<br />
At August 31, <strong>2011</strong>, the system had $2,563,416 in cash on hand. This total is related to checks for purchases of special service<br />
that were being held pending approval of rollover transfer forms.<br />
Investments with an original maturity of three months or less and that are used for cash management rather than investing activities<br />
are considered cash equivalents. Highly liquid investments invested as part of a short-term investment fund are not considered cash<br />
equivalents.<br />
C. CUSTODY OF INVESTMENTS<br />
The system has contracted with State Street Bank and Trust Company to serve as custodian for the system’s investments.<br />
D. INVESTMENT LEGAL PROVISIONS AND OTHER CONSTRAINTS<br />
Under the Texas Property Code, Section 117.003, a trustee of the board owes a duty to the beneficiaries of the trust to comply<br />
with the prudent investor rule. In making investments, the board shall exercise the judgment and care under the circumstances then<br />
prevailing that persons of ordinary prudence, discretion, and intelligence exercise in the management of their own affairs, not in regard to<br />
speculation, but in regard to the permanent disposition of their funds, considering the probable income therefrom as well as the probable<br />
safety of their capital. Texas Government Code, Section 825.301(a), Texas Property Code, Section 117.004, and the Texas Constitution,<br />
Article XVI, Section 67(a)(3) apply in determining whether a trustee has exercised prudence with respect to an investment decision.<br />
Determination shall be made taking into consideration the investment of all the assets of the trust, or the assets of the collective investment<br />
vehicle, over which the trustee had management and control.<br />
Trustees follow the guidelines provided by the <strong>TRS</strong> Investment Policy Statement in establishing specific asset allocations, benchmarks,<br />
eligible investments and quantitative criteria with the assistance of their investment counsel and investment advisors. Trustees utilize<br />
asset allocations and portfolio standards they believe are prudent and appropriate for the long-term objectives of the fund. Categories of<br />
permissible investments include equities, debt securities, cash equivalents, alternative investments including private equity, real assets,<br />
absolute return, hedge funds, other absolute return investments, derivative instruments authorized by law, mutual funds, closed-end<br />
funds, exchange-traded funds, and commingled funds. Investment categories are based on the risk profiles exhibited by those investments.<br />
The objectives of the Private Equity and Real Asset investments is to provide a long-term rate of return in excess of the return of<br />
the Investment Policy benchmark for each authorized strategy, provide diversification to the Total Fund, and provide for enhanced returns<br />
and diversification within the portfolio by allocating assets among the various strategies. Private equity funds build portfolios of private<br />
investments in the equity or equity-rights securities of privately-owned operating companies. Real assets focus on private or public real<br />
estate equity, private or public real estate debt, infrastructure, timber, agricultural real estate, oil and gas, real asset mezzanine debt or<br />
equity, mortgage-related investments, entity-level investments, REITS, MLPs, non-fixed assets and other opportunistic investments in<br />
real assets. Funding of committed capital in either the Private Equity or the Real Asset Portfolio will occur over an extended time period<br />
and may take several years before the total allocation to each asset class is fully invested. Because an individual investment may begin<br />
to return capital to the investor prior to the full funding of the investor’s commitment, the outstanding invested capital of a Private Equity<br />
or Real Asset investment might at times be substantially less than the total commitment. Hedge funds are private commingled investment<br />
vehicles with the general characteristics as set forth in Texas Government Code, Section 825.3012. Hedge funds include private<br />
investment fund of funds or a commingled vehicle that itself invests in hedge funds. <strong>TRS</strong> investment policy establishes criteria to analyze<br />
and determine whether a private investment fund should be classified as a hedge fund. During fiscal year <strong>2011</strong>, the permissible hedge<br />
fund allocation was increased from a maximum of 5% to a maximum of 10% of the market value of the total fund on the date of each<br />
hedge fund investment as a result of a change in the Government Code. Other Absolute Return investments include credit sensitive<br />
investments as well as other limited partnerships that are not hedge funds, private equity, or real assets. A commingled fund is a fund<br />
which is (i) exempt under the provisions of Section 501(a) of the Internal Revenue Code of 1986, (ii) is not required to be registered as an<br />
investment company under Section 3(c)(1), 3(c)(7) or other provisions of the Investment Company Act of 1940, or (iii) is an investment<br />
company registered under the Investment Company Act of 1940, as amended, provided that investment and reinvestment of assets<br />
complies with the investment guidelines in all respects.<br />
FINANCIAL SECTION<br />
45
TEACHER RETIREMENT SYSTEM OF TEXAS COMPREHENSIVE ANNUAL FINANCIAL REPORT <strong>2011</strong><br />
Notes to the <strong>Financial</strong> Statements<br />
E. INVESTMENTS<br />
The fair values of investments at August 31, <strong>2011</strong>, are shown in the following table.<br />
Investment Type<br />
Pension Trust Fund<br />
Fair Value<br />
Short-Term Investments:<br />
Short-Term Investment Fund $ 7,070,923,524<br />
Other Short-Term 5,142,858,134<br />
Short-Term Foreign Currency Contracts (44,158)<br />
Equities:<br />
Domestic Equities:<br />
Equity Securities 19,009,420,961<br />
Equity Commingled Funds 1,565,541,883<br />
International Equities:<br />
Equity Securities 22,904,099,464<br />
Equity Commingled Funds 2,779,834,064<br />
Equity Mutual Funds 94,571,615<br />
Debt Securities:<br />
Domestic Debt Securities:<br />
Asset and Mortgage Backed 979,350,073<br />
Corporate 169,086,716<br />
U.S. Treasury 13,551,666,360<br />
U.S. Treasury STRIPS 74,163,157<br />
U.S. Treasury TIPS 5,627,763,979<br />
U.S. Government Agency 12,532,454<br />
Debt Commingled Funds 151,420,783<br />
International Debt Securities:<br />
Government 12,249,634<br />
Corporate 15,435,212<br />
Debt Commingled Funds 11,805,720<br />
Alternative Investments:<br />
Domestic Alternative Investments:<br />
Private Equity 8,020,684,628<br />
Real Assets 8,123,515,611<br />
Absolute Return - Hedge Funds 3,995,283,051<br />
Other Absolute Return 1,688,767,744<br />
International Alternative Investments:<br />
Private Equity 3,077,485,846<br />
Real Assets 1,671,124,629<br />
Absolute Return - Hedge Funds 328,631,387<br />
Investment Derivatives:<br />
Domestic Investment Derivatives:<br />
Forward Contracts (27,320,899)<br />
Swap Contracts (65,570,546)<br />
Warrants 80,817<br />
International Investment Derivatives:<br />
Swap Contracts (478,509)<br />
Warrants 23,023<br />
Other Investments:<br />
Other Commingled Funds - Domestic 63,195,203<br />
Total Investments (Exhibit I) $ 106,048,101,560<br />
Invested Securities Lending Collateral:<br />
Securities Lending Pooled Investments $ 22,760,168,002<br />
Total Securities Lending Collateral (Exhibit I) $ 22,760,168,002<br />
46 FINANCIAL SECTION
TEACHER RETIREMENT SYSTEM OF TEXAS COMPREHENSIVE ANNUAL FINANCIAL REPORT <strong>2011</strong><br />
Notes to the <strong>Financial</strong> Statements<br />
F. DERIVATIVES<br />
The fair value balances and notional amounts of investment derivative instruments outstanding at August 31, <strong>2011</strong>, classified by<br />
type, and the changes in fair value of such investment derivative instruments for the fiscal year ended August 31, <strong>2011</strong> are as follows.<br />
Fiduciary Funds<br />
Investment Derivatives:<br />
Changes in Fair Value Fair Value at August 31, <strong>2011</strong><br />
Classification Amount Classification Amount Notional<br />
Gain/(Loss)<br />
Forward Contracts Investment Revenue $ (49,953,250) Investment $ (27,320,899) $11,619,782,632<br />
Futures Contracts Investment Revenue $ 220,711,897 Investment $ -0- $14,149,497,819<br />
Swap Contracts Investment Revenue $ 1,750,131,755 Investment $ (66,049,055) $ 6,062,787,733<br />
Warrants Investment Revenue $ 881,051 Investment $ 103,840 $ 355,247<br />
The methods and significant assumptions used to estimate fair value of the system’s investment derivative instruments are presented<br />
in Note 1. Summary of Significant Accounting Policies, Section F. Assets, Liabilities and Legal Reserves.<br />
Derivatives are financial instruments the value of which are derived, in whole or part, from the value of any one or more underlying<br />
securities or assets, or index of securities or assets (such as bonds, stocks, financial commodities, and currencies). Derivatives include<br />
futures contracts, options, options on futures contracts, forward contracts, swap contracts, and any instrument or contract intended to<br />
manage transaction or currency exchange risk in purchasing, selling or holding investments.<br />
The system’s investment policy states that derivatives may only be used to efficiently manage and reduce the risk of the overall<br />
investment portfolio in accordance with applicable law, and must comply with the fiduciary standard of prudence set forth in the Texas<br />
Constitution, Article XVI, Section 67(a)(3). Consistent with these objectives, derivative applications may be used to implement investment<br />
strategies in a lower cost and efficient manner; efficiently manage the fund’s portfolio by altering the portfolio’s market exposure in<br />
lieu of trading the underlying cash market securities through purchases or short sales, or both, of appropriate derivatives; construct<br />
portfolios with risk and return characteristics that could not be created with cash market securities consistently with the objectives in<br />
the investment policy and in compliance with applicable law; hedge and control risks so that the fund’s risk-return profile is more closely<br />
aligned with the fund’s targeted risk-return profile through purchases or short sales, or both, of appropriate derivatives; and facilitate<br />
transition trading when holdings must be rebalanced or reallocated among permissible investments as a result of changes to applicable<br />
benchmark indexes or investment policy changes. Derivatives may not be used for any activity a primary purpose of which is speculation<br />
or to profit while materially increasing risk to the system. The tenor of interest rate over-the-counter swaps may not exceed thirty years<br />
or shorter based on market liquidity. The tenor of all other over-the-counter derivative instruments may not exceed five years. Derivative<br />
applications may not be used to invest in asset classes that are not consistent with the system’s legally permissible and policy asset<br />
categories, implementation strategies, and risk-return characteristics. Derivatives underlain by physical commodities may only be made<br />
through investments in funds that issue securities or other structures that also provide limited liability or limited risk of loss to investors.<br />
Investments in cash settled derivatives which reference commodities are permitted.<br />
Any counterparty to an over-the-counter derivative transaction must have a credit rating of at least A- (Standard & Poors or Fitch)<br />
or A3 (Moody’s) and is subject to established ISDA Master Agreements. All ISDA Master Agreements provide that netting applies. The<br />
system and external managers may also use collateral arrangements to mitigate counterparty credit or performance risk. The net market<br />
value of all over-the-counter derivative positions, less collateral posted, for any individual counterparty may not exceed $500 million.<br />
Forward Contracts<br />
A forward contract is a non-standardized contract for the physical or electronic (through a bookkeeping entry) delivery of a commodity<br />
or financial instrument at a specified price at some point in the future.<br />
Futures Contracts<br />
A futures contract is a commitment to buy or sell a specified quantity of a commodity or financial instrument at a specified price<br />
with payment and delivery occurring at a specified future date. Futures contracts are used primarily as a tool to increase or decrease<br />
market exposure to various asset classes.<br />
Swap Contracts<br />
The system’s swap contracts are a bilateral financial contract in that the parties agree to exchange cash flows of defined investment<br />
assets in amounts and times specified by the contract. Swap transactions are used to efficiently manage or reduce the risk of the overall<br />
investment portfolio, or both. An interest rate swap is structured such that one stream of future interest payments is exchanged for<br />
another based on the notional amount. A total return swap is structured such that the total return (cash flows plus capital appreciation/<br />
FINANCIAL SECTION<br />
47
TEACHER RETIREMENT SYSTEM OF TEXAS COMPREHENSIVE ANNUAL FINANCIAL REPORT <strong>2011</strong><br />
Notes to the <strong>Financial</strong> Statements<br />
depreciation) is exchanged, rather than just the cash flows. Investment managers or sponsors of Real Asset Funds investments in<br />
commodities are limited to swaps and instruments that constitute a security that is underlain by a financial instrument as opposed to a<br />
physical commodity.<br />
Option Contracts<br />
An option contract provides the right, but not the obligation, to buy or sell a specific amount of a specific security within a predetermined<br />
time period. During fiscal year <strong>2011</strong> and at August 31, <strong>2011</strong>, respectively, the system entered into and held no option contracts.<br />
G. DEPOSITS AND INVESTMENTS RISK FACTORS<br />
Deposits and investments of state and local governments are exposed to risks that have the potential to result in losses. GASB<br />
Statement No. 40, Deposit and Investment Risk Disclosures - an amendment to GASB Statement No. 3 updated the custodial credit risk<br />
disclosure requirements of Statement 3 and established more comprehensive disclosure requirements addressing other common risks<br />
of deposits and investments such as credit risk, concentration of credit risk, interest rate risk and foreign currency risk. The required<br />
disclosures related to these risks are presented on the following pages.<br />
Custodial Credit Risk – Deposits<br />
The custodial credit risk for deposits is the risk that, in the event of bank failure, the government will not be able to recover deposits<br />
or will not be able to recover collateral securities that are in the possession of an outside party. The system does not have a formal<br />
deposit policy for custodial credit risk. The State Treasury has specific guidelines for cash and deposits that are maintained in the State<br />
Treasury.<br />
The deposits in the bank in excess of the insured amount are uninsured and uncollateralized. As of August 31, <strong>2011</strong>, the balance<br />
of uncollateralized cash in U.S. and non-U.S. banks for investments pending settlement was $151,906,367.<br />
Custodial Credit Risk – Investments<br />
The custodial credit risk for investments (including exchange traded investment derivative instruments) is the risk that, in the event<br />
of a failure of the counterparty, the government will not be able to recover the value of investment or collateral securities that are in the<br />
possession of an outside party. The system does not have a formal investment policy for custodial credit risk.<br />
Short-Term investments totaling $5,112,558,134 are held by the custodian’s agent in an investment pool not evidenced by a security,<br />
and are not exposed to custodial credit risk. All other investments (including exchange traded investment derivative instruments) are<br />
registered in the name of Teacher Retirement System or in the name of the system’s custodian which was established through a master<br />
trust custodial agreement. The securities are held by the custodian in the name of the system.<br />
Any cash collateral received associated with investment derivative activity is invested in an agent managed pool that is not evidenced<br />
by securities that exist in physical or book entry form. At August 31, <strong>2011</strong>, the system held $30,300,000 associated with investment<br />
derivative activity.<br />
At August 31, <strong>2011</strong>, the deposits with broker to open futures contracts in the amount of $505,261,049 were uninsured and<br />
uncollateralized.<br />
Credit Risk of Investment Derivative Instruments and Debt Securities<br />
The credit risk for the system’s investments in debt securities, Short-Term Investment Funds, and over-the-counter investment<br />
derivative instruments in asset positions is the risk that an issuer or other counterparty to an investment will not fulfill its obligations.<br />
The system’s investment policy establishes tracking error limits that are intended to reduce the tracking error of the asset class.<br />
The system does not have a formal credit risk policy relating to its investments in Short-Term Investment Funds. For over-the-counter<br />
(OTC) derivatives, any counterparty in a transaction with <strong>TRS</strong> must have a credit rating of at least A- (Standard & Poors or Fitch) or<br />
A3 (Moody’s) or better at the inception of the contract. All OTC derivative transactions, including those managed through Agency<br />
Agreements, must be subject to established ISDA Master Agreements and have full documentation of all legal obligations of <strong>TRS</strong> under<br />
the transactions. All ISDA Master Agreements provide that netting applies. To minimize the system’s exposure to loss related to credit<br />
risk, the system may use collateral arrangements to mitigate counterparty credit risk. The system has negotiated thresholds for each<br />
counterparty above which collateral must be posted. The net market value of all over-the-counter derivative positions, less collateral<br />
posted, for any individual counterparty may not exceed $500 million. The net market value of all over-the-counter derivative positions,<br />
without consideration collateral, may not exceed five percent of the total market value of the fund. The system’s investment policy<br />
clarifies that termination of the transaction is allowed. Repurchase transactions and triparty repurchase transactions may not exceed<br />
five percent of the market value of the total investment portfolio, including cash and cash equivalents, unless those transactions are<br />
covered by a third-party indemnification agreement by an organization that bears a long-term NRSRO credit rating of A- or better and is<br />
enhanced by acceptable collateral. A securities lending agent must be an organization rated A- or better by a NRSRO.<br />
The system’s rated counterparties on investment derivative instruments in an asset position, and rated debt investments as of<br />
48 FINANCIAL SECTION
TEACHER RETIREMENT SYSTEM OF TEXAS COMPREHENSIVE ANNUAL FINANCIAL REPORT <strong>2011</strong><br />
Notes to the <strong>Financial</strong> Statements<br />
August 31, <strong>2011</strong>, using the Standard & Poor’s (S&P) rating scale, are as follows:<br />
Investment Derivative Instruments - the aggregate fair value of investment derivative instruments in asset positions at<br />
August 31, <strong>2011</strong>, was $50,308,626. This represents the maximum loss that would be recognized at August 31, <strong>2011</strong>, if all counterparties<br />
failed to perform as contracted. This maximum exposure is reduced by $30,300,000 of collateral held and by $173,448,571 of liabilities<br />
included in netting arrangements with those counterparties resulting in a zero net exposure of investment derivative instruments to<br />
credit risk.<br />
The aggregate fair value of investment derivative instruments in asset positions of $50,308,626 at August 31, <strong>2011</strong>, was executed<br />
with two counterparties, 27% with an S&P rating of AA and 73% with an S&P rating of A.<br />
Debt Securities:<br />
Investment Type S&P Rating Fair Value<br />
Short-Term Investment Fund NR $ 7,070,923,524<br />
Other Short-Term NR 5,142,858,134<br />
Total Credit Risk of Short-Term $ 12,213,781,658<br />
Short-Term Foreign Currency Contracts $ (44,158)<br />
Total Short-Term (Exhibit I) $ 12,213,737,500<br />
U.S. Government Agency Obligations AA $ 9,349,765<br />
U.S. Government Agency Obligations NR 32,240<br />
Total U.S. Government Agency Obligations $ 9,382,005<br />
Asset and Mortgage Backed Obligations AAA $ 6,973,360<br />
Asset and Mortgage Backed Obligations AA 62,311,003<br />
Asset and Mortgage Backed Obligations A 43,094,307<br />
Asset and Mortgage Backed Obligations BBB 16,269,703<br />
Asset and Mortgage Backed Obligations BB 23,726,965<br />
Asset and Mortgage Backed Obligations B 101,352,584<br />
Asset and Mortgage Backed Obligations CCC 323,948,592<br />
Asset and Mortgage Backed Obligations CC 106,903,363<br />
Asset and Mortgage Backed Obligations D 75,975,316<br />
Asset and Mortgage Backed Obligations NR 218,794,880<br />
Total Asset and Mortgage Backed Obligations $ 979,350,073<br />
(to next page)<br />
FINANCIAL SECTION<br />
49
TEACHER RETIREMENT SYSTEM OF TEXAS COMPREHENSIVE ANNUAL FINANCIAL REPORT <strong>2011</strong><br />
Notes to the <strong>Financial</strong> Statements<br />
(concluded)<br />
Investment Type S&P Rating Fair Value<br />
Corporate Obligations AAA $ 384,844<br />
Corporate Obligations AA 3,959,823<br />
Corporate Obligations A 17,935,626<br />
Corporate Obligations BBB 43,430,987<br />
Corporate Obligations BB 12,149,396<br />
Corporate Obligations B 27,749,796<br />
Corporate Obligations CCC 1,781,050<br />
Corporate Obligations CC 1,317,098<br />
Corporate Obligations NR 60,378,096<br />
Total Corporate Obligations $ 169,086,716<br />
International Government Obligations AAA $ 4,844,629<br />
International Government Obligations CC 1,671,106<br />
International Government Obligations NR 5,733,899<br />
Total International Government Obligations $ 12,249,634<br />
International Corporate Obligations AA $ 890,495<br />
International Corporate Obligations A 2,132,633<br />
International Corporate Obligations BBB 6,822,851<br />
International Corporate Obligations BB 981,849<br />
International Corporate Obligations B 4,104,257<br />
International Corporate Obligations NR 503,127<br />
Total International Corporate Obligations $ 15,435,212<br />
Total Credit Risk of Debt Securities<br />
(excluding Short-Term) $ 1,185,503,640<br />
U.S. Government Obligations and<br />
U.S. Government Agency Obligations $ 19,256,743,945<br />
Total Fixed Income (Exhibit I) $ 20,442,247,585<br />
Interest Rate Risk of Debt Securities and Investment Derivative Instruments<br />
Interest rate risk is the risk that changes in interest rates will adversely affect the fair value of an investment. Duration is a measure<br />
of a debt investment’s exposure to fair value changes arising from changes in interest rates. It uses the present value of cash flows,<br />
weighted for those cash flows as a percentage of the investment’s full price. The system does not have a formal interest rate risk policy.<br />
The table on the next page shows the long-term fixed income investments by investment type, fair value, and the effective weighted<br />
duration rate as of August 31, <strong>2011</strong>.<br />
50 FINANCIAL SECTION
TEACHER RETIREMENT SYSTEM OF TEXAS COMPREHENSIVE ANNUAL FINANCIAL REPORT <strong>2011</strong><br />
Notes to the <strong>Financial</strong> Statements<br />
Effective Weighted<br />
Investment Type Fair Value Duration Rate*<br />
U.S. Government Obligations $ 19,253,593,496 11.49<br />
U.S. Government Agency Obligations 12,532,454 8.99<br />
Asset and Mortgage Backed Obligations 979,350,073 4.32<br />
Corporate Obligations 169,086,716 5.55<br />
International Government Obligations 12,249,634 7.65<br />
International Corporate Obligations 15,435,212 6.32<br />
Total Fixed Income (Exhibit I) $ 20,442,247,585 11.09<br />
*The effective weighted duration rate is an option-adjusted measure of a bond’s (or portfolio’s) sensitivity to changes in interest rates.<br />
It is calculated as the average percentage change in a bond’s value (price plus accrued interest) under shifts of the Treasury curve +/-<br />
100 bps. It incorporates the effect of embedded options for corporate bonds and changes in prepayments for mortgage backed securities<br />
(including pass-throughs, CMOs and ARMs).<br />
The table below shows the maturities of the system’s Swap contracts at August 31, <strong>2011</strong>.<br />
Maturities in Years<br />
Less than 1 Year 1-5 6-10 11-20 Total<br />
$ (64,093,651) $ 2,076,453 $ 589,996 $ (626,393) $ (62,053,595)<br />
Investments Highly Sensitive to Interest Rate Changes<br />
The system’s investments in long-term Asset and Mortgage Backed Obligations are subject to prepayments by the obligees of<br />
the underlying assets in periods of decreasing interest rates. The resultant reduction in expected cash flows will affect the fair value of<br />
these securities. Prepayments by the obligee of the underlying assets in periods of declining interest rates could reduce or eliminate the<br />
stream of income that would have been received. As of August 31, <strong>2011</strong>, these securities totaled $979,350,073.<br />
The system invests in Commingled Funds which hold a preponderance of investments with fair values that are highly sensitive to<br />
market conditions. The fair value of the Commingled Fund fluctuates as market conditions fluctuate. Interest rate changes are a part of<br />
changes in market conditions. As of August 31, <strong>2011</strong>, these funds totaled $163,226,503.<br />
The system’s investments in Swap contracts have various reference rates based on various interbank offered rates and Treasury<br />
Bill rates. As these reference rates fluctuate, the payments due to/from the system fluctuate. At August 31, <strong>2011</strong>, the notional amount<br />
and fair value of these contracts appear on the following page.<br />
FINANCIAL SECTION<br />
51
TEACHER RETIREMENT SYSTEM OF TEXAS COMPREHENSIVE ANNUAL FINANCIAL REPORT <strong>2011</strong><br />
Notes to the <strong>Financial</strong> Statements<br />
Terms Notional Fair Value<br />
U.S. LIBOR-Varied Terms $ 3,267,238,636 $ (174,566,287)<br />
GBP LIBOR-Varied Terms 4,210,946 177,552<br />
1 month EURIBOR 6,287,029 (251,882)<br />
1 month STIBOR 820,285 (80,220)<br />
1 month HIBOR 4,179,756 104,115<br />
1 month U.S. Treasury Bill 728,327,376 45,606,838<br />
3 month Canada Banker’s Acceptance 30,269,819 16,615,320<br />
3 month STIBOR 72,137,883 10,063,980<br />
3 month U.S. Treasury Bill 1,726,916,784 73,951,099<br />
6 month EURIBOR 30,992,862 6,451,950<br />
JPY Overnight 855,988 33,346<br />
U.S. Fed Funds Effective Rate 28,849,662 (1,304,251)<br />
Fixed Rate 154,067,917 (38,855,155)<br />
Total $ 6,055,154,943 $ (62,053,595)<br />
Foreign Currency Risk – Deposits and Investments<br />
Foreign currency risk is the risk that changes in exchange rates will adversely affect the fair value of a deposit or an investment.<br />
The system does not have a formal deposit policy for foreign currency risk. The risk of holding investments in foreign currency is managed<br />
by engaging in currency overlay strategies. The maximum notional exposure of the fund to any single non-U.S. dollar developed market<br />
currency and any emerging market currency will be limited to 2% and 1% of the market value of the fund respectively. The system’s<br />
exposure to foreign currency risk at August 31, <strong>2011</strong>, is presented in the tables on the following pages.<br />
52 FINANCIAL SECTION
TEACHER RETIREMENT SYSTEM OF TEXAS COMPREHENSIVE ANNUAL FINANCIAL REPORT <strong>2011</strong><br />
Notes to the <strong>Financial</strong> Statements<br />
Deposits:<br />
Currency<br />
Cash in<br />
Non-U.S. Banks<br />
Australian Dollar $ 4,355,235<br />
Botswana Pula 9,809<br />
Brazilian Real 3,779,330<br />
Canadian Dollar 1,163,953<br />
Chilean Peso 139,660<br />
Colombian Peso 96,678<br />
Croatian Kuna 100,846<br />
Czech Koruna 73,459<br />
Danish Krone 297,430<br />
Egyptian Pound 126,058<br />
Euro 27,249,109<br />
Ghanaian Cedi 10,247<br />
Hong Kong Dollar 30,118,228<br />
Hungarian Forint 61,940<br />
Indian Rupee 6,064,412<br />
Indonesian Rupiah 1,753,231<br />
Israeli Shekel 74,412<br />
Japanese Yen 35,324,555<br />
Jordanian Dinar 160,969<br />
Kenyan Shilling 150,334<br />
Lithuania Litas 44,861<br />
Malaysian Ringgit 941,671<br />
Mauritius Rupee 71,358<br />
Mexican Peso 128,751<br />
Moroccan Dirham 129,485<br />
New Turkish Lira 275,114<br />
New Zealand Dollar 46,723<br />
Nigerian Naira 94,751<br />
Norwegian Krone 1,252,517<br />
Pakistan Rupee 87,883<br />
Peruvian Nuevo Sol 54,835<br />
Philippine Peso 100,384<br />
Polish Zloty 573,288<br />
Pound Sterling 16,464,381<br />
Qatar Riyal 74,510<br />
Singapore Dollar 721,681<br />
South African Rand 4,805,459<br />
South Korean Won 1,317,647<br />
Swedish Krona 2,485,855<br />
Swiss Franc 3,178,658<br />
Taiwan Dollar 6,775,501<br />
Thai Baht 1,171,162<br />
United Arab Emirates Dirham (3)*<br />
Total Deposits Subject to<br />
Foreign Currency Risk $ 151,906,367<br />
* Balance is related to the timing of trade related costs.<br />
FINANCIAL SECTION<br />
53
TEACHER RETIREMENT SYSTEM OF TEXAS COMPREHENSIVE ANNUAL FINANCIAL REPORT <strong>2011</strong><br />
Notes to the <strong>Financial</strong> Statements<br />
Investments:<br />
Alternative<br />
Total<br />
Currency Debt Equity Investments Derivatives Fair Value<br />
Australian Dollar $ 970,403 $ 734,955,748 $ $ (185,134) $ 735,741,017<br />
Botswana Pula 4,854,270 4,854,270<br />
Brazilian Real 975,801,805 975,801,805<br />
Canadian Dollar 1,805,333 1,085,102,548 (102,345) 1,086,805,536<br />
Chilean Peso 72,413,682 72,413,682<br />
Colombian Peso 18,664,609 18,664,609<br />
Croatian Kuna 5,492,938 5,492,938<br />
Czech Koruna 33,602,172 33,602,172<br />
Danish Krone 108,178,032 108,178,032<br />
Egyptian Pound 50,697,112 50,697,112<br />
Euro 6,434,602 2,816,038,728 2,606,298,201 (149,425) 5,428,622,106<br />
Ghanaian Cedi 3,942,575 3,942,575<br />
Hong Kong Dollar 1,713,190,010 104,117 1,713,294,127<br />
Hungarian Forint 49,021,599 49,021,599<br />
Indian Rupee 826 394,122,977 394,123,803<br />
Indonesian Rupiah 360,574,376 360,574,376<br />
Israeli Shekel 53,365,729 53,365,729<br />
Japanese Yen 2,294,525,774 33,346 2,294,559,120<br />
Jordanian Dinar 6,821,148 6,821,148<br />
Kenyan Shilling 4,785,483 4,785,483<br />
Malaysian Ringgit 181,502,632 22,803 181,525,435<br />
Mauritius Rupee 6,128,271 6,128,271<br />
Mexican Peso 365,497,667 365,497,667<br />
Moroccan Dirham 15,258,678 15,258,678<br />
New Turkish Lira 213,649,668 213,649,668<br />
New Zealand Dollar 12,062,793 12,062,793<br />
Nigerian Naira 6,353,387 6,353,387<br />
Norwegian Krone 175,154,778 175,154,778<br />
Pakistan Rupee 15,935,578 15,935,578<br />
Peruvian Nuevo Sol 4,820,829 4,820,829<br />
Philippine Peso 53,071,305 53,071,305<br />
Polish Zloty 81,070,934 81,070,934<br />
Pound Sterling 2,561,891,922 156,010,516 177,552 2,718,079,990<br />
Qatar Riyal 18,594,074 18,594,074<br />
Romanian Leu 3,033,513 3,033,513<br />
Singapore Dollar 140,801,095 140,801,095<br />
South African Rand 681,707,169 681,707,169<br />
South Korean Won 1,181,566,847 1,181,566,847<br />
Swedish Krona 3,039,295 255,089,705 (380,861) 257,748,139<br />
Swiss Franc 1,026,733,478 24,460 1,026,757,938<br />
Taiwan Dollar 656,628,491 656,628,491<br />
Thai Baht 255,884,007 255,884,007<br />
United Arab Emirates Dirham 11,134,450 11,134,450<br />
Total Investments Subject<br />
to Foreign Currency Risk $ 12,250,459 $ 18,709,722,586 $ 2,762,308,717 $ (455,487) $ 21,483,826,275<br />
H. SECURITIES LENDING<br />
The system is authorized by Texas Government Code, Section 825.303 to contractually lend securities to borrowers in accordance<br />
with policy established by the board of trustees and as required by statute. The system has a contract with State Street Bank and Trust<br />
Company to administer its securities lending program for domestic and international equity and fixed income securities. Authorized<br />
collateral for the program consists of cash or government securities eligible for book entry in either the Federal Reserve System or<br />
Participants Trust Company. The required collateral is based upon the lent security’s fair value plus accrued income. At a loan’s inception,<br />
the value of the collateral must be at least 102% of the value of domestic lent securities and at least 105% for international lent<br />
54 FINANCIAL SECTION
TEACHER RETIREMENT SYSTEM OF TEXAS COMPREHENSIVE ANNUAL FINANCIAL REPORT <strong>2011</strong><br />
Notes to the <strong>Financial</strong> Statements<br />
securities. Collateral is marked to market daily, and in the case it falls below 100% for domestic or 105% for international, it is reinstated<br />
to the original requirements by the borrower.<br />
Cash collateral can be invested in a cash collateral pool, U.S. government or U.S. government sponsored entity securities, time deposits,<br />
bank certificates of deposit, bankers’ acceptances, master notes, repurchase agreements, bank and corporate notes, commercial<br />
paper, asset backed securities, and derivative instruments. The system’s policies for securities lending provide investment guidelines for<br />
different asset classes to limit its exposure to different types of risks.<br />
The par value, dollar-weighted average maturity of the collective cash collateral investment may not exceed 120 days. The expected<br />
final maturity of any individual fixed-rate instrument has a limit of 36 months and any floating-rate instrument has a limit of seven years.<br />
Each instrument having a maturity of 13 months or less at the time of purchase must qualify as “first tier securities” within Rule<br />
2a-7 under the Investment Company Act of 1940 and any instrument over 13 months must be rated within the highest major, long-term<br />
rating category of an NRSRO, or, if unrated, be determined to be of comparable quality by the trustees.<br />
The system does not have a formal custodial credit risk policy relating to its securities lending program. All cash collateral received is<br />
invested in an unrated cash collateral pool held by the counterparty, the system’s securities lending agent and is not exposed to custodial<br />
credit risk. The following table shows the underlying securities for non-cash collateral loans which are also held by the counterparty, the<br />
securities lending agent, but not in the system’s name and are not insured.<br />
Investment Type<br />
Fair Value<br />
U.S. Government Obligations $ 254,803,385<br />
Domestic Equities 20,483,793<br />
International Equities 8,334,579<br />
Total $ 283,621,757<br />
The system earns income from fees paid by the borrowers and interest earned from investing the cash collateral. The contract<br />
requires the custodian to indemnify the system if the borrower fails to return the securities or income distributions made while the<br />
securities are on loan. Non-cash collateral cannot be pledged or sold unless the borrower defaults. Substantially all securities loans can<br />
be terminated on demand either by the system or the borrower, although, as of August 31, <strong>2011</strong>, the weighted average term of these<br />
loans was 8 days. As of August 31, <strong>2011</strong>, the weighted average maturity of the invested cash collateral was 31 days, and there was<br />
no credit risk exposure to borrowers because the amounts owed to borrowers exceeded the amounts owed to the system. During the<br />
year there were no borrower or custodian default losses and no recoveries of prior period losses. Authorized borrowers have specific<br />
limits that vary from $50 million to $5.5 billion. During fiscal year <strong>2011</strong>, one of <strong>TRS</strong>’ approved borrowers exceeded their borrowing limit.<br />
At all times, the loan was sufficiently collateralized and no losses were incurred. The borrower was brought into full compliance with its<br />
borrowing limit within 20 days and the exception was presented to the Compliance Committee of the <strong>TRS</strong> Board. During the year, there<br />
were no other significant violations of contractual provisions. The total market value of all loans cannot exceed 30% of the portfolio.<br />
The following table represents the fair market values of the securities lending transactions based on type of collateral received as<br />
of August 31, <strong>2011</strong>.<br />
Cash Non-Cash Total<br />
Securities on Loan $ 22,119,226,323 $ 283,621,757 $ 22,402,848,080<br />
Collateral Received $ 22,748,923,912 $ 289,961,257 $ 23,038,885,169<br />
Reinvested Collateral $ 22,760,168,002 $ 22,760,168,002<br />
For fiscal year <strong>2011</strong>, the system earned income of $79,452,915 from securities lending.<br />
I. OTHER INVESTMENTS AND CONTINGENT COMMITMENTS<br />
The system’s investment derivative instruments include provisions that require the system to post collateral in the event that the fair<br />
value surpasses a specified contractual threshold. At August 31, <strong>2011</strong>, the aggregate fair value of all investment derivative instruments<br />
with these collateral posting provisions is ($93,266,114). If the collateral posting thresholds of all these investment derivative instruments<br />
did not exist at August 31, <strong>2011</strong>, the system would be required to post the aggregate amount of $173,448,571 in collateral to<br />
its counterparties. Where none of the contractual thresholds were surpassed, the system has posted no collateral at August 31, <strong>2011</strong>.<br />
The system’s investments in certain limited partnerships commit the system to possible future capital contributions. At August 31,<br />
<strong>2011</strong>, the remaining commitment was $14,305,596,488.<br />
FINANCIAL SECTION<br />
55
TEACHER RETIREMENT SYSTEM OF TEXAS COMPREHENSIVE ANNUAL FINANCIAL REPORT <strong>2011</strong><br />
Notes to the <strong>Financial</strong> Statements<br />
NOTE 4: EMPLOYEE COMPENSABLE LEAVE<br />
Salary costs related to employees’ rights to be compensated for leave balances are accrued as expenses of the period in which the<br />
services were rendered. Accumulated compensable leave liabilities are reported in the Statement of Fiduciary Net Assets for the Pension<br />
and Other Employee Benefit Trust Funds and in the Statement of Net Assets for the Enterprise Funds. The employees’ compensable<br />
leave activity for fiscal year <strong>2011</strong> is shown in the table below.<br />
Beginning Ending Amounts Due Amounts<br />
Balance Balance Within One Due<br />
09/01/10 Additions Reductions 08/31/11 Year Thereafter<br />
Fiduciary Funds:<br />
Pension Trust Fund $ 5,361,881 $ 4,496,542 $ (5,239,668) $ 4,618,755 $ 2,656,156 $ 1,962,599<br />
<strong>TRS</strong>-Care<br />
(Retired Plan) 177,056 200,724 (194,257) 183,523 116,228 67,295<br />
Proprietary Funds<br />
<strong>TRS</strong>-ActiveCare 115,734 134,934 (123,496) 127,172 80,504 46,668<br />
403(b) Certification<br />
Program 17,225 17,702 (21,738) 13,189 8,501 4,688<br />
Total $ 5,671,896 $ 4,849,902 $ (5,579,159) $ 4,942,639 $ 2,861,389 $ 2,081,250<br />
NOTE 5: OPERATING LEASES<br />
In fiscal year 2009, <strong>TRS</strong> entered into a non-cancelable operating lease agreement for building space which expires March 31, 2015.<br />
As part of the building lease, <strong>TRS</strong> received one month of rent abatement, a construction allowance, and an additional allowance. The<br />
rent abatement, construction allowance, and additional allowance are being amortized on a straight-line basis over the life of the lease<br />
as a reduction of rental expenses.<br />
Rental expenses related to the lease for the fiscal year ended August 31, <strong>2011</strong> for the Pension Trust Fund were $1,693,775 and<br />
include amortization of deferred rent of $674,345.<br />
The future minimum lease payments for the next four years are as follows:<br />
Fiscal Year<br />
Ending<br />
Amount<br />
August 31, 2012 $ 1,726,423<br />
August 31, 2013 1,773,457<br />
August 31, 2014 1,821,274<br />
August 31, 2015 1,061,742<br />
Total $ 6,382,896<br />
NOTE 6: FRINGE BENEFITS PAID BY THE STATE OF TEXAS AND THE<br />
FEDERAL GOVERNMENT<br />
The state has a joint contributory retirement plan for substantially all its employees. The employees of <strong>TRS</strong> participate in the same<br />
plan they administer (Note 12).<br />
For the fiscal year ended August 31, <strong>2011</strong>, the state provided retirement contributions of $108,440 on behalf of employees paid from<br />
<strong>TRS</strong>-Care (Retired Plan). In the Enterprise Funds, the state provided on behalf retirement contributions of $67,373 for <strong>TRS</strong>-ActiveCare<br />
and $7,898 for the 403(b) Certification Program.<br />
Although these fringe benefits were not paid by these funds, GASB Statement No. 24 requires recognition of these benefits as<br />
expenses of the programs, with offsetting revenues recorded.<br />
56 FINANCIAL SECTION
TEACHER RETIREMENT SYSTEM OF TEXAS COMPREHENSIVE ANNUAL FINANCIAL REPORT <strong>2011</strong><br />
Notes to the <strong>Financial</strong> Statements<br />
Federal legislation enacted in January 2006 established prescription drug coverage for Medicare beneficiaries known as Medicare<br />
Part D. One of the provisions of Medicare Part D provided retiree drug subsidy reimbursements to <strong>TRS</strong>-Care on behalf of certain plan<br />
participants totaling $66,258,009 for the fiscal year ended August 31, <strong>2011</strong>.<br />
The Patient Protection and Affordable Care Act, signed into law on March 23, 2010, along with the Health Care and Education Affordability<br />
Reconciliation Act of 2010, signed into law on March 30, 2010 (together, the PPACA), embody sweeping federal health care<br />
legislation. Under the PPACA, <strong>TRS</strong>-Care received $70,629,796 for the fiscal year ended August 31, <strong>2011</strong> from the U.S. Department of<br />
Health and Human Services for participation in the Early Retiree Reinsurance Program, a program that went into effect June 1, 2010.<br />
The program reimburses participating plans for a portion of health benefit costs for retirees age 55 and older who are not eligible for<br />
Medicare, and their spouses, surviving spouses, and dependents.<br />
NOTE 7: DEFERRED COMPENSATION<br />
Employees of the system may elect to defer a portion of their earnings for income tax and investment purposes pursuant to authority<br />
granted in the Tex. Gov. Code Ann., Sec. 609.001. Two plans are available for employees. Both plans are administered by the Employees<br />
Retirement System. The system has no additional or unfunded liability for this program.<br />
NOTE 8: CONTINGENT LIABILITIES<br />
Sick leave, the accumulation of which is unlimited, is earned at the rate of eight hours per month and is taken only in the event of<br />
illness or paid to the estate of an employee in the event of death. The maximum sick leave that may be paid to an employee’s estate<br />
is one-half of the employee’s accumulated entitlement or 336 hours, whichever is less. The system’s policy is to recognize the cost of<br />
any sick leave when paid.<br />
A Performance Incentive Compensation Plan was adopted effective July 1, 2006, to enable the system to remain competitive in<br />
its efforts to attract, retain and motivate high caliber investment division staff. The July 1, 2006 Plan was terminated by the board of<br />
trustees September 13, 2007, and a new Plan was adopted effective October 1, 2007 and modified effective October 1, 2008. The<br />
purpose of the Plan is to provide the opportunity for investment division employees to earn performance incentive pay based on the<br />
fund’s investment performance and the employee’s job performance. As of August 31, <strong>2011</strong>, the liability is estimated not to exceed<br />
$5.8 million for the first half of the incentive plan year ending September 30, <strong>2011</strong>. Payments can only be earned following years in<br />
which the fund experiences a positive return, and employees must be employed by <strong>TRS</strong> on the designated dates in the Plan to earn and<br />
receive payment. The board of trustees may cancel or modify the Plan at any time.<br />
The system is contingently liable for benefits payable to retiring members who remain in a pending status longer than 30 days after<br />
fiscal year end.<br />
In addition, under Texas Insurance Code, Article 3.51-7, the system is contingently liable to pay a lump sum death benefit not to<br />
exceed $5,000 when added to the death benefit authorized under Texas Government Code, Title 8, Chapter 824, to the beneficiaries of<br />
deceased, retired employees.<br />
<strong>TRS</strong> is a defendant in litigation involving issues arising from its normal activities. The outcome of this litigation cannot be determined<br />
at this time. Based upon consultation with legal counsel, management believes there will be no material adverse effect on the basic<br />
financial statements as a result of the ultimate outcome of these matters.<br />
NOTE 9: CONTINUANCE SUBJECT TO REVIEW<br />
As provided by Texas Government Code, Title 8, Section 825.006, “The board of trustees of the Teacher Retirement System of<br />
Texas is subject to review under Chapter 325 (Texas Sunset Act), but is not abolished under that chapter. The board shall be reviewed<br />
during the period in which state agencies abolished in 2019, and every 12th year after that year, are reviewed.”<br />
NOTE 10:<br />
POST-EMPLOYMENT HEALTH CARE BENEFITS<br />
A. PLAN DESCRIPTION<br />
<strong>TRS</strong> Employees<br />
Employees of the system who retire with 10 or more years of eligible service credit and meet the Rule of 80 or are at least 65 years<br />
of age continue to receive health care and basic life insurance benefits through the Group Benefits Program of the State Retiree Health<br />
Plan (SRHP) in accordance with Texas Insurance Code, Chapter 1551. The SRHP is maintained and administered through the Employees<br />
Retirement System (ERS) of Texas and is considered a cost-sharing, multiple-employer, defined benefit post-employment health care plan.<br />
ERS issues a publicly available financial report that includes financial statements and required supplementary information for the SRHP.<br />
FINANCIAL SECTION<br />
57
TEACHER RETIREMENT SYSTEM OF TEXAS COMPREHENSIVE ANNUAL FINANCIAL REPORT <strong>2011</strong><br />
Notes to the <strong>Financial</strong> Statements<br />
That report may be obtained by visiting the ERS website at www.ers.state.tx.us, by writing to the Finance Division of the Employees<br />
Retirement System of Texas at 200 East 18th Street, Austin, Texas 78701, or by calling 1-877-275-4377.<br />
Benefits and contribution provisions of the SRHP are not actuarially determined, but are authorized by state law and may be amended<br />
by the Texas Legislature. For the year ended August 31, <strong>2011</strong>, the system contributed up to a maximum monthly amount on a pay-asyou-go<br />
basis toward a retiree’s health and basic life insurance premiums as follows:<br />
Employer Contribution Rates<br />
Retiree Health and Basic Life Premium<br />
Type of Coverage FY <strong>2011</strong> FY 2010 FY 2009<br />
Member Only $ 411.04 $ 385.38 $ 360.54<br />
Member/Spouse $ 647.38 $ 605.70 $ 566.57<br />
Member/Children $ 569.30 $ 532.90 $ 498.49<br />
Member/Family $ 805.64 $ 753.22 $ 704.52<br />
The system covers 100% of a Member Only premium and 50% of their additional premiums for family coverage. The basic plan<br />
includes up to $2,500 for life insurance for the retiree. The retiree contributes any premium over and above the system’s contribution<br />
for additional coverage. The board has adopted contributions based on rates set by the Texas Legislature on a biennial basis. At August<br />
31, <strong>2011</strong>, there were 173 retirees and their beneficiaries receiving post-employment health care and basic life insurance benefits.<br />
Contractually required contributions to the SRHP are currently based on the annual pay-as-you-go expenses of the SRHP. For the year<br />
ended August 31, <strong>2011</strong>, 2010, and 2009 the system recognized expenditures of $1,113,697, $996,954 and $908,334, respectively, for<br />
these benefits. The system has annually made 100 percent of its contractually required contributions to the SRHP.<br />
Public School Employees<br />
<strong>TRS</strong>, as trustee, administers the Texas Public School Retired Employees Group Insurance Program (<strong>TRS</strong>-Care) and the related fund<br />
in accordance with Texas Insurance Code, Chapter 1575. Sections 1575.202 to 204 establish state, active employee, and public school<br />
contributions. Section 1575.052 grants the board the authority to establish basic and optional group insurance coverage for participants.<br />
<strong>TRS</strong>-Care is a cost-sharing, multiple-employer, defined benefit, other post-employment benefit (OPEB) plan that is currently funded<br />
on a pay-as-you-go basis and is subject to change based on available funding. The Texas Legislature determines the funding of benefits<br />
and has no continuing obligation to provide benefits beyond each fiscal year.<br />
At the inception of the plan in fiscal year 1986, funding was projected to last 10 years through fiscal year 1995. The original funding<br />
was sufficient to maintain the solvency of the fund through fiscal year 2000. Since that time, appropriations and contributions have been<br />
established to be sufficient to provide benefits for the biennium.<br />
Eligibility generally includes <strong>TRS</strong> public school retirees with more than 10 years of service and their dependents. Retirees can<br />
receive a free basic level of coverage, and optional coverage is also available. All dependent coverage is optional. Basic coverage is a<br />
comprehensive major medical group health insurance plan. During fiscal year <strong>2011</strong>, deductibles were $1,800 for those eligible for Part<br />
A of Medicare, $3,000 for those not eligible for Part A, but eligible for Part B, and $4,000 for those not eligible for either Part A or Part B.<br />
At August 31, <strong>2011</strong>, the number of reporting entities was:<br />
Independent School Districts 1,029*<br />
Charter Schools 197<br />
Regional Education Service Centers 20<br />
Education Districts 5<br />
Total 1,251<br />
*Excludes Windham School District which is not covered by OPEB.<br />
In addition, other contributing entities included the State of Texas and the Federal Government.<br />
58 FINANCIAL SECTION
TEACHER RETIREMENT SYSTEM OF TEXAS COMPREHENSIVE ANNUAL FINANCIAL REPORT <strong>2011</strong><br />
Notes to the <strong>Financial</strong> Statements<br />
At August 31, <strong>2011</strong>, OPEB membership before actuarial adjustments consisted of the following:<br />
Retirees and beneficiaries<br />
receiving benefits 179,877*<br />
Active plan members 681,457<br />
Total 861,334<br />
*Excludes 6,182 dependent children<br />
B. CONTRIBUTIONS<br />
Funding for free basic coverage is provided by the program based upon public school district payroll. The State of Texas, active<br />
public school employee and reporting entities contribution rates and amounts collected are reflected in the table below for fiscal year<br />
<strong>2011</strong>. Per Texas Insurance Code, Chapter 1575, the public school contribution may not be less than 0.25% or greater than 0.75% of the<br />
salary of each active employee of the public school. Funding for optional coverage is provided by those participants selecting the optional<br />
coverage. Actuarial implications of the overall funding are determined by the system’s actuary.<br />
Contribution<br />
Rate<br />
Amount<br />
Active Employee .65% $ 183,808,580<br />
State 1.00 257,105,886<br />
<strong>Report</strong>ing Entities .55 155,471,641<br />
Federal or Private Funding Sources 1.00 25,784,985<br />
Total $ 622,171,092<br />
C The contributions shown above and premium contributions of $345,164,271 contribute toward the total plan expenditures of<br />
$1,039,738,174. Expenses for <strong>TRS</strong>-Care are recognized as retirees report claims and include a provision for estimated claims incurred<br />
but not yet received.<br />
The actuarial valuation as of August 31, <strong>2011</strong>, is similar to the actuarial valuations performed for the pension plan; however, certain<br />
economic and behavioral assumptions are unique to medical benefits. The demographic assumptions are identical to those used in the<br />
August 31, <strong>2011</strong> valuation for the pension plan.<br />
Additional valuation information follows:<br />
Valuation Date August 31, <strong>2011</strong><br />
Actuarial Cost Method<br />
Projected Unit Credit<br />
Amortization Method<br />
Level Percent, Open<br />
Remaining Amortization Period<br />
30 Years<br />
Asset Valuation Method<br />
Market<br />
Actuarial Assumptions:<br />
Investment Rate of Return * 5.25 %<br />
Projected Salary Increases * 4.25% to 7.25 %<br />
Weighted-Average at Valuation Date 5.62 %<br />
Payroll Growth Rate 3.50 %<br />
Health Care Trend Rates * 10.00% to 4.25 %**<br />
* Includes Inflation at 3.00%<br />
** .Initial rates are 10% for medical and 9.5% for prescriptions. The ultimate rate is 4.25% for both<br />
medical and prescriptions.<br />
FINANCIAL SECTION<br />
59
TEACHER RETIREMENT SYSTEM OF TEXAS COMPREHENSIVE ANNUAL FINANCIAL REPORT <strong>2011</strong><br />
Notes to the <strong>Financial</strong> Statements<br />
The results of the actuarial valuation reflect a long-term perspective, are dependent on the actuarial assumptions used, and are<br />
subject to continual revision as actual results are compared to past expectations and new estimates are made about the future. Actual<br />
results can differ, as actual experience deviates from the assumptions. Even seemingly minor changes in the assumptions can materially<br />
change the liabilities, calculated contribution rates and funding periods. The actuarial assumptions used are designed to reduce shortterm<br />
volatility in the liabilities and assets.<br />
The plan provisions used in the actuarial valuation are based on the expectations of cost sharing between the employer and plan<br />
members. The calculations are based on the benefits provided under the terms of the substantive plan in effect at the time of the valuation<br />
and on the pattern of sharing of costs between the employer and plan members to that point. The projection of the benefits for<br />
financial reporting does not explicitly incorporate the potential effects of legal or contractual funding limitations on the pattern of cost<br />
sharing between the employer and plan members in the future.<br />
C. FUNDED STATUS AND FUNDING PROGRESS – OPEB PLAN<br />
See <strong>TRS</strong>-Care funded status below (dollar amounts in millions):<br />
(7)<br />
(3) (4) (5) UAAL as<br />
(1) (2) Actuarial Unfunded Funded Ratio (6) a % of<br />
Valuation Actuarial Accrued AAL Assets as a <strong>Annual</strong> Covered<br />
as of Value Liability (UAAL) % of AAL Covered Payroll<br />
August 31 of Assets (AAL) (3)-(2) (2)/(3) Payroll (4)/(6)<br />
<strong>2011</strong> $891 $29,785 $28,894 3.0% $30,515 95%<br />
The Schedule of Funding Progress located immediately following the Notes to the <strong>Financial</strong> Statements in the Required Supplementary<br />
Information (RSI) presents multi-year trend information about whether the actuarial value of plan assets is increasing or decreasing<br />
relative to the actuarial accrued liability for benefits paid. The required schedule reflects information beginning for the fiscal year ended<br />
August 31, 2007 as it was the date of the first actuarial valuation for <strong>TRS</strong>-Care.<br />
NOTE 11:<br />
RISK MANAGEMENT<br />
The 77th Texas Legislature enacted the Texas Active School Employees Uniform Group Benefits Act (H.B. 3343), establishing a new<br />
statewide health coverage program for public school employees and their dependents. <strong>TRS</strong> began administering this program, known<br />
as <strong>TRS</strong>-ActiveCare, September 1, 2002. The plan is available to all public school districts, charter schools, education service centers<br />
and certain other employers. The risk associated with this program is retained by the plan’s participants, and no risk is transferred to<br />
the plan’s administrators, to employers, or to the state.<br />
NOTE 12:<br />
PENSION DISCLOSURE<br />
A. PLAN DESCRIPTION<br />
<strong>TRS</strong> is the administrator of a multiple-employer public employee retirement system (PERS). It is a cost-sharing PERS with one<br />
exception: risks and costs are generally not shared by the employing district but are the liability of the State of Texas. That is, unless<br />
the employing district is a senior college, medical school, or state agency, in which case the employer is considered the State of Texas.<br />
By statute, the State of Texas contributes to the retirement system an amount equal to the current authorized rate times the aggregate<br />
annual compensation of all members of the pension trust fund during that fiscal year. However, for fiscal year <strong>2011</strong> the Pension Trust<br />
Fund paid the employer’s share for its own employees.<br />
For members of the system entitled to the minimum salary for certain school personnel under Section 21.402 Education Code, the<br />
employing district shall pay the state’s contribution on the portion of the member’s salary that exceeds the statutory minimum.<br />
60 FINANCIAL SECTION
TEACHER RETIREMENT SYSTEM OF TEXAS COMPREHENSIVE ANNUAL FINANCIAL REPORT <strong>2011</strong><br />
Notes to the <strong>Financial</strong> Statements<br />
At August 31, <strong>2011</strong>, the number of reporting entities was as follows:<br />
Independent School Districts 1,030<br />
Charter Schools 197<br />
Community and Junior Colleges 51<br />
Senior Colleges and Universities 46<br />
Regional Education Service Centers 20<br />
Education Districts 5<br />
Medical and Dental Schools 9<br />
State Agencies 2<br />
Total 1,360<br />
All employees of public, state-supported educational institutions in Texas who are employed for one-half or more of the standard<br />
work load and who are not exempted from membership under Texas Government Code, Title 8, Section 822.002, are covered by the<br />
system.<br />
At August 31, <strong>2011</strong>, <strong>TRS</strong> gross membership before actuarial adjustments consisted of the following:<br />
Retirees and beneficiaries currently<br />
receiving benefits 312,680<br />
Terminated employees entitled to<br />
benefits but not yet receiving them 64,703<br />
Total 377,383<br />
Current Active Members:<br />
Fully-Vested 588,694<br />
Non-Vested 368,698<br />
Total 957,392<br />
Benefits are established primarily under the authority of the provisions of Texas Constitution, Article XVI, Section 67 and Texas<br />
Government Code, Title 8, Subtitle C. The normal service retirement is at age 65 with 5 years of credited service or when the sum of<br />
the member’s age and years of credited service equals or exceeds 80 years. Reduced service retirement is at age 55 with 5 years of<br />
credited service and any age below 50 with 30 years of credited service. A member is fully vested after 5 years of creditable service<br />
and entitled to any benefit for which eligibility requirements have been met.<br />
B. CONTRIBUTIONS<br />
Contribution requirements are not actuarially determined but are established pursuant to the following state funding policy: (1)<br />
The state constitution requires the legislature to establish a member contribution rate of not less than 6% of the member’s annual<br />
compensation and a state contribution rate of not less than 6% and not more than 10% of the aggregate annual compensation of all<br />
members of the system during the fiscal year; (2) state statute prohibits benefit improvements, if as a result of the particular action, the<br />
time required to amortize <strong>TRS</strong>’ unfunded actuarial liabilities would be increased to a period that exceeds 31 years, or, if the amortization<br />
period already exceeds 31 years, the period would be increased by such action. Actuarial implications of the funding provided in this<br />
manner are determined by the system’s actuary.<br />
Current contribution rates and contributions for fiscal year <strong>2011</strong> are shown in the table on the following page. For fiscal years 2010-<br />
11 the State of Texas contribution rate was 6.644% and in 2009 the state’s rate was 6.58%. The member contribution rate was 6.4% for<br />
fiscal years 2009-<strong>2011</strong>. These rates are set by the General Appropriations Act. In certain instances, the reporting entity (public school,<br />
college, university, medical school or other entity) is required to make all or a portion of the state’s and/or member’s contribution.<br />
FINANCIAL SECTION<br />
61
TEACHER RETIREMENT SYSTEM OF TEXAS COMPREHENSIVE ANNUAL FINANCIAL REPORT <strong>2011</strong><br />
Notes to the <strong>Financial</strong> Statements<br />
Contribution<br />
Rate<br />
Amount<br />
Member 6.400% $ 2,243,954,725<br />
State 6.644 1,595,771,774<br />
<strong>Report</strong>ing Entities 6.644 411,889,817<br />
Federal or Private Funding Sources 6.644 324,764,720<br />
Total $ 4,576,381,036<br />
Effective September 1, 2007, H.B. 2358, 80th Legislature, amended Section 825.406(b) of the Government Code and Section<br />
1575.252 of the Insurance Code, requiring that contributions received by an employer from federal or private funding sources be deposited<br />
in the state contribution account and in the retired school employees group insurance fund (relates to OPEB see Note 10) of <strong>TRS</strong>,<br />
respectively, instead of the general revenue fund of the state treasury.<br />
C. LEGAL RESERVE ACCOUNT BALANCES<br />
The balances in the five legally required reserve accounts are sufficient to meet statutory requirements. As of August 31, <strong>2011</strong> the<br />
reserve accounts had the following balances:<br />
Member Savings Account $ 29,150,974,343<br />
State Contribution Account 15,672,128,723<br />
Retired Reserve Account 62,479,240,823<br />
Deferred Retirement Option Account 83,931,941<br />
Expense Account 34,511,063<br />
Total (Exhibit I) $107,420,786,893<br />
D. FUNDED STATUS AND FUNDING PROGRESS – PENSION PLAN<br />
The funded status of the Pension Trust Fund as of August 31, <strong>2011</strong>, the most recent actuarial valuation date, is as follows (dollar<br />
amounts in millions):<br />
(7)<br />
(3) (4) (5) UAAL as<br />
(1) (2) Actuarial Unfunded Funded Ratio (6) a % of<br />
Valuation Actuarial Accrued AAL Assets as a <strong>Annual</strong> Covered<br />
as of Value Liability (UAAL) % of AAL Covered Payroll<br />
August 31 of Assets (AAL) (3)-(2) (2)/(3) Payroll (4)/(6)<br />
<strong>2011</strong> $115,253 $139,315 $24,062 82.7% $36,797 65.4%<br />
The Schedule of Funding Progress located immediately following the Notes to the <strong>Financial</strong> Statements in the Required Supplementary<br />
Information (RSI) presents multi-year trend information about whether the actuarial value of plan assets is increasing or decreasing over<br />
time. These indicators and trends may be useful in assessing progress made in accumulating sufficient assets to pay benefits when due<br />
for the Pension Trust Fund.<br />
62 FINANCIAL SECTION
TEACHER RETIREMENT SYSTEM OF TEXAS COMPREHENSIVE ANNUAL FINANCIAL REPORT <strong>2011</strong><br />
Notes to the <strong>Financial</strong> Statements<br />
Additional actuarial valuation information follows:<br />
NOTE 13:<br />
Valuation Date...............................................................................August 31, <strong>2011</strong><br />
Actuarial Cost Method................................................................ Entry Age Normal<br />
Amortization Method...............................................................Level Percent, Open<br />
Remaining Amortization Period * ............................................................. 30 Years<br />
Asset Valuation Method...................................................5-Year Smoothed Market<br />
Actuarial Assumptions:<br />
Investment Rate of Return **...................................................................8.00%<br />
Projected Salary Increases **....................................................4.25% to 7.25%<br />
Weighted-Average Projected Salary Increases **....................................5.62%<br />
Cost-of-Living Adjustments....................................................................... None<br />
* .The state’s contribution rate would need to increase from 6.00% to 8.13% beginning in fiscal<br />
year 2012 in order to amortize the unfunded actuarial accrued liability (UAAL) over the 30-year<br />
maximum acceptable amortization period permitted by Governmental Accounting Standards Board<br />
Statement No. 25.<br />
** Includes Inflation at 3.00%<br />
SUBSEQUENT EVENTS<br />
Under the Patient Protection and Affordable Care Act of 2010 <strong>TRS</strong>-Care has been approved for participation in the Early Retiree<br />
Reinsurance Program. (See Note 6 for amounts received during fiscal year <strong>2011</strong>.) While funds remain available, reimbursements under<br />
the program will be provided for 80 percent of qualified costs between $15,000 and $90,000. <strong>TRS</strong> estimates that its additional claim for<br />
fiscal year ended August 31, <strong>2011</strong> will be approximately $98.7 million. However, because of the uncertainty surrounding the availability<br />
of funds, <strong>TRS</strong> cannot reasonably estimate the amount, if any, it will actually receive. As of November 10, <strong>2011</strong>, <strong>TRS</strong> has not received<br />
any additional funds attributable to this program.<br />
FINANCIAL SECTION<br />
63
TEACHER RETIREMENT SYSTEM OF TEXAS COMPREHENSIVE ANNUAL FINANCIAL REPORT <strong>2011</strong><br />
SCHEDULE OF FUNDING PROGRESS<br />
Required Supplementary Information<br />
PENSION TRUST FUND<br />
FISCAL YEARS 2006-<strong>2011</strong><br />
Taking into account only the dollar amounts of aggregate actuarial accrued liabilities and unfunded actuarial accrued liabilities<br />
(UAAL) can be misleading. The dollar amounts of these two items can be increasing at a time when their actual substance may<br />
be decreasing. Dividing valuation asset dollars by aggregate actuarial accrued liability dollars and dividing UAAL dollars by active<br />
member payroll dollars provide clarifying indices. The larger the ratio of valuation assets to aggregate actuarial accrued liabilities,<br />
the stronger the system. Observation of these relative indices over a period of years will give an indication of whether the system<br />
is becoming stronger or weaker.<br />
(DOLLAR AMOUNTS SHOWN IN MILLIONS)<br />
(7)<br />
(3) (4) (5) UAAL as<br />
(1) (2) Actuarial Unfunded Funded Ratio (6) a % of<br />
Valuation Actuarial Accrued AAL Assets as a <strong>Annual</strong> Covered<br />
as of Value Liability (UAAL) % of AAL Covered Payroll<br />
August 31 of Assets (AAL) (3)-(2) (2)/(3) Payroll (4)/(6)<br />
2006 $ 94,218 $ 107,912 $ 13,694 87.3% $ 28,397 48.2%<br />
2007 103,419 115,964 12,545 89.2 31,114 40.3<br />
2008 110,233 121,756 11,523 90.5 33,238 34.7<br />
2009 106,384 128,030 21,646 83.1 35,097 61.7<br />
2010 111,293 134,191 22,898 82.9 36,629 62.5<br />
<strong>2011</strong> 115,253 139,315 24,062 82.7 36,797 65.4<br />
SCHEDULE OF CONTRIBUTIONS FROM STATE AND REPORTING ENTITIES<br />
State and <strong>Report</strong>ing Entities <strong>Annual</strong> Required Contributions (ARC)<br />
Fiscal From State Percentage<br />
Year ARC From State Federal Funds/ From <strong>Report</strong>ing of ARC<br />
Ended Rate General Fund Private Grants Entities Total Contributed<br />
2006 7.19% $ 1,596,301,608 $ $ 316,538,818 $ 1,912,840,426 83%<br />
2007 7.02 1,721,223,689 324,945,946 2,046,169,635 85<br />
2008 6.47 1,426,771,115 247,210,170 346,051,153 2,020,032,438 102<br />
2009 6.10 1,373,745,903 255,108,385 380,362,287* 2,009,216,575* 108<br />
2010 7.72 1,829,819,802 356,466,503 475,562,176 2,661,848,481 86<br />
<strong>2011</strong> 7.77 1,866,217,141 379,804,617 481,695,346 2,727,717,104 86<br />
*Calculation revision from fiscal year 2009 CAFR.<br />
64 FINANCIAL SECTION
TEACHER RETIREMENT SYSTEM OF TEXAS COMPREHENSIVE ANNUAL FINANCIAL REPORT <strong>2011</strong><br />
Required Supplementary Information<br />
<strong>TRS</strong>-CARE (RETIRED PLAN)<br />
SCHEDULE OF FUNDING PROGRESS<br />
FISCAL YEARS 2007-<strong>2011</strong><br />
(DOLLAR AMOUNTS SHOWN IN MILLIONS)<br />
(7)<br />
(3) (4) (5) UAAL as<br />
(1) (2) Actuarial Unfunded Funded Ratio (6) a % of<br />
Valuation Actuarial Accrued AAL Assets as a <strong>Annual</strong> Covered<br />
as of Value Liability (UAAL) % of AAL Covered Payroll<br />
August 31 of Assets (AAL) (3)-(2) (2)/(3) Payroll (4)/(6)<br />
2007 $ 623 $ 19,748 $ 19,125 3.2% $ 26,076 73%<br />
2008 729 22,313 21,584 3.3 27,979 77<br />
2009 800 24,357 23,557 3.3 29,490 80<br />
2010 815 25,808 24,993 3.2 30,758 81<br />
<strong>2011</strong> 891 29,785 28,894 3.0 30,515 95<br />
SCHEDULE OF CONTRIBUTIONS FROM EMPLOYERS AND OTHER CONTRIBUTING ENTITIES<br />
(DOLLAR AMOUNTS SHOWN IN THOUSANDS)<br />
<strong>Annual</strong> Required Contributions<br />
Actual Contributions<br />
(2) (5)<br />
(1) <strong>Annual</strong> (4) On-Behalf (7)<br />
Fiscal Required (3) From From (6) Percentage<br />
Year Contributions From <strong>Report</strong>ing Federal Total Contributed<br />
Ended (ARC) State Entities Government (3)+(4)+(5) (6)/(2)<br />
2007 $ 1,436,756 $ 238,191 $ 136,009 $ 52,330 $ 426,530 29.7%<br />
2008 1,535,975 254,722 141,673 59,486 455,881 29.7<br />
2009 1,655,647 267,471 149,563 61,531 478,565 28.9<br />
2010 1,806,751 279,251 155,918 70,796 505,965 28.0<br />
<strong>2011</strong> 1,821,817 282,891 158,724 136,888 578,503 31.8<br />
NOTES TO REQUIRED SUPPLEMENTARY INFORMATION<br />
The August 31, 2007 actuarial valuation was the first actuarial valuation of <strong>TRS</strong>-Care. This and future valuations will set the ARC on<br />
a prospective basis, meaning each valuation will set the ARC for the following fiscal year. The employer ARC was determined by<br />
netting the active employee contributions (0.65%) out of the total ARC rate (7.09%). The ARC for fiscal year <strong>2011</strong> was determined<br />
by applying the employer ARC determined in the 2010 valuation as a percentage of payroll (6.44%) to the actual payroll paid in<br />
fiscal year <strong>2011</strong> ($28.3 billion).<br />
FINANCIAL SECTION<br />
65
TEACHER RETIREMENT SYSTEM OF TEXAS COMPREHENSIVE ANNUAL FINANCIAL REPORT <strong>2011</strong><br />
Combining Statement of Changes in<br />
Assets and Liabilities<br />
AGENCY FUNDS<br />
FOR THE FISCAL YEAR ENDED AUGUST 31, <strong>2011</strong><br />
Balances<br />
Balances<br />
September 1, August 31,<br />
2010 Additions Deductions <strong>2011</strong><br />
E X H I B I T A<br />
Employees’ Savings<br />
Bond Account<br />
Assets:<br />
Cash in State Treasury $ 500 $ $ 500 $ 0<br />
Liabilities:<br />
Funds Held for Others $ 500 $ $ 500 $ 0<br />
Child Support<br />
Employee Deductions<br />
Assets:<br />
Cash in State Treasury $ 3,607 $ 36,473 $ 36,103 $ 3,977<br />
Liabilities:<br />
Funds Held for Others $ 3,607 $ 32,866 $ 32,496 $ 3,977<br />
Totals - All Agency Funds<br />
(Exhibit I)<br />
Assets:<br />
Cash in State Treasury $ 4,107 $ 36,473 $ 36,603 $ 3,977<br />
TOTAL ASSETS $ 4,107 $ 36,473 $ 36,603 $ 3,977<br />
Liabilities:<br />
Funds Held for Others $ 4,107 $ 32,866 $ 32,996 $ 3,977<br />
TOTAL LIABILITIES $ 4,107 $ 32,866 $ 32,996 $ 3,977<br />
66 FINANCIAL SECTION
TEACHER RETIREMENT SYSTEM OF TEXAS COMPREHENSIVE ANNUAL FINANCIAL REPORT <strong>2011</strong><br />
This page is intentionally left blank.<br />
FINANCIAL SECTION<br />
67
TEACHER RETIREMENT SYSTEM OF TEXAS COMPREHENSIVE ANNUAL FINANCIAL REPORT <strong>2011</strong><br />
Comparative Schedule of Changes in<br />
Account Balance<br />
PENSION TRUST FUND<br />
FOR THE FISCAL YEAR ENDED AUGUST 31, <strong>2011</strong> (With Comparative Data for August 31, 2010)<br />
INTEREST ACCOUNT <strong>2011</strong> 2010<br />
S C H E D U L E 1<br />
Additions:<br />
Interest, Dividends and Other Income:<br />
Short-Term $ 49,926,058 $ 49,813,039<br />
Equities 1,120,858,771 958,159,969<br />
Fixed Income 973,604,208 868,114,125<br />
Derivatives (20,218,414) (5,440,626)<br />
Securities Lending Program 79,452,915 108,315,827<br />
Miscellaneous 1,665,193<br />
Net Appreciation in Fair Value<br />
of Investments 12,616,681,465 7,542,738,000<br />
TOTAL ADDITIONS $ 14,820,305,003 $ 9,523,365,527<br />
Deductions:<br />
Transfers Out:<br />
Allocation of Interest to/(from):<br />
Member Savings Account $ 1,385,602,532 $ 1,300,356,529<br />
State Contribution Account (4,100,053,356) (3,900,921,846)<br />
Retired Reserve Account 4,692,033,648 4,432,496,003<br />
Deferred Retirement Option Account 4,829,832 5,639,288<br />
Expense Account 83,256,827 66,482,415<br />
Transfer to State Contribution Account<br />
for Net Appreciation in Fair Value<br />
of Investments 12,616,681,465 7,542,738,000<br />
External Manager Fees 137,954,055 76,575,138<br />
TOTAL DEDUCTIONS $ 14,820,305,003 $ 9,523,365,527<br />
Net Change in Account Balance $ 0 $ 0<br />
Account Balance - Beginning September 1 $ 0 $ 0<br />
Account Balance - Ending August 31 $ 0 $ 0<br />
68 FINANCIAL SECTION
TEACHER RETIREMENT SYSTEM OF TEXAS COMPREHENSIVE ANNUAL FINANCIAL REPORT <strong>2011</strong><br />
Comparative Schedule of Changes in<br />
Account Balance<br />
PENSION TRUST FUND<br />
FOR THE FISCAL YEAR ENDED AUGUST 31, <strong>2011</strong> (With Comparative Data for August 31, 2010)<br />
MEMBER SAVINGS ACCOUNT <strong>2011</strong> 2010<br />
Additions:<br />
Contributions:<br />
Contributions Paid by Member $ 2,243,954,725 $ 2,205,017,425<br />
Employment After Retirement Surcharge Paid by<br />
<strong>Report</strong>ing Entities - Employee 3,983,605 2,989,345<br />
Purchase of Service Credit - Refundable 45,158,612 37,442,030<br />
Transfer In:<br />
Allocation from Interest Account 1,385,602,532 1,300,356,529<br />
TOTAL ADDITIONS $ 3,678,699,474 $ 3,545,805,329<br />
Deductions:<br />
Refund of Contributions - Active $ 330,284,482 $ 261,475,648<br />
Transfers Out:<br />
Transfer to Retired Reserve Account:<br />
For Dormant Accounts 18,046,747 17,544,399<br />
To Fund Benefits 1,915,168,372 1,439,582,886<br />
TOTAL DEDUCTIONS $ 2,263,499,601 $ 1,718,602,933<br />
Net Change in Account Balance $ 1,415,199,873 $ 1,827,202,396<br />
Account Balance - Beginning September 1 $ 27,735,774,470 $ 25,908,572,074<br />
Account Balance - Ending August 31 $ 29,150,974,343 $ 27,735,774,470<br />
S C H E D U L E 1<br />
FINANCIAL SECTION<br />
69
TEACHER RETIREMENT SYSTEM OF TEXAS COMPREHENSIVE ANNUAL FINANCIAL REPORT <strong>2011</strong><br />
Comparative Schedule of Changes in<br />
Account Balance<br />
PENSION TRUST FUND<br />
FOR THE FISCAL YEAR ENDED AUGUST 31, <strong>2011</strong> (With Comparative Data for August 31, 2010)<br />
S C H E D U L E 1<br />
STATE CONTRIBUTION ACCOUNT <strong>2011</strong> 2010<br />
Additions:<br />
Contributions:<br />
State Contributions - General Fund $ 1,595,771,774 $ 1,574,621,766<br />
Contributions - Federal/Private<br />
Funding Sources 324,764,720 306,782,830<br />
<strong>Report</strong>ing Entities 411,889,817 406,218,171<br />
Employment After Retirement Surcharge<br />
Paid by <strong>Report</strong>ing Entities - Employer 4,095,094 3,060,987<br />
Purchase of Service Credit - Non-Refundable 60,018,492 47,077,732<br />
Transfers In:<br />
Transfers from Interest Account:<br />
For Investment Income (4,100,053,356) (3,900,921,846)<br />
For Net Appreciation in Fair Value<br />
of Investments 12,616,681,465 7,542,738,000<br />
Transfers from Retired Reserve Account:<br />
For Retirement Benefits Forfeited While<br />
Member Returned to Teaching 36,576,537 52,061,421<br />
For Retirement Benefits Waived by Member 46,176 43,650<br />
Based on Actuarial Valuation as of<br />
August 31 572,244,213<br />
TOTAL ADDITIONS $ 10,949,790,719 $ 6,603,926,924<br />
Deductions:<br />
Transfers Out:<br />
Transfers to Retired Reserve Account:<br />
To Fund Benefits $ 4,745,429,605 $ 4,015,209,483<br />
Based on Actuarial Valuation as of<br />
August 31 497,268,028<br />
TOTAL DEDUCTIONS $ 5,242,697,633 $ 4,015,209,483<br />
Net Change in Account Balance $ 5,707,093,086 $ 2,588,717,441<br />
Account Balance - Beginning September 1 $ 9,965,035,637 $ 7,376,318,196<br />
Account Balance - Ending August 31 $ 15,672,128,723 $ 9,965,035,637<br />
70 FINANCIAL SECTION
TEACHER RETIREMENT SYSTEM OF TEXAS COMPREHENSIVE ANNUAL FINANCIAL REPORT <strong>2011</strong><br />
Comparative Schedule of Changes in<br />
Account Balance<br />
PENSION TRUST FUND<br />
FOR THE FISCAL YEAR ENDED AUGUST 31, <strong>2011</strong> (With Comparative Data for August 31, 2010)<br />
RETIRED RESERVE ACCOUNT <strong>2011</strong> 2010<br />
Additions:<br />
Contributions Transferred in From Employees<br />
Retirement System of Texas $ 12,628,712 $ 11,167,772<br />
Transfers In:<br />
Allocation from Interest Account 4,692,033,648 4,432,496,003<br />
Transfer from Member Savings Account:<br />
For Dormant Accounts 18,046,747 17,544,399<br />
To Fund Benefits 1,915,168,372 1,439,582,886<br />
Transfer from State Contribution Account:<br />
To Fund Benefits 4,745,429,605 4,015,209,483<br />
Based on Actuarial Valuation as of<br />
August 31 497,268,028<br />
TOTAL ADDITIONS $ 11,880,575,112 $ 9,916,000,543<br />
Deductions:<br />
Benefits Paid:<br />
Service Retirement Annuities $ 6,241,946,655 $ 5,841,963,927<br />
Partial Lump Sums 524,925,790 385,555,126<br />
Disability Retirement Annuities 144,865,109 141,396,837<br />
Death and Survivor Benefits:<br />
<strong>Annual</strong> Salary 47,295,194 45,698,147<br />
Survivor Annuities 86,898,720 82,574,358<br />
Life Annuities 84,893,007 83,238,898<br />
60 Monthly Payments 11,564,275 10,824,948<br />
Remainder of Contributions 3,293,923 3,537,843<br />
Refund of Contributions - Death 3,984,340 3,710,941<br />
Benefits Transferred to Employees Retirement<br />
System of Texas 64,772,079 61,570,750<br />
Transfers Out:<br />
Transfer to Deferred Retirement Option Account<br />
to Fund Benefits 956,666 5,161,454<br />
Transfers to State Contribution Account:<br />
For Retirement Benefits Forfeited While Member<br />
Returned to Teaching 36,576,537 52,061,421<br />
For Retirement Benefits Waived by Member 46,176 43,650<br />
Based on Actuarial Valuation as of<br />
August 31 572,244,213<br />
TOTAL DEDUCTIONS $ 7,252,018,471 $ 7,289,582,513<br />
Net Change in Account Balance $ 4,628,556,641 $ 2,626,418,030<br />
Account Balance - Beginning September 1 $ 57,850,684,182 $ 55,224,266,152<br />
Account Balance - Ending August 31 $ 62,479,240,823 $ 57,850,684,182<br />
S C H E D U L E 1<br />
FINANCIAL SECTION<br />
71
TEACHER RETIREMENT SYSTEM OF TEXAS COMPREHENSIVE ANNUAL FINANCIAL REPORT <strong>2011</strong><br />
Comparative Schedule of Changes in<br />
Account Balance<br />
PENSION TRUST FUND<br />
FOR THE FISCAL YEAR ENDED AUGUST 31, <strong>2011</strong> (With Comparative Data for August 31, 2010)<br />
DEFERRED RETIREMENT<br />
OPTION ACCOUNT <strong>2011</strong> 2010<br />
S C H E D U L E 1<br />
Additions:<br />
Transfers In:<br />
Transfer from Retired Reserve Account<br />
to Fund Benefits $ 956,666 $ 5,161,454<br />
Allocation from Interest Account 4,829,832 5,639,288<br />
TOTAL ADDITIONS $ 5,786,498 $ 10,800,742<br />
Deductions:<br />
Benefits Paid $ 27,822,115 $ 22,607,290<br />
Net Change in Account Balance $ (22,035,617) $ (11,806,548)<br />
Account Balance - Beginning September 1 $ 105,967,558 $ 117,774,106<br />
Account Balance - Ending August 31 $ 83,931,941 $ 105,967,558<br />
72 FINANCIAL SECTION
TEACHER RETIREMENT SYSTEM OF TEXAS COMPREHENSIVE ANNUAL FINANCIAL REPORT <strong>2011</strong><br />
Comparative Schedule of Changes in<br />
Account Balance<br />
PENSION TRUST FUND<br />
FOR THE FISCAL YEAR ENDED AUGUST 31, <strong>2011</strong> (With Comparative Data for August 31, 2010)<br />
EXPENSE ACCOUNT <strong>2011</strong> 2010<br />
Additions:<br />
Legislative Appropriations $ $ 2,805,955<br />
On Behalf Fringe Benefits Paid by the State 160,975<br />
Miscellaneous Revenues 1,576,613 788,787<br />
Transfers In:<br />
Allocation from Interest Account 83,256,827 66,482,415<br />
TOTAL ADDITIONS $ 84,833,440 $ 70,238,132<br />
Deductions:<br />
Administrative Expenses:<br />
Salaries and Other Personnel Costs $ 57,695,600 $ 43,008,202<br />
Professional Fees and Services 4,619,847 7,089,576<br />
Consumable Supplies and Fuels 399,778 410,343<br />
Utilities 706,891 880,128<br />
Travel 709,149 690,540<br />
Rentals 1,384,529 1,859,462<br />
Dues, Fees and Staff Development 299,043 277,052<br />
Subscriptions and Reference Information 195,529 202,629<br />
Printing and Reproduction Services 311,082 538,358<br />
Postage, Mailing and Delivery Services 2,059,866 2,305,069<br />
Software Purchases and Maintenance 2,348,229 1,890,191<br />
Maintenance - Computer Hardware 349,574 362,032<br />
Maintenance - Buildings and Equipment 727,166 831,101<br />
Miscellaneous Expenses 803,571 688,781<br />
Insurance Premiums 668,723 727,826<br />
Furniture and Equipment - Expensed 1,099,878 733,724<br />
Depreciation 2,254,739 1,500,507<br />
Amortization 154,726 1,340,603<br />
Loss on Impairment of Capital Assets 4,477,619<br />
S C H E D U L E 1<br />
TOTAL DEDUCTIONS $ 81,265,539 * $ 65,336,124<br />
Net Change in Account Balance $ 3,567,901 $ 4,902,008<br />
Account Balance - Beginning September 1 $ 30,943,162 $ 26,041,154<br />
Account Balance - Ending August 31 $ 34,511,063 $ 30,943,162<br />
* This amount includes total internal administrative investing activity expenses of $45,415,720 (Schedule 3). Total<br />
administrative expenses net of investing activity expenses are $35,849,819 (Exhibit II).<br />
FINANCIAL SECTION<br />
73
TEACHER RETIREMENT SYSTEM OF TEXAS COMPREHENSIVE ANNUAL FINANCIAL REPORT <strong>2011</strong><br />
Schedule of Administrative and Capital Expenses -<br />
Budget and Actual on Budgetary Basis<br />
FOR THE FISCAL YEAR ENDED AUGUST 31, <strong>2011</strong><br />
FIDUCIARY FUND<br />
PENSION AND OTHER EMPLOYEE BENEFIT TRUST FUNDS<br />
Budget<br />
PENSION TRUST FUND<br />
Actual<br />
Variance<br />
Expenses:<br />
Salaries and Wages $ 47,657,535 $ 46,197,804 $ 1,459,731<br />
S C H E D U L E 2<br />
Other Personnel Costs:<br />
Longevity Pay $ 621,820 $ 590,580 $ 31,240<br />
Employer Retirement Contributions 2,575,000 2,354,167 220,833<br />
Employer FICA Contributions 3,113,191 2,683,568 429,623<br />
Employer Health Insurance Contributions 3,962,554 3,959,468 3,086<br />
Benefit Replacement Pay 143,965 138,039 5,926<br />
Other Employee Benefits 45,000 33,609 11,391<br />
TOTAL OTHER PERSONNEL COSTS $ 10,461,530 $ 9,759,431 $ 702,099<br />
Professional Fees and Services $ 8,550,771 $ 4,777,632 $ 3,773,139<br />
Other Operating Expenses:<br />
Consumable Supplies and Fuels $ 468,353 $ 385,329 $ 83,024<br />
Utilities 984,787 783,043 201,744<br />
Travel 900,157 715,481 184,676<br />
Rentals 2,195,826 2,066,383 129,443<br />
Dues, Fees and Staff Development 418,901 290,099 128,802<br />
Subscriptions and Reference Information 240,266 198,030 42,236<br />
Printing and Reproduction Services 359,300 335,663 23,637<br />
Postage, Mailing and Delivery Services 2,245,850 2,065,564 180,286<br />
Software Purchases and Maintenance 2,784,429 2,604,797 179,632<br />
Computer Hardware Maintenance 469,100 347,454 121,646<br />
Miscellaneous Expenses 1,032,702 812,077 220,625<br />
Insurance Premiums 701,446 668,723 32,723<br />
Furniture and Equipment - Expensed 403,650 366,014 37,636<br />
Maintenance - Buildings and Equipment 937,021 817,646 119,375<br />
TOTAL OTHER OPERATING EXPENSES $ 14,141,788 $ 12,456,303 $ 1,685,485<br />
TOTAL ADMINISTRATIVE<br />
EXPENSES - BUDGETARY BASIS $ 80,811,624 $ 73,191,170 $ 7,620,454<br />
Pension Trust Fund:<br />
Adjustments Between Budgetary Basis and GAAP:<br />
Salaries and Wages $ 2,492,221<br />
Professional Fees and Services 31,478<br />
Other Operating Expenses (816,859)<br />
Reclass from Capital Assets 609,430<br />
Depreciation Expense 2,254,739<br />
Loss on Impairment of Capital Asset 4,477,619<br />
Amortization 154,726<br />
Change in Compensable Absence Obligation (743,127)<br />
Prior Year Adjustments (385,858)<br />
TOTAL DEDUCTIONS (SCHEDULE 1 -<br />
EXPENSE ACCOUNT) GAAP BASIS $ 81,265,539 *<br />
Capital Expenses:<br />
Furniture and Equipment - Capitalized $ 890,203 $ 844,327 $ 45,876<br />
Capital Projects 5,827,996 5,636,896 191,100<br />
TOTAL CAPITAL EXPENSES $ 6,718,199 $ 6,481,223 $ 236,976<br />
* This amount includes total internal administrative investing activity expenses of $45,415,720 (Schedule 3). Administrative expenses net of<br />
investing activity expenses are $35,849,819 (Exhibit II).<br />
74 FINANCIAL SECTION
TEACHER RETIREMENT SYSTEM OF TEXAS COMPREHENSIVE ANNUAL FINANCIAL REPORT <strong>2011</strong><br />
FIDUCIARY FUND<br />
PENSION AND OTHER EMPLOYEE BENEFIT TRUST FUNDS<br />
<strong>TRS</strong>-CARE (RETIRED PLAN)<br />
Budget Actual Variance<br />
$ 1,655,000 $ 1,614,819 $ 40,181<br />
$ 46,560 $ 45,100 $ 1,460<br />
110,070 108,440 1,630<br />
124,164 121,526 2,638<br />
172,717 172,047 670<br />
13,631 12,633 998<br />
16,250 16,250<br />
$ 483,392 $ 459,746 $ 23,646<br />
$ 1,093,000 $ 799,865 $ 293,135<br />
$ 5,482 $ 2,749 $ 2,733<br />
2,131 1,466 665<br />
8,827 4,486 4,341<br />
119,693 116,564 3,129<br />
3,595 3,270 325<br />
570 242 328<br />
23,730 14,276 9,454<br />
137,280 117,101 20,179<br />
11,000 5,240 5,760<br />
1,250 45 1,205<br />
500 500<br />
$ 314,058 $ 265,439 $ 48,619<br />
$ 3,545,450 $ 3,139,869 $ 405,581<br />
<strong>TRS</strong>-Care:<br />
$ 6,467<br />
(2,414)<br />
TOTAL ADMINISTRATIVE<br />
EXPENSES (EXHIBIT II)<br />
GAAP BASIS $ 3,143,922<br />
(to next page)<br />
FINANCIAL SECTION<br />
75
TEACHER RETIREMENT SYSTEM OF TEXAS COMPREHENSIVE ANNUAL FINANCIAL REPORT <strong>2011</strong><br />
(concluded)<br />
Schedule of Administrative and Capital Expenses -<br />
Budget and Actual on Budgetary Basis<br />
FOR THE FISCAL YEAR ENDED AUGUST 31, <strong>2011</strong><br />
PROPRIETY FUND<br />
ENTERPRISE FUND MAJOR FUND<br />
Budget<br />
<strong>TRS</strong>-ACTIVECARE<br />
Actual<br />
Variance<br />
Expenses:<br />
Salaries and Wages $ 1,147,053 $ 1,103,421 $ 43,632<br />
S C H E D U L E 2<br />
Other Personnel Costs:<br />
Longevity Pay $ 30,060 $ 27,820 $ 2,240<br />
Employer Retirement Contributions 75,150 67,373 7,777<br />
Employer FICA Contributions 89,229 82,758 6,471<br />
Employer Health Insurance Contributions 114,469 107,501 6,968<br />
Benefit Replacement Pay 2,400 1,805 595<br />
Other Employee Benefits 9,825 9,825<br />
TOTAL OTHER PERSONNEL COSTS $ 321,133 $ 287,257 $ 33,876<br />
Professional Fees and Services $ 965,000 $ 866,115 $ 98,885<br />
Other Operating Expenses:<br />
Consumable Supplies and Fuels $ 3,500 $ 1,151 $ 2,349<br />
Utilities 1,600 883 717<br />
Travel 8,000 2,221 5,779<br />
Rentals 65,140 65,140<br />
Dues, Fees and Staff Development 5,550 5,255 295<br />
Subscriptions and Reference Information 1,000 689 311<br />
Printing and Reproduction Services 1,400 885 515<br />
Postage, Mailing and Delivery Services 4,750 2,883 1,867<br />
Software Purchases and Maintenance<br />
Computer Hardware Maintenance<br />
Miscellaneous Expenses 3,000 1,251 1,749<br />
Insurance Premiums<br />
Furniture and Equipment - Expensed 4,250 132 4,118<br />
Maintenance - Buildings and Equipment 500 500<br />
TOTAL OTHER OPERATING<br />
EXPENSES $ 98,690 $ 80,490 $ 18,200<br />
TOTAL ADMINISTRATIVE<br />
EXPENSES $ 2,531,876 $ 2,337,283 $ 194,593<br />
<strong>TRS</strong>-ActiveCare:<br />
Adjustments Between Budgetary Basis and GAAP:<br />
Professional Fees and Services $ (140,000)<br />
Other Operating Expenses (975)<br />
Change in Compensable Absence Obligation 11,438<br />
Prior Year Adjustments (695)<br />
TOTAL ADMINISTRATIVE<br />
EXPENSES (Exhibit IV) - GAAP BASIS $ 2,207,051<br />
76 FINANCIAL SECTION
TEACHER RETIREMENT SYSTEM OF TEXAS COMPREHENSIVE ANNUAL FINANCIAL REPORT <strong>2011</strong><br />
PROPRIETARY FUND<br />
ENTERPRISE FUND NON-MAJOR FUND<br />
403(b) CERTIFICATION PROGRAM<br />
Budget Actual Variance<br />
$ 127,200 $ 116,830 $ 10,370<br />
$ 2,500 $ 2,220 $ 280<br />
8,600 7,898 702<br />
9,658 8,433 1,225<br />
20,000 17,099 2,901<br />
3,150 3,150<br />
$ 43,908 $ 35,650 $ 8,258<br />
$ $ $<br />
$ $ $<br />
$ 0 $ 0 $ 0<br />
$ 171,108 $ 152,480 $ 18,628<br />
403(b) Certification Program<br />
$ 4,036<br />
TOTAL ADMINISTRATIVE<br />
EXPENSES (EXHIBIT IV) -<br />
GAAP BASIS $ 148,444<br />
FINANCIAL SECTION<br />
77
TEACHER RETIREMENT SYSTEM OF TEXAS COMPREHENSIVE ANNUAL FINANCIAL REPORT <strong>2011</strong><br />
Comparative Schedule of Investing<br />
Activity Expenses<br />
PENSION TRUST FUND<br />
FOR THE FISCAL YEAR ENDED AUGUST 31, <strong>2011</strong> (With Comparative Data for August 31, 2010)<br />
<strong>2011</strong> 2010<br />
S C H E D U L E 3<br />
Direct Expenses:<br />
Salaries and Other Personnel Costs $ 29,476,277 $ 16,283,310<br />
Professional Fees and Services 3,767,718 5,232,615<br />
Consumable Supplies 35,633 41,972<br />
Travel 506,220 490,522<br />
Building Lease 1,019,436 1,486,486<br />
Copier Rentals 75,000 74,039<br />
Dues, Fees and Staff Development 27,648 41,146<br />
Subscriptions and Reference Materials 36,796 40,989<br />
Reproduction and Printing Services 12,721<br />
Software Upgrades 150,796 196,123<br />
Telecommunication and Data Services 322,907 357,760<br />
Furniture and Equipment - Expensed 40,086 246,601<br />
Depreciation - Leasehold Improvements 516,031 516,031<br />
Total Direct Expenses $ 35,987,269 $ 25,007,594<br />
Indirect Expenses:<br />
Depreciation $ 200,523 $ 173,164<br />
Executive Management Support 1,030,719 827,413<br />
Legal Support 1,515,794 1,585,381<br />
Audit Support 761,710 1,442,557<br />
Human Resources Support 609,223 558,432<br />
Fiscal Management Support 1,531,627 1,505,945<br />
Information Technology Support 2,339,344 2,643,578<br />
Staff Services Support 1,057,415 1,191,293<br />
Other Support Services 382,096 408,159<br />
Total Indirect Expenses $ 9,428,451 $ 10,335,922<br />
Total Internal Administrative<br />
Investing Activity Expenses* $ 45,415,720 $ 35,343,516<br />
External Manager Fees ** $ 137,954,055 $ 76,575,138<br />
Total Investing Activity Expenses (Exh. II) *** $ 183,369,775 $ 111,918,654<br />
* Not netted against or included in performance calculations.<br />
** Performance calculations net of External Manager Fees<br />
*** The investing activity expenses do not include the following expenditures:<br />
During fiscal year <strong>2011</strong>, the system paid commissions to various brokers totaling $58,304,167. A portion of the total commissions was paid<br />
to soft dollar brokers generating $6,516,399 of soft dollar credits. Soft dollar credits were spent during fiscal year <strong>2011</strong> in accordance with<br />
Section 28(e) of the Securities Exchange Act of 1934 totaling $6,155,201. Unspent soft dollar credits (totaling $2,428,236) are held by the<br />
receiving broker and will be utilized in the new fiscal year. Another portion of the total commissions was paid through various Commission<br />
Sharing Arrangements (CSA) generating $11,036,887 in CSA proceeds. These proceeds were used to acquire research services from<br />
various investment related firms totaling $14,536,387. Unspent CSA proceeds (totaling $6,396,266) are held by either State Street Bank<br />
and Trust Company as the system’s CSA agent or by the CSA broker as a reserve for future expenses.<br />
Through its contractual agreements with various firms, the system benefited from $6,773,218 in vendor paid expenses and contractual<br />
allowances. Vendor paid expenses are legal arrangements that are used to acquire investment related items other than those paid for with<br />
Soft Dollar credits and CSA proceeds.<br />
In addition to the commission expenses mentioned above, $416,378,165 was paid to various Alternative and Pooled Investment General<br />
Partners for a total of $474,712,229 in fees and commissions which are not included in Investing Activities Expense on Exhibit II. These<br />
amounts are reported in the Schedule of Fees and Commissions and are netted against investment performance on Exhibit II in the<br />
Net Appreciation in Fair Value of Investments amount. Custodial management fees were netted against income from securities lending<br />
activities.<br />
78 FINANCIAL SECTION
TEACHER RETIREMENT SYSTEM OF TEXAS COMPREHENSIVE ANNUAL FINANCIAL REPORT <strong>2011</strong><br />
Schedule of Professional and Consulting Fees -<br />
Budgetary Basis<br />
FOR THE FISCAL YEAR ENDED AUGUST 31, <strong>2011</strong><br />
Individual or Firm Nature of Service Amount<br />
Fulbright & Jaworski, LLP Legal Services $ 1,320,839<br />
Gabriel, Roeder, Smith, & Company Actuarial Services and Health Care Consulting 1,000,319<br />
Hewitt Ennis Knupp, Inc. Consulting Services 675,000<br />
Albourne America, LLC Consulting Services 400,070<br />
Grant Thornton, LLP Consulting Services 334,950<br />
State Auditors Office Audit Services 298,341<br />
Akin Gump Strauss Hauer & Feld, LLP Legal Services 286,676<br />
Reinhart Boerner Van Deuren, SC Legal Services 255,228<br />
Duff & Phelps, LLC Audit Services 239,017<br />
Jackson Walker, LLP Legal Services 215,796<br />
Austin Project Group Consulting Services 165,374<br />
Ernst & Young <strong>Financial</strong> and Accounting Services 152,635<br />
Sagebrush Solutions, Inc. Audit Services 150,000<br />
Clifton Gunderson, LLP Audit Services 140,000<br />
SR Batliboi & Company <strong>Financial</strong> and Accounting Services 130,456<br />
VR Election Services DBA Voice Retrieval Board Election Services 125,000<br />
Seyfarth Shaw, LLP Legal Services 100,000<br />
Easyvista, Inc. Consulting Services 59,137<br />
Keith C. Brown Consulting Services 48,000<br />
Cooley Godward Kronish, LLP Legal Services 39,300<br />
Alice D. Cox, MD Medical Services 33,300<br />
James Allen Reinarz, MD Medical Services 33,300<br />
Larry Wilson, MD Medical Services 33,300<br />
Provaliant Holdings, LLC Consulting Services 30,850<br />
Ice Miller Legal Services 30,326<br />
Sourcepulse, LLC Consulting Services 25,500<br />
Career Management Associates of Iowa, LLC Temporary Employment Services 18,127<br />
Workers Assistance Program, Inc. Other Professional Services 16,012<br />
SHI Government Solutions Other Professional Services 15,307<br />
MACTEC Engineering and Consulting, Inc. Architectural/Engineering Services 13,939<br />
Korn/Ferry International Consulting Services 12,742<br />
RFD & Associates, Inc. Consulting Services 9,600<br />
Bickerstaff Heath Delgado Acosta, LLP Legal Services 7,176<br />
Texas Facilities Commission Consulting Services 7,000<br />
INX, Inc. Consulting Services 4,995<br />
Allied Consultants, Inc. Consulting Services 4,080<br />
SFW, LLC Consulting Services 2,900<br />
Workplace Dynamics, LLC Consulting Services 2,883<br />
Terracon Consultants, Inc. Consulting Services 1,915<br />
The Network, Inc. <strong>Financial</strong> and Accounting Services 1,830<br />
Jaster-Quintanilla & Associates, Inc. Architectural/Engineering Services 642<br />
John W Peavy III Ph.D., CFA Educational/Training Services 600<br />
Riva Jackson Educational/Training Services 555<br />
J. Robert Anderson Landscape Architects Architectural/Engineering Services 231<br />
Karen A. Knowlton Medical Services 200<br />
MWM Design Group, Inc. Architectural/Engineering Services 61<br />
The Townsend Group, Inc. Consulting Services 47<br />
Timothy Wei Other Professional Services 31<br />
Ysabel Soliz Medical Services 25<br />
TOTAL PROFESSIONAL AND CONSULTING FEES $ 6,443,612<br />
METHOD OF FINANCE:<br />
Fiduciary Funds:<br />
Pension Trust Fund $ 4,777,632<br />
<strong>TRS</strong>-Care (Retired Plan) 799,865<br />
Total Fiduciary Funds 5,577,497<br />
Proprietary Fund:<br />
<strong>TRS</strong>-ActiveCare 866,115<br />
Total Proprietary Fund 866,115<br />
TOTAL METHOD OF FINANCE $ 6,443,612<br />
S C H E D U L E 4<br />
FINANCIAL SECTION<br />
79
TEACHER RETIREMENT SYSTEM OF TEXAS COMPREHENSIVE ANNUAL FINANCIAL REPORT <strong>2011</strong><br />
This page is intentionally left blank.<br />
80 FINANCIAL SECTION
TEACHER RETIREMENT SYSTEM OF TEXAS COMPREHENSIVE ANNUAL FINANCIAL REPORT <strong>2011</strong><br />
INVESTMENT SECTION<br />
INVESTMENT SECTION<br />
81
TEACHER RETIREMENT SYSTEM OF TEXAS COMPREHENSIVE ANNUAL FINANCIAL REPORT <strong>2011</strong><br />
This page is intentionally left blank.<br />
82 INVESTMENT SECTION
TEACHER RETIREMENT SYSTEM OF TEXAS COMPREHENSIVE ANNUAL FINANCIAL REPORT <strong>2011</strong><br />
Investment Overview<br />
PORTFOLIO STRUCTURE<br />
In 2008, <strong>TRS</strong> began a transition to a more diversified investment<br />
strategy. That transition is now complete. The investment<br />
strategy focuses on three possible economic scenarios. Scenario<br />
One is characterized by favorable Gross Domestic Product (GDP)<br />
growth and an average Consumer Price Index (CPI) which, since<br />
1948, has been the prevailing economic condition 66% of the<br />
time. Scenario Two is one of low GDP growth and high CPI,<br />
which has occurred 21% of the time. Finally, Scenario Three is<br />
characterized by stagnant GDP and low CPI, which has occurred<br />
13% of the time. <strong>TRS</strong> is positioned to take advantage of any<br />
of these various market scenarios by allocating 60% to global<br />
equity markets, which perform well under Scenario One, 20%<br />
to real return, which should perform well in Scenario Two, and<br />
20% to a stable value portfolio, which should perform well and<br />
minimize downside risk in Scenario Three.<br />
INVESTMENT PORTFOLIO PERFORMANCE<br />
<strong>TRS</strong> had a return of 15.5% for the year ending August 31, <strong>2011</strong>,<br />
which exceeded the fund’s benchmark by 1%. This return ranked<br />
in the second quartile of public pension funds for the year. The<br />
total investment value of the trust as of August 31 was $107.1<br />
billion. <strong>Annual</strong> rates of return for the three-, five- and 10-year<br />
periods ending August 31, <strong>2011</strong> were 3.6%, 4.0% and 5.8%<br />
respectively.<br />
Additional performance information is included on the Total<br />
Time-Weighted Returns and Asset Allocation Charts on the<br />
following pages. The Total Time-Weighted Returns shown are<br />
for the 12-month period ended June 30, <strong>2011</strong>, and include comparisons<br />
with established benchmarks for the same time period.<br />
Investment performance is calculated using a time-weighted<br />
rate of return. Returns are calculated by State Street Bank and<br />
Trust Company, the fund’s custodian bank, independently and<br />
using industry best practices.<br />
STRATEGIC INITIATIVES<br />
In July <strong>2011</strong>, the Investment Management Division (IMD)<br />
celebrated the third anniversary of its Strategic Partnership<br />
Network (SPN). Four managers, JP Morgan, Neuberger Berman,<br />
Morgan Stanley, and BlackRock, were funded $1 billion each<br />
to invest globally across the same public asset classes as the<br />
trust. The IMD gains valuable insight from the positioning of each<br />
Strategic Partner and incorporates that information into our own<br />
Tactical Asset Allocation models. In addition, each year the SPN<br />
collaborates to produce eight research projects used to benefit<br />
the trust, with a special focus on asset allocation. In July <strong>2011</strong>,<br />
a fifth partner, Barclays Capital, was added to the SPN with an<br />
allocation of $500 million. As of August 31, <strong>2011</strong>, the total SPN<br />
is valued at $5 billion. For the three-year period as of August<br />
31, the SPN returned 5.3% annually, which added 1.83% over<br />
its three-year benchmark. For the one-year period, the SPN<br />
returned 14.89% to the trust, adding 0.8% over its benchmark.<br />
The Investment Management Division has a dedicated risk<br />
management function. Risk Management performs an independent<br />
risk certification for every new manager commitment<br />
and monitors the performance of each manager and portfolio<br />
monthly with a risk alarm review. During the last 12 months,<br />
the Risk Management team launched an improved suite of<br />
tools and reports, which monitor the risk levels of the trust and<br />
its portfolios. One of the tools developed is a bubble monitor,<br />
which scans the global markets for significant overvaluations<br />
in an asset class. The indications from this monitor provide an<br />
independent alert on asset classes where something abnormal<br />
is occurring. The IMD investigates each signal and may decide<br />
to lower our exposure to that asset class, either through entering<br />
into protective derivatives or an outright sale.<br />
On October 1, 2009, the IMD launched an internal gold fund<br />
to provide protection in times of uncertainty. Uncertainty has<br />
continued in the last 12 months due to continued concerns<br />
about Europe and potential currency devaluation in the US. For<br />
the one-year ended August 31, <strong>2011</strong>, the gold fund produced<br />
a return of 41.94%.<br />
In <strong>2011</strong>, the Private Markets Group continued to build <strong>TRS</strong>’<br />
first Principal Investments Program. Since the beginning of the<br />
program in 2009, the trust has committed $2.7 billion in nine<br />
private equity principal investments and nine real asset principal<br />
investments. While this program is still growing, we believe<br />
the combination of lower fees and increased transparency into<br />
the decision-making of our private partners will be accretive<br />
to the trust.<br />
In September, the board reviewed and adjusted the investment<br />
policy to help achieve the trust’s targeted 8% long-term<br />
return. The primary adjustments starting October 1, <strong>2011</strong> are to<br />
incorporate the increased allocation to hedge funds approved by<br />
the Texas Legislature and to increase the amount allocated to<br />
private equity. These changes result in a 2% increase to Global<br />
Equity from current 60% policy benchmark to a 62% allocation<br />
and corresponding decrease in Stable Value from a current<br />
20% policy benchmark to a 18% allocation. This adjustment will<br />
provide greater flexibility for the IMD to respond to changes in<br />
market conditions.<br />
Looking forward, our investment outlook has not changed in<br />
the past 12 months. Due to the very low interest rates today<br />
and the European sovereign debt concerns, our expectations<br />
are for muted returns over the next few years.<br />
Prepared by:<br />
Investment staff of the system<br />
INVESTMENT SECTION<br />
83
TEACHER RETIREMENT SYSTEM OF TEXAS COMPREHENSIVE ANNUAL FINANCIAL REPORT <strong>2011</strong><br />
Total Time-Weighted Returns<br />
PENSION TRUST FUND - FOR PERIODS ENDED JUNE 30<br />
3 5 10<br />
Total Portfolio 1 2006 2007 2008 2009 2010 <strong>2011</strong> Years Years Years<br />
<strong>TRS</strong> 10.4% 17.5% -2.1% -21.9% 15.6% 22.2% 3.4% 4.9% 5.7%<br />
Custom Benchmark 2 9.7% 16.9% -2.0% -19.5% 12.8% 21.2% 3.3% 4.7% 5.4%<br />
<strong>TRS</strong> Public Equity 14.0% 21.9% -10.3% -26.8% 14.4% 30.3% 2.6% 3.4% 4.7%<br />
Public Equity Composite Benchmark 3 13.5% 22.1% -10.9% -27.3% 14.3% 31.2% 2.9% 3.4% 4.5%<br />
<strong>TRS</strong> Private Equity 45.3% 32.4% 14.8% -28.8% 24.6% 24.6% 3.4% 10.9% 13.1%<br />
Private Equity Composite Benchmark 4 19.6% 21.4% -12.4% -22.8% 34.9% 21.9% 8.3% 6.3% 7.5%<br />
Total <strong>TRS</strong> Global Equity 14.8% 22.3% -8.8% -27.7% 16.1% 29.5% 2.8% 3.9% 5.1%<br />
Global Equity Composite<br />
Benchmark 5 13.9% 22.1% -10.9% -27.0% 17.0% 30.3% 3.6% 3.9% 4.8%<br />
<strong>TRS</strong> Fixed Income -0.3% 6.7% 4.4% -0.7% 21.9% 4.6% 8.2% 7.3% 6.6%<br />
Fixed Income Composite Benchmark 6 -0.5% 6.6% 9.2% 6.6% 11.7% -1.1% 5.6% 6.5% 6.2%<br />
<strong>TRS</strong> Hedge Funds 11.2% 15.2% -1.2% -10.5% 7.7% 5.9% 0.5% 2.9% 4.5%<br />
Hedge Fund Composite Benchmark 7 5.8% 9.8% 5.9% 3.9% 2.4% 2.3% 2.9% 4.8% 5.4%<br />
Total <strong>TRS</strong> Stable Value 0.5% 7.2% 4.5% -3.6% 19.1% 5.0% 6.5% 6.2% 6.2%<br />
Stable Value Composite<br />
Benchmark 8 -0.1% 6.7% 8.4% 6.0% 9.3% -0.3% 4.9% 6.0% 5.9%<br />
<strong>TRS</strong> Real Assets n/a 13.7% 7.0% -33.0% -8.9% 19.4% -10.0% -2.4% n/a<br />
Real Assets Composite Benchmark 9 n/a 18.8% 9.7% -24.6% -15.7% 19.0% -8.9% -0.3% n/a<br />
Total <strong>TRS</strong> Real Return 11.7% 13.7% 24.5% -25.7% 7.7% 17.4% -02.0% 5.5% n/a<br />
Real Return Composite<br />
Benchmark 10 n/a 18.8% 18.6% -22.3% 2.6% 16.8% -2.4% 5.6% n/a<br />
1<br />
Time-weighted rates of return adjusted for cash flows. Returns are calculated net of external manager fees.<br />
2<br />
42% S&P 500/ 7.5% S&P 400/ 3% S&P 600/ 13% MS ACWI free-ex-US/ 28.5% SB Large Pension Fund/ 1% SB High Yield Market Index/ 3% Private Equity Composite (3 years at<br />
0, then Russell 2000 + 500 bps)/ 1.5% Absolute Return Composite (6-month T-Bill + 300 bps through 3/03; then 70% 3-month LIBOR/ 30% S&P 500)/ 0.5% 91-day T-Bill through<br />
6/04; 42% S&P 500/ 7.5% S&P 400/ 3% S&P 600/ 13% MS ACWI free-ex-US/ 28.5% LB Aggregate/ 1% SB High Yield Market Index/ 3% Private Equity Composite (3 years at 0,<br />
then Russell 2000 + 500 bps)/ 1.5% Absolute Return Composite (70% 3-month LIBOR/ 30% S&P 500)/ 0.5% 91-day T-Bill through 01/05; 50% Total Domestic Equity Composite/<br />
13.4% MS ACWI Ex-US/ 28.35% LB Aggregate/ 2.06% Citigroup High Yield Index/ 4.12% Private Equity Composite (3 years at 0, then Russell 2000 + 500 bps)/ 1.55% Absolute<br />
Return Composite (70% 3-month LIBOR/ 30% S&P 500)/ 0.52% 91-day T-Bill through 9/07; 15% Russell 1000 Growth/15% Russell 1000 Value/5% Russell 2000/15% MSCI EAFE +<br />
Canada/5% MSCI EM/5 % Russell 3000 + 5%/10% Lehman Long Treasuries/4% 3-month LIBOR + 2%/5% Lehman Intermediate Gov-Credit/1% Citigroup 90-day US Treasury/10%<br />
Lehman Global Inflation Linked Bonds/4% Real Estate Composite/1% US Core CPI + 5%/3% Goldman Sachs Commodity Index, 2% NAREIT through 9/08; 10% Russell 1000<br />
Growth/ 10% Russell 1000 Value/ 5% Russell 2000/ 8% MSCI EAFE + Canada/ 5% MSCI EM/ 15% MSCI World/ 7% Russell 3000 + 5%/ 12% BC Long Treasuries/ 4% 3-month<br />
LIBOR + 2%/ 3% BC Intermediate Gov-Credit/ 1% Citigroup 90-day US Treasury/ 5% BC Global Inflation Linked Bonds/ 5% BC US TIPS/ 5% Real Estate Composite/ 1% US Core<br />
CPI + 5%/ 2% Goldman Sachs Commodity Index/ 2% NAREIT through 9/09; 5% MSCI USA Small Cap/ 8% MSCI USA Large Cap/ 33% MSCI World Net/ 6% MSCI EM Net, 4%<br />
3-month LIBOR+2%/ 15% BC Long Treasury/ 2% Goldman Sachs Commodity/ 8% BC US TIPS/ 8% SSPEI 1 QTR lagged/ 8% NCREIF ODCE Net lagged/ 2% MSCI US REIT/ 1%<br />
90-day US Treasury through 9/10; currently 5% MSCI Small Cap / 20% MSCI USA/ 15% MSCI EAFE+Canada/10% MSCI EM/ 15% BC Long Treasuries/ 4% 3-month LIBOR +<br />
2%/ 1% Citigroup 90-day US Treasury/ 8% BC US TIPS/ 2% MSCI US REIT/ 10% SSPEI 1 QTR lagged/ 2% Goldman Sachs Commodity Index/ 8% NCREIF Open Ended fund lagged.<br />
3<br />
64% S&P 500/ 11% S&P 400/ 5% S&P 600, 20% MSCI ACWI free-ex-US through 6/04; 61% S&P 500/ 12% S&P 400/ 6% S&P 600, 21% MSCI ACWI free-ex-US through 6/05;<br />
60.16% S&P 500/ 12.20% S&P 400/ 6.5% S&P 600, 21.14% MSCI ACWI free-ex-US through 3/06; 59.82% S&P 500/ 11.97% S&P 400/ 5.99% S&P 600, 22.22% MSCI ACWI<br />
free-ex-US through 9/07; 27.27% Russell 1000 Growth/27.27% Russell 1000 Value/9.09% Russell 2000/27.27% MSCI EAFE + Canada/9.10% MSCI EM through 9/08; 18.9%<br />
Russell 1000 Growth/18.9% Russell 1000 Value/9.4% Russell 2000/ 15.1% MSCI EAFE + Canada/ 9.4% MSCI EM/ 28.3% MSCI World through 9/09; 11.5% MSCI EM/ 63.5%<br />
MSCI All-Country World Net/ 9.6% MSCI USA Small Cap/ 15.4% MSCI USA Large Cap through 9/10; currently 20% MSCI EM/ 30% MSCI EAFE+Canada/ 40% MSCI USA Gross/<br />
10% MSCI USA Small Cap.<br />
4<br />
3 years at 0, then Russell 2000 + 500 bps through 9/07; Russell 3000 + 5% through 9/09; currently SSPEI.<br />
5<br />
61.31% S&P 500/ 10.95% S&P 400/ 4.38% S&P 600, 18.98% MSCI ACWI free-ex-US/4.38% Private Equity Composite (3 years 0, then Russell 2000+5%) through 6/04; 57%<br />
S&P 500/ 11% S&P 400/ 6% S&P 600, 20% MSCI ACWI free-ex-US/6% Russell 2000+5% through 6/05, 56.48% S&P 500/ 11.45% S&P 400/ 6.11% S&P 600, 19.85% MSCI<br />
ACWI free-ex-US/6.11% Russell 2000+5% through 3/06; 56.00% S&P 500/ 11.21% S&P 400/ 5.6% S&P 600, 20.8% MSCI ACWI free-ex-US/6.39% Russell 2000+5% through<br />
9/07; 25% Russell 1000 Growth/25% Russell 1000 Value/8.33% Russell 2000/25% MSCI EAFE + Canada/8.33% MSCI EM, 8.34% Russell 3000 + 5% through 9/08; 16.67%<br />
Russell 1000 Growth/ 16.67% Russell 1000 Value/ 8.33% Russell 2000/ 13.33% MSCI EAFE + Canada/ 8.33% MSCI EM/ 25% MSCI World/ 11.67% Russell 3000 + 5% through<br />
9/09; 10% MSCI EM Net/ 55% AC World Net/13.3 SSPEI 1 QTR lagged/ 8.4% MSCI USA Small Cap/ 13.3% MSCI USA Large Cap through 9/10; currently 16.7% MSCI EM/ 25%<br />
MSCI EAFE+Canada/ 8.3% MSCI USA Small Cap/ 33.3% MSCI USA Gross/ 16.7% SSPEI 1 QTR lagged.<br />
6<br />
96.61% SB Large Pension Fund/3.39% SB High Yield Market Index through 12/03; 96.61% LB Aggregate/3.39% SB High Yield Market Index through 06/04; 93.22% LB Aggregate/<br />
6.78% Citigroup High Yield Index through 03/05; 93.22% LB Aggregate/ 6.78% Lehman US Corp High Yield Index through 03/06; 100% LB Universal through 9/07; 66.67% Lehman<br />
Long Treasury/ 33.33% Lehman Intermediate Gov-Credit through 9/08; 80% BC Long Treasury/ 20% BC Intermediate Gov-Credit through 9/09; currently 100% BC Long Treasury.<br />
7<br />
6-month T-Bill + 300 bps through 3/03; 70% 3-month LIBOR/ 30% S&P 500 through 9/07; currently 3-month LIBOR + 2%.<br />
8<br />
90.48% SB Large Pension Fund/3.17% SB High Yield Index/4.76% Hedge Fund Composite, 1.59%/91-day T-Bill through 12/03; 90.48% LB Aggregate/3.17% SB High Yield Index<br />
/4.76% Hedge Fund Composite/1.59% 91 day T-Bill through 06/04; 87.3% LB Aggregate/ 6.35% Citigroup High Yield Index /4.76% Hedge Fund Composite/1.59% 91-day T-Bill<br />
through 03/05; 87.3% LB Aggregate/ 6.35% Lehman High Yield /4.76% Hedge Fund Composite/1.59% 91-day T-Bill through 03/06; 93.63% LB Aggregate/4.77% Hedge Fund<br />
Composite/1.6% 91-day T-Bill through 9/07; 50% Lehman Long Treasury/ 25% Lehman Intermediate Gov-Credit/ 20% Hedge Fund Composite/ 5% 91 day T-Bill through 9/08; 60%<br />
Lehman Long Treasury/ 15% Lehman Intermediate Gov-Credit/ 20% Hedge Fund Composite/ 5% 91-day T-Bill through 9/09, currently 75% Lehman Long Treasury/ 20% Hedge<br />
Fund Composite/ 5% 91-day T-Bill.<br />
9<br />
Index established 4/2006, NCREIF Property Index (1 quarter lag) + 200 bps through 9/07; 80% Real Estate Composite Index/ 20% US Core CPI + 5% through 9/08; 83% Real<br />
Estate Composite Index/ 17% US Core CPI + 5% through 9/09; currently NCREIF Open Ended Net 1 QTR lagged.<br />
10<br />
Index established 4/2006, NCREIF Property Index (1 quarter lag) + 200 bps through 9/07; 50% LB Global Inflation Linked Bond Index/ 20% Real Estate Composite Index/ 5% US<br />
Core CPI + 5%/ 15% Goldman Sachs Commodity Index/ 10% NAREIT Index through 9/08; 25% BC Global Inflation Linked Bond Index/ 25% BC US TIPS Index/ 25% Real Estate<br />
Composite Index/ 5% US Core CPI + 5%/ 10% Goldman Sachs Commodity Index/ 10% NAREIT Index through 9/09; currently 40% BC Global Inflation Linked Bond Index/ 40%<br />
NCREIF Open Ended Net 1 QTR lagged/ 10% Goldman Sachs Commodity Index/ 10% MSCI US REIT.<br />
84 INVESTMENT SECTION
TEACHER RETIREMENT SYSTEM OF TEXAS COMPREHENSIVE ANNUAL FINANCIAL REPORT <strong>2011</strong><br />
Asset Allocation<br />
PENSION TRUST FUND - AUGUST 31, <strong>2011</strong><br />
POLICY RANGES<br />
Low High Neutral Actual<br />
Public Equity 45.0% 55.0% 50.0% 50.7%<br />
Private Equity 5.0% 15.0% 10.0% 10.4%<br />
TOTAL GLOBAL EQUITY 55.0% 65.0% 60.0% 61.1%<br />
Fixed Income 1 0.0% 20.0% 15.0% 14.1%<br />
Short-Term 0.0% 5.0% 1.0% 1.3%<br />
Hedge Funds 0.0% 5.0% 4.0% 4.0%<br />
TOTAL STABLE VALUE 15.0% 25.0% 20.0% 19.4%<br />
Inflation Linked Bonds 0.0% 13.0% 8.0% 5.3%<br />
Real Assets 0.0% 13.0% 8.0% 9.7%<br />
Commodities 0.0% 7.0% 2.0% 3.1%<br />
REITS 2 0.0% 7.0% 2.0% 1.4%<br />
TOTAL REAL RETURN 15.0% 25.0% 20.0% 19.5%<br />
TOTAL 100.0%<br />
1<br />
Does not include Inflation Linked Bonds in Real Return Portfolio.<br />
2<br />
Dedicated portfolio in addition to Global Equity holdings.<br />
INVESTMENT SECTION<br />
85
TEACHER RETIREMENT SYSTEM OF TEXAS COMPREHENSIVE ANNUAL FINANCIAL REPORT <strong>2011</strong><br />
Investment Summary<br />
PENSION TRUST FUND - AUGUST 31<br />
Value in Billions<br />
MARKET VALUES (in billions) 1<br />
2006 2007 2008 2009 2010 <strong>2011</strong><br />
Public Equity $ 65.971 $ 70.551 $ 58.125 $ 48.718 $ 49.363 $ 54.312<br />
Private Equity 2.326 3.796 6.064 5.867 8.501 11.099<br />
TOTAL GLOBAL EQUITY $ 68.297 $ 74.347 $ 64.189 $ 54.585 $ 57.864 $ 65.411<br />
Fixed Income 2 $ 27.664 $ 32.076 $ 16.161 $ 13.333 $ 14.833 $ 15.121<br />
Short-Term 2.032 1.313 1.167 0.800 0.700 1.376<br />
Hedge Funds 1.682 2.817 3.997 3.582 3.947 4.324<br />
TOTAL STABLE VALUE $ 31.378 $ 36.206 $ 21.325 $ 17.715 $ 19.480 $ 20.821<br />
Inflation Linked Bonds $ n/a $ n/a $ 10.288 $ 8.509 $ 8.167 $ 5.635<br />
Real Assets 0.261 1.214 3.657 3.742 5.704 10.343<br />
Commodities n/a n/a 3.211 1.697 2.068 3.323<br />
REITS 3 n/a n/a 1.804 1.936 1.960 1.537<br />
TOTAL REAL RETURN $ 0.261 $ 1.214 $ 18.960 $ 15.884 $ 17.899 $ 20.838<br />
TOTAL $ 99.936 $ 111.767 $ 104.474 $ 88.184 $ 95.243 $ 107.070<br />
1<br />
Investment values are based on industry standard investment performance methodology. Investment values in Exhibit I are in compliance with GASB reporting<br />
standards. A reconciliation is provided below:<br />
Total Market Value at 8/31/11 $ 107.070<br />
Less Investment Related Cash (0.184)<br />
Less Investment Related Receivables (2.481)<br />
Plus Investment Related Payables 1.586<br />
Plus Short-Term Asset Pool Adjustment From Amortized Cost to Fair Value 0.027<br />
Plus Amounts Related to Collateral Activities 0.030<br />
Total Investments Exhibit I $ 106.048<br />
2<br />
Does not include Inflation Linked Bonds in Real Return Portfolio.<br />
3<br />
Dedicated portfolio in addition to Global Equity holdings.<br />
86 INVESTMENT SECTION
TEACHER RETIREMENT SYSTEM OF TEXAS COMPREHENSIVE ANNUAL FINANCIAL REPORT <strong>2011</strong><br />
Investment Summary<br />
PENSION TRUST FUND - AUGUST 31<br />
PERCENTAGE OF MARKET VALUES<br />
2006 2007 2008 2009 2010 <strong>2011</strong><br />
Public Equity 66.0% 63.1% 55.6% 55.2% 51.8% 50.7%<br />
Private Equity 2.3% 3.4% 5.8% 6.7% 8.9% 10.4%<br />
TOTAL GLOBAL EQUITY 68.3% 66.5% 61.4% 61.9% 60.7% 61.1%<br />
Fixed Income 1 27.7% 28.7% 15.5% 15.1% 15.6% 14.1%<br />
Short-Term 2.0% 1.2% 1.1% 0.9% 0.7% 1.3%<br />
Hedge Funds 1.7% 2.5% 3.8% 4.1% 4.1% 4.0%<br />
TOTAL STABLE VALUE 31.4% 32.4% 20.4% 20.1% 20.4% 19.4%<br />
Inflation Linked Bonds n/a n/a 9.9% 9.7% 8.6% 5.3%<br />
Real Assets 0.3% 1.1% 3.5% 4.2% 6.0% 9.7%<br />
Commodities n/a n/a 3.1% 1.9% 2.2% 3.1%<br />
REITS 2 n/a n/a 1.7% 2.2% 2.1% 1.4%<br />
TOTAL REAL RETURN 0.3% 1.1% 18.2% 18.0% 18.9% 19.5%<br />
TOTAL 100.0% 100.0% 100.0% 100.0% 100.0% 100.0%<br />
1<br />
Does not include Inflation Linked Bonds in Real Return Portfolio.<br />
2<br />
Dedicated portfolio in addition to Global Equity holdings.<br />
INVESTMENT SECTION<br />
87
TEACHER RETIREMENT SYSTEM OF TEXAS COMPREHENSIVE ANNUAL FINANCIAL REPORT <strong>2011</strong><br />
Largest Holdings<br />
PENSION TRUST FUND - AUGUST 31, <strong>2011</strong><br />
Top Ten Domestic Equity Market Holdings<br />
Market<br />
Total<br />
Issuer Name Value Shares<br />
Apple Incorporated $ 496,638,508 1,290,540<br />
Vanguard Small Cap ETF 482,580,000 7,000,000<br />
General Growth Properties 328,175,645 24,059,798<br />
SPDR Gold Shares 312,999,403 1,761,888<br />
Exxon Mobil Corporation 289,769,978 3,913,695<br />
Johnson & Johnson 268,483,543 4,080,297<br />
AT&T Incorporated 239,461,435 8,408,056<br />
Microsoft Corporation 236,025,205 8,873,128<br />
International Business Machines Corporation 226,558,986 1,317,893<br />
Google Incorporated A Shares 226,042,841 417,855<br />
$ 3,106,735,544 61,123,150<br />
Top Ten International Equity Market Holdings<br />
Market<br />
Total<br />
Issuer Name Value Shares<br />
Vanguard Emerging Markets ETF $ 1,117,792,260 25,433,271<br />
Nestle SA 232,937,882 3,763,830<br />
Samsung Electronics Company LTD. 216,984,251 311,142<br />
Novartis AG 205,091,291 3,519,810<br />
Roche AG 180,879,545 1,033,808<br />
Schlumberger LTD. 177,097,728 2,266,996<br />
Royal Dutch Shell A Shares 172,964,714 5,144,180<br />
Vodafone Group 161,085,657 61,448,275<br />
Sanofi 126,669,001 1,736,613<br />
British American Tobacco 120,880,069 2,706,004<br />
$ 2,712,382,398 107,363,929<br />
88 INVESTMENT SECTION
TEACHER RETIREMENT SYSTEM OF TEXAS COMPREHENSIVE ANNUAL FINANCIAL REPORT <strong>2011</strong><br />
Largest Holdings<br />
PENSION TRUST FUND - AUGUST 31, <strong>2011</strong><br />
Top Ten Fixed Income Market Holdings<br />
Market<br />
Par<br />
Description Value Value<br />
U.S. TREASURY 4.375% due 15 Nov 2039 $ 1,335,395,476 $ 1,166,050,000<br />
U.S. TREASURY 4.500% due 15 Feb 2036 1,004,217,612 854,050,000<br />
U.S. TREASURY 4.375% due 15 Feb 2038 928,656,805 807,900,000<br />
U.S. TREASURY 3.500% due 15 Feb 2039 860,564,804 871,820,000<br />
U.S. TREASURY 4.250% due 15 May 2039 799,808,630 712,074,000<br />
U.S. TREASURY 4.375% due 15 May 2040 674,369,035 589,195,000<br />
U.S. TREASURY 2.375% due 15 Jan 2025 627,577,359 508,159,805<br />
U.S. TREASURY 3.875% due 15 Aug 2040 610,047,227 579,970,000<br />
U.S. TREASURY 5.500% due 15 Aug 2028 563,589,091 425,100,000<br />
U.S. TREASURY 6.125% due 15 Nov 2027 537,962,363 382,600,000<br />
$ 7,942,188,402 $ 6,896,918,805<br />
Note: A complete listing of portfolio holdings is available by contacting the <strong>TRS</strong> Communications Department.<br />
INVESTMENT SECTION<br />
89
TEACHER RETIREMENT SYSTEM OF TEXAS COMPREHENSIVE ANNUAL FINANCIAL REPORT <strong>2011</strong><br />
Schedule of Fees and Commissions<br />
INVESTMENT PENSION TRUST SECTION<br />
FUND<br />
FOR THE FISCAL YEAR ENDED AUGUST 31, <strong>2011</strong><br />
Fund Name*<br />
Fees<br />
ACI Multi-Strategy Market Neutral Fund LTD $ 4,709,365<br />
Advent International GPE VI-A, L.P. 2,731,201<br />
AEW Core Property Trust (U.S.), Inc. 916,917<br />
AEW Senior Housing Investors, L.P. 444,902<br />
AG Real Value Fund, LLC 2,247,669<br />
Aleutian Fund LTD 4,805,257<br />
Alpha Private Equity Fund V, L.P. 46,815<br />
Alterna Core Capital Assets Fund, L.P. 1,612,325<br />
Amici Fund International LTD 4,041,829<br />
Apax Europe V-A, L.P. 692,314<br />
Apax Europe VII-A, L.P. 5,671,968<br />
Apollo Credit Opportunity Fund II, L.P. 2,840,507<br />
Apollo Investment Fund VII, L.P. 6,026,398<br />
AQR Global Stock Selection Fund, LLC 1,691,947<br />
ARA Asia Dragon LTD 2,250,001<br />
Austin Ventures VIII, L.P. 523,676<br />
Avenue Special Situations Fund V, L.P. 5,629,578<br />
Bain Capital Fund VIII, L.P. 598,809<br />
Bain Capital VII Coinvestment Fund, L.P. 228,128<br />
Bain Capital VIII Coinvestment Fund, L.P. 626,285<br />
Black Diamond Relative Value LTD 1,650,542<br />
BlackRock Diamond Property Fund, Inc. 545,564<br />
BlackRock Retail Opportunity Fund, LLC 388,350<br />
Blackstone / GSO Capital Solutions Fund, L.P. 340,000<br />
Blackstone Capital Partners V, L.P. 3,944,137<br />
Blackstone Capital Partners VI, L.P. 2,051,267<br />
Blackstone GGP Principal Transaction Partners, L.P. 27,481<br />
Blackstone Real Estate Partners Europe III, L.P. 3,484,813<br />
Blackstone Real Estate Partners V, L.P. 1,814,992<br />
Blackstone Real Estate Partners VI, L.P. 3,749,404<br />
BlueTrend Fund LTD 4,198,660<br />
Bridgepoint Europe IV, L.P. 3,863,367<br />
Brockton Capital Fund II, L.P. 2,976,241<br />
Brookfield Americas Infrastructure Fund, L.P. 2,682,671<br />
Camden Multifamily Co-Investment Fund, L.P. 35,474<br />
Camden Multifamily Value Add Fund, L.P. 2,250,000<br />
Candover 2001 Fund, L.P. 146,736<br />
Canyon-Johnson Urban Fund III, L.P. 1,000,000<br />
Capmark Commercial Realty Partners II, L.P. 602,138<br />
Capmark Commercial Realty Partners III, L.P. 1,467,900<br />
Capmark Structured Real Estate Partners, L.P. 942,493<br />
90 INVESTMENT SECTION
TEACHER RETIREMENT SYSTEM OF TEXAS COMPREHENSIVE ANNUAL FINANCIAL REPORT <strong>2011</strong><br />
Schedule of Fees and Commissions<br />
INVESTMENT PENSION TRUST SECTION<br />
FUND<br />
FOR THE FISCAL YEAR ENDED AUGUST 31, <strong>2011</strong><br />
(continued)<br />
Fund Name*<br />
Fees<br />
Capri Urban Investors, LLC $ 835,456<br />
Carlyle Europe Partners III, L.P. 1,734,835<br />
Carlyle Europe Real Estate Partners III, L.P. 1,462,327<br />
Carlyle Partners III, L.P. 71,973<br />
Carlyle Partners IV, L.P. 773,333<br />
Carlyle Partners V, L.P. 5,334,273<br />
Carlyle Realty Partners V, L.P. 1,437,429<br />
CB Richard Ellis Strategic Partners U.S. Opportunity V, L.P. 623,680<br />
CB Richard Ellis Strategic Partners U.S. Value V, L.P. 957,234<br />
Cerberus Institutional (Series Four), L.P. 1,385,096<br />
Charterhouse Capital Partners IX, L.P. 5,943,353<br />
Charterhouse Capital Partners VIII, L.P. 949,365<br />
CIM Fund III, L.P. 2,109,376<br />
CIM Urban REIT, LLC 1,544,355<br />
Colony Distressed Credit Fund, L.P. 3,817,300<br />
Colony Investors VIII, L.P. 3,082,900<br />
Congress Avenue Partners, L.P. 5,048,967<br />
CPI Capital Partners Europe, L.P. 919,324<br />
Credit Suisse CFIG Middle Market Buyout 1,800,000<br />
Credit Suisse CFIG RE-UP Bridge Program 163,247<br />
Crestview Partners II, L.P. 1,480,428<br />
CSFB Emerging Opportunities Fund, L.P. 3,329,656<br />
CVC Capital Partners Asia Pacific III, L.P. 4,137,082<br />
CVC European Equity Partners IV, L.P. 251,806<br />
CVC European Equity Partners Tandem Fund, L.P. 375,230<br />
CVC European Equity Partners V, L.P. 3,898,993<br />
D. E. Shaw BMCAE Special Fund, L.P. 2,162,464<br />
Deephaven Global Multi-Strategy Fund LTD 61,497<br />
Double Black Diamond LTD 3,841,830<br />
EnCap Energy Capital Fund VII, L.P. 905,992<br />
EnCap Energy Infrastructure Fund, L.P. 1,347,358<br />
Energy Fund XV, L.P. 1,807,243<br />
ESL Limited 4,164,012<br />
FC Co-Investment Partners, L.P. 2,667<br />
First Reserve Energy Infrastructure Fund, L.P. 2,847,175<br />
First Reserve Fund X, L.P. 425,098<br />
First Reserve Fund XI, L.P. 1,887,000<br />
First Reserve Fund XII, L.P. 4,238,000<br />
Five Arrows Realty Securities V Co-Investment, L.P. 53,739<br />
Five Arrows Realty Securities V, L.P. 297,189<br />
Five Mile Capital Partners II, L.P. 3,000,000<br />
INVESTMENT SECTION<br />
91
TEACHER RETIREMENT SYSTEM OF TEXAS COMPREHENSIVE ANNUAL FINANCIAL REPORT <strong>2011</strong><br />
(continued)<br />
Schedule of Fees and Commissions<br />
INVESTMENT PENSION TRUST SECTION<br />
FUND<br />
FOR THE FISCAL YEAR ENDED AUGUST 31, <strong>2011</strong><br />
Fund Name*<br />
Fees<br />
Focus Select Fund LTD $ 1,608,887<br />
Footbridge Captital Fund, Inc. 4,407<br />
Fore Multi Strategy Offshore Fund LTD 5,957,012<br />
Forum Asian Realty Income II, L.P. 993,319<br />
Forum Asian Realty Income III, L.P. 2,000,001<br />
Forum Europe Realty Income III, L.P. 1,523,831<br />
Fudo Capital II, L.P. 2,625,000<br />
GoldenTree Offshore Fund LTD 267,911<br />
Goldman Sachs Vintage Fund, L.P. 25,994<br />
Gores Capital Partners III, L.P. 3,849,000<br />
Gramercy Offshore Fund LTD 25,299<br />
Green Equity Investors V, L.P. 419,574<br />
GSO Special Situations Fund, L.P. 5,536,686<br />
Halcyon European Structured Opportunities Offshore Fund LTD 51,343<br />
Halcyon Partners Offshore LTD 3,419,609<br />
Heitman America Real Estate Trust, L.P. 936,574<br />
Hellman & Friedman Capital Partners V, L.P. 219,457<br />
Hellman & Friedman Capital Partners VI, L.P. 1,499,000<br />
Henderson Asia Pacific Absolute Return Fund LTD 1,861,018<br />
Henderson Japan Absolute Return Fund LTD 880,160<br />
HgCapital 5, L.P. ** (1,010,446)<br />
HgCapital 6, L.P. 2,626,252<br />
Highland Capital Partners VI - B, L.P. 914,384<br />
Invesco San Jacinto Core Fund, L.P. 341,366<br />
Investcorp Interlachen Multi-Strategy Fund LTD 50,865<br />
Investcorp Silverback Arbitrage Fund LTD 1,116,837<br />
Investcorp Waterloo Macro Fund LTD 1,862,574<br />
Investcorp White Eagle European Fund LTD 284,640<br />
Iron Point Real Estate Partners, L.P. 1,500,000<br />
Ivory Offshore Flagship Fund LTD 1,528,407<br />
J.H. Whitney V, L.P. 370,220<br />
J.H. Whitney VI, L.P. 248,585<br />
JPMCB Strategic Property Fund 2,474,760<br />
Kelso Investment Associates VII, L.P. 498,388<br />
Kelso Investment Associates VIII, L.P. 4,491,000<br />
King Street Capital LTD 4,669,295<br />
KKR 2006 Fund, L.P. 3,251,534<br />
KKR FI Partners I, L.P. 1,126,769<br />
KKR Mezzanine Partners I, L.P. 1,402,033<br />
KKR Natural Resources I, L.P. 1,562,500<br />
Kohlberg TE Investors VI, L.P. 1,528,703<br />
92 INVESTMENT SECTION
TEACHER RETIREMENT SYSTEM OF TEXAS COMPREHENSIVE ANNUAL FINANCIAL REPORT <strong>2011</strong><br />
Schedule of Fees and Commissions<br />
INVESTMENT PENSION TRUST SECTION<br />
FUND<br />
FOR THE FISCAL YEAR ENDED AUGUST 31, <strong>2011</strong><br />
(continued)<br />
Fund Name*<br />
Fees<br />
L&B Diversified Strategy Partners, L.P. $ 1,116,570<br />
Lansdowne Pecan Street Europe, L.P. 1,598,289<br />
LaSalle Property Fund, L.P. 379,576<br />
Lee Equity Partners, L.P. 2,943,467<br />
Level Global Overseas LTD 590,536<br />
Level Global, L.P. 226,608<br />
Lindsay Goldberg III, L.P. 3,601,218<br />
Lion Capital Fund I, L.P. 357,816<br />
Lion Capital Fund II, L.P. 2,968,589<br />
Lion Capital Fund III, L.P. 4,273,916<br />
Lionstone Cash Flow Real Estate Partners One, L.P. 555,281<br />
Lone Star Real Estate Fund II (U.S.), L.P. 4,575,000<br />
Longacre International LTD 1,366,982<br />
MacFarlane Urban Real Estate Fund II, L.P. 1,034,503<br />
Madison Dearborn Capital Partners IV, L.P. 360,121<br />
Marathon Credit Dislocation Fund, L.P. 3,207,580<br />
MKP Credit Offshore LTD 6,595,773<br />
Morgan Creek Partners Asia, L.P. 1,058,274<br />
Morgan Stanley Infrastructure Partners, L.P. 3,000,000<br />
Morgan Stanley RE Mezzanine Partners A, L.P. 115,972<br />
Nautic Partners V, L.P. 89,600<br />
New Enterprise Associate-s XIII, L.P. 1,629,204<br />
Nordic Capital Fund V, L.P. 200,012<br />
Northwest Fund LTD 2,674,783<br />
NuWave Offshore Fund LTD 2,799,392<br />
Oak Investment Partners X, L.P. 1,076,671<br />
Oak Investment Partners XI, L.P. 1,512,510<br />
Oak Investment Partners XII, L.P. 2,464,829<br />
Oaktree Loan Fund 2x, L.P. 860,670<br />
Oaktree Opportunities Fund VIII, L.P. 1,359,194<br />
Oaktree TT Multi-Strategy Fund, L.P. 895,917<br />
OCM Opportunities Fund VI, L.P. 258,856<br />
OCM Opportunities Fund VII, L.P. 658,414<br />
OCM Opportunities Fund VIIb, L.P. 1,434,389<br />
O’Connor Global Fundamental Market Neutral Long/Short LTD 4,913,987<br />
Onex Partners II, L.P. 834,838<br />
Onex Partners III, L.P. 3,703,742<br />
Onex Partners, L.P. 280,615<br />
P2 Capital Master Fund VI, L.P. 4,373,335<br />
Parkway Properties Office Fund II, L.P. 733,900<br />
Patria-Brazilian Private Equity IV, L.P. 986,301<br />
INVESTMENT SECTION<br />
93
TEACHER RETIREMENT SYSTEM OF TEXAS COMPREHENSIVE ANNUAL FINANCIAL REPORT <strong>2011</strong><br />
(continued)<br />
Schedule of Fees and Commissions<br />
INVESTMENT PENSION TRUST SECTION<br />
FUND<br />
FOR THE FISCAL YEAR ENDED AUGUST 31, <strong>2011</strong><br />
Fund Name*<br />
Fees<br />
PCCP Mezzanine Recovery Partners II, L.P. $ 714,440<br />
Permira Europe III, L.P. 504,904<br />
Permira IV, L.P. 2,644,575<br />
Perry Partners International, Inc. 4,986,651<br />
PIMCO Distressed Mortgage Fund, L.P. 7,537,111<br />
PLA Residential Fund III, L.P. 2,332,963<br />
PLA Residential Fund IV, L.P. 1,498,471<br />
PLA Retail Fund I, L.P. 756,936<br />
Polaris Venture Partners IV, L.P. 1,977,138<br />
PREI Mezzanine Fund I, L.P. 1,134,861<br />
Prime Property Fund, LLC 1,719,400<br />
Principal Green Property Fund I, L.P. 1,107,386<br />
Principal Green Property Sidecar I, L.P. 183,447<br />
Principal Real Estate Strategic Debt Fund I, L.P. 991,928<br />
Principal Real Estate Strategic Equity Fund I, L.P. 1,318,750<br />
PRISA 1,747,887<br />
PRISA II 1,490,934<br />
ProLogis Mexico Industrial Fund I, L.P. 491,940<br />
Prologis Targeted U.S. Logistics REIT, Inc. 951,252<br />
Providence Equity Partners V, L.P. 457,097<br />
Providence Equity Partners VI, L.P. 1,143,597<br />
Quad-C Partners VI, L.P. 58,663<br />
Quad-C Partners VII Co-Investment, L.P. 270,849<br />
Quad-C Partners VII, L.P. 1,014,759<br />
Ranger Co-Investment Fund, L.P. 733,093<br />
Red River Direct Investment Fund, L.P. 2,500,001<br />
Red River HYPI 2,917<br />
Red River Venture Capital Fund, L.P. 290,044<br />
Republic Loan Funding LTD 2,150,239<br />
RLJ Real Estate Fund III, L.P. 843,750<br />
RMBS Opportunities Fund, L.P. 397,299<br />
Rock Creek Limestone Emerging Markets, L.P. 2,775,175<br />
RREEF America REIT III, Inc. 460,981<br />
Shepherd Investments International LTD 675,621<br />
SP5 Wood Partners Co-Investment Venture 2, L.P. 11,625<br />
SP5 Wood Partners Development, L.P. 130,381<br />
Squadron Emerging Asia Fund, L.P. 1,000,000<br />
Square Mile Partners III, L.P. 2,187,500<br />
SteelRiver Infrastructure Fund North America, L.P. 4,024,056<br />
STG Capital Fund LTD 407,137<br />
Stockbridge Real Estate Fund II, L.P. 696,244<br />
94 INVESTMENT SECTION
TEACHER RETIREMENT SYSTEM OF TEXAS COMPREHENSIVE ANNUAL FINANCIAL REPORT <strong>2011</strong><br />
Schedule of Fees and Commissions<br />
INVESTMENT PENSION TRUST SECTION<br />
FUND<br />
FOR THE FISCAL YEAR ENDED AUGUST 31, <strong>2011</strong><br />
(continued)<br />
Fund Name*<br />
Fees<br />
Stockbridge Real Estate Fund III, L.P. $ 2,250,000<br />
Stratford Land Fund III, L.P. 1,846,182<br />
Stratford Land Fund IV, L.P. 2,605,575<br />
TA X, L.P. 672,652<br />
TA XI, L.P. 1,505,815<br />
Texas Growth Fund II - 1998 Trust 3,984,123<br />
Thayer Hotel Investors V, L.P. 2,332,882<br />
The Resolute Fund, L.P. ** (504,024)<br />
Thomas H. Lee Equity Partners V, L.P. 110,107<br />
TLF Logistics II, L.P. 90,762<br />
TLF Logistics, L.P. 1,217,137<br />
TPG Partners V, L.P. 836,608<br />
TPG Partners VI, L.P. 2,798,544<br />
TPG STAR, L.P. 1,971,015<br />
Tricon IX, L.P. 1,175,000<br />
Triton Fund II, L.P. 297,506<br />
Triton Fund III, L.P. 3,517,388<br />
TT-EEIF Co-Investments, LLC 51,318<br />
U.S. Government Building Fund, LLC 917,911<br />
U.S. Republic Core Fund, L.P. 444,923<br />
Vicis Capital Fund (International) 254,946<br />
Walker Smith International Fund LTD 3,174,167<br />
Walton Street Real Estate Fund Sidecar V, L.P. 170,288<br />
Walton Street Real Estate Fund V, L.P. 906,564<br />
Walton Street Real Estate Fund VI, L.P. 1,218,314<br />
Warburg Pincus Private Equity X, L.P. 3,303,397<br />
Wayzata Opportunities Fund II, L.P. 3,428,444<br />
Westbrook Real Estate Fund VIII, L.P. 2,250,000<br />
Willis Stein & Partners III, L.P. 581,717<br />
Wolverine Convertible Arbitrage Fund LTD 7,844,378<br />
Zachry Hastings Infrastructure Partners, L.P. 1,476,866<br />
Zais Lubeck II-A CLO Fund, L.P. 171,609<br />
Zaxis Offshore LTD 1,937,668<br />
Total $ 416,378,165<br />
* Fees are earned by the funds based on each fund’s governing documents. <strong>TRS</strong> calculates returns for these funds net of all fees.<br />
** Negative balance is equal to the refund in the current year of expenses paid in a prior year.<br />
INVESTMENT SECTION<br />
95
TEACHER RETIREMENT SYSTEM OF TEXAS COMPREHENSIVE ANNUAL FINANCIAL REPORT <strong>2011</strong><br />
(continued)<br />
Schedule of Fees and Commissions<br />
INVESTMENT PENSION TRUST SECTION<br />
FUND<br />
FOR THE FISCAL YEAR ENDED AUGUST 31, <strong>2011</strong><br />
External Manager ***<br />
Fees<br />
Acadian Asset Management, LLC $ $874,705<br />
Alliance Bernstein, L.P. 885,780<br />
Artio Global Investment Management, LLC**** (1,036)<br />
Artisan Partners Limited Partnership 3,933,137<br />
Barclays Capital Fund Solutions - Americas 163,580<br />
Baring International Investment LTD 3,513,211<br />
BlackRock <strong>Financial</strong> Management, Inc. 6,757,453<br />
BME Investment Partners, LLC 374,304<br />
Brandes Investment Partners, L.P. 3,020,878<br />
Cantillion Pacific LTD 3,201,790<br />
DePrince Race & Zolllo, Inc. 3,003,335<br />
Dimensional Fund Advisors, L.P. 7,377,092<br />
Eaton Vance Management 5,276,314<br />
GMO, LLC 1,234,127<br />
Goldman Sachs Asset Management, L.P. 1,261,083<br />
Independent Franchise Partners, LLP 392,134<br />
Jennison Associates, LLC 2,458,120<br />
JP Morgan Asset Management, Inc. 17,023,093<br />
Knight Vinke Asset Management, LLC 2,203,727<br />
Lazard Asset Management, LLC 4,700,714<br />
Marathon Asset Management 7,186,414<br />
Mondrian Investment Partners LTD 744,201<br />
Morgan Stanley Investment Management, Inc. 7,592,636<br />
Neuberger Berman, LLC 17,052,365<br />
Omega Advisors, Inc. 19,472,146<br />
P2 Capital Partners, LLC **** (599,002)<br />
Penn Capital Management Co., Inc. 638,045<br />
Platinum Investment Management LTD 3,566,607<br />
Sasco Capital, Inc. 2,278,491<br />
Security Capital Research & Management, Inc. 805,314<br />
Stephens Investment Management Group 1,237,896<br />
Vaughan Nelson Investment Management, L.P. 1,962,708<br />
Wellington Management Company, LLP 5,985,636<br />
Westwood Management Corp. 2,377,057<br />
Total $ 137,954,055<br />
*** Fees are accrued or paid to external investment managers based on assets under management and the performance of the investment manager. <strong>TRS</strong><br />
calculates returns for these managers net of all fees.<br />
**** Negative balances are equal to the refund in the current year of expenses accrued in the prior year.<br />
96 INVESTMENT SECTION
TEACHER RETIREMENT SYSTEM OF TEXAS COMPREHENSIVE ANNUAL FINANCIAL REPORT <strong>2011</strong><br />
Schedule of Fees and Commissions<br />
INVESTMENT PENSION TRUST SECTION<br />
FUND<br />
FOR THE FISCAL YEAR ENDED AUGUST 31, <strong>2011</strong><br />
Average<br />
Shares Commissions Commission<br />
Brokerage Firm - Domestic Traded Paid per Share<br />
Abel Noser Corporation 18,900 $ 283 $ 0.015<br />
ABN AMRO Bank N.V. 92,935 4,036 0.045<br />
Access Securities, Inc. 44,780 1,343 0.030<br />
Allen & Company, LLC 4,778 177 0.037<br />
American Technology Research, Inc. 441,033 16,149 0.037<br />
Ancora Securities, Inc. 151,460 6,058 0.040<br />
Assent, LLC 95,500 1,537 0.020<br />
Atlantic Equities, L.P. 128,850 2,148 0.017<br />
Auerbach Grayson & Co. 51,760 1,812 0.035<br />
Avondale Partners, LLC 284,040 11,362 0.040<br />
Barclays Capital, Inc. 600,302,521 4,871,740 0.027<br />
Bear Stearns Securities Corp. 460,008 18,353 0.040<br />
Bley Investment Group 4,055,172 117,266 0.027<br />
Bloomberg Tradebook, LLC 8,042,796 139,676 0.015<br />
BMO Capital Markets 11,187,726 339,248 0.034<br />
BMO Nesbitt Burns, Inc. 104,336 5,386 0.047<br />
BNP Paribas Securities Corp. 41,500 1,824 0.066<br />
BNY Convergex 21,825,859 893,371 0.039<br />
BNY Mellon 247,205 9,551 0.039<br />
BOE Securities, Inc./Broadcort Cap Corp. 1,965,102 49,080 0.026<br />
Brean Murray, Carret & Co., LLC 177,003 6,965 0.038<br />
Bridge Trading Company 35,690 1,428 0.040<br />
Broadcort Capital Corp. 130,800 5,232 0.040<br />
Brockhouse & Cooper, Inc. 120,697 2,136 0.019<br />
Brown Brothers Harriman & Co. 19,200 768 0.040<br />
Brunswick Warburg Nominees 4,843,548 21,883 0.004<br />
BTIG, LLC 7,849,263 110,504 0.019<br />
B-Trade Services, LLC 4,466,491 89,330 0.020<br />
Buckingham Research Group, Inc. 85,660 3,286 0.039<br />
Cabrera Capital Markets 586,262 17,588 0.030<br />
Canaccord Genuity, Inc. 1,136,499 39,787 0.037<br />
Canadian Imperial Bank of Commerce 58,643 2,595 0.057<br />
Cantor Fitzgerald & Co. 25,580,765 775,570 0.032<br />
Capital Institutional Services, Inc. 5,894,528 145,655 0.020<br />
Caris & Company, Inc. 78,906 2,629 0.036<br />
Carr Securities Corp. 713 21 0.029<br />
(continued)<br />
INVESTMENT SECTION<br />
97
TEACHER RETIREMENT SYSTEM OF TEXAS COMPREHENSIVE ANNUAL FINANCIAL REPORT <strong>2011</strong><br />
(continued)<br />
Schedule of Fees and Commissions<br />
INVESTMENT PENSION TRUST SECTION<br />
FUND<br />
FOR THE FISCAL YEAR ENDED AUGUST 31, <strong>2011</strong><br />
Average<br />
Shares Commissions Commission<br />
Brokerage Firm - Domestic Traded Paid per Share<br />
Cedel Bank 53,866 $ 1,001 $ 0.019<br />
Charles River Brokerage 150 2 0.013<br />
Citation Group 898,916 16,767 0.018<br />
Citigroup Global Markets, Inc. 48,826,662 934,783 0.021<br />
CL King & Associates, Inc. 163,710 5,112 0.037<br />
CLSA Singapore Pte. LTD 83,200 6,799 0.083<br />
Collins Stewart, LLC 106,719 3,709 0.037<br />
Cowen & Company, LLC 3,794,081 131,067 0.037<br />
Craig - Hallum 621,045 24,585 0.039<br />
Credit Agricole 4,566,016 96,382 0.024<br />
Credit Lyonnais Securities, Inc. 138,500 4,155 0.030<br />
Credit Research & Trading, LLC 33,100 1,324 0.040<br />
Credit Suisse First Boston 465,759,858 5,050,733 0.023<br />
CSI US Institutional Desk 673,082 26,656 0.039<br />
Cuttone & Co., Inc. 5,200 117 0.023<br />
Dahlman Rose & Company, LLC 64,815 2,593 0.040<br />
Davenport & Co. of Virginia, Inc. 189,829 7,593 0.040<br />
David H. Rankin & Co. 1,170,497 23,410 0.020<br />
Davidson D.A. & Company, Inc. 65,849 2,634 0.040<br />
Dematted Monness, LLC 176,400 6,422 0.033<br />
Deutsche Bank Securities, Inc. 58,118,892 1,409,455 0.021<br />
Dominick & Dominick 166,981 6,208 0.033<br />
Dowling & Partners 41,117 1,606 0.039<br />
East Shore Partners, Inc. 258,933 9,376 0.038<br />
Evercore Group, LLC 217,797 8,058 0.037<br />
Fidelity Capital Markets 3,830,230 81,251 0.024<br />
Fig Partners, LLC 148,187 5,927 0.040<br />
<strong>Financial</strong> Advisory Clinic Investments, Inc. 38,180 1,145 0.030<br />
First Analysis Securities Corp. 31,200 1,560 0.050<br />
First Clearing, LLC 249,140 9,966 0.040<br />
Fortis Clearing Americas, LLC 1,944,293 45,986 0.024<br />
Friedman, Billings & Ramsey 2,035,291 68,585 0.032<br />
GFI Securities, LLC 748 28 0.037<br />
GMP Securities, L.P. 6,800 272 0.040<br />
Goldman Sachs & Co. 101,503,245 2,116,738 0.021<br />
Goldsmith & Harris 28,320 1,133 0.040<br />
98 INVESTMENT SECTION
TEACHER RETIREMENT SYSTEM OF TEXAS COMPREHENSIVE ANNUAL FINANCIAL REPORT <strong>2011</strong><br />
Schedule of Fees and Commissions<br />
INVESTMENT PENSION TRUST SECTION<br />
FUND<br />
FOR THE FISCAL YEAR ENDED AUGUST 31, <strong>2011</strong><br />
Gordon, Haskett & Company 570,960 $ 22,838 $ 0.040<br />
Green Street Advisors 100,588 3,498 0.036<br />
Greig Middleton & Co. 406,600 15,044 0.037<br />
Guggenheim Capital Markets, LLC 14,566 539 0.037<br />
Guzman & Co. 5,083,193 116,284 0.021<br />
Heflin & Co., LLC 73,660 2,946 0.040<br />
Height Securities, LLC 47,700 1,908 0.040<br />
Hibernia Southcoast Capital, Inc. 733,776 28,972 0.039<br />
Howard Weil, Inc. 767,776 30,479 0.039<br />
HSBC Securities, Inc. 4,930,170 105,264 0.023<br />
Hudson Securities, Inc. 25,800 1,032 0.040<br />
ING Bank N.V. 735,825 15,952 0.103<br />
Instinet, LLC 25,610,765 703,993 0.018<br />
Invemed Associates 18,800 752 0.040<br />
Investment Technology Group, Inc. 24,504,063 484,002 0.019<br />
ISI Group, Inc. 3,479,265 94,539 0.029<br />
Island Trader Securities, Inc. 45,693 1,698 0.038<br />
J.A. Glynn & Co. 79,100 1,582 0.020<br />
Jackson Partners & Associates, Inc. 560,310 22,412 0.040<br />
Jackson Securities 3,545,050 106,522 0.031<br />
Janco Partners, Inc. 42,940 1,718 0.040<br />
Janney Montgomery Scott, LLC 717,066 28,235 0.039<br />
Jefferies & Company, Inc. 32,492,264 785,274 0.026<br />
JFD Securities 819,876 25,436 0.031<br />
JMP Securities 333,889 13,069 0.041<br />
JNK Securities, Inc. 45,385 1,815 0.040<br />
Johnson Rice & Co. 378,389 15,136 0.040<br />
Jones Trading Institutional Services, LLC 16,400,104 521,451 0.035<br />
JP Morgan Securities, Inc. 111,390,827 1,994,980 0.023<br />
Kaufman Brothers 25,400 1,016 0.040<br />
Keefe Bruyette & Woods, Inc. 592,353 20,655 0.030<br />
Keybanc Capital Markets, Inc. 1,713,109 61,428 0.039<br />
Knight Securities 16,587,239 447,768 0.019<br />
LaBranche <strong>Financial</strong> Services, LLC 8,925 89 0.010<br />
Lazard Capital Markets, LLC 1,488,727 49,334 0.037<br />
Leerink Swann & Company 499,503 19,359 0.039<br />
(continued)<br />
Average<br />
Shares Commissions Commission<br />
Brokerage Firm - Domestic Traded Paid per Share<br />
INVESTMENT SECTION<br />
99
TEACHER RETIREMENT SYSTEM OF TEXAS COMPREHENSIVE ANNUAL FINANCIAL REPORT <strong>2011</strong><br />
(continued)<br />
Schedule of Fees and Commissions<br />
INVESTMENT PENSION TRUST SECTION<br />
FUND<br />
FOR THE FISCAL YEAR ENDED AUGUST 31, <strong>2011</strong><br />
Average<br />
Shares Commissions Commission<br />
Brokerage Firm - Domestic Traded Paid per Share<br />
Liquidnet, Inc. 15,211,242 $ 303,349 $ 0.020<br />
Longbow Securities, LLC 199,807 7,992 0.040<br />
Loop Capital Markets, LLC 5,403,619 108,072 0.020<br />
M.R. Beal & Company 6,103,703 119,732 0.016<br />
M.S. Howells & Co. 21,540 862 0.040<br />
Macquarie Bank Limited 1,292,090 74,362 0.052<br />
Madison Williams and Company 82,200 2,793 0.035<br />
Man Securities, Inc. 55,040 2,067 0.035<br />
Maxim Group 26,400 1,056 0.040<br />
Melvin Securities 7,300 73 0.010<br />
Merrill Lynch and Co., Inc. 76,434,571 1,491,866 0.024<br />
Merriman Curhan Ford & Co. 380,160 15,206 0.040<br />
Miller Tabak & Company, LLC 109,440 4,332 0.039<br />
Mizuho Securities USA, Inc. 390,027 15,601 0.040<br />
MKM Partners, LLC 176,835 7,029 0.039<br />
Mogavero Lee & Co., Inc. 729,660 29,186 0.040<br />
Morgan Joseph & Co., Inc. 207,170 7,479 0.035<br />
Morgan Keegan & Co., Inc. 448,413 17,852 0.038<br />
Morgan Stanley Co., Inc. 84,874,990 2,364,624 0.022<br />
National <strong>Financial</strong> Services Corp. 9,492,928 272,427 0.023<br />
Needham & Company 860,026 30,520 0.036<br />
Nomura Securities International, Inc. 12,866,611 263,532 0.019<br />
O’Connor & Co., LLC 628,800 13,681 0.024<br />
Oppenheimer & Co., Inc. 2,953,957 108,804 0.036<br />
Oscar Gruss & Son, Inc. 38,600 1,544 0.040<br />
Pacific Crest Securities 45,372 2,048 0.043<br />
Penserra Securities, LLC 6,780,850 178,203 0.021<br />
Penson <strong>Financial</strong> Services, Inc. 1,258,006 45,797 0.036<br />
Pershing, LLC 80,684,745 694,485 0.033<br />
Pickering Energy Partners, Inc. 447,534 17,118 0.037<br />
Pipeline Trading Systems, LLC 1,173,873 16,225 0.015<br />
Piper Jaffray 1,663,428 43,138 0.041<br />
Portales Partners, LLC 124,905 4,792 0.039<br />
Prime Executions, Inc. 64,600 1,938 0.030<br />
Pritchard Capital Partners, LLC 81,205 3,248 0.040<br />
Pulse Trading, LLC 244,841 4,974 0.016<br />
100 INVESTMENT SECTION
TEACHER RETIREMENT SYSTEM OF TEXAS COMPREHENSIVE ANNUAL FINANCIAL REPORT <strong>2011</strong><br />
Schedule of Fees and Commissions<br />
INVESTMENT PENSION TRUST SECTION<br />
FUND<br />
FOR THE FISCAL YEAR ENDED AUGUST 31, <strong>2011</strong><br />
Raymond James & Associates, Inc. 3,025,749 $ 117,475 $ 0.040<br />
RBC Capital Markets 16,091,488 446,451 0.028<br />
RBS Securities, Inc. 24,272 302 0.013<br />
Renaissance Capital 17,977,036 22,748 0.028<br />
Reynders, Gray & Company, Inc. 662,470 26,499 0.040<br />
Ridge Clearing & Outsourcing Solutions 2,969,395 95,677 0.033<br />
Robert W. Baird & Co., Inc. 2,882,336 115,866 0.040<br />
Rochdale Securities, LLC 1,272,080 50,354 0.039<br />
Rosenblatt Securities, LLC 2,137 43 0.020<br />
ROTH Capital Partners, LLC 1,295,716 41,560 0.034<br />
Sanders Morris Harris 131,330 5,253 0.040<br />
Sandler O’Neill & Partners, L.P. 445,689 17,653 0.038<br />
Sanford C. Bernstein Co., LTD 24,436,418 534,798 0.020<br />
Santander Investment Securities, Inc. 455,900 18,236 0.040<br />
Schneider Bernet & Hickman, Inc. 45,100 1,804 0.040<br />
Scotia Capital (USA), Inc. 26,601 760 0.038<br />
Scott & Stringfellow, Inc. 425,889 16,939 0.040<br />
SG Americas Securities, LLC 10,176,485 206,032 0.020<br />
Sidoti & Company, LLC 311,396 13,092 0.044<br />
Simmons & Company International 182,308 7,140 0.040<br />
SJ Levinson & Sons, LLC 8,935,893 249,828 0.025<br />
Soleil Securities 57,365 2,295 0.040<br />
Spear, Leeds & Kellogg 412,296 5,538 0.014<br />
Standard Chartered Bank 6,400 569 0.088<br />
State Street Global Markets, LLC 189,058 5,470 0.030<br />
Stephens, Inc. 1,137,795 45,473 0.040<br />
Sterne Agee & Leach, Inc. 4,187,198 138,758 0.037<br />
Stifel Nicolaus & Co., Inc. 7,713,077 244,243 0.036<br />
Strategas Securities, LLC 72,810 2,912 0.040<br />
Stuart Frankel & Co., Inc. 23,400 936 0.040<br />
Suntrust Capital Markets, Inc. 460,322 17,763 0.039<br />
TD Waterhouse 3,428 127 0.034<br />
The Benchmark Company, LLC 245,062 9,744 0.037<br />
Thinkequity Partners, LLC 123,711 5,731 0.047<br />
Troika Dialog (UK) LTD 1,622,017 11,141 0.014<br />
Tudor, Pickering, Holt & Co. 333,207 9,448 0.026<br />
(continued)<br />
Average<br />
Shares Commissions Commission<br />
Brokerage Firm - Domestic Traded Paid per Share<br />
INVESTMENT SECTION<br />
101
TEACHER RETIREMENT SYSTEM OF TEXAS COMPREHENSIVE ANNUAL FINANCIAL REPORT <strong>2011</strong><br />
(continued)<br />
Schedule of Fees and Commissions<br />
INVESTMENT PENSION TRUST SECTION<br />
FUND<br />
FOR THE FISCAL YEAR ENDED AUGUST 31, <strong>2011</strong><br />
Average<br />
Shares Commissions Commission<br />
Brokerage Firm - Domestic Traded Paid per Share<br />
,<br />
Tuohy Brothers Investment Research, Inc. 23,700 $ 948 $ 0.040<br />
UBS AG 46,144,821 978,429 0.020<br />
UniCredit Bank AG 10,000 589 0.059<br />
VTB Bank Europe PLC 16,845,549 22,943 0.023<br />
Watermill Institutional Trading, LLC 5,300 212 0.040<br />
Wedbush Morgan Securities, Inc. 167,075 6,546 0.039<br />
Wedge Securities, LLC 298,900 11,956 0.040<br />
Weeden & Co. 27,676,100 557,479 0.019<br />
Wells Fargo Securities, LLC 3,461,902 127,140 0.038<br />
William Blair & Company LLC 963,818 41,637 0.044<br />
William O’Neal + Co. 262,295 9,705 0.037<br />
Williams Capital Group, L.P. 644,105 25,555 0.034<br />
Wunderlich Securities, Inc. 518,488 20,739 0.040<br />
Zacks & Company 9,100 364 0.040<br />
Total 2,168,449,909 $ 34,144,841 $ 0.023<br />
Average<br />
Contracts Commissions Commission<br />
Futures Contracts Brokerage Firm - Domestic Traded Paid per Contract<br />
Goldman Sachs & Co. 838,884 $ 1,841,430 $ 2.287<br />
Morgan Stanley Co. Incorporated 13,874 34,635 2.132<br />
Total 852,758 $ 1,876,065 $ 2.267<br />
102 INVESTMENT SECTION
TEACHER RETIREMENT SYSTEM OF TEXAS COMPREHENSIVE ANNUAL FINANCIAL REPORT <strong>2011</strong><br />
Schedule of Fees and Commissions<br />
INVESTMENT PENSION TRUST SECTION<br />
FUND<br />
FOR THE FISCAL YEAR ENDED AUGUST 31, <strong>2011</strong><br />
(continued)<br />
Average<br />
Shares Commissions Commission<br />
Brokerage Firm - International Traded Paid per Share<br />
ABG Securities 3,862,692 $ 17,727 $ 0.011<br />
ABN AMRO Bank N.V. 6,770,344 65,389 0.143<br />
Ak Yatirim Menkul Degerler A.S. 100,746 989 0.011<br />
Ambit Capital Pvt. LTD 41,200 813 0.020<br />
Antique Stock Broking LTD 994,028 25,555 0.046<br />
Arbuthnot Securities Limited 17,610 456 0.026<br />
Atlantic Equities, LLP 100,000 5,209 0.052<br />
Banchile Corredores de Bolsa S.A. 84,937 2,580 0.065<br />
Banco Itau S.A. 2,730,561 66,841 0.032<br />
Banco Pactual S.A. 229,612 4,538 0.027<br />
Banco Santander 3,534,825 62,745 0.045<br />
Bank am Bellevue AG 32,371 977 0.046<br />
Bank of New York 458,696 4,485 0.026<br />
Bank Vonobel AG 268,461 33,523 0.205<br />
Banque Nationale Du Canada 78,900 2,406 0.030<br />
Barclays Capital, Inc. 42,239,733 786,074 0.097<br />
Barnard Jacobs Mellett & Co. (Pty) LTD 11,979,255 18,120 0.018<br />
Batlivala & Karani Securities India Pvt. LTD 225,286 6,216 0.041<br />
Batucha Securities and Investments LTD 159,912 2,760 0.015<br />
Beltone Securities Brokerage 10,556 164 0.015<br />
Bloomberg Tradebook, LLC 115,899 1,946 0.018<br />
BNP Paribas Securities Corp. 27,189,640 158,255 0.147<br />
Bradesco S.A. CTVM 675,635 19,073 0.038<br />
Brockhouse & Cooper, Inc. 839,678 12,865 0.010<br />
CACEIS Bank Deutschland GmbH 4,769 923 0.194<br />
Cadiz Stock Broking 284,984 1,557 0.006<br />
Calyon Securities, Inc. 1,300,800 6,433 0.009<br />
Canaccord Genuity Corp. 287,851 1,217 0.015<br />
Canadian Imperial Bank of Commerce 279,800 1,751 0.006<br />
Cantor Fitzgerald & Co. 2,147,887 6,238 0.015<br />
Carnegie Investment Bank 2,408,539 54,861 0.066<br />
Celfin Capital S.A. Corredores de Bolsa 183,147 12,475 0.068<br />
Central Securities Clearing System LTD 13,330,837 11,031 0.001<br />
Chase Manhattan Frankfurt 190,500 2,458 0.013<br />
Cheuvreux de Virieu 592,145 16,744 0.046<br />
China International Cap Corp. HK Secs LTD 29,634,739 69,833 0.006<br />
INVESTMENT SECTION<br />
103
TEACHER RETIREMENT SYSTEM OF TEXAS COMPREHENSIVE ANNUAL FINANCIAL REPORT <strong>2011</strong><br />
(continued)<br />
Schedule of Fees and Commissions<br />
INVESTMENT PENSION TRUST SECTION<br />
FUND<br />
FOR THE FISCAL YEAR ENDED AUGUST 31, <strong>2011</strong><br />
Average<br />
Shares Commissions Commission<br />
Brokerage Firm - International Traded Paid per Share<br />
CIMB Securities (HK) LTD. 51,100 $ 365 $ 0.007<br />
Citigroup Global Markets, Inc. 160,209,163 1,536,480 0.088<br />
CLSA Securities 45,650,257 207,288 0.624<br />
Collins Stewart & Co. 675,208 15,389 0.023<br />
Commerzbank 15,100 1,705 0.113<br />
Credit Agricole 24,093,446 365,742 0.163<br />
Credit Lyonnais Securities 109,118,711 297,781 0.101<br />
Credit Suisse First Boston 341,418,430 1,722,173 0.060<br />
Crestco LTD 619,795 2,876 0.005<br />
Daewoo Securities Co. LTD 53,370 12,209 0.261<br />
Daiwa Securities Group Inc. 17,534,572 83,769 0.048<br />
Dalal & Broacha Stock Broking Pvt. LTD 16,500 695 0.042<br />
Danske Bank Group 12,353 1,258 0.107<br />
Davy Stockbrokers 175,910 8,837 0.053<br />
DBS Vickers Securities 658,210 4,993 0.008<br />
Deutsche Bank Securities, Inc. 123,890,569 974,118 0.086<br />
Deutsche Boerse AG 222,459 4,036 0.032<br />
Dexia Securities France 138,586 10,389 0.076<br />
Dhanki Securities Pvt. LTD 5,597 781 0.149<br />
DnB NOR 805,851 10,105 0.039<br />
Dolat Capital Markets LTD 135,338 2,991 0.033<br />
Dongwon Securities 109,499 18,115 0.261<br />
Dundee Securities Corp. 26,400 516 0.020<br />
Edelweiss Securities Pvt. LTD 1,039,949 37,824 0.053<br />
EFG Eurobank Securities S.A. 9,150,000 11,323 0.006<br />
EFG Istanbul Menkul De Erler Anonim Sirketi 753,027 7,203 0.019<br />
ENAM Securities Pvt. LTD 383,416 9,237 0.040<br />
Erik Penser Fondkommission AB 21,066 3,529 0.167<br />
Euroclear Bank S.A. N.V. 24,186 885 0.059<br />
Euromobiliare Sim S.P.A. 207,503 3,090 0.015<br />
Evolution Beeson Gregory LTD 288,103 368 0.001<br />
Evolution Securities LTD 64,051 2,469 0.039<br />
Exane S.A. 1,494,714 40,604 0.066<br />
Execution LTD 675,900 866 0.008<br />
<strong>Financial</strong> Brokerage Group (FBG) 2,926,737 24,411 0.044<br />
G Trade Services LTD 11,922,199 125,695 0.062<br />
104 INVESTMENT SECTION
TEACHER RETIREMENT SYSTEM OF TEXAS COMPREHENSIVE ANNUAL FINANCIAL REPORT <strong>2011</strong><br />
Schedule of Fees and Commissions<br />
INVESTMENT PENSION TRUST SECTION<br />
FUND<br />
FOR THE FISCAL YEAR ENDED AUGUST 31, <strong>2011</strong><br />
Geojit BNP Paribas <strong>Financial</strong> Service LTD 315,997 $ 9,979 $ 0.079<br />
Goldman Sachs & Co. 102,977,828 690,202 0.098<br />
Hannuri Investment & Securities Co. LTD 7,785 6,607 0.859<br />
Helvea S.A. 33,565 14,945 0.750<br />
Hoare Govett (India) Securities Pvt. LTD 4,651,876 16,368 0.040<br />
HSBC Securities, Inc. 95,103,140 981,720 0.090<br />
HVB Capital Markets, Inc. 26,554 3,916 0.200<br />
ICAP Securities LTD 14,717 474 0.024<br />
Icatu DTVM LTD 488,388 17,682 0.043<br />
Icici Brokerage Services 5,900 98 0.017<br />
IM Trust S.A. Corredores de Bolsa 94,904 2,028 0.021<br />
India Infoline LTD 250,269 16,532 0.072<br />
Infinity <strong>Financial</strong> Services 97,854 3,287 0.029<br />
ING Bank N.V. 1,418,119 31,017 0.066<br />
Instinet, LLC 96,588,862 380,566 0.050<br />
Intermonte Sec SIM Spa 233,986 9,776 0.059<br />
Investec Securities 483,273 9,670 0.026<br />
Investment Technology Group, Inc. 84,817,605 322,395 0.047<br />
JBWere Pty LTD 131,066 1,221 0.010<br />
Jefferies & Company, Inc. 9,605,614 198,777 0.037<br />
JM <strong>Financial</strong> Institutional Securities Private 1,483,383 13,981 0.028<br />
JM Morgan Stanley Secs Pvt. LTD 5,660,837 81,232 0.040<br />
JP Morgan Securities, Inc. 379,900,503 2,808,155 0.097<br />
KAS-Associatie N.V. 384,621 26,282 0.076<br />
KBC Peel Hunt LTD 83,074 735 0.009<br />
Kepler Equities 466,095 4,977 0.062<br />
KGI Securities (Hong Kong) Co. LTD 765,600 3,384 0.005<br />
Kim Eng Holdings Limited 2,746,600 3,990 0.002<br />
Kingsway <strong>Financial</strong> Services Group LTD 800 10 0.012<br />
Knight Securities 1,507,546 8,173 0.014<br />
Kotak Securities LTD 794,486 19,996 0.026<br />
LarrainVial S.A. 1,322,648 5,699 0.022<br />
Liberum Capital Limited 843,353 11,231 0.008<br />
Link S.A. CCTVM 34,000 798 0.044<br />
Liquidnet, Inc. 25,314,037 57,660 0.074<br />
Loop Capital Markets, LLC 208,605 3,369 0.122<br />
(continued)<br />
Average<br />
Shares Commissions Commission<br />
Brokerage Firm - International Traded Paid per Share<br />
INVESTMENT SECTION<br />
105
TEACHER RETIREMENT SYSTEM OF TEXAS COMPREHENSIVE ANNUAL FINANCIAL REPORT <strong>2011</strong><br />
(continued)<br />
Schedule of Fees and Commissions<br />
INVESTMENT PENSION TRUST SECTION<br />
FUND<br />
FOR THE FISCAL YEAR ENDED AUGUST 31, <strong>2011</strong><br />
Average<br />
Shares Commissions Commission<br />
Brokerage Firm - International Traded Paid per Share<br />
M. M. Warburg & Co. 32,000 $ 501 $ 0.016<br />
Macquarie Bank Limited 102,680,159 435,461 0.083<br />
MainFirst Bank AG 41,886 6,087 0.158<br />
Man <strong>Financial</strong> Sify Securities India Pvt. LTD 16,476 988 0.060<br />
MBI Corredos de Bolsa 930,660 13,175 0.025<br />
Merrill Lynch and Co., Inc. 263,834,027 1,508,821 0.063<br />
MF Global 636,057 14,170 0.032<br />
Miller Tabak Roberts Securities, LLC 450,900 1,570 0.003<br />
Mischler <strong>Financial</strong> Group, Inc. 3,962,554 92,382 0.028<br />
Mitsubishi UFJ Securities 23,000 479 0.017<br />
Mizuho Securities USA, Inc. 256,961 11,197 0.099<br />
Morgan Stanley 593,391,441 3,250,568 0.098<br />
Motilal Oswal Securities Limited 767,249 16,111 0.038<br />
Natexis Bleichroeder, Inc. 49,571 2,046 0.041<br />
NCB Stockbrokers LTD 8,040 167 0.022<br />
Nesbitt Burns 6,916,821 206,204 0.029<br />
Nomura <strong>Financial</strong> 31,976,658 222,638 0.086<br />
Nordea Bank Norge ASA 76,509 2,378 0.020<br />
Numis Securities Limited 4,366,224 46,722 0.014<br />
Oddo Finance 118,629 6,286 0.049<br />
Parel 11,861 1,365 0.115<br />
Penson <strong>Financial</strong> Services, Inc. 49,300 1,903 0.033<br />
Pereire Tod Limited 1,369,084 17,361 0.026<br />
Pershing Securities Limited 10,578,225 126,489 0.189<br />
Petercam S.A. 135,495 4,549 0.055<br />
Quaker Securities 11,710,734 70,003 0.029<br />
Raymond James & Associates, Inc. 332,204 8,206 0.295<br />
Redburn Partners, LLP 319,753 12,380 0.032<br />
Renaissance Capital 196,564 19,951 0.105<br />
Ridge Clearing & Outsourcing Solutions 444,200 8,913 0.021<br />
Royal Bank Of Canada 3,301,243 85,632 0.027<br />
Royal Bank Of Scotland PLC 2,704,206 56,329 0.032<br />
Salomon Smith Barney, Inc. 7,377,814 39,287 0.012<br />
Samsung Securities Co. LTD 1,482,869 27,756 0.084<br />
Sanford C. Bernstein LTD 4,509,886 62,359 0.269<br />
Scotia Capital 320,898 10,354 0.030<br />
106 INVESTMENT SECTION
TEACHER RETIREMENT SYSTEM OF TEXAS COMPREHENSIVE ANNUAL FINANCIAL REPORT <strong>2011</strong><br />
Schedule of Fees and Commissions<br />
INVESTMENT PENSION TRUST SECTION<br />
FUND<br />
FOR THE FISCAL YEAR ENDED AUGUST 31, <strong>2011</strong><br />
SG Securities 79,088,203 $ 32,466 $ 0.004<br />
Six Sis Ag 2,674 380 0.117<br />
SJ Levinson & Sons, LLC 7,017,838 56,051 0.017<br />
Skandinaviska Enskilda Bank 650,109 24,355 0.073<br />
Societe Generale 9,488,732 78,963 0.042<br />
SS Kantilal Ishwarlal Securities 392,170 7,695 0.029<br />
Standard Bank 207,452 9,452 0.092<br />
Standard Chartered Bank 1,339,529 11,114 0.011<br />
State Street Bank & Trust Co. 38,150 597 0.013<br />
Stockbrokers Botswana LTD 420,833 2,944 0.012<br />
Sungard Institutional Brokerage, Inc. 2,185 55 0.031<br />
Svenska Handelsbanken 301,842 22,250 0.088<br />
Swedbank Group 392,000 510 0.001<br />
TD Waterhouse Cda 190,661 5,606 0.028<br />
TONGYANG Securities, Inc. 1,025 4,222 4.119<br />
Toronto Dominion Bank 45,600 912 0.020<br />
UBS AG 133,059,545 1,023,696 0.064<br />
Upline International S.A. 12,800 2,149 0.543<br />
Valores Finamex, S.A. de C.V. 1,819,683 5,547 0.003<br />
Weeden & Co. LTD 15,935,311 194,182 0.033<br />
WOOD & Company 18,769 1,031 0.159<br />
Woori Investment Securities 119,397 19,876 0.799<br />
Xp Investimentos CCTVM S.A. 63,373 908 0.013<br />
Yuanta Core Pacific Securities 4,685,884 5,877 0.004<br />
(continued)<br />
Average<br />
Shares Commissions Commission<br />
Brokerage Firm - International Traded Paid per Share<br />
Total 3,137,511,263 $ 20,703,900 $ 0.083<br />
Average<br />
Contracts Commissions Commission<br />
Futures Contracts Brokerage Firm - International Traded Paid per Contract<br />
Goldman Sachs & Co. 480,051 $ 1,524,368 $ 3.845<br />
Morgan Stanley Co. Incorporated 20,600 54,993 3.545<br />
Total 500,651 $ 1,579,361 $ 3.828<br />
INVESTMENT SECTION<br />
107
TEACHER RETIREMENT SYSTEM OF TEXAS COMPREHENSIVE ANNUAL FINANCIAL REPORT <strong>2011</strong><br />
INVESTMENT SECTION<br />
This page is intentionally left blank.<br />
108 INVESTMENT SECTION
TEACHER RETIREMENT SYSTEM OF TEXAS COMPREHENSIVE ANNUAL FINANCIAL REPORT <strong>2011</strong><br />
ACTUARIAL SECTION<br />
ACTUARIAL SECTION<br />
109
TEACHER RETIREMENT SYSTEM OF TEXAS COMPREHENSIVE ANNUAL FINANCIAL REPORT <strong>2011</strong><br />
November 1, <strong>2011</strong><br />
BOARD OF TRUSTEES<br />
Teacher Retirement System of Texas<br />
1000 Red River Street<br />
Austin, TX 78701-2698<br />
Subject: Actuary’s Certification of the Actuarial Valuation as of August 31, <strong>2011</strong><br />
We certify that the information included herein and contained in the <strong>2011</strong> Actuarial Valuation <strong>Report</strong> is accurate and fairly presents<br />
the actuarial position of the Teacher Retirement System of Texas (<strong>TRS</strong>) as of August 31, <strong>2011</strong>.<br />
All calculations have been made in conformity with generally accepted actuarial principles and practices, and with the Actuarial<br />
Standards of Practice issued by the Actuarial Standards Board. In our opinion, the results presented comply with the requirements of<br />
the Texas statutes and, where applicable, the Internal Revenue Code, ERISA, and the Statements of the Governmental Accounting<br />
Standards Board. The undersigned are independent actuaries. Mr. White and Mr. Newton are members of the American Academy<br />
of Actuaries, and are also Enrolled Actuaries. All are experienced in performing valuations for large public retirement systems.<br />
Actuarial Valuations<br />
The primary purpose of the valuation report is to determine the adequacy of the current State contribution rate through measuring the<br />
resulting funding period, to describe the current financial condition of the System, and to analyze changes in the System’s condition.<br />
In addition, the report provides information required by the System in connection with Governmental Accounting Standards Board<br />
Statement No. 25 (GASB No. 25), and it provides various summaries of the data.<br />
Valuations are prepared annually, as of August 31 of each year, the last day of the System’s plan and fiscal year.<br />
Financing Objective of the Plan<br />
Contribution rates are established by Law that, over time, are intended to remain level as a percent of payroll. The employee and State<br />
contribution rates are set by Law. The actuarially determined contribution rates determined in this actuarial valuation are intended<br />
to provide for the normal cost plus the level percentage of payroll required to amortize the unfunded actuarial accrued liability over<br />
a period not in excess of 30 years.<br />
Progress Toward Realization of Financing Objective<br />
The actuarial accrued liability, the unfunded actuarial accrued liability (UAAL), and the calculation of the resulting funding period<br />
illustrate the progress toward the realization of financing objectives. Based on this actuarial valuation as of August 31, <strong>2011</strong>, the<br />
System’s under-funded status has increased to $24.1 billion from $22.9 billion as of August 31, 2010. This increase in the UAAL is<br />
due to a loss on the actuarial value of assets of the System.<br />
This valuation shows a normal cost equal to 10.60% of pay. The State set its contribution rate to 6.00% of pay as of September<br />
1, <strong>2011</strong>, which combined with the member contribution rate of 6.40% of pay provides a total contribution rate of 12.40% of pay.<br />
Therefore, there is 1.80% of pay available to amortize the UAAL. If payroll grows as expected, the contributions provided by this<br />
portion of the contribution rate are insufficient to amortize the current unfunded actuarial accrued liabilities of the System over any<br />
period of time (i.e. the funding period is never). Although the state contribution is scheduled to increase to 6.40% in fiscal year<br />
2013, if the current assumptions are met (the trust earns an average 8.0% per annum) and the current 6.40% member contribution<br />
rate and the State fiscal year 2013 contribution rate of 6.40% continue, the fund is projected to remain solvent until the year 2075,<br />
after which the funding would return to a pay-as-you-go status. Therefore, for the current benefit structure to be sustainable, the<br />
contribution levels will need to be increased if all of the current assumptions are met.<br />
The actuarial valuation report as of August 31, <strong>2011</strong> reveals that while the System has an unfunded liability of $24.1 billion, it still<br />
has a funded ratio (the ratio of actuarial assets to actuarial accrued liability) of 82.7%. However, because of the significant shortfall in<br />
investment income in FY2009, the System is still deferring net investment losses of $7.8 billion compared to the last valuation when<br />
the System was deferring $15.6 billion in deferred losses and the funded status using the market value of assets is only 77.1%. If<br />
there are no significant investment gains or other actuarial gains over the next several years, the funded status of the System would<br />
be expected to decline towards this number.<br />
The System earned a 15.5% return on a dollar-weighted market value of assets basis for the plan year ending August 31, <strong>2011</strong>, net<br />
of expenses. The System experienced a loss on the actuarial value of assets of $2.0 billion and a gain on the actuarial liabilities of<br />
110 ACTUARIAL SECTION
TEACHER RETIREMENT SYSTEM OF TEXAS COMPREHENSIVE ANNUAL FINANCIAL REPORT <strong>2011</strong><br />
$1.4 billion and a gain due to assumption change of $0.3 billion for a total experience related loss of $0.3 billion.<br />
In the absence of significant actuarial gains in the near future, the contribution rate needed to amortize the UAAL over 30 years will<br />
increase over the next few valuation cycles.<br />
Plan Provisions<br />
The plan provisions used in the actuarial valuation are described in Table 21 of the valuation report. There have been no changes to<br />
the benefit provisions of the System since the prior valuation.<br />
Disclosure of Pension Information<br />
Effective for the fiscal year ending August 31, 1996, the Board of Trustees adopted compliance with the requirements of Governmental<br />
Accounting Standards Board (GASB) Statement No. 25. The required disclosure information is included in the body of the valuation<br />
report.<br />
This report should not be relied on for any purpose other than the purpose described above. Determinations of the financial results<br />
associated with the benefits described in this report in a manner other than the intended purpose may produce significantly different<br />
results.<br />
Actuarial Methods and Assumptions<br />
The actuarial methods and assumptions have been selected by the Board of Trustees of the Teacher Retirement System of Texas<br />
based upon our analysis and recommendations. These assumptions and methods are detailed in Table 22 of the valuation report. The<br />
Board of Trustees has sole authority to determine the actuarial assumptions used for the plan. The actuarial methods and assumptions<br />
are based on a study of actual experience for the four year period ending August 31, 2010 and were adopted on April 8, <strong>2011</strong>.<br />
The following assumptions and methods have been modified since the prior valuation:<br />
• Small reductions in the rates of retirement at most age and service combinations<br />
• Decrease in the post-retirement rates of mortality for both males and females<br />
• The salary increase assumption in the first year of employment was reduced<br />
• The method for determining the actuarial value of assets was modified to a method that sets the actuarial value of assets as<br />
the expected actuarial value of assets plus 20% of the difference between the actual market value of assets and the expected<br />
actuarial value of assets<br />
The results of the actuarial valuation are dependent on the actuarial assumptions used. Actual results can and almost certainly will<br />
differ, as actual experience deviates from the assumptions. Even seemingly minor changes in the assumptions can materially change<br />
the liabilities, calculated contribution rates and funding periods. The actuarial calculations are intended to provide information for<br />
rational decision making.<br />
In our opinion, the actuarial assumptions used are appropriate for purposes of the valuation and are internally consistent and reasonably<br />
related to the experience of the System and to reasonable expectations. The actuarial assumptions and methods used in this report<br />
comply with the parameters for disclosure that appear in GASB 25.<br />
Data<br />
In preparing the August 31, <strong>2011</strong> actuarial valuation, we have relied upon member and asset data provided by the Teacher Retirement<br />
System of Texas. We have not subjected this data to any auditing procedures, but have examined the data for reasonableness and<br />
for consistency with prior years’ data.<br />
The schedules shown in the actuarial section and the trend data schedules in the financial section of the <strong>TRS</strong> financial report include<br />
selected actuarial information prepared by <strong>TRS</strong> staff. Six year historical information included in these schedules was based upon our<br />
work. For further information please see the full actuarial valuation report.<br />
Respectfully submitted,<br />
Gabriel, Roeder, Smith & Company<br />
Lewis Ward Joseph P. Newton, FSA, EA, MAAA Daniel J. White, FSA, EA, MAAA<br />
Consultant Senior Consultant Senior Consultant<br />
ACTUARIAL SECTION<br />
111
TEACHER RETIREMENT SYSTEM OF TEXAS COMPREHENSIVE ANNUAL FINANCIAL REPORT <strong>2011</strong><br />
Actuarial Information Pension Trust Fund<br />
Actuarial Present Value of Future Benefits<br />
From Actuarial Valuation as of August 31, <strong>2011</strong> (With Comparative Data for August 31, 2010)<br />
<strong>2011</strong> 2010<br />
Present Value of Benefits Presently Being Paid<br />
Service Retirement Benefits $ 61,583,573,864 $ 56,633,460,577<br />
Disability Retirement Benefits 909,607,883 891,512,713<br />
Death Benefits 769,355,667 754,052,179<br />
Present Survivor Benefits 207,631,666 197,246,581<br />
TOTAL PRESENT VALUE OF<br />
BENEFITS PRESENTLY BEING PAID $ 63,470,169,080 $ 58,476,272,050<br />
Present Value of Benefits Payable in the<br />
Future to Present Active Member<br />
Service Retirement Benefits $ 95,886,611,576 $ 95,802,642,330<br />
Disability Retirement Benefits 1,343,397,174 1,265,949,485<br />
Termination Benefits 6,952,317,408 6,067,357,073<br />
Death and Survivor Benefits 1,744,820,375 1,513,834,539<br />
TOTAL ACTIVE<br />
MEMBER LIABILITIES $ 105,927,146,533 $ 104,649,783,427<br />
Present Value of Benefits Payable in the<br />
Future to Present Inactive Members<br />
Inactive Vested Participants:<br />
Retirement Benefits $ 2,221,502,905 1,798,775,860<br />
Death Benefits 128,252,686 122,792,410<br />
TOTAL INACTIVE<br />
VESTED BENEFITS $ 2,349,755,591 $ 1,921,568,270<br />
Refunds of Contributions to Inactive<br />
Non-vested Members $ 311,886,726 $ 294,211,296<br />
Future Survivor Benefits Payable<br />
on Behalf of Present Annuitants $ 1,145,189,668 $ 1,103,421,506<br />
TOTAL INACTIVE LIABILITIES $ 3,806,831,985 $ 3,319,201,072<br />
TOTAL ACTUARIAL PRESENT VALUE<br />
OF FUTURE BENEFITS $ 173,204,147,598 $ 166,445,256,549<br />
Summary of Cost Items<br />
<strong>2011</strong> 2010<br />
Actuarial Present Value of Future Benefits $ 173,204,147,598 $ 166,445,256,549<br />
Present Value of Future Normal Costs (33,889,057,041) (32,254,146,314)<br />
Actuarial Accrued Liability $ 139,315,090,557 $ 134,191,110,235<br />
Actuarial Value of Assets (115,252,828,399) (111,292,527,887)<br />
UNFUNDED ACTUARIAL<br />
ACCRUED LIABILITY $ 24,062,262,158 $ 22,898,582,348<br />
112 ACTUARIAL SECTION
TEACHER RETIREMENT SYSTEM OF TEXAS COMPREHENSIVE ANNUAL FINANCIAL REPORT <strong>2011</strong><br />
Actuarial Information Pension Trust Fund<br />
Actuarial Methods and Assumptions<br />
The actuarial valuation of <strong>TRS</strong> is prepared by Gabriel, Roeder, Smith & Company. The actuary relies on membership data and asset<br />
information provided by <strong>TRS</strong> staff. While not verifying the data at their source, the actuary performs such tests for consistency<br />
and reasonableness as deemed necessary to be satisfied with the appropriateness of using the data supplied.<br />
A summary of the actuarial assumptions and methods used by the actuary are as follows:<br />
The entry age normal actuarial cost method of valuation was used in determining liabilities and normal cost. Differences in the past<br />
between assumed experience and actual experience (“actuarial gains and losses”) become part of the actuarial accrued liabilities.<br />
Unfunded actuarial accrued liabilities are amortized to produce payments (principal and interest) which are level percents of payroll<br />
contributions. These assumptions were adopted in April <strong>2011</strong>.<br />
Actuarial Assumptions<br />
1. Investment Rate of Return: 8.00% per annum, net of investment and administrative expenses, compounded annually,<br />
composed of an assumed 3.00% inflation rate and a 5.00% real rate of return.<br />
2. Mortality, Disability Retirement, Withdrawal and Service Retirement Rates: Rates and scales developed in the actuarial<br />
investigation as of August 31, 2007, with values at specimen ages shown in the tables below.<br />
a) Probability of Decrement due to Death and Disability Retirement<br />
Probability of Decrement due to Death and Disability Retirement<br />
Male Members<br />
Female Members<br />
Disability<br />
Disability<br />
Age Death Retirement Age Death Retirement<br />
20 0.000297 0.000003 20 0.000189 0.000006<br />
30 0.000624 0.000042 30 0.000291 0.000065<br />
40 0.000849 0.000381 40 0.000449 0.000234<br />
50 0.001458 0.001287 50 0.000923 0.001256<br />
60 0.003979 0.002455 60 0.002084 0.002436<br />
70 0.012940 0.001760 70 0.007621 0.001658<br />
Mortality Improvement: To account for future mortality improvement, the rates were chosen so that the assumed<br />
mortality rates are smaller than the rates observed in the most recent experience study. The ratio of the actual member of deaths<br />
occurring during this period to the expected number based on the selected assumptions was 108% for healthy male annuitants,<br />
112% for healthy female annuitants, 103% for disabled male annuitants, and 110% for disabled female annuitants.<br />
ACTUARIAL SECTION<br />
113
TEACHER RETIREMENT SYSTEM OF TEXAS COMPREHENSIVE ANNUAL FINANCIAL REPORT <strong>2011</strong><br />
Actuarial Information Pension Trust Fund<br />
b) Probability of Decrement Due to Withdrawal: The following tables are used for the first 10 years of employment.<br />
Probability of Decrement Due to Withdrawal<br />
Male Members<br />
Years of Service<br />
Age 0 1 2 3 4 5 6 7 8 9<br />
20 0.2606 0.2266 0.1716 0.1335 0.1050 0.0000 0.0000 0.0000 0.0000 0.0000<br />
30 0.2173 0.1890 0.1560 0.1233 0.0952 0.0789 0.0652 0.0648 0.0628 0.0536<br />
40 0.2172 0.1888 0.1430 0.1253 0.0873 0.0833 0.0690 0.0608 0.0542 0.0464<br />
50 0.1937 0.1684 0.1245 0.0993 0.0754 0.0684 0.0644 0.0544 0.0512 0.0466<br />
60 0.2021 0.1757 0.1324 0.1160 0.0751 0.0664 0.0518 0.0495 0.0426 0.0341<br />
70 0.2371 0.2062 0.1724 0.1174 0.1017 0.0000 0.0000 0.0000 0.0000 0.0000<br />
Female Members<br />
Years of Service<br />
Age 0 1 2 3 4 5 6 7 8 9<br />
20 0.1938 0.1685 0.1438 0.1263 0.1075 0.0000 0.0000 0.0000 0.0000 0.0000<br />
30 0.1948 0.1694 0.1435 0.1218 0.1007 0.0935 0.0825 0.0724 0.0564 0.0570<br />
40 0.1807 0.1571 0.1235 0.1052 0.0826 0.0743 0.0641 0.0578 0.0560 0.0459<br />
50 0.1755 0.1526 0.1199 0.0971 0.0792 0.0708 0.0638 0.0549 0.0472 0.0402<br />
60 0.1959 0.1703 0.1356 0.1082 0.0846 0.0660 0.0671 0.0509 0.0463 0.0438<br />
70 0.2483 0.2159 0.1929 0.1994 0.1254 0.0000 0.0000 0.0000 0.0000 0.0000<br />
c) Probability of Decrement Due to Retirement (Rates of Retirement - for members hired after August 21, 2007)<br />
Probability of Decrement Due to Retirement<br />
Male Members<br />
Years of Service<br />
Age 5-9 10-14 15-18 19 20-24 25-29 30+<br />
50 0.000 0.000 0.000 0.000 0.000 0.000 0.010<br />
55 0.010 0.010 0.010 0.010 0.010 0.010 0.010<br />
60 0.020 0.020 0.020 0.020 0.240 0.240 0.240<br />
65 0.250 0.250 0.250 0.250 0.250 0.250 0.250<br />
70 0.200 0.200 0.200 0.200 0.200 0.200 0.200<br />
74 1.000 1.000 1.000 1.000 1.000 1.000 1.000<br />
Female Members<br />
Years of Service<br />
Age 5-9 10-14 15-18 19 20-24 25-29 30+<br />
50 0.000 0.000 0.000 0.000 0.000 0.000 0.010<br />
55 0.010 0.010 0.010 0.010 0.010 0.010 0.010<br />
60 0.030 0.030 0.030 0.030 0.250 0.250 0.250<br />
65 0.250 0.250 0.250 0.250 0.250 0.250 0.250<br />
70 0.250 0.250 0.250 0.250 0.250 0.250 0.250<br />
74 1.000 1.000 1.000 1.000 1.000 1.000 1.000<br />
For members hired after August 31, 2007, the retirement rates for members once they reach<br />
unreduced retirement eligibility at age 60 are increased 10% for each year the member is<br />
beyond the rule of 80 (i.e. if the member reached the Rule of 80 at age 58 then the probability<br />
of retirement at age 60 is 120% of the rate shown above).<br />
114 ACTUARIAL SECTION
TEACHER RETIREMENT SYSTEM OF TEXAS COMPREHENSIVE ANNUAL FINANCIAL REPORT <strong>2011</strong><br />
Actuarial Information Pension Trust Fund<br />
3. Rates of Salary Increase: The following table reflects an inflation rate of 3.00%, plus productivity component of 1.25%,<br />
plus step-rate/promotional component as shown:<br />
Rates of Salary Increase<br />
<strong>Annual</strong> Step Rate/<br />
Promotional Rates of Increase<br />
Total <strong>Annual</strong> Rate of Increase<br />
Years of Service Male Members Female Members Male Members Female Members<br />
1 3.00% 3.00% 7.25% 7.25%<br />
2 3.00 3.00 7.25 7.25<br />
3 2.75 2.75 7.00 7.00<br />
4 2.50 2.50 6.75 6.75<br />
5 2.25 2.25 6.50 6.50<br />
6 2.00 2.00 6.25 6.25<br />
7-8 1.75 1.75 6.00 6.00<br />
9-10 1.50 1.50 5.75 5.75<br />
11 1.25 1.25 5.50 5.50<br />
12 1.00 1.00 5.25 5.25<br />
13-18 0.75 0.75 5.00 5.00<br />
19-21 0.50 0.50 4.75 4.75<br />
22-24 0.25 0.25 4.50 4.50<br />
25 or more 0.00 0.00 4.25 4.25<br />
This weighted average salary increase rate is 6.49% based on the active member service distribution as of August<br />
31, <strong>2011</strong>.<br />
Disability Annuitants<br />
1. Investment Rate of Return: 8.00% per annum, compounded annually.<br />
2. Mortality: The PBGC Male Disabled Mortality Table for plan terminations after December 1, 1980, with a six-year setback<br />
and the PBGC Female Disabled Mortality Table for plan terminations after December 1, 1980, with a four-year setback.<br />
Service Retirement Annuitants, Nominees and Survivors<br />
1. Investment Rate of Return: 8.00% per annum, compounded annually (benefit increase reserve account eliminated by<br />
the 1995 legislative session).<br />
2. Mortality: Client specific tables; used for service retirement annuitants, beneficiaries and survivors. These tables are<br />
selected to best reflect the experience developed in the actuarial investigation as of August 31, 2010.<br />
Probability of Mortality and Life Expectancy<br />
Male Members<br />
Female Members<br />
Probability of Life Expectancy Probability of Life Expectancy<br />
Age Mortality (Years) Mortality (Years)<br />
55 0.003684 27.42 0.002806 31.16<br />
65 0.010893 18.83 0.006117 22.22<br />
75 0.032206 11.53 0.019424 14.04<br />
85 0.095215 6.14 0.068615 7.83<br />
95 0.231740 3.33 0.163248 4.68<br />
ACTUARIAL SECTION<br />
115
TEACHER RETIREMENT SYSTEM OF TEXAS COMPREHENSIVE ANNUAL FINANCIAL REPORT <strong>2011</strong><br />
Actuarial Information Pension Trust Fund<br />
Actuarial Value of Assets<br />
The actuarial value of assets is equal to the market value of assets less a five-year phase in of the excess (shortfall) between<br />
expected investment return and actual income with the resulting value not being less than 80% or more than 120% of the market<br />
value of assets.<br />
Funding of Unfunded Actuarial Accrued Liability<br />
Funded by the excess of future state contributions required by Law over the amount of such contributions required to fund the<br />
normal cost of benefits. Based on a study of all new entrants hired in the period from 2007 through 2010 and taking into account<br />
all changes in benefit provisions, the normal cost for benefits provided by the System is 10.60% of payroll (6.40% by members<br />
plus 4.20% by the State), which is 1.80% of payroll less than the total contributions required by Law. It is intended that the excess<br />
amount of 1.80% of payroll will be used to amortize any unfunded actuarial accrued liabilities of the System, assuming that total<br />
payroll increases by 3.50% per year.<br />
As of the valuation as of August 31, <strong>2011</strong>, these excess contributions of 1.80% of pay are insufficient to amortize the UAAL under<br />
the required time period.<br />
Assumed State Contribution Rate<br />
Effective September 1, <strong>2011</strong>, the General Appropriations Act decreased the State contribution rate to 6.00% for fiscal year 2012<br />
and will increase it to 6.40% in fiscal year 2013. For purposes of determining the funding period, it was assumed that the State<br />
contribution rate (6.40%) would remain in place indefinitely.<br />
Schedule of Active Member Valuation Data<br />
See table below:<br />
Schedule of Active Member Valuation Data<br />
<strong>Annual</strong><br />
Valuation <strong>Annual</strong> Average Percentage<br />
as of Payroll in <strong>Annual</strong> Increase in<br />
August 31 Number Thousands Pay Average Pay<br />
2006 761,658 $28,397,283 $37,284 2.8%<br />
2007 777,789 31,114,096 40,003 7.3<br />
2008 801,455 33,237,904 41,472 3.7<br />
2009 817,537 35,096,890 42,930 3.5<br />
2010 834,060 36,628,844 43,916 2.3<br />
<strong>2011</strong> 828,919 36,797,011 44,392 1.1<br />
116 ACTUARIAL SECTION
TEACHER RETIREMENT SYSTEM OF TEXAS COMPREHENSIVE ANNUAL FINANCIAL REPORT <strong>2011</strong><br />
Actuarial Information Pension Trust Fund<br />
Other Actuarial Information<br />
The Schedule of Retirees, Beneficiaries and Disabled Participants Added to and Removed from Rolls, the Solvency Test, and the<br />
Analysis of <strong>Financial</strong> Experience appear in the following tables:<br />
Schedule of Retirees, Beneficiaries and Disabled Participants Added to and Removed from Rolls<br />
Added to Rolls Removed from Rolls Rolls - End of Year<br />
(1) (8) (9)<br />
Valuation (3) (5) (7) % Increase Average<br />
as of (2) <strong>Annual</strong> (4) <strong>Annual</strong> (6) <strong>Annual</strong> in <strong>Annual</strong> <strong>Annual</strong><br />
August 31 Number Allowances Number Allowances Number Allowances Allowances Allowance<br />
2006 15,810 $324,292,542 7,175 $120,623,840 257,144 $5,282,107,571 4.0% $20,541<br />
2007 15,861 336,348,640 7,698 131,295,705 265,307 5,487,160,506 3.9 20,682<br />
2008 17,727 391,920,863 7,806 135,160,090 275,228 5,743,921,279 4.7 20,870<br />
2009 17,326 392,452,923 7,940 136,537,511 284,614 5,999,836,691 4.5 21,081<br />
2010 20,076 473,512,423 8,199 142,187,645 296,491 6,331,161,469 5.5 21,354<br />
<strong>2011</strong> 24,688 620,038,676 8,499 147,985,004 312,680 6,803,215,141 7.5 21,758<br />
Solvency Test<br />
A short-term solvency test is one means of checking a retirement system’s progress under its funding program. The schedule<br />
below provides a historical illustration of a short-term solvency test for <strong>TRS</strong> wherein present assets are compared with: (1) active<br />
member contributions on deposit; (2) the liabilities for future benefits to present annuitants (Retirees and Beneficiaries); (3) the<br />
liabilities for active members under the entry age normal actuarial cost method including a projection of future salary increases<br />
and anticipated future service (Active Members (State Financed Portion)).<br />
Under the level percent of payroll financing followed by <strong>TRS</strong>, liabilities for active member contributions on deposit and the liabilities<br />
for future benefits to present retirees and beneficiaries will be fully covered by present assets except in rare circumstances. In<br />
addition, liabilities for active member benefits earned or to be earned in the future will be partially covered by the remainder of<br />
present assets. Generally, if the system has been using level cost financing, the funded portion of active member benefits will<br />
increase over time.<br />
A Schedule of Funding Progress including a 6-year Summary of Actuarial Accrued Liabilities and Unfunded Actuarial Accrued Liabilities<br />
can be found in the Required Supplementary Information immediately following the Notes to the <strong>Financial</strong> Statements.<br />
Solvency Test<br />
(AMOUNTS SHOWN IN MILLIONS)<br />
Aggregate Actuarial Accrued Liabilities For<br />
Portion of Aggregate Actuarial Accrued<br />
Liabilities Covered By Valuation Assets<br />
(3) (4) (8)<br />
(1) (2) Active Members (6) (7) Active Members<br />
Valuation Active Retirees (State (5) Active Retirees (State<br />
as of Member and Financed Valuation Member and Financed<br />
August 31 Contributions* Beneficiaries* Portion) Assets Contributions* Beneficiaries* Portion)<br />
2006 $ 20,590 $ 49,144 $ 38,177 $ 94,128 100% 100% 64.1%<br />
2007 22,236 51,293 42,435 103,419 100 100 70.4<br />
2008 23,928 53,243 44,585 110,233 100 100 74.2<br />
2009 23,914 55,484 48,632 106,384 100 100 55.5<br />
2010 27,559 58,476 48,156 111,293 100 100 52.5<br />
<strong>2011</strong> 28,911 63,470 46,934 115,253 100 100 48.7<br />
* Adjusted for pending transfers to retired reserve at August 31 for pending retirements.<br />
ACTUARIAL SECTION<br />
117
TEACHER RETIREMENT SYSTEM OF TEXAS COMPREHENSIVE ANNUAL FINANCIAL REPORT <strong>2011</strong><br />
Actuarial Information Pension Trust Fund<br />
Analysis of <strong>Financial</strong> Experience<br />
Changes in Unfunded Actuarial Accrued Liabilities (UAAL)*<br />
Resulting from Differences Between Assumed Experience and Actual Experience<br />
Increase/(Decrease) for Year (in Billions)<br />
<strong>2011</strong> 2010 2009 2008 2007 2006<br />
Investment (Gains)/Losses $ 1.958 $ 1.161 $ 10.321 $ (1.232) $ (4.140) $ (.264)<br />
Legislative Changes/<br />
Benefit Increases .360<br />
Contribution Experience 0.826 0.797 0.149 0.228 .496 .508<br />
Assumption Changes (0.271) .676<br />
Liability Experience (1.350) (0.705) (0.347) (.694) 2.135 .254<br />
Net Increase/(Decrease) $ 1.163 $ 1.253 $ 10.123 $ (1.022) $ (1.149) $ .498<br />
Beginning UAAL 22.899 21.646 11.523 12.545 13.694 13.196<br />
Ending UAAL $ 24.062 $ 22.899 $ 21.646 $ 11.523 $ 12.545 $ 13.694<br />
* Calculated on a 5-year smoothed market basis.<br />
118 ACTUARIAL SECTION
TEACHER RETIREMENT SYSTEM OF TEXAS COMPREHENSIVE ANNUAL FINANCIAL REPORT <strong>2011</strong><br />
Actuarial Information Pension Trust Fund<br />
This page is intentionally left blank.<br />
ACTUARIAL SECTION<br />
119
TEACHER RETIREMENT SYSTEM OF TEXAS COMPREHENSIVE ANNUAL FINANCIAL REPORT <strong>2011</strong><br />
November 1, <strong>2011</strong><br />
BOARD OF TRUSTEES<br />
Teacher Retirement System of Texas<br />
1000 Red River Street<br />
Austin, TX 78701-2698<br />
Subject: GASB 43 Actuarial Valuation as of August 31, <strong>2011</strong> for <strong>TRS</strong>-Care<br />
Submitted in this report are the results of an Actuarial Valuation of the liabilities associated with the employer financed retiree<br />
health benefits provided through <strong>TRS</strong>-Care, a benefit program designed to provide post retirement medical benefits for certain<br />
members of the Teacher Retirement System of Texas (<strong>TRS</strong>). The date of the valuation was August 31, <strong>2011</strong>. This report was<br />
prepared at the request of <strong>TRS</strong>.<br />
The actuarial calculations were prepared for purposes of complying with the requirements of Statements 43 and 45 of the<br />
Governmental Accounting Standards Board (GASB). The calculations reported herein have been made on a basis consistent<br />
with our understanding of these accounting standards. Determinations of the liability associated with the benefits described in<br />
this report for purposes other than satisfying the financial reporting requirements of <strong>TRS</strong>-Care and participating employers may<br />
produce significantly different results.<br />
The valuation was based upon information, furnished by <strong>TRS</strong>, concerning retiree health benefits, members’ census, and financial<br />
data. Data was checked for internal consistency but was not otherwise audited. Certain demographic and economic assumptions<br />
are identical to the set of demographic and economic assumptions adopted by the Board based on the 2010 Experience Study<br />
of <strong>TRS</strong>. Assumptions applicable only to <strong>TRS</strong>-Care have changed since the prior report, and they are disclosed in the assumptions<br />
section of this report.<br />
To the best of our knowledge, this report is complete and accurate and was made in accordance with generally recognized actuarial<br />
methods.<br />
One or more of the undersigned are members of the American Academy of Actuaries and meet the Qualification Standards of the<br />
Academy of Actuaries to render the actuarial opinion herein.<br />
Respectfully submitted,<br />
William J. Hickman Joseph P. Newton, FSA, MAAA Mehdi Riazi, ASA, EA, MAAA<br />
Senior Consultant Senior Consultant Actuary<br />
120 ACTUARIAL SECTION
TEACHER RETIREMENT SYSTEM OF TEXAS COMPREHENSIVE ANNUAL FINANCIAL REPORT <strong>2011</strong><br />
Actuarial Information <strong>TRS</strong>-Care<br />
Actuarial Present Value of Future Benefits<br />
From Actuarial Valuation as of August 31, <strong>2011</strong> (With Comparative Data for August 31, 2010)<br />
Based on a 5.25% discount rate<br />
<strong>2011</strong> 2010<br />
Present Value of Benefits Being Paid<br />
Future Medical Claims $ 8,970,466,574 $ 7,098,035,116<br />
Future Rx Claims 9,560,281,792 8,484,675,649<br />
Retiree Premiums Collected (4,820,521,600) (4,664,226,865)<br />
NET PRESENT VALUE OF<br />
BENEFITS FOR CURRENT RETIREES $ 13,710,226,766 $ 10,918,483,900<br />
Present Value of Benefits Payable in the<br />
Future to Present Active Members<br />
Future Medical Claims $ 22,513,074,606 $ 21,258,228,041<br />
Future Rx Claims 19,700,869,923 20,923,712,165<br />
Retiree Premiums Collected (10,795,062,742) (12,748,598,151)<br />
NET PRESENT VALUE OF<br />
BENEFITS FOR FUTURE RETIREES $ 31,418,881,787 $ 29,433,342,055<br />
TOTAL ACTUARIAL PRESENT VALUE<br />
OF FUTURE BENEFITS $ 45,129,108,553 $ 40,351,825,955<br />
Summary of Cost Items<br />
<strong>2011</strong> 2010<br />
Actuarial Present Value of Future Benefits $ 45,129,108,553 $ 40,351,825,955<br />
Present Value of Future Normal Costs (15,343,939,596) (14,544,057,386)<br />
Actuarial Accrued Liability $ 29,785,168,957 $ 25,807,768,569<br />
Actuarial Value of Assets (890,870,306) (814,964,303)<br />
UNFUNDED ACTUARIAL<br />
ACCRUED LIABILITY $ 28,894,298,651 $ 24,992,804,266<br />
ACTUARIAL SECTION<br />
121
TEACHER RETIREMENT SYSTEM OF TEXAS COMPREHENSIVE ANNUAL FINANCIAL REPORT <strong>2011</strong><br />
Actuarial Information <strong>TRS</strong>-Care<br />
Actuarial Methods and Assumptions<br />
The actuarial valuation of <strong>TRS</strong>-Care (Retired Plan) is prepared by Gabriel, Roeder, Smith & Company. The actuary relies on membership<br />
data and asset information provided by <strong>TRS</strong> staff. While not verifying the data at their source, the actuary performs such tests<br />
for consistency and reasonableness as deemed necessary to be satisfied with the appropriateness of using the data supplied.<br />
A summary of the actuarial assumptions and methods used by the actuary are as follows:<br />
The projected unit credit method of valuation was used in determining liabilities and normal costs. Differences in the past between<br />
assumed experience and actual experience (“actuarial gains and losses”) become part of the actuarial accrued liabilities. Unfunded<br />
actuarial accrued liabilities are amortized to produce payments (principal and interest) which are level percents of payroll contributions.<br />
A schedule of Funding Progress including a 5-year Summary of Actuarial Accrued Liabilities (AAL) and Unfunded Actuarial Accrued<br />
Liabilities (UAAL) can be found in the Required Supplementary Information found immediately following the Notes to the <strong>Financial</strong><br />
Statements.<br />
Schedule of Retirees and Beneficiaries Added to and Removed from Rolls<br />
Added to Rolls Removed from Rolls Rolls - End of Year<br />
(1) (8) (9)<br />
Valuation (3) (5) (7) % Increase Average<br />
as of (2) <strong>Annual</strong> (4) <strong>Annual</strong> (6) <strong>Annual</strong> in <strong>Annual</strong> <strong>Annual</strong><br />
August 31 Number Allowances Number Allowances Number Allowances* Allowances Allowances<br />
2008 $ $ 198,968 $ 605,932 252 NA $ 3,045<br />
2009 12,158 54,271,769 8,192 19,365,868 202,934 694,017,558 14.5% 3,420<br />
2010 14,996 71,136,696 7,924 21,837,784 210,006 757,979,912 9.2 3,609<br />
<strong>2011</strong> 20,467 109,331,023 8,019 24,802,618 222,454 898,001,599 18.5 4,037<br />
* Expected employer provided claims and expenses (net of retiree premiums).<br />
<strong>Annual</strong> Allowances in Column (7) include increases due to health care inflation for continuing retirees. Therefore, the annual allowance is not equal to the<br />
beginning of year allowance plus the “Added to Rolls” allowance minus the “Removed from Rolls” allowance.<br />
Solvency Test<br />
A short-term solvency test is one means of checking a post-employment benefit fund’s progress under its funding program. The<br />
following schedule provides a historical illustration of a short-term solvency test for <strong>TRS</strong>-Care wherein present valuation assets are<br />
compared with: (1) active member contributions on deposit; (2) the liabilities for future benefits to members who have retired or<br />
for terminated members with vested benefits; (3) the liabilities for service already rendered by active members.<br />
In a system that has been following the discipline of level contribution rate financing; the liabilities for future benefits for terminated<br />
employees will be fully covered by present assets, except in rare circumstances. The liabilities for services rendered by members<br />
will be at least partially covered by the remainder of present assets. Generally, if the system has been using level contribution rate<br />
financing, the funded portion of liability will increase over time. A decrease generally occurs in those years when substantial benefit<br />
improvements are granted, when full recommended contributions have not been made, or when there are actuarial experience losses.<br />
The funded ratio of the system based on total actuarial accrued liabilities provides an indication of how well the system is funded.<br />
122 ACTUARIAL SECTION
TEACHER RETIREMENT SYSTEM OF TEXAS COMPREHENSIVE ANNUAL FINANCIAL REPORT <strong>2011</strong><br />
Actuarial Information <strong>TRS</strong>-Care<br />
Aggregate Actuarial Accrued Liabilities For<br />
Solvency Test<br />
(AMOUNTS SHOWN IN MILLIONS)<br />
Portion of Aggregate Actuarial Accrued<br />
Liabilities Covered By Valuation Assets<br />
(8)<br />
(4) (6) (7) Members<br />
(1) (2) (3) Members Active Beneficiaries (Employer<br />
Valuation Active Beneficiaries (Employer (5) Member and Vested Financed<br />
as of Member and Vested Financed Valuation Contributions Terminations Portion)<br />
August 31 Contributions* Terminations Portion) Assets (5)/(2) [(5)-(2)]/3 [(5)-(2)-(3)]/(4)<br />
2007 NA $ 8,329 $ 11,419 $ 623 NA 7.5% 0.0%<br />
2008 NA 9,318 12,944 729 NA 7.8 0.0<br />
2009 NA 9,642 14,716 800 NA 8.3 0.0<br />
2010 NA 10,918 14,889 815 NA 7.5 0.0<br />
<strong>2011</strong> NA 13,710 16,075 891 NA 6.5 0.0<br />
* Active member contributions are non-refundable.<br />
Analysis of <strong>Financial</strong> Experience<br />
(AMOUNTS SHOWN IN MILLIONS)<br />
Valuation New Benefit<br />
as of Asset Liability Assumptions Changes Contributions Net<br />
August 31 Gain/(Loss) Gain/(Loss) Gain/(Loss) Gain/(Loss) Gain/(Loss) Gain/(Losses)<br />
<strong>2011</strong> $ (36) $ (44) $ (2,003) $ 0 $ (1,243) $ (3,326)<br />
ACTUARIAL SECTION<br />
123
TEACHER RETIREMENT SYSTEM OF TEXAS COMPREHENSIVE ANNUAL FINANCIAL REPORT <strong>2011</strong><br />
This page is intentionally left blank.<br />
124 ACTUARIAL SECTION
TEACHER RETIREMENT SYSTEM OF TEXAS COMPREHENSIVE ANNUAL FINANCIAL REPORT <strong>2011</strong><br />
STATISTICAL SECTION<br />
STATISTICAL SECTION<br />
125
TEACHER RETIREMENT SYSTEM OF TEXAS COMPREHENSIVE ANNUAL FINANCIAL REPORT <strong>2011</strong><br />
This page is intentionally left blank.<br />
126 STATISTICAL SECTION
TEACHER RETIREMENT SYSTEM OF TEXAS COMPREHENSIVE ANNUAL FINANCIAL REPORT <strong>2011</strong><br />
Statistical Section Overview<br />
The Statistical Section presents additional information<br />
to provide financial statement users with added historical<br />
perspective, context and detail to assist in using the<br />
information in the financial statements, notes to financial<br />
statements, and required supplementary information to<br />
understand and assess the system’s financial condition. Information<br />
is presented for Pension Trust Fund, <strong>TRS</strong>-Care<br />
(Retired Plan), <strong>TRS</strong>-ActiveCare (Active Plan), and the<br />
Non-major 403(b) Certification Program.<br />
FINANCIAL TRENDS INFORMATION<br />
The schedules on the following pages show financial trends<br />
information that assists users in understanding and assessing<br />
how the system’s financial position has changed<br />
over time. The financial trend schedules presented are:<br />
• Changes in Fiduciary Net Assets<br />
• Revenues, Expenses, and Changes in Net Assets<br />
• Benefits and Refund Deductions from Net Assets<br />
by Type<br />
• Health Care Claims Deductions/Expenses from Net<br />
Assets by Type<br />
OPERATING INFORMATION<br />
The schedules presented immediately following the <strong>Financial</strong><br />
Trends Information contain benefit and reporting<br />
operating information to provide contextual data about<br />
the system’s operations and resources to assist users in<br />
using financial statement information to understand the<br />
benefit services provided by the system. The operating<br />
information schedules presented are:<br />
• Average Benefit Payments<br />
• Average Health Care Claims<br />
• Retired Members by Type of Benefit<br />
• Health Care Claims by Benefit Range<br />
• Principal Participating <strong>Report</strong>ing Entities<br />
In addition, a complete listing of participating reporting<br />
entities has been included. The information in this section<br />
was derived from internal sources and the CAFR for the<br />
relevant year.<br />
STATISTICAL SECTION<br />
127
TEACHER RETIREMENT SYSTEM OF TEXAS COMPREHENSIVE ANNUAL FINANCIAL REPORT <strong>2011</strong><br />
1 0 - Y E A R S U M M A R Y<br />
Changes in Fiduciary Net Assets<br />
PENSION TRUST FUND<br />
FOR THE FISCAL YEARS ENDED AUGUST 31<br />
<strong>2011</strong> 2010 2009 2008<br />
Additions:<br />
Member Contributions $ 2,349,131,829 $ 2,289,537,187 $ 2,181,600,283 $ 2,085,345,861<br />
State Contributions 1,922,287,082 1,885,876,036 1,758,579,809 1,704,088,048<br />
<strong>Report</strong>ing Entities Contributions 419,968,516 412,268,503 412,728,096 353,524,480<br />
Service Contributions Transferred in<br />
from ERS 12,628,712 11,167,772 9,558,927 8,897,722<br />
Investment Income:<br />
Interest, Dividends and Securities<br />
Lending 2,203,623,538 1,978,962,334 2,126,151,392 3,414,753,511<br />
Net Appreciation (Depreciation)<br />
in Fair Value 12,616,681,465 7,542,738,000 (16,030,794,035) (7,992,472,030)<br />
Less: Investing Activity Expenses (183,369,775) (111,918,654) (68,990,517) (29,330,150)<br />
Other 1,576,613 2,453,980 1,768,337 2,080,418<br />
TOTAL ADDITIONS $ 19,342,527,980 $ 14,011,085,158 $ (9,609,397,708) $ (453,112,140)<br />
Deductions:<br />
Benefits $ 7,173,504,788 $ 6,617,397,374 $ 6,294,434,115 $ 6,406,644,540<br />
Excess Benefits 1,750,588 1,504,510 1,553,381 1,646,494<br />
Refunds of Contributions 334,268,822 265,186,589 266,695,076 278,002,614<br />
Service Contributions Transferred<br />
to ERS 64,772,079 61,570,750 57,135,135 52,773,854<br />
Administrative Expenses, Excluding<br />
Investing Activity Expenses 35,849,819 29,992,608 28,310,448 26,122,662<br />
TOTAL DEDUCTIONS $ 7,610,146,096 $ 6,975,651,831 $ 6,648,128,155 $ 6,765,190,164<br />
Net Increase (Decrease) $ 11,732,381,884 $ 7,035,433,327 $ (16,257,525,863) $ (7,218,302,304)<br />
Net Assets - Beginning of Year $ 95,688,405,009 $ 88,652,971,682 $ 104,910,497,545 $ 112,128,799,849<br />
Restatements<br />
<strong>Financial</strong> Trends Information<br />
Beginning of Year, As Restated $ 95,688,405,009 $ 88,652,971,682 $ 104,910,497,545 $ 112,128,799,849<br />
Net Assets - End of Year $ 107,420,786,893 $ 95,688,405,009 $ 88,652,971,682 $ 104,910,497,545<br />
128 STATISTICAL SECTION
TEACHER RETIREMENT SYSTEM OF TEXAS COMPREHENSIVE ANNUAL FINANCIAL REPORT <strong>2011</strong><br />
<strong>Financial</strong> Trends Information<br />
2007 2006 2005 2004 2003 2002<br />
$ 1,949,093,276 $ 1,853,971,836 $ 1,728,333,818 $ 1,721,504,445 $ 1,672,212,387 $ 1,560,700,102<br />
1,472,584,963 1,333,143,442 1,258,597,882 1,242,305,696 1,239,532,126 1,201,948,321<br />
282,077,713 267,399,619 221,158,942 192,395,672 182,536,228 157,781,530<br />
7,913,660 6,908,439 6,188,845 5,600,176 4,037,793 3,091,464<br />
3,084,172,953 2,640,734,877 2,360,711,299 2,134,920,032 2,144,222,155 2,413,196,778<br />
11,232,429,170 6,326,056,726 9,607,205,397 7,024,439,015 5,673,389,054 (8,477,880,514)<br />
(20,942,402) (19,099,395) (17,394,917) (16,252,645) (14,604,331) (12,921,671)<br />
2,892,262 3,178,512 2,324,123 2,754,738 3,272,714 3,270,611<br />
$ 18,010,221,595 $ 12,412,294,056 $ 15,167,125,389 $ 12,307,667,129 $ 10,904,598,126 $ (3,150,813,379)<br />
$ 5,762,885,044 $ 5,540,134,272 $ 5,349,900,638 $ 5,452,404,274 $ 4,727,518,136 $ 4,342,750,926<br />
1,453,605 1,041,961 926,187 516,529 461,925 690,735<br />
280,005,584 267,810,017 245,148,971 221,857,340 187,379,932 187,925,863<br />
48,538,424 45,716,307 41,200,491 38,068,440 28,609,871 24,183,510<br />
27,502,276 26,444,405 25,114,716 24,841,300 23,428,162 24,597,361<br />
$ 6,120,384,933 $ 5,881,146,962 $ 5,662,291,003 $ 5,737,687,883 $ 4,967,398,026 $ 4,580,148,395<br />
$ 11,889,836,662 $ 6,531,147,094 $ 9,504,834,386 $ 6,569,979,246 $ 5,937,200,100 $ (7,730,961,774)<br />
$ 100,238,963,187 $ 93,707,816,093 $ 84,202,981,707 $ 77,633,002,461 $ 71,695,802,361 $ 79,427,814,814<br />
(1,050,679)<br />
$ 100,238,963,187 $ 93,707,816,093 $ 84,202,981,707 $ 77,633,002,461 $ 71,695,802,361 $ 79,426,764,135<br />
$ 112,128,799,849 $ 100,238,963,187 $ 93,707,816,093 $ 84,202,981,707 $ 77,633,002,461 $ 71,695,802,361<br />
STATISTICAL SECTION<br />
129
TEACHER RETIREMENT SYSTEM OF TEXAS COMPREHENSIVE ANNUAL FINANCIAL REPORT <strong>2011</strong><br />
1 0 - Y E A R S U M M A R Y<br />
Changes in Fiduciary Net Assets<br />
<strong>TRS</strong>-CARE (RETIRED PLAN)<br />
FOR THE FISCAL YEARS ENDED AUGUST 31<br />
<strong>2011</strong> 2010 2009 2008<br />
Additions:<br />
Health Care Premiums $ 345,164,271 $ 332,481,933 $ 329,723,191 $ 328,505,433<br />
State Contributions 282,782,431 279,250,547 267,471,299 254,722,174<br />
Member Contributions 183,808,580 181,512,856 173,856,344 165,569,413<br />
<strong>Report</strong>ing Entities Contributions 158,724,010 155,918,241 149,562,613 141,672,630<br />
On Behalf Fringe Benefits Paid by<br />
the State 108,440 101,511 95,929 91,945<br />
Federal Revenue 136,887,805 70,795,686 61,530,735 59,486,239<br />
Investment Income 8,168,640 11,679,229 17,482,143 29,252,347<br />
Legislative Appropriations Transfer<br />
from <strong>TRS</strong>-ActiveCare<br />
TOTAL ADDITIONS $ 1,115,644,177 $ 1,031,740,003 $ 999,722,254 $ 979,300,181<br />
Deductions:<br />
Health Care Claims $ 992,478,380 $ 971,356,805 $ 885,132,865 $ 833,509,538<br />
Health Care Claims Processing 44,115,872 42,535,601 40,364,063 36,747,710<br />
Administrative Expenses, Excluding<br />
Investing Activity Expenses 3,143,922 3,031,686 2,916,259 3,000,536<br />
Legislative Appropriations Transfer<br />
to <strong>TRS</strong>-ActiveCare<br />
TOTAL DEDUCTIONS $ 1,039,738,174 $ 1,016,924,092 $ 928,413,187 $ 873,257,784<br />
Net Increase (Decrease) $ 75,906,003 $ 14,815,911 $ 71,309,067 $ 106,042,397<br />
Net Assets - Beginning of Year $ 814,964,303 $ 800,148,392 $ 728,839,325 $ 622,796,928<br />
Restatements<br />
<strong>Financial</strong> Trends Information<br />
Beginning of Year, As Restated $ 814,964,303 $ 800,148,392 $ 728,839,325 $ 622,796,928<br />
Net Assets - End of Year $ 890,870,306 $ 814,964,303 $ 800,148,392 $ 728,839,325<br />
130 STATISTICAL SECTION
TEACHER RETIREMENT SYSTEM OF TEXAS COMPREHENSIVE ANNUAL FINANCIAL REPORT <strong>2011</strong><br />
<strong>Financial</strong> Trends Information<br />
2007 2006 2005 2004 2003 2002<br />
$ 323,957,945 $ 326,844,982 $ 322,780,191 $ 248,552,679 $ 162,917,666 $ 143,797,748<br />
238,190,720 215,666,940 266,569,733 454,791,657 265,001,861 380,271,220<br />
154,823,968 140,183,511 101,198,783 99,297,097 49,170,399 47,378,092<br />
136,008,512 118,607,527 80,914,228 79,457,387<br />
55,932 53,283 41,994 37,173 36,344 35,842<br />
52,329,617 34,611,607<br />
32,671,539 21,435,792 11,258,874 4,803,809 3,394,956 7,140,560<br />
42,000,000<br />
$ 938,038,233 $ 857,403,642 $ 782,763,803 $ 928,939,802 $ 480,521,226 $ 578,623,462<br />
$ 742,293,147 $ 687,086,291 $ 660,559,083 $ 581,354,957 $ 571,744,362 $ 451,709,670<br />
33,407,937 31,975,150 31,262,147 23,914,851 19,388,818 16,828,256<br />
2,526,189 2,513,102 2,070,863 2,417,349 2,301,516 2,163,441<br />
42,000,000<br />
$ 778,227,273 $ 721,574,543 $ 693,892,093 $ 607,687,157 $ 635,434,696 $ 470,701,367<br />
$ 159,810,960 $ 135,829,099 $ 88,871,710 $ 321,252,645 $ (154,913,470) $ 107,922,095<br />
$ 462,985,968 $ 327,156,869 $ 238,285,159 $ (82,967,486) $ 71,945,984 $ (35,950,516)<br />
(25,595)<br />
$ 462,985,968 $ 327,156,869 $ 238,285,159 $ (82,967,486) $ 71,945,984 $ (35,976,111)<br />
$ 622,796,928 $ 462,985,968 $ 327,156,869 $ 238,285,159 $ (82,967,486) $ 71,945,984<br />
STATISTICAL SECTION<br />
131
TEACHER RETIREMENT SYSTEM OF TEXAS COMPREHENSIVE ANNUAL FINANCIAL REPORT <strong>2011</strong><br />
<strong>Financial</strong> Trends Information<br />
Revenues, Expenses, and Changes in Net Assets<br />
<strong>TRS</strong>-ACTIVECARE (ACTIVE PLAN) *<br />
FOR THE FISCAL YEARS ENDED AUGUST 31<br />
<strong>2011</strong> 2010 2009 2008<br />
1 0 - Y E A R S U M M A R Y<br />
Revenues<br />
Health Care Premiums $ 1,549,530,891 $ 1,329,171,411 $ 1,172,011,048 $ 1,096,537,022<br />
Administrative Fees 135,917 125,321 187,813 186,844<br />
Investment Income 3,387,062 6,421,269 11,597,992 21,164,640<br />
Federal Revenue ARRA - Cobra<br />
Reimbursements** 667,746 1,225,158 170,219<br />
On Behalf Fringe Benefits Paid by<br />
the State 67,373 64,328 64,975 61,894<br />
Legislative Appropriations Transfer<br />
From <strong>TRS</strong>-Care (Retired Plan)<br />
State Contributions<br />
TOTAL REVENUES $ 1,553,788,989 $ 1,337,007,487 $ 1,184,032,047 $ 1,117,950,400<br />
Expenses<br />
Health Care Claims $ 1,510,090,981 $ 1,313,114,197 $ 1,122,646,958 $ 952,156,339<br />
Health Care Claims Processing 76,960,951 67,906,654 60,934,432 54,583,499<br />
Premium Payments to HMOs 76,270,706 64,532,253 64,820,440 68,204,743<br />
Administrative Expenses 2,207,051 1,883,148 1,861,949 1,830,258<br />
Legislative Appropriations Transfer<br />
to <strong>TRS</strong>-Care (Retired Plan)<br />
TOTAL EXPENSES $ 1,665,529,689 $ 1,447,436,252 $ 1,250,263,779 $ 1,076,774,839<br />
Change in Net Assets $ (111,740,700) $ (110,428,765) $ (66,231,732) $ 41,175,561<br />
Net Assets - Beginning of Year $ 299,810,127 $ 410,238,892 $ 476,470,624 $ 435,295,063<br />
Restatements<br />
Beginning of Year, As Restated $ 299,810,127 $ 410,238,892 $ 476,470,624 $ 435,295,063<br />
Net Assets - End of Year $ 188,069,427 $ 299,810,127 $ 410,238,892 $ 476,470,624<br />
* The <strong>TRS</strong>-ActiveCare Plan, enacted by H.B. 3343, 77th Legislature, began operations in fiscal year 2003 and is accounted for as a proprietary<br />
fund. Prior to fiscal year 2003, <strong>TRS</strong> accounted for <strong>TRS</strong>-ActiveCare (Active Plan) as a fiduciary fund. The net assets of the Active Plan were<br />
transferred to <strong>TRS</strong>-ActiveCare on September 1, 2002.<br />
** The American Recovery and Reinvestment Act (ARRA) of 2009 which was signed into law on February 17, 2009 was created to preserve<br />
jobs and promote economic recovery.<br />
132 STATISTICAL SECTION
TEACHER RETIREMENT SYSTEM OF TEXAS COMPREHENSIVE ANNUAL FINANCIAL REPORT <strong>2011</strong><br />
<strong>Financial</strong> Trends Information<br />
2007 2006 2005 2004 2003 2002<br />
$ 939,694,028 $ 861,464,205 $ 823,726,341 $ 758,062,552 $ 584,572,852 $<br />
184,937 183,470 183,317 192,763 136,288 108,198<br />
26,016,380 18,650,516 8,915,711 3,641,100 2,459,154 590,967<br />
46,446 40,979 35,626 24,050 31,266 23,843<br />
42,000,000<br />
2,674,579<br />
$ 965,941,791 $ 880,339,170 $ 832,860,995 $ 761,920,465 $ 629,199,560 $ 3,397,587<br />
$ 801,148,962 $ 708,972,484 $ 663,361,138 $ 520,998,423 $ 473,450,544 $ (34,455)<br />
48,177,777 53,013,214 53,697,572 53,564,510 42,411,388<br />
58,742,363 49,466,150 42,574,641 40,210,539<br />
1,775,831 1,680,952 1,607,113 918,619 1,771,441 2,750,107<br />
42,000,000<br />
$ 909,844,933 $ 813,132,800 $ 761,240,464 $ 657,692,091 $ 517,633,373 $ 2,715,652<br />
$ 56,096,858 $ 67,206,370 $ 71,620,531 $ 104,228,374 $ 111,566,187 $ 681,935<br />
$ 379,198,205 $ 311,991,835 $ 240,371,304 $ 136,421,779 $ 24,855,592 $ 24,179,853<br />
(278,849) (6,196)<br />
$ 379,198,205 $ 311,991,835 $ 240,371,304 $ 136,142,930 $ 24,855,592 $ 24,173,657<br />
$ 435,295,063 $ 379,198,205 $ 311,991,835 $ 240,371,304 $ 136,421,779 $ 24,855,592<br />
STATISTICAL SECTION<br />
133
TEACHER RETIREMENT SYSTEM OF TEXAS COMPREHENSIVE ANNUAL FINANCIAL REPORT <strong>2011</strong><br />
<strong>Financial</strong> Trends Information<br />
Revenues, Expenses, and Changes in Net Assets<br />
403(b) CERTIFICATION PROGRAM<br />
FOR THE FISCAL YEARS ENDED AUGUST 31<br />
<strong>2011</strong> 2010 2009 2008<br />
1 0 - Y E A R S U M M A R Y<br />
Revenues:<br />
Certification Fees $ 12,000 $ 30,000 $ 6,000 $ 30,000<br />
Product Registration Fees 3,000 21,000 9,000 180,000<br />
Investment Income 1,801 4,318 8,558 19,337<br />
On Behalf Fringe Benefits Paid<br />
by the State 7,898 8,034<br />
TOTAL REVENUES $ 24,699 $ 63,352 $ 23,558 $ 229,337<br />
Expenses:<br />
Administrative Expenses $ 148,444 $ 172,835 $ 88,000 $ 192,000<br />
TOTAL EXPENSES $ 148,444 $ 172,835 $ 88,000 $ 192,000<br />
Change in Net Assets $ (123,745) $ (109,483) $ (64,442) $ 37,337<br />
Net Assets - Beginning of Year $ 245,777 $ 355,260 $ 419,702 $ 382,365<br />
Net Assets - End of Year $ 122,032 $ 245,777 $ 355,260 $ 419,702<br />
134 STATISTICAL SECTION
TEACHER RETIREMENT SYSTEM OF TEXAS COMPREHENSIVE ANNUAL FINANCIAL REPORT <strong>2011</strong><br />
<strong>Financial</strong> Trends Information<br />
2007 2006 2005 2004 2003 2002<br />
$ 171,000 $ 30,000 $ 10,000 $ 15,000 $ 55,000 $ 325,000<br />
12,070 9,532 5,529 3,495 4,617 1,164<br />
1,197 3,953<br />
$ 183,070 $ 39,532 $ 15,529 $ 18,495 $ 60,814 $ 330,117<br />
$ 24,000 $ 24,000 $ 24,000 $ 24,000 $ 45,074 $ 124,118<br />
$ 24,000 $ 24,000 $ 24,000 $ 24,000 $ 45,074 $ 124,118<br />
$ 159,070 $ 15,532 $ (8,471) $ (5,505) $ 15,740 $ 205,999<br />
$ 223,295 $ 207,763 $ 216,234 $ 221,739 $ 205,999 $<br />
$ 382,365 $ 223,295 $ 207,763 $ 216,234 $ 221,739 $ 205,999<br />
STATISTICAL SECTION<br />
135
TEACHER RETIREMENT SYSTEM OF TEXAS COMPREHENSIVE ANNUAL FINANCIAL REPORT <strong>2011</strong><br />
<strong>Financial</strong> Trends Information<br />
Benefits and Refund Deductions<br />
from Net Assets by Type<br />
PENSION TRUST FUND<br />
LAST TEN FISCAL YEARS<br />
<strong>2011</strong> 2010 2009 2008<br />
Type of Benefit<br />
Service Retirements ** $ 6,241,946,655 $ 5,841,963,927 $ 5,565,925,090 $ 5,649,308,335*<br />
Deferred Retirement Option 27,822,115 22,607,290 23,272,668 26,757,772<br />
Partial Lump Sum Option 524,925,790 385,555,126 348,261,100 363,668,944<br />
Disability Retirements 144,865,109 141,396,837 138,569,650 146,907,654<br />
Death and Survivor Benefits:<br />
<strong>Annual</strong> Salary 47,295,194 45,698,147 43,235,232 42,216,290<br />
Survivor Annuities 86,898,720 82,574,358 79,951,723 78,862,569<br />
Life Annuities 84,893,007 83,238,898 81,764,240 85,576,098<br />
60 Monthly Payments 11,564,275 10,824,948 10,180,012 10,169,530<br />
Remainder of Contributions 3,293,923 3,537,843 3,274,400 3,177,348<br />
Excess Benefits 1,750,588 1,504,510 1,553,381 1,646,494<br />
TOTAL BENEFITS $ 7,175,255,376 $ 6,618,901,884 $ 6,295,987,496 $ 6,408,291,034<br />
Type of Refund<br />
Death $ 3,984,340 $ 3,710,941 $ 3,084,718 $ 2,520,283<br />
Separation 330,284,482 261,475,648 263,610,358 275,482,331<br />
TOTAL REFUNDS $ 334,268,822 $ 265,186,589 $ 266,695,076 $ 278,002,614<br />
* A one-time supplemental payment capped at $2,400 was distributed to eligible retirees in January 2008.<br />
** For fiscal years 2010 and prior, Service Retirements changed due to the reclassification of Transfers of Service Contributions with Employees Retirement<br />
System of Texas.<br />
Health Care Claims Deductions from Net Assets by Type<br />
<strong>TRS</strong>-CARE (RETIRED PLAN)<br />
LAST TEN FISCAL YEARS<br />
<strong>2011</strong> 2010 2009 2008<br />
Type of Claim<br />
Medical $ 608,461,321 $ 575,539,788 $ 531,239,020 $ 498,767,038<br />
Prescription Drugs 384,017,059 395,817,017 353,893,845 334,742,500<br />
TOTAL $ 992,478,380 $ 971,356,805 $ 885,132,865 $ 833,509,538<br />
Health Care Claims Expenses from Net Assets by Type<br />
<strong>TRS</strong>-ACTIVECARE (ACTIVE PLAN)<br />
LAST NINE FISCAL YEARS (SINCE PLAN INCEPTION)<br />
<strong>2011</strong> 2010 2009 2008<br />
Type of Claim<br />
Medical $ 1,242,673,156 $ 1,092,107,916 $ 934,733,927 $ 788,240,087<br />
Prescription Drugs 267,417,825 221,006,281 187,913,031 163,916,252<br />
TOTAL $ 1,510,090,981 $ 1,313,114,197 $ 1,122,646,958 $ 952,156,339<br />
136 STATISTICAL SECTION
TEACHER RETIREMENT SYSTEM OF TEXAS COMPREHENSIVE ANNUAL FINANCIAL REPORT <strong>2011</strong><br />
<strong>Financial</strong> Trends Information<br />
2007 2006 2005 2004 2003 2002<br />
$ 5,064,191,508 $ 4,857,348,525 $ 4,674,681,613 $ 4,289,249,761 $ 3,892,777,093 $ 3,591,219,348<br />
31,939,855 36,033,028 55,152,336 139,047,656 89,305,527 48,697,685<br />
325,688,244 313,359,714 288,088,743 696,201,755 427,944,774 386,442,648<br />
134,866,736 132,155,505 129,331,288 125,992,690 122,409,366 119,913,327<br />
38,928,295 37,880,818 40,838,680 41,669,051 41,284,946 43,685,098<br />
76,116,829 74,115,776 74,325,670 74,320,247 70,611,609 71,664,740<br />
78,322,931 77,537,970 76,113,908 75,839,736 74,581,837 72,919,628<br />
9,386,943 8,581,053 7,583,719 7,089,131 6,385,087 5,649,671<br />
3,443,703 3,121,883 3,784,681 2,994,247 2,217,897 2,558,781<br />
1,453,605 1,041,961 926,187 516,529 461,925 690,735<br />
$ 5,764,338,649 $ 5,541,176,233 $ 5,350,826,825 $ 5,452,920,803 $ 4,727,980,061 $ 4,343,441,661<br />
$ 2,073,365 $ 2,322,538 $ 1,766,957 $ 1,460,631 $ 1,297,262 $ 1,504,798<br />
277,932,219 265,487,479 243,382,014 220,396,709 186,082,670 186,421,065<br />
$ 280,005,584 $ 267,810,017 $ 245,148,971 $ 221,857,340 $ 187,379,932 $ 187,925,863<br />
2007 2006 2005 2004 2003 2002<br />
$ 437,519,746 $ 427,553,404 $ 431,036,095 $ 366,840,457 $ 368,462,963 $ 287,729,917<br />
304,773,401 259,532,887 229,522,988 214,514,500 203,281,399 163,979,753<br />
$ 742,293,147 $ 687,086,291 $ 660,559,083 $ 581,354,957 $ 571,744,362 $ 451,709,670<br />
2007 2006 2005 2004 2003<br />
$ 659,478,760 $ 587,513,767 $ 546,106,804 $ 425,394,453 $ 392,085,280<br />
141,670,202 121,458,717 117,254,334 95,603,970 81,365,264<br />
$ 801,148,962 $ 708,972,484 $ 663,361,138 $ 520,998,423 $ 473,450,544<br />
STATISTICAL SECTION<br />
137
TEACHER RETIREMENT SYSTEM OF TEXAS COMPREHENSIVE ANNUAL FINANCIAL REPORT <strong>2011</strong><br />
Operating Information<br />
Average Benefit Payments<br />
PENSION TRUST FUND<br />
LAST TEN FISCAL YEARS<br />
Years Credited Service<br />
Retirement Effective Dates 5-10 11-15 16-20 21-25 26-30 30+<br />
9-1-01 to 8-31-02<br />
Average Monthly Benefit * $ 235.62 $ 465.19 $ 948.58 $ 1,446.47 $ 2,210.88 $ 3,032.32<br />
Average Final Average Salary $ 20,405 $ 24,637 $ 31,300 $ 36,564 $ 46,505 $ 53,956<br />
Number of Retirees 1,207 1,252 1,648 3,077 4,982 4,722<br />
9-1-02 to 8-31-03<br />
Average Monthly Benefit * $ 267.23 $ 501.44 $ 969.32 $ 1,476.39 $ 2,222.05 $ 3,044.63<br />
Average Final Average Salary $ 23,438 $26,804 $ 31,814 $ 37,452 $ 46,435 $ 53,748<br />
Number of Retirees 1,504 1,637 2,157 3,790 6,000 5,085<br />
9-1-03 to 8-31-04<br />
Average Monthly Benefit * $ 269.62 $ 482.03 $ 983.69 $ 1,498.10 $ 2,181.65 $ 3,039.38<br />
Average Final Average Salary $ 23,472 $ 26,777 $ 32,463 $ 38,613 $ 46,745 $ 54,523<br />
Number of Retirees 1,795 2,278 3,090 5,670 7,998 6,254<br />
9-1-04 to 8-31-05<br />
Average Monthly Benefit * $ 272.29 $ 534.30 $ 1,058.22 $ 1,602.60 $ 2,333.09 $ 3,268.08<br />
Average Final Average Salary $ 24,774 $ 28,314 $ 35,336 $ 41,197 $ 49,446 $ 58,164<br />
Number of Retirees 1,410 1,227 1,427 2,073 3,174 2,492<br />
9-1-05 to 8-31-06<br />
Average Monthly Benefit * $ 279.86 $ 581.08 $ 1,094.99 $ 1,632.03 $ 2,339.64 $ 3,311.32<br />
Average Final Average Salary $ 25,456 $ 30,647 $ 36,767 $ 42,297 $ 49,650 $ 58,987<br />
Number of Retirees 1,494 1,129 1,578 2,483 3,332 2,701<br />
9-1-06 to 8-31-07<br />
Average Monthly Benefit * $ 309.31 $ 599.69 $ 1,118.68 $ 1,697.33 $ 2,424.40 $ 3,454.36<br />
Average Final Average Salary $ 27,448 $ 31,601 $ 37,444 $ 44,120 $ 51,683 $ 61,103<br />
Number of Retirees 1,575 1,183 1,554 2,626 3,290 2,835<br />
9-1-07 to 8-31-08<br />
Average Monthly Benefit * $ 314.01 $ 619.37 $ 1,149.46 $ 1,756.45 $ 2,534.82 $ 3,507.17<br />
Average Final Average Salary $ 27,891 $ 32,392 $ 38,415 $ 45,578 $ 53,609 $ 61,837<br />
Number of Retirees 1,532 1,282 1,902 2,942 3,754 3,332<br />
9-1-08 to 8-31-09<br />
Average Monthly Benefit * $ 350.03 $ 656.43 $ 1,216.76 $ 1,769.01 $ 2,607.96 $ 3,626.69<br />
Average Final Average Salary $ 29,740 $ 33,084 $ 40,362 $ 45,647 $ 54,736 $ 63,059<br />
Number of Retirees 1,464 1,377 1,917 2,877 3,361 3,229<br />
9-1-09 to 8-31-10<br />
Average Monthly Benefit * $ 362.62 $ 669.56 $ 1,224.03 $ 1,836.62 $ 2,634.63 $ 3,726.76<br />
Average Final Average Salary $ 30,285 $ 34,364 $ 40,460 $ 47,303 $ 55,169 $ 64,233<br />
Number of Retirees 1,676 1,603 2,238 3,517 3,823 4,186<br />
9-1-10 to 8-31-11<br />
Average Monthly Benefit * $ 385.71 $ 711.76 $ 1,266.00 $ 1,870.17 $2,665.53 $ 3,766.87<br />
Average Final Average Salary $ 32,046 $ 35,690 $ 42,073 $ 48,182 $ 55,116 $ 64,929<br />
Number of Retirees 1,737 1,692 2,407 3,852 4,283 5,510<br />
* Average monthly benefits have been reduced for Partial Lump Sum Option payments of $386.4, $427.9, $696.2, $288.1, $313.4, $325.7, $363.7, $348.3,<br />
$385.6 and $524.9 million in fiscal years 2002, 2003, 2004, 2005, 2006, 2007, 2008, 2009, 2010 and <strong>2011</strong> respectively.<br />
138 STATISTICAL SECTION
TEACHER RETIREMENT SYSTEM OF TEXAS COMPREHENSIVE ANNUAL FINANCIAL REPORT <strong>2011</strong><br />
Operating Information<br />
Average<br />
Health Care Claims<br />
<strong>TRS</strong>-CARE (RETIRED PLAN)<br />
LAST TEN FISCAL YEARS<br />
<strong>2011</strong><br />
Average Claims Per Participant $ 4,718.15<br />
Health Care Claims $ 992,478,380<br />
Average Participants 210,353<br />
2010<br />
Average Claims Per Participant $ 4,790.25<br />
Health Care Claims $ 971,356,805<br />
Average Participants 202,778<br />
2009<br />
Average Claims Per Participant $ 4,464.01<br />
Health Care Claims $ 885,132,865<br />
Average Participants 198,282<br />
2008<br />
Average Claims Per Participant $ 4,302.36<br />
Health Care Claims $ 833,509,538<br />
Average Participants 193,733<br />
2007<br />
Average Claims Per Participant $ 3,891.49<br />
Health Care Claims $ 742,293,147<br />
Average Participants 190,748<br />
2006<br />
Average Claims Per Participant $ 3,658.53<br />
Health Care Claims $ 687,086,291<br />
Average Participants 187,804<br />
2005<br />
Average Claims Per Participant $ 3,563.06<br />
Health Care Claims $ 660,559,083<br />
Average Participants 185,391<br />
2004<br />
Average Claims Per Participant $ 3,434.58<br />
Health Care Claims $ 581,354,957<br />
Average Participants 169,265<br />
2003<br />
Average Claims Per Participant $ 3,698.31<br />
Health Care Claims $ 571,744,362<br />
Average Participants 154,596<br />
2002<br />
Average Claims Per Participant $ 3,156.18<br />
Health Care Claims $ 451,709,670<br />
Average Participants 143,119<br />
Average<br />
Health Care Claims<br />
<strong>TRS</strong>-ACTIVECARE (ACTIVE PLAN)<br />
LAST NINE FISCAL YEARS<br />
(SINCE PLAN INCEPTION)<br />
<strong>2011</strong><br />
Average Claims Per Participant $ 3,661.85<br />
Health Care Claims $ 1,510,090,981<br />
Average Participants 412,385<br />
2010<br />
Average Claims Per Participant $ 3,509.11<br />
Health Care Claims $ 1,313,114,197<br />
Average Participants 374,201<br />
2009<br />
Average Claims Per Participant $ 3,323.59<br />
Health Care Claims $ 1,122,646,958<br />
Average Participants 337,781<br />
2008<br />
Average Claims Per Participant $ 3,059.63<br />
Health Care Claims $ 952,156,339<br />
Average Participants 311,200<br />
2007<br />
Average Claims Per Participant $ 2,834.53<br />
Health Care Claims $ 801,148,962<br />
Average Participants 282,639<br />
2006<br />
Average Claims Per Participant $ 2,744.75<br />
Health Care Claims $ 708,972,484<br />
Average Participants 258,301<br />
2005<br />
Average Claims Per Participant $ 2,714.19<br />
Health Care Claims $ 663,361,138<br />
Average Participants 244,405<br />
2004<br />
Average Claims Per Participant $ 2,357.20<br />
Health Care Claims $ 520,998,423<br />
Average Participants 221,024<br />
2003<br />
Average Claims Per Participant $ 2,616.24<br />
Health Care Claims $ 473,450,544<br />
Average Participants 180,966<br />
STATISTICAL SECTION<br />
139
TEACHER RETIREMENT SYSTEM OF TEXAS COMPREHENSIVE ANNUAL FINANCIAL REPORT <strong>2011</strong><br />
Retired Members by Type of Benefit<br />
PENSION TRUST FUND<br />
AS OF AUGUST 31, <strong>2011</strong><br />
Number<br />
Amount of of Type of Retirement a<br />
Monthly<br />
Retired<br />
Benefit Members 1 2 3 4 5 6 7<br />
$ 1 - 200 12,890 4,847 6,555 321 1,063 53 37 14<br />
$ 201 - 400 33,923 8,399 11,715 651 1,832 1,052 766 9,508<br />
$ 401 - 600 21,855 9,774 8,326 1,336 1,879 276 264 0<br />
$ 601 - 800 19,331 10,734 5,084 1,338 1,556 340 279 0<br />
$ 801 - 1,000 18,448 11,945 3,494 1,052 1,388 354 215 0<br />
$ 1,001 - 1,200 16,077 11,145 2,511 772 1,197 291 161 0<br />
$ 1,201 - 1,400 13,901 9,440 2,300 635 1,181 225 120 0<br />
$ 1,401 - 1,600 14,663 9,927 2,751 576 1,071 241 97 0<br />
$ 1,601 - 1,800 15,039 10,635 2,651 508 923 230 92 0<br />
$ 1,801 - 2,000 15,924 12,065 2,375 413 781 236 54 0<br />
$ over 2,000 130,629 113,834 8,817 1,257 5,379 1,239 103 0<br />
Totals 312,680 212,745 56,579 8,859 18,250 4,537 2,188 9,522<br />
a<br />
Type of Retirement:<br />
1 - Normal Retirement of Age and Service<br />
2 - Early Retirement<br />
3 - Disability Retirement<br />
4 - Survivor Payment, Joint Life or Guarantee<br />
5 - Survivor Payment, Death in Service<br />
6 - Survivor Payment, After Disability Retirement<br />
7 - Survivor Payment, After Service Retirement<br />
Operating Information<br />
Health Care Claims<br />
by Benefit Range<br />
<strong>TRS</strong>-CARE (RETIRED PLAN)<br />
AS OF AUGUST 31, <strong>2011</strong><br />
Benefit<br />
Range<br />
Average<br />
Participants<br />
$ 0 27,375<br />
$ 1 - 5,000 134,135<br />
$ 5,001 - 10,000 29,365<br />
$ 10,001 - 20,000 11,373<br />
$ 20,001 - 30,000 3,009<br />
$ 30,001 - 40,000 1,413<br />
$ 40,001 - 50,000 943<br />
$ 50,001 - 100,000 1,671<br />
$ over 100,000 1,069<br />
Total 210,353<br />
Health Care Claims<br />
by Benefit Range<br />
<strong>TRS</strong>-ACTIVECARE (ACTIVE PLAN)<br />
AS OF AUGUST 31, <strong>2011</strong><br />
Benefit<br />
Range<br />
Average<br />
Participants<br />
$ 0 62,192<br />
$ 1 - 5,000 294,597<br />
$ 5,001 - 10,000 28,299<br />
$ 10,001 - 20,000 14,293<br />
$ 20,001 - 30,000 4,973<br />
$ 30,001 - 40,000 2,430<br />
$ 40,001 - 50,000 1,612<br />
$ 50,001 - 100,000 2,578<br />
$ over 100,000 1,411<br />
Total 412,385<br />
140 STATISTICAL SECTION
TEACHER RETIREMENT SYSTEM OF TEXAS COMPREHENSIVE ANNUAL FINANCIAL REPORT <strong>2011</strong><br />
Operating Information<br />
Option Selected b<br />
1 2 3 4 5 6<br />
5,902 4,504 1,049 413 970 52<br />
10,939 7,230 2,099 924 1,786 10,945<br />
10,609 6,293 2,367 952 1,634 0<br />
9,054 5,620 2,565 897 1,195 0<br />
8,633 5,130 2,675 878 1,132 0<br />
6,969 4,885 2,576 715 932 0<br />
5,478 4,662 2,391 563 807 0<br />
5,677 5,019 2,482 618 867 0<br />
5,767 5,194 2,561 589 928 0<br />
5,809 5,621 2,888 584 1,022 0<br />
45,491 48,740 24,844 4,279 7,275 0<br />
120,328 102,898 48,497 11,412 18,548 10,997<br />
b<br />
Option Selected:<br />
Option 1 - Life Annuity<br />
Option 2 - Joint to Survivor<br />
Option 3 - Joint to Survivor 50% / Joint to Survivor 75%<br />
Option 4 - 5-Year Guarantee<br />
Option 5 - 10-Year Guarantee<br />
Option 6 - Survivor Benefit<br />
STATISTICAL SECTION<br />
141
TEACHER RETIREMENT SYSTEM OF TEXAS COMPREHENSIVE ANNUAL FINANCIAL REPORT <strong>2011</strong><br />
Operating Information<br />
Principal Participating <strong>Report</strong>ing Entities<br />
PENSION TRUST FUND<br />
CURRENT FISCAL YEAR AND NINE YEARS AGO<br />
<strong>2011</strong> 2002<br />
Percentage<br />
Percentage<br />
of Total<br />
of Total<br />
Covered Covered Covered Covered<br />
Participating <strong>Report</strong>ing Entity Employees Rank Employment Employees Rank Employment<br />
Houston ISD 23,777 1 2.92% 25,646 1 3.75%<br />
Dallas ISD 19,780 2 2.43 19,327 2 2.82<br />
UT MD Anderson Cancer Center 16,254 3 1.99 10,415 4 1.52<br />
Cypress Fairbanks ISD 13,193 4 1.62 9,098 8 1.33<br />
Northside ISD 12,775 5 1.57 9,362 7 1.37<br />
Austin ISD 12,299 6 1.51 10,716 3 1.57<br />
Fort Worth ISD 10,987 7 1.35 10,254 5 1.50<br />
UT at Austin 10,111 8 1.24 8,963 9 1.31<br />
UT Medical Branch at Galveston 9,128 9 1.12 9,866 6 1.44<br />
North East ISD 8,956 10 1.10<br />
El Paso ISD 8,567 10 1.25<br />
All other 678,029 83.15 562,148 82.14<br />
Total 815,289 100.00% 684,362 100.00%<br />
Source:<br />
May report month information submitted to the Teacher Retirement System by participating reporting entities.<br />
142 STATISTICAL SECTION
TEACHER RETIREMENT SYSTEM OF TEXAS COMPREHENSIVE ANNUAL FINANCIAL REPORT <strong>2011</strong><br />
Operating Information<br />
Principal Participating <strong>Report</strong>ing Entities<br />
<strong>TRS</strong>-CARE (RETIRED PLAN)<br />
CURRENT FISCAL YEAR AND NINE YEARS AGO<br />
<strong>2011</strong> 2002<br />
Percentage<br />
Percentage<br />
of Total<br />
of Total<br />
Covered Covered Covered Covered<br />
OPEB OPEB OPEB OPEB<br />
Participating <strong>Report</strong>ing Entity Employees Rank Employment Employees Rank Employment<br />
Houston ISD 23,777 1 3.52% 25,646 1 4.44%<br />
Dallas ISD 19,780 2 2.92 19,327 2 3.35<br />
Cypress Fairbanks ISD 13,193 3 1.95 9,098 6 1.58<br />
Northside ISD 12,775 4 1.89 9,362 5 1.62<br />
Austin ISD 12,299 5 1.82 10,716 3 1.86<br />
Fort Worth ISD 10,987 6 1.62 10,254 4 1.78<br />
North East ISD 8,956 7 1.32<br />
El Paso ISD 8,860 8 1.31 8,567 7 1.48<br />
Aldine ISD 8,538 9 1.26 7,741 9 1.34<br />
Arlington ISD 8,119 10 1.20 7,671 10 1.33<br />
San Antonio ISD 7,856 8 1.36<br />
All other 548,992 81.19 461,084 79.86<br />
Total 676,276 100.00% 577,322 100.00%<br />
Source:<br />
May report month information submitted to the Teacher Retirement System by participating reporting entities.<br />
STATISTICAL SECTION<br />
143
TEACHER RETIREMENT SYSTEM OF TEXAS COMPREHENSIVE ANNUAL FINANCIAL REPORT <strong>2011</strong><br />
Listing of Participating <strong>Report</strong>ing Entities<br />
Community and Junior<br />
Colleges<br />
Alamo Comm College Dist<br />
Alvin Community College<br />
Amarillo College<br />
Angelina College<br />
Austin Community College<br />
Blinn College<br />
Brazosport College<br />
Central Texas College<br />
Cisco Junior College<br />
Clarendon College<br />
Coastal Bend College<br />
College of the Mainland<br />
Collin Cty Comm College<br />
Dallas Cty Comm Coll Dist<br />
Del Mar College<br />
El Paso Community College<br />
Frank Phillips College<br />
Galveston College<br />
Grayson County College<br />
Hill College<br />
Houston Comm Coll System<br />
Howard Cty Jr Coll Dist<br />
Kilgore College<br />
Laredo Community College<br />
Lee College<br />
Lone Star College System<br />
McLennan Comm College<br />
Midland College<br />
Navarro College<br />
North Central Tx College<br />
Northeast Tx Comm College<br />
Odessa College<br />
Panola College<br />
Paris Junior College<br />
Ranger Junior College<br />
San Jacinto College Dist<br />
South Plains College<br />
South Texas Comm College<br />
Southwest Tx Jr College<br />
Tarrant County Coll Dist<br />
Temple College<br />
Texarkana College<br />
Texas Southmost College<br />
Texas State Tech College<br />
Trinity Valley Jr College<br />
Tyler Junior College<br />
Vernon College<br />
Victoria College<br />
Weatherford College<br />
Western Texas College<br />
Wharton County Jr College<br />
Universities<br />
Angelo State University<br />
Lamar Inst of Technology<br />
Lamar St Coll at Orange<br />
Lamar St Coll at Port Arthur<br />
Lamar University<br />
Midwestern State Univ<br />
Prairie View A & M Univ<br />
Sam Houston State Univ<br />
Stephen F Austin State U<br />
Sul Ross State University<br />
Tarleton State University<br />
Texas A & M at Galveston<br />
Texas A & M-Central Texas (Killeen)<br />
Texas A & M Corpus Christi<br />
Texas A & M U-Commerce<br />
Texas A & M U-Kingsville<br />
Texas A & M-San Antonio<br />
Texas A & M U-Texarkana<br />
Texas A & M University<br />
Texas AgriLife Research<br />
Texas AgriLife Ext Service<br />
Texas Eng Exp Station<br />
Texas Eng Ext Service<br />
Texas Forest Service<br />
Texas Southern University<br />
Texas State Univ-San Marcos<br />
Texas State Univ System<br />
Texas Tech University<br />
Texas Transportation Inst<br />
Texas Womans University<br />
Tx A & M International Univ<br />
Tx A & M U Systems Office<br />
U H at Houston<br />
U of N Texas System Admin<br />
U T at Arlington<br />
U T at Austin<br />
U T at Dallas<br />
U T at El Paso<br />
U T at San Antonio<br />
U T at Tyler<br />
U T Pan American<br />
U T Permian Basin<br />
Univ Tx at Brownsville<br />
University of North Tx<br />
University of North Tx at Dallas<br />
West Texas A & M Univ<br />
Medical Schools<br />
T A M U System H S C<br />
Texas Veterinary Med<br />
Diagnostic Lab<br />
U N T H S C at Fort Worth<br />
U T H S C at Houston<br />
U T H S C at San Antonio<br />
U T Health Ctr at Tyler<br />
U T M D Anderson Hospital<br />
U T Med Br at Galveston<br />
U T S W Medical Center<br />
School Districts<br />
Abbott I S D<br />
Abernathy I S D<br />
Abilene I S D<br />
Academy I S D<br />
Adrian I S D<br />
Agua Dulce I S D<br />
Alamo Heights I S D<br />
Alba Golden I S D<br />
Albany I S D<br />
Aldine I S D<br />
Aledo I S D<br />
Alice I S D<br />
Alief I S D<br />
Allen I S D<br />
Alpine I S D<br />
Alto I S D<br />
Alvarado I S D<br />
Alvin I S D<br />
Alvord I S D<br />
Amarillo I S D<br />
Amherst I S D<br />
Anahuac I S D<br />
Anderson Shiro Cons I S D<br />
Andrews I S D<br />
Angleton I S D<br />
Anna I S D<br />
Anson I S D<br />
Anthony I S D<br />
Anton I S D<br />
Apple Springs I S D<br />
Aquilla I S D<br />
Aransas County I S D<br />
Aransas Pass I S D<br />
Archer City I S D<br />
Argyle I S D<br />
Arlington I S D<br />
Arp I S D<br />
Aspermont I S D<br />
Athens I S D<br />
Atlanta I S D<br />
Aubrey I S D<br />
Austin I S D<br />
Austwell Tivoli I S D<br />
Avalon I S D<br />
Avery I S D<br />
Avinger I S D<br />
Axtell I S D<br />
Azle I S D<br />
Baird I S D<br />
Ballinger I S D<br />
Balmorhea I S D<br />
Bandera I S D<br />
Bangs I S D<br />
Banquete I S D<br />
Barbers Hill I S D<br />
Bartlett I S D<br />
Bastrop I S D<br />
Bay City I S D<br />
Beaumont I S D<br />
Beckville I S D<br />
Beeville I S D<br />
Bellevue I S D<br />
Bells I S D<br />
Bellville I S D<br />
Belton I S D<br />
Ben Bolt Palito I S D<br />
Benavides I S D<br />
Benjamin I S D<br />
Big Sandy I S D, Big Sandy<br />
Big Sandy I S D, Dallardsville<br />
Big Spring I S D<br />
Birdville I S D<br />
Bishop Cons I S D<br />
Blackwell I S D<br />
Blanco I S D<br />
Bland I S D<br />
Blanket I S D<br />
Bloomburg I S D<br />
Blooming Grove I S D<br />
Bloomington I S D<br />
Blue Ridge I S D<br />
Bluff Dale I S D<br />
Blum I S D<br />
Boerne I S D<br />
Boles I S D<br />
Boling I S D<br />
Bonham I S D<br />
Booker I S D<br />
Borden County I S D<br />
Borger I S D<br />
Bosqueville I S D<br />
Bovina I S D<br />
Bowie I S D<br />
Boyd I S D<br />
Boys Ranch I S D<br />
Brackett I S D<br />
Brady I S D<br />
Brazos I S D<br />
Brazosport I S D<br />
Breckenridge I S D<br />
Bremond I S D<br />
Brenham I S D<br />
Bridge City I S D<br />
Bridgeport I S D<br />
Broaddus I S D<br />
Brock I S D<br />
Bronte I S D<br />
Brookeland I S D<br />
Brooks County I S D<br />
Brookesmith I S D<br />
Brownfield I S D<br />
Brownsboro I S D<br />
Brownsville I S D<br />
Brownwood I S D<br />
Bruceville Eddy I S D<br />
Bryan I S D<br />
Bryson I S D<br />
Buckholts I S D<br />
Buena Vista I S D<br />
Buffalo I S D<br />
Bullard I S D<br />
Buna I S D<br />
Burkburnett I S D<br />
Burkeville I S D<br />
Burleson I S D<br />
Burnet Cons I S D<br />
Burton I S D<br />
Bushland I S D<br />
Byers I S D<br />
Bynum Cons I S D<br />
Caddo Mills I S D<br />
Calallen I S D<br />
Caldwell I S D<br />
Calhoun County I S D<br />
Callisburg I S D<br />
Calvert I S D<br />
Cameron I S D<br />
Campbell I S D<br />
Canadian I S D<br />
Canton I S D<br />
Canutillo ISD<br />
Canyon I S D<br />
Carlisle I S D<br />
Carrizo Springs C I S D<br />
Carroll I S D<br />
Carrollton Farmers Branch I S D<br />
Carthage I S D<br />
Castleberry I S D<br />
Cayuga I S D<br />
Cedar Hill I S D<br />
Celeste I S D<br />
Celina I S D<br />
Center I S D<br />
Center Point I S D<br />
Centerville I S D, Centerville<br />
Centerville I S D, Groveton<br />
Central I S D<br />
Central Heights I S D<br />
Channelview I S D<br />
Channing I S D<br />
Chapel Hill I S D, Mt. Pleasant<br />
Chapel Hill I S D, Tyler<br />
Charlotte I S D<br />
Cherokee I S D<br />
Chester I S D<br />
Chico I S D<br />
Childress I S D<br />
Chillicothe I S D<br />
Chilton I S D<br />
China Spring I S D<br />
Chireno I S D<br />
Chisum I S D<br />
Christoval I S D<br />
Cisco I S D<br />
City View I S D<br />
Clarendon Cons I S D<br />
Clarksville I S D<br />
144 STATISTICAL SECTION
TEACHER RETIREMENT SYSTEM OF TEXAS COMPREHENSIVE ANNUAL FINANCIAL REPORT <strong>2011</strong><br />
Listing of Participating <strong>Report</strong>ing Entities<br />
(Continued)<br />
Claude I S D<br />
Clear Creek I S D<br />
Cleburne I S D<br />
Cleveland I S D<br />
Clifton I S D<br />
Clint I S D<br />
Clyde I S D<br />
Coahoma I S D<br />
Coldspring Oakhurst I S D<br />
Coleman I S D<br />
College Station I S D<br />
Collinsville I S D<br />
Colmesneil I S D<br />
Colorado I S D<br />
Columbia Brazoria I S D<br />
Columbus I S D<br />
Comal I S D<br />
Comanche I S D<br />
Comfort I S D<br />
Commerce I S D<br />
Community I S D<br />
Como Pickton I S D<br />
Comstock I S D<br />
Connally Cons I S D<br />
Conroe I S D<br />
Coolidge I S D<br />
Cooper I S D<br />
Coppell I S D<br />
Copperas Cove I S D<br />
Corpus Christi I S D<br />
Corrigan Camden C I S D<br />
Corsicana I S D<br />
Cotton Center I S D<br />
Cotulla I S D<br />
Coupland I S D<br />
Covington I S D<br />
Crandall I S D<br />
Crane I S D<br />
Cranfills Gap I S D<br />
Crawford I S D<br />
Crockett I S D<br />
Crockett Cty School Dist<br />
Crosby I S D<br />
Crosbyton Cons I S D<br />
Cross Plains I S D<br />
Cross Roads I S D<br />
Crowell Cons I S D<br />
Crowley I S D<br />
Crystal City I S D<br />
Cuero I S D<br />
Culberson County-Allamoore I S D<br />
Cumby I S D<br />
Cushing I S D<br />
Cypress Fairbanks I S D<br />
D Hanis I S D<br />
Daingerfield I S D<br />
Dalhart I S D<br />
Dallas I S D<br />
Damon I S D<br />
Danbury I S D<br />
Darrouzett I S D<br />
Dawson I S D, Dawson<br />
Dawson I S D, Welch<br />
Dayton I S D<br />
De Kalb I S D<br />
De Leon I S D<br />
De Soto I S D<br />
Decatur I S D<br />
Deer Park I S D<br />
Del Valle I S D<br />
Dell City I S D<br />
Denison I S D<br />
Denton I S D<br />
Denver City I S D<br />
Detroit I S D<br />
Devers I S D<br />
Devine I S D<br />
Dew I S D<br />
Deweyville I S D<br />
Diboll I S D<br />
Dickinson I S D<br />
Dilley I S D<br />
Dime Box I S D<br />
Dimmitt I S D<br />
Divide I S D<br />
Dodd City I S D<br />
Donna I S D<br />
Doss Cons C S D<br />
Douglass I S D<br />
Dripping Springs I S D<br />
Driscoll I S D<br />
Dublin I S D<br />
Dumas I S D<br />
Duncanville I S D<br />
Eagle Mount Saginaw I S D<br />
Eagle Pass I S D<br />
Eanes I S D<br />
Early I S D<br />
East Bernard I S D<br />
East Central I S D<br />
East Chambers I S D<br />
Eastland I S D<br />
Ector I S D<br />
Ector Cty I S D<br />
Edcouch Elsa I S D<br />
Eden C I S D<br />
Edgewood I S D, Edgewood<br />
Edgewood I S D, San Antonio<br />
Edinburg C I S D<br />
Edna I S D<br />
El Campo I S D<br />
El Paso I S D<br />
Electra I S D<br />
Elgin I S D<br />
Elkhart I S D<br />
Elysian Fields I S D<br />
Ennis I S D<br />
Era I S D<br />
Etoile I S D<br />
Eula I S D<br />
Eustace I S D<br />
Evadale I S D<br />
Evant I S D<br />
Everman I S D<br />
Excelsior I S D<br />
Ezzell I S D<br />
Fabens I S D<br />
Fairfield I S D<br />
Falls City I S D<br />
Fannindel I S D<br />
Farmersville I S D<br />
Farwell I S D<br />
Fayetteville I S D<br />
Ferris I S D<br />
Flatonia I S D<br />
Florence I S D<br />
Floresville I S D<br />
Flour Bluff I S D<br />
Floydada I S D<br />
Follett I S D<br />
Forestburg I S D<br />
Forney I S D<br />
Forsan I S D<br />
Fort Bend I S D<br />
Fort Davis I S D<br />
Fort Elliott Cons I S D<br />
Fort Hancock I S D<br />
Fort Sam Houston I S D<br />
Fort Stockton I S D<br />
Fort Worth I S D<br />
Franklin I S D<br />
Frankston I S D<br />
Fredericksburg I S D<br />
Freer I S D<br />
Frenship I S D<br />
Friendswood I S D<br />
Friona I S D<br />
Frisco I S D<br />
Frost I S D<br />
Fruitvale I S D<br />
Gainesville I S D<br />
Galena Park I S D<br />
Galveston I S D<br />
Ganado I S D<br />
Garland I S D<br />
Garner I S D<br />
Garrison I S D<br />
Gary I S D<br />
Gatesville I S D<br />
Gause I S D<br />
George West I S D<br />
Georgetown I S D<br />
Gholson I S D<br />
Giddings I S D<br />
Gilmer I S D<br />
Gladewater Cty Line I S D<br />
Glasscock County I S D<br />
Glen Rose I S D<br />
Godley I S D<br />
Goldburg I S D<br />
Goldthwaite I S D<br />
Goliad I S D<br />
Gonzales I S D<br />
Goodrich I S D<br />
Goose Creek I S D<br />
Gordon I S D<br />
Gorman I S D<br />
Grady I S D<br />
Graford I S D<br />
Graham I S D<br />
Granbury I S D<br />
Grand Prairie I S D<br />
Grand Saline I S D<br />
Grandfalls Royalty I S D<br />
Grandview I S D<br />
Grandview Hopkins I S D<br />
Granger I S D<br />
Grape Creek I S D<br />
Grapeland I S D<br />
Grapevine Colleyville I S D<br />
Greenville I S D<br />
Greenwood I S D<br />
Gregory Portland C I S D<br />
Groesbeck I S D<br />
Groom I S D<br />
Groveton I S D<br />
Gruver I S D<br />
Gunter I S D<br />
Gustine I S D<br />
Guthrie C S D<br />
Hale Center I S D<br />
Hallettsville I S D<br />
Hallsburg I S D<br />
Hallsville I S D<br />
Hamilton I S D<br />
Hamlin I S D<br />
Hamshire Fannett I S D<br />
Happy I S D<br />
Hardin I S D<br />
Hardin Jefferson I S D<br />
Harlandale I S D<br />
Harleton I S D<br />
Harlingen I S D<br />
Harmony I S D<br />
Harper I S D<br />
Harrold I S D<br />
Hart I S D<br />
Hartley I S D<br />
Harts Bluff I S D<br />
Haskell C I S D<br />
Hawkins I S D<br />
Hawley I S D<br />
Hays Cons I S D<br />
Hearne I S D<br />
Hedley I S D<br />
Hemphill I S D<br />
Hempstead I S D<br />
Henderson I S D<br />
Henrietta I S D<br />
Hereford I S D<br />
Hermleigh I S D<br />
Hico I S D<br />
Hidalgo I S D<br />
Higgins I S D<br />
High Island I S D<br />
Highland I S D<br />
Highland Park I S D, Amarillo<br />
Highland Park I S D, Dallas<br />
Hillsboro I S D<br />
Hitchcock I S D<br />
Holland I S D<br />
Holliday I S D<br />
Hondo I S D<br />
Honey Grove I S D<br />
Hooks I S D<br />
Houston I S D<br />
Howe I S D<br />
Hubbard I S D, Hubbard<br />
Hubbard I S D, New Boston<br />
Huckabay I S D<br />
Hudson I S D<br />
Huffman I S D<br />
Hughes Springs I S D<br />
Hull Daisetta I S D<br />
Humble I S D<br />
Hunt I S D<br />
Huntington I S D<br />
Huntsville I S D<br />
Hurst Euless I S D<br />
Hutto I S D<br />
Idalou I S D<br />
Industrial I S D<br />
Ingleside I S D<br />
Ingram I S D<br />
Iola I S D<br />
Iowa Park Cons I S D<br />
Ira I S D<br />
Iraan Sheffield I S D<br />
Iredell I S D<br />
Irion County I S D<br />
Irving I S D<br />
Italy I S D<br />
Itasca I S D<br />
Jacksboro I S D<br />
Jacksonville I S D<br />
Jarrell I S D<br />
Jasper I S D<br />
Jayton-Girard I S D<br />
Jefferson I S D<br />
Jim Hogg County I S D<br />
Jim Ned Cons I S D<br />
Joaquin I S D<br />
Johnson City I S D<br />
Jonesboro I S D<br />
Joshua I S D<br />
Jourdanton I S D<br />
Judson I S D<br />
Junction I S D<br />
Karnack I S D<br />
Karnes City I S D<br />
STATISTICAL SECTION<br />
145
TEACHER RETIREMENT SYSTEM OF TEXAS COMPREHENSIVE ANNUAL FINANCIAL REPORT <strong>2011</strong><br />
(Continued)<br />
Listing of Participating <strong>Report</strong>ing Entities<br />
Katy I S D<br />
Kaufman I S D<br />
Keene I S D<br />
Keller I S D<br />
Kelton I S D<br />
Kemp I S D<br />
Kenedy I S D<br />
Kenedy County School Dist<br />
Kennard I S D<br />
Kennedale I S D<br />
Kerens I S D<br />
Kermit I S D<br />
Kerrville I S D<br />
Kilgore I S D<br />
Killeen I S D<br />
Kingsville I S D<br />
Kirbyville Cons I S D<br />
Klein I S D<br />
Klondike I S D<br />
Knippa I S D<br />
Knox City O Brien C I S D<br />
Kopperl I S D<br />
Kountze I S D<br />
Kress I S D<br />
Krum I S D<br />
La Feria I S D<br />
La Gloria I S D<br />
La Grange I S D<br />
La Joya I S D<br />
La Marque I S D<br />
La Porte I S D<br />
La Poyner I S D<br />
La Pryor I S D<br />
La Vega I S D<br />
La Vernia I S D<br />
La Villa I S D<br />
Lackland I S D<br />
Lago Vista I S D<br />
Lake Dallas I S D<br />
Lake Travis I S D<br />
Lake Worth I S D<br />
Lamar Cons I S D<br />
Lamesa I S D<br />
Lampasas I S D<br />
Lancaster I S D<br />
Laneville I S D<br />
Laredo I S D<br />
Lasara I S D<br />
Latexo I S D<br />
Lazbuddie I S D<br />
Leakey I S D<br />
Leander I S D<br />
Leary I S D<br />
Lefors I S D<br />
Leggett I S D<br />
Leon I S D<br />
Leonard I S D<br />
Levelland I S D<br />
Leveretts Chapel I S D<br />
Lewisville I S D<br />
Lexington I S D<br />
Liberty I S D<br />
Liberty Eylau I S D<br />
Liberty Hill I S D<br />
Lindale I S D<br />
Linden Kildare Cons I S D<br />
Lindsay I S D<br />
Lingleville I S D<br />
Lipan I S D<br />
Little Elm I S D<br />
Littlefield I S D<br />
Livingston I S D<br />
Llano I S D<br />
Lockhart I S D<br />
Lockney I S D<br />
Lohn I S D<br />
Lometa I S D<br />
London I S D<br />
Lone Oak I S D<br />
Longview I S D<br />
Loop I S D<br />
Loraine I S D<br />
Lorena I S D<br />
Lorenzo Cons I S D<br />
Los Fresnos Cons I S D<br />
Louise I S D<br />
Lovejoy I S D<br />
Lovelady I S D<br />
Ltle Cyprs Mrcvle C I S D<br />
Lubbock I S D<br />
Lubbock Cooper I S D<br />
Lueders Avoca I S D<br />
Lufkin I S D<br />
Luling I S D<br />
Lumberton I S D<br />
Lyford Cons I S D<br />
Lytle I S D<br />
Mabank I S D<br />
Madisonville Cons I S D<br />
Magnolia I S D<br />
Malakoff I S D<br />
Malone I S D<br />
Malta I S D<br />
Manor I S D<br />
Mansfield I S D<br />
Marathon I S D<br />
Marble Falls I S D<br />
Marfa I S D<br />
Marion I S D<br />
Marlin I S D<br />
Marshall I S D<br />
Mart I S D<br />
Martins Mill I S D<br />
Martinsville I S D<br />
Mason I S D<br />
Matagorda I S D<br />
Mathis I S D<br />
Maud I S D<br />
May I S D<br />
Maypearl I S D<br />
Mc Allen I S D<br />
Mc Camey I S D<br />
Mc Dade I S D<br />
Mc Gregor I S D<br />
Mc Kinney I S D<br />
Mc Lean I S D<br />
Mc Leod I S D<br />
Mc Mullen County I S D<br />
Meadow I S D<br />
Medina I S D<br />
Medina Valley I S D<br />
Melissa I S D<br />
Memphis I S D<br />
Menard I S D<br />
Mercedes I S D<br />
Meridian I S D<br />
Merkel I S D<br />
Mesquite I S D<br />
Mexia I S D<br />
Meyersville I S D<br />
Miami I S D<br />
Midland I S D<br />
Midlothian I S D<br />
Midway I S D, Henrietta<br />
Midway I S D, Waco<br />
Milano I S D<br />
Mildred I S D<br />
Miles I S D<br />
Milford I S D<br />
Miller Grove I S D<br />
Millsap I S D<br />
Mineola I S D<br />
Mineral Wells I S D<br />
Mission Cons I S D<br />
Monahans Wickett I S D<br />
Montague I S D<br />
Monte Alto I S D<br />
Montgomery I S D<br />
Moody I S D<br />
Moran I S D<br />
Morgan I S D<br />
Morgan Mill I S D<br />
Morton I S D<br />
Motley County I S D<br />
Moulton I S D<br />
Mount Calm I S D<br />
Mount Enterprise I S D<br />
Mount Pleasant I S D<br />
Mount Vernon I S D<br />
Muenster I S D<br />
Muleshoe I S D<br />
Mullin I S D<br />
Mumford I S D<br />
Munday I S D<br />
Murchison I S D<br />
Nacogdoches I S D<br />
Natalia I S D<br />
Navarro I S D<br />
Navasota I S D<br />
Nazareth I S D<br />
Neches I S D<br />
Nederland I S D<br />
Needville I S D<br />
New Boston I S D<br />
New Braunfels I S D<br />
New Caney I S D<br />
New Deal I S D<br />
New Diana I S D<br />
New Home I S D<br />
New Summerfield I S D<br />
New Waverly I S D<br />
Newcastle I S D<br />
Newton I S D<br />
Nixon Smiley C I S D<br />
Nocona I S D<br />
Nordheim I S D<br />
Normangee I S D<br />
North East I S D<br />
North Forest I S D<br />
North Hopkins I S D<br />
North Lamar I S D<br />
North Zulch I S D<br />
Northside I S D, San Antonio<br />
Northside I S D, Vernon<br />
Northwest I S D<br />
Novice I S D<br />
Nueces Canyon Cons I S D<br />
Nursery I S D<br />
O Donnell I S D<br />
Oakwood I S D<br />
Odem Edroy I S D<br />
Oglesby I S D<br />
Olfen I S D<br />
Olney I S D<br />
Olton I S D<br />
Onalaska I S D<br />
Orange Grove I S D<br />
Orangefield I S D<br />
Ore City I S D<br />
Overton I S D<br />
Paducah I S D<br />
Paint Creek I S D<br />
Paint Rock I S D<br />
Palacios I S D<br />
Palestine I S D<br />
Palmer I S D<br />
Palo Pinto I S D<br />
Pampa I S D<br />
Panhandle I S D<br />
Panther Creek Cons I S D<br />
Paradise I S D<br />
Paris I S D<br />
Pasadena I S D<br />
Patton Springs I S D<br />
Pawnee I S D<br />
Pearland I S D<br />
Pearsall I S D<br />
Peaster I S D<br />
Pecos Barstow Toyah I S D<br />
Penelope I S D<br />
Perrin Whitt Cons I S D<br />
Perryton I S D<br />
Petersburg I S D<br />
Petrolia I S D<br />
Pettus I S D<br />
Pewitt Cons I S D<br />
Pflugerville I S D<br />
Pharr San Juan Alamo I S D<br />
Pilot Point I S D<br />
Pine Tree I S D<br />
Pittsburg I S D<br />
Plains I S D<br />
Plainview I S D<br />
Plano I S D<br />
Pleasant Grove I S D<br />
Pleasanton I S D<br />
Plemons Stinnett Phillips C I S D<br />
Point Isabel I S D<br />
Ponder I S D<br />
Poolville I S D<br />
Port Aransas I S D<br />
Port Arthur I S D<br />
Port Neches Groves I S D<br />
Post I S D<br />
Poteet I S D<br />
Poth Cons I S D<br />
Pottsboro I S D<br />
Prairie Lea I S D<br />
Prairie Valley I S D<br />
Prairiland I S D<br />
Premont I S D<br />
Presidio I S D<br />
Priddy I S D<br />
Princeton I S D<br />
Pringle Morse Cons I S D<br />
Progreso I S D<br />
Prosper I S D<br />
Quanah I S D<br />
Queen City I S D<br />
Quinlan I S D<br />
Quitman I S D<br />
Rains I S D<br />
Ralls I S D<br />
Ramirez Common S D<br />
Randolph Field I S D<br />
Ranger I S D<br />
Rankin I S D<br />
Raymondville I S D<br />
Reagan County I S D<br />
Red Lick I S D<br />
Red Oak I S D<br />
Redwater I S D<br />
Refugio I S D<br />
Ricardo I S D<br />
Rice I S D<br />
Rice Cons I S D<br />
Richards I S D<br />
Richardson I S D<br />
Richland Springs I S D<br />
Riesel I S D<br />
146 STATISTICAL SECTION
TEACHER RETIREMENT SYSTEM OF TEXAS COMPREHENSIVE ANNUAL FINANCIAL REPORT <strong>2011</strong><br />
Listing of Participating <strong>Report</strong>ing Entities<br />
(Continued)<br />
Rio Grande City C I S D<br />
Rio Hondo I S D<br />
Rio Vista I S D<br />
Rising Star I S D<br />
River Road I S D<br />
Rivercrest ISD<br />
Riviera I S D<br />
Robert Lee I S D<br />
Robinson I S D<br />
Robstown I S D<br />
Roby C I S D<br />
Rochelle I S D<br />
Rockdale I S D<br />
Rocksprings I S D<br />
Rockwall I S D<br />
Rogers I S D<br />
Roma I S D<br />
Roosevelt I S D<br />
Ropes I S D<br />
Roscoe I S D<br />
Rosebud Lott Cons I S D<br />
Rotan I S D<br />
Round Rock I S D<br />
Round Top Carmine I S D<br />
Roxton I S D<br />
Royal I S D<br />
Royse City I S D<br />
Rule I S D<br />
Runge I S D<br />
Rusk ISD<br />
S & S Cons I S D<br />
Sabinal I S D<br />
Sabine I S D<br />
Sabine Pass I S D<br />
Saint Jo I S D<br />
Salado I S D<br />
Saltillo I S D<br />
Sam Rayburn Cons I S D<br />
Samnorwood I S D<br />
San Angelo I S D<br />
San Antonio I S D<br />
San Augustine I S D<br />
San Benito Cons I S D<br />
San Diego I S D<br />
San Elizario I S D<br />
San Felipe Del Rio I S D<br />
San Isidro I S D<br />
San Marcos Cons I S D<br />
San Perlita I S D<br />
San Saba I S D<br />
San Vicente I S D<br />
Sands Cons I S D<br />
Sanford I S D<br />
Sanger I S D<br />
Santa Anna I S D<br />
Santa Fe I S D<br />
Santa Gertrudis I S D<br />
Santa Maria I S D<br />
Santa Rosa I S D<br />
Santo I S D<br />
Savoy I S D<br />
Schertz Cibolo I S D<br />
Schleicher Cty I S D<br />
Schulenburg I S D<br />
Scurry Rosser I S D<br />
Seagraves I S D<br />
Sealy I S D<br />
Seguin I S D<br />
Seminole Public Schools<br />
Seymour I S D<br />
Shallowater I S D<br />
Shamrock I S D<br />
Sharyland I S D<br />
Shelbyville I S D<br />
Sheldon I S D<br />
Shepherd I S D<br />
Sherman I S D<br />
Shiner I S D<br />
Sidney I S D<br />
Sierra Blanca I S D<br />
Silsbee I S D<br />
Silverton I S D<br />
Simms I S D<br />
Sinton I S D<br />
Sivells Bend I S D<br />
Skidmore Tynan I S D<br />
Slaton I S D<br />
Slidell I S D<br />
Slocum I S D<br />
Smithville I S D<br />
Smyer I S D<br />
Snook I S D<br />
Snyder I S D<br />
Socorro I S D<br />
Somerset I S D<br />
Somerville I S D<br />
Sonora I S D<br />
South San Antonio I S D<br />
South Texas I S D<br />
Southland I S D<br />
Southside I S D<br />
Southwest I S D<br />
Spearman I S D<br />
Splendora I S D<br />
Spring I S D<br />
Spring Branch I S D<br />
Spring Creek I S D<br />
Spring Hill I S D<br />
Springlake Earth I S D<br />
Springtown I S D<br />
Spur I S D<br />
Spurger I S D<br />
Stafford Muncpl Sch Dist<br />
Stamford I S D<br />
Stanton I S D<br />
Star I S D<br />
Stephenville I S D<br />
Sterling City I S D<br />
Stockdale I S D<br />
Stratford I S D<br />
Strawn I S D<br />
Sudan I S D<br />
Sulphur Bluff I S D<br />
Sulphur Springs I S D<br />
Sundown I S D<br />
Sunnyvale I S D<br />
Sunray I S D<br />
Sweeny I S D<br />
Sweet Home I S D<br />
Sweetwater I S D<br />
Taft I S D<br />
Tahoka I S D<br />
Tarkington I S D<br />
Tatum I S D<br />
Taylor I S D<br />
Teague I S D<br />
Temple I S D<br />
Tenaha I S D--__<br />
Terlingua C S D<br />
Terrell I S D<br />
Terrell County I S D<br />
Texarkana I S D<br />
Texas City I S D<br />
Texhoma I S D<br />
Texline I S D<br />
Thorndale I S D<br />
Thrall I S D<br />
Three Rivers I S D<br />
Three Way I S D<br />
Throckmorton I S D<br />
Tidehaven I S D<br />
Timpson I S D<br />
Tioga I S D<br />
Tolar I S D<br />
Tom Bean I S D<br />
Tomball I S D<br />
Tornillo I S D<br />
Trent I S D<br />
Trenton I S D<br />
Trinidad I S D<br />
Trinity I S D<br />
Troup I S D<br />
Troy I S D<br />
Tulia I S D<br />
Tuloso Midway I S D<br />
Turkey Quitaque C I S D<br />
Tyler I S D<br />
Union Grove I S D<br />
Union Hill I S D<br />
United I S D<br />
Utopia I S D<br />
Uvalde Cons I S D<br />
Valentine I S D<br />
Valley Mills I S D<br />
Valley View I S D, Pharr<br />
Valley View I S D, Valley View<br />
Van I S D<br />
Van Alstyne I S D<br />
Van Vleck I S D<br />
Vega I S D<br />
Venus I S D<br />
Veribest I S D<br />
Vernon Cons I S D<br />
Victoria I S D<br />
Vidor I S D<br />
Vysehrad I S D<br />
Waco I S D<br />
Waelder I S D<br />
Walcott I S D<br />
Wall I S D<br />
Waller I S D<br />
Walnut Bend I S D<br />
Walnut Springs I S D<br />
Warren I S D<br />
Waskom I S D<br />
Water Valley I S D<br />
Waxahachie I S D<br />
Weatherford I S D<br />
Webb C I S D<br />
Weimar I S D<br />
Wellington I S D<br />
Wellman Union I S D<br />
Wells I S D<br />
Weslaco I S D<br />
West I S D<br />
West Hardin Cty C I S D<br />
West Orange Cove C I S D<br />
West Oso I S D<br />
West Rusk Cty Cons I S D<br />
West Sabine I S D<br />
Westbrook I S D<br />
Westhoff I S D<br />
Westphalia I S D<br />
Westwood I S D<br />
Wharton I S D<br />
Wheeler I S D<br />
White Deer I S D<br />
White Oak I S D<br />
White Settlement I S D<br />
Whiteface I S D<br />
Whitehouse I S D<br />
Whitesboro I S D<br />
Whitewright I S D<br />
Whitharral I S D<br />
Whitney I S D<br />
Wichita Falls I S D<br />
Wildorado I S D<br />
Willis I S D<br />
Wills Point I S D<br />
Wilson I S D<br />
Wimberley I S D<br />
Windham School District<br />
Windthorst I S D<br />
Winfield I S D<br />
Wink Loving Cons I S D<br />
Winnsboro I S D<br />
Winona I S D<br />
Winters I S D<br />
Woden I S D<br />
Wolfe City I S D<br />
Woodsboro I S D<br />
Woodson I S D<br />
Woodville I S D<br />
Wortham I S D<br />
Wylie I S D, Abilene<br />
Wylie I S D, Wylie<br />
Yantis I S D<br />
Yoakum I S D<br />
Yorktown I S D<br />
Ysleta I S D<br />
Zapata I S D<br />
Zavalla I S D<br />
Zephyr I S D<br />
Regional Service<br />
Centers<br />
Region 01 Ed Serv Center<br />
Region 02 Ed Serv Center<br />
Region 03 Ed Serv Center<br />
Region 04 Ed Serv Center<br />
Region 05 Ed Serv Center<br />
Region 06 Ed Serv Center<br />
Region 07 Ed Serv Center<br />
Region 08 Ed Serv Center<br />
Region 09 Ed Serv Center<br />
Region 10 Ed Serv Center<br />
Region 11 Ed Serv Center<br />
Region 12 Ed Serv Center<br />
Region 13 Ed Serv Center<br />
Region 14 Ed Serv Center<br />
Region 15 Ed Serv Center<br />
Region 16 Ed Serv Center<br />
Region 17 Ed Serv Center<br />
Region 18 Ed Serv Center<br />
Region 19 Ed Serv Center<br />
Region 20 Ed Serv Center<br />
Charter Schools<br />
A+ Academy<br />
Academy of Accelerated<br />
Academy of Careers and Tech<br />
Academy of Dallas<br />
Accelerated Int Academy<br />
Alief Montessori School<br />
ALPHA Charter School<br />
Alphonso Crutch’s Charter<br />
Ambassador’s Prep Academy<br />
American Inst of Learning<br />
Amigos Por Vida Charter<br />
Arlington Classics Acad<br />
Arrow Academy<br />
Austin Discovery School<br />
A W Brown Flwshp Chtr Sch<br />
Azleway Charter School<br />
Bay Area Charter School<br />
Beatrice Mayes Institute<br />
STATISTICAL SECTION<br />
147
TEACHER RETIREMENT SYSTEM OF TEXAS COMPREHENSIVE ANNUAL FINANCIAL REPORT <strong>2011</strong><br />
(Continued)<br />
Listing of Participating <strong>Report</strong>ing Entities<br />
Benji’s Special Educ Acad<br />
Bexar County Academy<br />
Big Springs Charter Sch<br />
Bob Hope School<br />
Brazos River Charter Sch<br />
Brazos School for Inquiry<br />
Bright Ideas Charter Sch<br />
Brooks Academy of Science<br />
& Engineering<br />
Burnham Wood Charter Sch<br />
Calvin Nelms Charter<br />
Cedars International Acad<br />
Chapel Hill Academy<br />
Children First Ac Houston<br />
Children First Ele Acad<br />
City Center-Health Careers<br />
Com Quest Academy<br />
Compass Academy<br />
Corpus Christi Montessori<br />
Charter School<br />
Crosstimbers Academy<br />
Cumberland Academy<br />
Dallas Can Academy<br />
Dallas Comm Charter Sch<br />
Dr. Garza-Gonzalez Ch Sch<br />
Draw Academy<br />
Eagle Advantage School<br />
East Fort Worth Montessori<br />
East Texas Charter School<br />
Eden Park Academy<br />
Education Center Int Acad<br />
El Paso Academy East<br />
Erath Excels! Academy<br />
Evolution Academy Charter<br />
Faith Family Acad Oak Cliff<br />
Faith Fam Acad Waxahachie<br />
Focus Learning Academy<br />
Ft Worth Acad Fine Arts<br />
Gabriel Tafolla Charter<br />
Gateway Academy<br />
Gateway Charter Academy<br />
George Gervin Academy<br />
George I Sanchez Charter, Houston<br />
George I Sanchez Charter, San Antonio<br />
Girls & Boys Prep Acad<br />
Golden Rule Charter School<br />
Gulf Coast Trades Center<br />
Hampton Preparatory<br />
Harmony School Academy, Brownsville<br />
Harmony School Academy, Laredo<br />
Harmony School of Excellence, Houston<br />
Harmony School of Science, Houston<br />
Harmony Science Academy, Austin<br />
Harmony Science Academy, El Paso<br />
Harmony Science Academy, Fort Worth<br />
Harmony Science Academy, Houston<br />
Harmony Science Academy, Lubbock<br />
Harmony Science Academy, San Antonio<br />
Harmony Science Academy, Waco<br />
Heights Academy<br />
Henry Ford Academy<br />
Higgs Carter King Academy<br />
Honors Academy<br />
Houston Alt Prep Charter<br />
Houston Gateway Charter<br />
Houston Hghts Learning Ac<br />
Idea Public Schools<br />
Inspired Vision Academy<br />
Jamie’s House Charter Sch<br />
Jean Massieu Academy<br />
John H.Wood Charter Sch<br />
Juan B. Galaviz Charter<br />
Jubilee Academic Center<br />
Katherine Anne Porter Sch<br />
K I P P Academy<br />
K I P P Aspire Academy<br />
K I P P Austin College<br />
K I P P Southeast Houston<br />
K I P P Truth Academy<br />
Koinonia Community<br />
Learning Academy<br />
La Academia de Estrellas<br />
La Amistad Academy<br />
Le Fe Preparatory School<br />
Leadership Prep School<br />
Life Charter School<br />
Lighthouse Charter School<br />
Mainland Prep Academy<br />
Manara Academy<br />
Meadowland Charter School<br />
Medical Center Charter<br />
Meridian World School<br />
Metro Charter Academy<br />
Meyer Park Elementary<br />
Mid Valley Academy<br />
Midland Academy<br />
N Houston H S Business<br />
New Frontiers Charter School<br />
Newman International Academy<br />
North Texas Elementary School<br />
of Arts<br />
Northwest Prep Academy<br />
Nova Charter School<br />
Nova Charter Southeast<br />
N Y O S Charter School<br />
Odyssey Academy<br />
One Stop Multiservice<br />
Orenda Charter School<br />
Outreach Word Academy<br />
Panola Charter School<br />
Paradigm Accelerated Sch<br />
Paso Del Norte Academy<br />
Peak Preparatory School<br />
Pegasus Charter School<br />
Phoenix Charter School<br />
Pineywoods Academy<br />
Por Vida Inc<br />
Premier Learning Academy<br />
Radiance Acad of Learning<br />
Ranch Academy<br />
Rapoport Academy<br />
Raul Yzaguirre School<br />
Reconciliation Scholar’s Academy<br />
Responsive Education Solutions<br />
Richard Milburn - Amarillo<br />
Richard Milburn - Corpus Christi<br />
Richard Milburn - Fort Worth<br />
Richard Milburn - Houston<br />
Richard Milburn - Killeen<br />
Richard Milburn - Odessa<br />
Ripley House Charter School<br />
Rise Academy<br />
S T A R Charter School<br />
San Antonio Prep Academy<br />
San Antonio Sch Inquiry<br />
San Antonio Tech Academy<br />
School of Excellence<br />
School of Science & TECH-Discovery -<br />
San Antonio<br />
School of Science & Technology -<br />
Corpus Christi<br />
School of Science & Technology -<br />
San Antonio<br />
Seashore Learning Ctr<br />
Seashore Middle Academy<br />
Ser-Ninos<br />
Shekinah Radiance Academy<br />
South Plains Academy<br />
Southwest High School<br />
Southwest Preparatory Sch<br />
St. Anthony School<br />
St. Mary’s Charter School<br />
Stepping Stones Charter Elementary<br />
Summit International Preparatory<br />
Technology Education Chtr<br />
T E K O A Academy<br />
Texas Empowerment Academy<br />
Texas Preparatory School<br />
Texas Serenity Academy<br />
The East Austin College Prep Academy<br />
The Education Center<br />
The Ehrhart School<br />
The Encino School<br />
The Legends Academy<br />
The North Hills School<br />
The Rhodes School<br />
TLC Academy - San Angelo<br />
T O V A S<br />
Transformative Charter<br />
Treetops International<br />
Trinity Basin Preparatory<br />
Trinity Charter School<br />
Two Dimensions Prep Acad<br />
Universal Academy<br />
Vanguard Academy<br />
Varnett Charter School<br />
Victory Prep Academy<br />
Vista del Futuro Charter School<br />
Waco Charter School<br />
Walipp Academy<br />
West Houston Charter<br />
Westlake Academy<br />
Williams Preparatory<br />
Winfree Academy Charter Schools<br />
Yes Preparatory Public Schools<br />
Zoe Learning Academy<br />
Other Educational<br />
Districts<br />
Anderson Cty Spc Ed Co Op<br />
Bowie County Sch Dist<br />
Dallas County School Dist<br />
Harris Cty Dept Education<br />
Parker County Co Op<br />
Other Entities<br />
Teacher Retirement System<br />
Texas Education Agency<br />
148 STATISTICAL SECTION
TEACHER RETIREMENT SYSTEM OF TEXAS COMPREHENSIVE ANNUAL FINANCIAL REPORT <strong>2011</strong><br />
BENEFITS SECTION<br />
BENEFITS SECTION<br />
149
TEACHER RETIREMENT SYSTEM OF TEXAS COMPREHENSIVE ANNUAL FINANCIAL REPORT <strong>2011</strong><br />
<strong>2011</strong> Changes in <strong>TRS</strong> Law<br />
S T A T E<br />
In fiscal year <strong>2011</strong>, the 82nd Texas Legislature, Regular Session,<br />
enacted several significant new laws affecting <strong>TRS</strong>.<br />
FUNDING, INTERIM STUDIES, AND OTHER<br />
GENERAL APPROPRIATIONS ACT PROVISIONS<br />
Under House Bill 1, the General Appropriations Act (GAA), the<br />
state contribution rate to the retirement plan was reduced from<br />
6.644 percent in the FY 2010-<strong>2011</strong> biennium to 6.0 percent of<br />
payroll for the first year of the 2012-2013 biennium. Effective<br />
September 1, 2012, the state contribution rate will increase<br />
to 6.4 percent for the second year of the biennium.<br />
The member contribution rate for the retirement plan remains at<br />
6.4 percent for both years of the biennium. The state contribution<br />
rate to <strong>TRS</strong>-Care remains at 1 percent effective September<br />
1, <strong>2011</strong> but is reduced to 0.5 percent effective September 1,<br />
2012 for the second year of the biennium. The active member<br />
contribution rate to <strong>TRS</strong>-Care and the participating employer<br />
rate remain unchanged.<br />
Several GAA riders are important to <strong>TRS</strong> participants:<br />
• <strong>TRS</strong> is required to conduct a study of <strong>TRS</strong>-Care and<br />
report to the legislature on potential changes to improve<br />
the program’s sustainability.<br />
• The legislature expressed its intent that <strong>TRS</strong> not increase<br />
retiree health insurance premiums for the 2012-2013<br />
biennium. At its June <strong>2011</strong> meeting, the <strong>TRS</strong> Board of<br />
Trustees considered updated financial information and<br />
left <strong>TRS</strong>-Care premiums unchanged for the <strong>2011</strong>-2012<br />
school year.<br />
• <strong>TRS</strong> is required to report to the legislature on the impact<br />
of potential changes to the pension plan, including<br />
retirement eligibility, final average salary, benefit multiplier,<br />
and the creation of a hybrid defined contribution/defined<br />
benefit retirement plan.<br />
• <strong>TRS</strong> is authorized to establish a pilot program for <strong>TRS</strong><br />
participants in the group health benefit programs to test<br />
alternatives to traditional fee-for-service payments.<br />
INVESTMENTS<br />
Under House Bill 1061, <strong>TRS</strong> is authorized to use derivatives in<br />
its investment portfolio and to use external managers to invest<br />
up to 30 percent of the <strong>TRS</strong> fund until September 1, 2019. <strong>TRS</strong><br />
is authorized to increase its allocation to hedge funds from five<br />
percent to 10 percent until September 1, 2019.<br />
PURCHASING SERVICE CREDIT<br />
Senate Bill 1668 makes significant changes to the cost of<br />
certain kinds of purchased service credit and makes other<br />
administrative adjustments.<br />
• To purchase out-of-state service credit, developmental<br />
leave service credit, and unreported service or compensation<br />
credit (including substitute service), the cost will<br />
increase to the actuarial cost of the additional benefit<br />
resulting from the credit.<br />
• To purchase withdrawn service credit, the member will<br />
be required to deposit the withdrawn amount plus a fee<br />
of eight percent (increased from six percent).<br />
• For withdrawn service, developmental leave, unreported<br />
service or compensation credit (including substitute service<br />
credit), an eligible member may purchase credit for eligible<br />
service rendered before September 1, <strong>2011</strong> at the old cost,<br />
if the credit is purchased before September 1, 2013, or<br />
an installment agreement is signed and received by <strong>TRS</strong><br />
before that date. For out-of-state service credit to be<br />
purchased at the old cost, the same September 1, 2013<br />
deadline applies, but the out-of-state service must have<br />
been rendered before January 1, 2006 by a person who<br />
was a member of <strong>TRS</strong> on December 31, 2005.<br />
• A person with unreported service or compensation,<br />
including substitute service, will be required to verify the<br />
service to <strong>TRS</strong> within five years of when it was rendered<br />
in order for it to be creditable. For service rendered before<br />
September 1, <strong>2011</strong>, the person will have until August 31,<br />
2016 to verify the service. The person will no longer be<br />
required, however, to purchase verified unreported service<br />
to receive retirement benefits.<br />
• For members with military service that qualifies as<br />
USERRA service (Uniformed Services Employment and<br />
Reemployment Rights Act of 1994), the service may be<br />
counted toward length of service requirements for <strong>TRS</strong><br />
benefit eligibility (but not benefit amount), even if the<br />
member does not purchase credit for the service.<br />
EMPLOYMENT AFTER RETIREMENT<br />
Senate Bill 1669 made substantial changes to employment<br />
after retirement restrictions.<br />
• Service retirees who retired before January 1, <strong>2011</strong><br />
may now work in Texas public education in any capacity<br />
without any loss of monthly annuities. Surcharge requirements<br />
for employers still apply to retirees who retired<br />
after September 1, 2005 and are working in <strong>TRS</strong>-eligible<br />
positions. Following enactment of the legislation, the <strong>TRS</strong><br />
Board of Trustees established new <strong>TRS</strong>-Care surcharge<br />
rates, effective September 1, <strong>2011</strong>.<br />
• Service retirees who retire after January 1, <strong>2011</strong> may<br />
work full time for as much as 12 months each school year<br />
without any loss of annuities only if they have a break in<br />
service of 12 full consecutive calendar months after retirement.<br />
Though the 12-month break need not immediately<br />
150 BENEFITS SECTION
TEACHER RETIREMENT SYSTEM OF TEXAS COMPREHENSIVE ANNUAL FINANCIAL REPORT <strong>2011</strong><br />
<strong>2011</strong> Changes in <strong>TRS</strong> Law<br />
follow retirement, a retiree will forfeit monthly annuities<br />
for months in which the retiree works full time until after a<br />
12-month break has occurred. The bill repeals the former<br />
exceptions that allowed service retirees to work on a<br />
full-time basis without loss of annuities in certain circumstances<br />
(i.e., the bill repeals the six-month exception,<br />
the bus driver exception, the principal/assistant principal<br />
exception, the acute shortage area exception, and the<br />
nurse faculty exception). Retirees who have not served a<br />
12-full-consecutive-calendar-month break in service after<br />
retirement may only work as substitutes or on a one-half<br />
time basis. Working full-time in the absence of the break<br />
in service of 12 full consecutive calendar months will result<br />
in the loss of the annuity for the month in which the<br />
full-time work occurs. Also, working in any capacity for a<br />
<strong>TRS</strong>-covered employer, including work as a substitute, will<br />
reset the computation of the required 12-full-consecutivecalendar-month<br />
break in service.<br />
STANDARDIZED SCHOOL YEAR<br />
Under House Bill 2561, starting with the 2012-2013 school<br />
year, all <strong>TRS</strong> members will use a standardized school year of<br />
September 1 through August 31 for <strong>TRS</strong> benefit purposes. This<br />
means that <strong>TRS</strong> service credit and creditable compensation will<br />
be determined on a September 1–August 31 basis.<br />
<strong>TRS</strong> ADMINISTRATION<br />
Senate Bill 1667 is a <strong>TRS</strong> omnibus bill that covers a range of<br />
administrative and benefit matters, including the following:<br />
• Service Credit not on Member’s <strong>Annual</strong> Statement.<br />
Members now must notify <strong>TRS</strong> in writing if eligible membership<br />
service is not shown as service credit on the member’s<br />
annual statement. To receive <strong>TRS</strong> credit for the missing<br />
service, the member must notify <strong>TRS</strong> within five years of<br />
when the service was rendered. The bill also provides a<br />
transition period for members who have service that was<br />
rendered more than five years before the bill takes effect<br />
on September 1, <strong>2011</strong>. A member who seeks to establish<br />
credit for service rendered before September 1, <strong>2011</strong>, but<br />
that is not credited on the annual statement must notify<br />
<strong>TRS</strong> in writing by August 31, 2016.<br />
• Qualified Domestic Relations Orders. For members<br />
and retirees who are subject to a Qualified Domestic Relations<br />
Order (QDRO), a court order that divides their <strong>TRS</strong><br />
retirement benefits (usually as a result of divorce), the bill<br />
repeals the requirement that the QDRO must state the parties’<br />
social security numbers. <strong>TRS</strong> may allow the parties<br />
to use an alternate method, acceptable to <strong>TRS</strong>, to verify<br />
their social security numbers. The bill also authorizes <strong>TRS</strong><br />
to establish a fee for administering a QDRO and to require<br />
use of the <strong>TRS</strong> model QDRO.<br />
• Amounts Owed to <strong>TRS</strong>. If a <strong>TRS</strong> beneficiary or other<br />
participant owes <strong>TRS</strong> money, <strong>TRS</strong> may deduct that amount<br />
from the participant’s <strong>TRS</strong> benefit payments.<br />
• Benefits not Payable to Person Causing Death of<br />
<strong>TRS</strong> Participant. The bill expands the grounds for making<br />
a person ineligible to receive benefits payable on the<br />
death of a member or annuitant to include being found not<br />
guilty of causing the death by reason of insanity or found<br />
incompetent to stand trial.<br />
• <strong>TRS</strong> Board of Trustee Nominating Elections. <strong>TRS</strong><br />
will have greater flexibility to use electronic voting in board<br />
nominating elections. Also, if fewer than three persons<br />
are nominated for a board position that has a nominating<br />
election, <strong>TRS</strong> may forward fewer than three names to the<br />
governor. The bill also authorizes the governor to appoint<br />
the trustee if no person is nominated.<br />
• Access to Criminal History Information. <strong>TRS</strong> is<br />
authorized to obtain criminal history information about<br />
applicants or employees.<br />
• Board Meeting Participation by Telephone Conference<br />
Call. A member of the <strong>TRS</strong> Board of Trustees may<br />
now participate in one board meeting per year by telephone<br />
conference call (not counting an emergency meeting).<br />
Additionally, House Bill 2120 modified the nominating election<br />
requirements for one position on the <strong>TRS</strong> Board of Trustees.<br />
The current higher education trustee position will now be an<br />
“at-large” seat. <strong>TRS</strong> retirees, members in public school districts,<br />
and members in higher education institutions may run for<br />
nomination to this trustee position in the next election (2017).<br />
The top three vote recipients’ names will be submitted to the<br />
governor for appointment.<br />
F E D E R A L<br />
On the federal level, <strong>TRS</strong> continued to monitor significant health<br />
care and financial reform laws enacted in earlier years, which<br />
have potential for significant effect on <strong>TRS</strong> programs.<br />
TAX LAWS, REGULATIONS, AND GUIDANCE<br />
Federal tax law changes often have significant impact on the<br />
<strong>TRS</strong> pension plan because, under state law, the <strong>TRS</strong> pension<br />
plan is intended to operate as a “qualified” retirement plan. A<br />
qualified plan must meet specific federal tax law requirements<br />
in order to enable member contributions to receive certain<br />
favorable tax treatments. Additionally, <strong>TRS</strong> is subject to federal<br />
tax law requirements regarding reporting and withholding of<br />
income paid to annuitants and other participants, as well as<br />
requirements applicable to investment activity.<br />
• Normal Retirement Age Regulations. In October<br />
2009, the Internal Revenue Service (IRS) issued Notice<br />
2009-86 to indicate that the IRS and the U.S. Treasury<br />
Department intend to extend the date by which govern-<br />
BENEFITS SECTION<br />
151
TEACHER RETIREMENT SYSTEM OF TEXAS COMPREHENSIVE ANNUAL FINANCIAL REPORT <strong>2011</strong><br />
<strong>2011</strong> Changes in <strong>TRS</strong> Law<br />
mental plans must comply with final regulations concerning<br />
distributions from a pension plan upon attainment of “normal<br />
retirement age.” The extension changed the effective date<br />
to plan years beginning on or after January 1, 2013, giving<br />
the IRS and the U.S. Treasury Department additional<br />
time to consider comments received with respect to the<br />
effect of the regulations on governmental plans. The final<br />
regulations continue to generate significant discussion<br />
in the governmental plan community due to concern<br />
that the regulations do not allow a definition of “normal<br />
retirement age” that is conditioned directly or indirectly<br />
on the completion of a stated number of years of service.<br />
The regulations appear to require normal retirement age<br />
to be stated in terms of age only. In governmental plans,<br />
including the <strong>TRS</strong> retirement plan, using years of service,<br />
or years of service in combination with age, is a common<br />
method of determining eligibility for unreduced service<br />
retirement benefits. The IRS could consider a distribution<br />
prior to its definition of “normal retirement age” to be an<br />
“in service” distribution, not permitted for qualified plans.<br />
The IRS continues to receive information from governmental<br />
plans about how the regulations will negatively impact<br />
their members, but to date it has not issued additional<br />
guidance to address plan concerns. <strong>TRS</strong> continues to<br />
monitor developments. In the absence of federal regulation<br />
changes to address governmental plan concerns, <strong>TRS</strong><br />
could be required to obtain state law amendments to its<br />
plan in order to comply with the current final regulations<br />
effective September 1, 2013, which is the starting date of<br />
the first <strong>TRS</strong> plan year after the January 1, 2013 effective<br />
date of the federal regulations.<br />
• Vendor Tax Withholding Regulations. In May <strong>2011</strong>,<br />
the IRS issued final regulations relating to Section 3402(t)<br />
of the Internal Revenue Code, which was added by Section<br />
511 of the Tax Increase Prevention and Reconciliation Act<br />
of 2005 (“TIPRA”, Public Law 109–222). Section 3402(t)<br />
(1) provides that the Government of the United States,<br />
every state, every political subdivision thereof, and every<br />
instrumentality of the foregoing (including multi-state<br />
agencies) making any payment to any person providing<br />
any property or services (including any payment made<br />
in connection with a government voucher or certificate<br />
program which functions as a payment for property or<br />
services) shall deduct and withhold from such payment a<br />
tax in an amount equal to three percent of such payment.<br />
Under the statute, section 3402(t) applies to payments<br />
made after December 31, 2010. As reported in <strong>TRS</strong>’ annual<br />
report for fiscal year 2009, the American Recovery and<br />
Reinvestment Act of 2009 (ARRA) delayed implementation<br />
of the withholding requirement for federal, state, and<br />
local government payers to apply to payments made after<br />
December 31, <strong>2011</strong>. In the final regulations, the effective<br />
date was again extended to apply the new requirements<br />
to payments made after December 31, 2012. This TIPRA<br />
withholding provision continues to draw negative reaction<br />
from state governments due to the administrative burdens<br />
and cost of compliance, but to date Congress has not<br />
repealed or substantially modified the requirement. <strong>TRS</strong><br />
continues to evaluate the extent to which this provision<br />
applies to its business operations and the possible effects.<br />
• Health Care. The Patient Protection and Affordable<br />
Care Act, signed into law on March 23, 2010, along with<br />
the Health Care and Education Affordability Reconciliation<br />
Act of 2010, signed into law on March 30, 2010 (together,<br />
the PPACA), embody the sweeping federal health care<br />
legislation that affects the <strong>TRS</strong>-Care and <strong>TRS</strong>-ActiveCare<br />
health benefit programs.<br />
During fiscal year <strong>2011</strong>, <strong>TRS</strong>-Care was accepted as an<br />
approved plan in the Early Retiree Reinsurance Program<br />
(the ERRP) established under the PPACA. Through the ERRP,<br />
<strong>TRS</strong>-Care has received approximately $70 million in federal<br />
funds. As long as funds remain available, the ERRP may<br />
reimburse participating plans for a substantial portion of<br />
the health care claims for retirees age 55 and older who<br />
are not eligible for Medicare, as well as claims for their<br />
spouses, surviving spouses, and dependents. <strong>TRS</strong>-Care<br />
has applied to receive additional funding under the ERRP<br />
during the next fiscal year.<br />
Also during fiscal year <strong>2011</strong>, <strong>TRS</strong> prepared for the implementation<br />
of various other provisions of the PPACA that<br />
will impact the health benefit plans administered by <strong>TRS</strong>.<br />
Four significant areas of impact are: (1) <strong>TRS</strong>-Care and<br />
<strong>TRS</strong>-ActiveCare no longer are permitted to “opt out” of<br />
the special enrollment provisions of the Health Insurance<br />
Portability and Accountability Act of 1996 (HIPAA); (2) both<br />
health plans are required to extend dependent coverage<br />
for adult children to age 26; (3) <strong>TRS</strong>-ActiveCare (but not<br />
<strong>TRS</strong>-Care) is required to provide first dollar coverage,<br />
without any cost sharing requirements, for preventive<br />
health services; and (4) both health plans are required to<br />
have an internal appeals process, followed by an external<br />
review process involving independent review organizations.<br />
152 BENEFITS SECTION
TEACHER RETIREMENT SYSTEM OF TEXAS COMPREHENSIVE ANNUAL FINANCIAL REPORT <strong>2011</strong><br />
Summary of Benefits<br />
The Teacher Retirement System of Texas (<strong>TRS</strong>) administers<br />
a defined benefit retirement plan that is a qualified pension<br />
trust under Section 401(a) of the Internal Revenue Code.<br />
The pension trust fund provides service and disability<br />
retirement, as well as death and survivor benefits, to eligible<br />
employees of public and higher education in Texas and their<br />
beneficiaries. A general information booklet, <strong>TRS</strong> Benefits<br />
Handbook, is provided to each <strong>TRS</strong> member and annuitant.<br />
Retirement benefits are financed by member, state, and<br />
employer contributions, and through investment earnings of<br />
the pension trust fund.<br />
<strong>TRS</strong> administers <strong>TRS</strong>-ActiveCare, the statewide health<br />
benefits program for eligible public education employees<br />
of participating entities. The program is financed by plan<br />
participant premium payments and investment income<br />
from the assets of the trust. In addition to <strong>TRS</strong>-ActiveCare,<br />
the system administers a separate trust that provides<br />
comprehensive health benefits coverage for retired<br />
members through <strong>TRS</strong>-Care. This program is financed by<br />
contributions from the state, active public school employees,<br />
reporting entities (employers), premium payments from plan<br />
participants, and investment income from the assets of the<br />
trust.<br />
<strong>TRS</strong> also administers an optional long-term care insurance<br />
program for eligible retirees and public school employees.<br />
Certain family members are also eligible. The plan is available<br />
on an enrollee-pay-all basis.<br />
R E T I R E M E N T P L A N<br />
B E N E F I T S<br />
This summary of benefits is based on statutory provisions of<br />
the plan effective for FY <strong>2011</strong>.<br />
The major retirement plan benefits are:<br />
SERVICE RETIREMENT<br />
Normal Retirement Eligibility - Age 65 with at least five<br />
years of credited service, or when the sum of member’s age<br />
and years of credited service (five years minimum) equals<br />
or exceeds 80 for members who established membership<br />
before September 1, 2007 and maintained membership until<br />
retirement.<br />
Age 65 with five years of credited service, or age 60 and<br />
the sum of member’s age and years of credited service (five<br />
years minimum) equals or exceeds 80 for members who<br />
established <strong>TRS</strong> membership on or after September 1, 2007.<br />
For grandfathered members who re-enter <strong>TRS</strong> on or after<br />
September 1, 2007, age 55 with at least 20 years of service<br />
credit and the sum of member’s age and years of credited<br />
service equals or exceeds 80.<br />
Standard Annuity - A monthly benefit payable at retirement<br />
throughout the retiree’s lifetime and calculated according to<br />
the statutory benefit formula.<br />
Benefit Formula - 2.3 percent times the average of the five<br />
highest annual creditable salaries times years of credited<br />
service equals an annual standard annuity. For members who<br />
are grandfathered, the three highest annual salaries are used.<br />
Minimum Benefit - $150 per month less any reduction for<br />
early age or optional annuity selection.<br />
Early Retirement Eligibility - Age 55 with at least five years of<br />
credited service, or any age below 50 with 30 or more years<br />
of credited service, provided the sum of the member’s age<br />
and years of credited service is less than 80 for members<br />
who established membership before September 1, 2007 and<br />
maintained membership until retirement.<br />
Age 55 with at least five years of credited service, age and<br />
credited service total 80 but less than age 60, or 30 years<br />
of credited service but less than age 60 for members who<br />
established <strong>TRS</strong> membership on or after September 1, 2007.<br />
Early Retirement Benefit - The standard annuity calculated<br />
under the benefit formula (or the minimum benefit, if<br />
applicable) reduced for early retirement. The amount of<br />
the reduction varies depending on age, years of service<br />
credit, and whether a member is grandfathered. The date<br />
a member joined <strong>TRS</strong> (before September 1, 2007, or on or<br />
after September 1, 2007), also can determine whether the<br />
standard annuity will be reduced.<br />
DISABILITY RETIREMENT<br />
Eligibility - Physical or mental disability precludes the member’s<br />
continued performance of current duties and the disability is<br />
probably permanent, as certified by the <strong>TRS</strong> Medical Board.<br />
Benefit - For disabled members with at least 10 years of<br />
credited service, the greater of the standard annuity unreduced<br />
for early age or $150 per month minimum benefit,<br />
less any reduction for the selection of an optional annuity.<br />
For disabled members with fewer than 10 years of credited<br />
service, $150 per month.<br />
Duration - For retirees with 10 or more years of credited<br />
service, payments continue for as long as the disability continues.<br />
For those with fewer than 10 years of credited service,<br />
payments continue for the life of the retiree, the duration of<br />
the disability, or the number of months of credited service,<br />
whichever is shorter.<br />
BENEFITS SECTION<br />
153
TEACHER RETIREMENT SYSTEM OF TEXAS COMPREHENSIVE ANNUAL FINANCIAL REPORT <strong>2011</strong><br />
Summary of Benefits<br />
Earnings Limit - Disability retirees who retired after August<br />
31, 2007 are subject to an annual limit on earnings from<br />
any employment. Excess earnings will cause benefits to be<br />
forfeited until such time as the excess earnings cease or are<br />
reduced to an allowable amount.<br />
ANNUITY PAYMENT OPTIONS<br />
All service and eligible disability retirees may select an<br />
optional form of payment that reduces the standard annuity<br />
by application of age-related actuarial reduction factors in<br />
order to continue payment to a beneficiary after the retiree’s<br />
death. Actuarial factors for disability retirees are different from<br />
those for service retirees because of different assumptions<br />
about life expectancy for the two groups. The available<br />
options include 100, 75, and 50 percent joint and survivor<br />
annuities, and five- and 10-year guaranteed period annuities.<br />
Selection of a 100 or 75 percent joint and survivor annuity<br />
may be unavailable to certain retirees based on the minimum<br />
distribution provisions of federal tax law.<br />
THE POP-UP PROVISION<br />
If a designated beneficiary under any of the joint and survivor<br />
options dies while the retiree is still living, the retiree’s future<br />
monthly payment increases to the amount of the standard<br />
annuity.<br />
PARTIAL LUMP SUM OPTION<br />
Under the Partial Lump Sum Option (PLSO), at the time of<br />
retirement, qualifying members may elect to receive an<br />
actuarially reduced service retirement annuity plus a cash<br />
lump sum distribution.<br />
Members may participate in the PLSO if they are eligible for<br />
service retirement, meet the Rule of 90 (age and years of<br />
service credit equal at least 90), are not participating in the<br />
Deferred Retirement Option Plan (DROP), and are not retiring<br />
with disability retirement benefits. Grandfathered members<br />
may elect PLSO at retirement if they are eligible for normal<br />
age service retirement, are not participating in DROP, and<br />
are not retiring with disability retirement benefits. Members<br />
retiring under the proportionate retirement program are not<br />
eligible to elect the PLSO.<br />
Partial lump sum distributions equal to 12, 24, or 36 months<br />
of a standard service retirement annuity may be selected.<br />
When a member selects this option, the monthly annuity<br />
is actuarially reduced to reflect the lump sum distribution.<br />
Flexible distribution options are available, including rollovers<br />
to another eligible retirement plan.<br />
DEFERRED RETIREMENT OPTION PLAN<br />
The Deferred Retirement Option Plan (DROP), which is closed<br />
to new participants, is a preretirement benefit provision for<br />
active members who are eligible for normal age service<br />
retirement and have at least 25 years of credited service.<br />
Members who elected to participate in DROP (before<br />
enrollment was closed effective December 31, 2005) chose<br />
to freeze their salary amounts and service credit used to<br />
calculate their retirement benefits and to have a portion of<br />
the standard annuity amount deposited into a DROP account<br />
while continuing to work for a <strong>TRS</strong>-covered employer. Interest<br />
on DROP accounts is credited at the rate of five percent per<br />
annum. Members are not considered to be retired while<br />
participating in DROP.<br />
Members who elected DROP chose to participate in 12-month<br />
increments for up to five years. During DROP participation,<br />
the member does not accrue additional service credit, nor<br />
is any compensation earned during DROP participation to be<br />
considered in calculating the standard annuity. Also, during<br />
DROP participation, the member’s statutory contributions to<br />
<strong>TRS</strong> continue; however, contributions are not credited to the<br />
member’s contribution account and are not subject to refund.<br />
Participation in DROP ends at the earliest of the expiration of<br />
the election period, retirement, or death. The accumulated<br />
DROP account may be distributed at the member’s election as<br />
a single lump sum or in monthly or yearly installments covering<br />
five or 10 years; distributions commence at retirement or in<br />
the event the member dies before retiring, at the member’s<br />
death. Eligible distributions may be rolled over to another<br />
eligible retirement plan.<br />
MINIMUM SERVICE CREDIT REQUIRED FOR<br />
SERVICE RETIREMENT BENEFITS<br />
Under current law, a member who has completed at least<br />
five years of credited service has earned a right to service<br />
retirement benefits after reaching eligible retirement age,<br />
provided that the member’s accumulated contributions are<br />
not withdrawn from the system. An eligible member must<br />
apply for benefits and meet other requirements, such as<br />
termination of Texas public education employment, in order<br />
to begin receiving benefits.<br />
DEATH AND SURVIVOR BENEFITS<br />
Active Members - The beneficiary of an active member may<br />
elect to receive one of the following benefits in the event of<br />
the member’s death before retirement, if the member dies<br />
during a school year in which the member performed service<br />
or if the member dies while performing qualified military<br />
service as defined by applicable federal law. These benefits<br />
also are available due to death when the member is absent<br />
from service as described by law, such as when the absence<br />
is due to sickness, accident, or other involuntary cause or<br />
154 BENEFITS SECTION
TEACHER RETIREMENT SYSTEM OF TEXAS COMPREHENSIVE ANNUAL FINANCIAL REPORT <strong>2011</strong><br />
Summary of Benefits<br />
when the member is within five years of being eligible to<br />
retire when leaving employment:<br />
1. A lump sum payment equal to twice the member’s<br />
annual compensation or $80,000, whichever is less.<br />
2. Sixty monthly payments equal to the member’s standard<br />
annuity without reduction for early age, provided<br />
the member had at least five years of service credit at<br />
the time of death.<br />
3. For a sole beneficiary, lifetime payments equal to<br />
a 100 percent joint and survivor annuity, provided the<br />
member had at least five years of service credit subject<br />
to any reduction applicable for early age.<br />
4. An amount equal to a return of the member’s contributions<br />
with accumulated interest.<br />
5. Survivor benefits of $2,500 lump sum payment<br />
plus a monthly benefit. For example, $350 per month<br />
to a beneficiary spouse with minor children, continuing<br />
until the youngest child reaches age 18. At age 65, the<br />
spouse would begin receiving $250 per month for life.<br />
In addition to these five options, a lump sum death benefit<br />
of $160,000 is available if the active member is employed in<br />
a <strong>TRS</strong>-covered position and dies as the result of a physical<br />
assault during the performance of the employee’s regular<br />
job duties.<br />
Also, the DROP beneficiary of a DROP participant will receive<br />
the accumulated DROP account balance, payable as a lump<br />
sum or in periodic installments.<br />
Retirees - In addition to any joint and survivor or guaranteed<br />
period annuity that may be payable under an optional form<br />
of payment a retiree elected, the beneficiary of a service or<br />
disability retiree is entitled to a $10,000 lump sum payment.<br />
In certain circumstances, eligible survivors may select alternate<br />
payment options in lieu of the lump sum benefit. The<br />
alternate payment options include a lump sum payment of<br />
$2,500 and an applicable monthly survivor benefit payment.<br />
If total payments made before death to a retiree and, when<br />
applicable, to a beneficiary for an optional service retirement<br />
annuity are less than accumulated contributions at retirement,<br />
an amount equal to the remainder is paid to the beneficiary<br />
or as otherwise provided by law. Should a retiree die prior to<br />
receiving all PLSO payments that are due, <strong>TRS</strong> will pay any<br />
remaining PLSO payments in a single lump sum payment to<br />
the beneficiary. If the retiree participated in DROP and died<br />
before receiving all DROP distributions, any unpaid DROP payments<br />
are paid to the beneficiary designated by the retiree.<br />
GRANDFATHER PROVISIONS<br />
A person who, as a member, met any one of the following<br />
criteria on or before August 31, 2005, is grandfathered under<br />
plan provisions repealed with respect to non-grandfathered<br />
members:<br />
• the member was at least 50 years old, or<br />
• the member’s age and years of service credit equaled<br />
at least 70 (“Rule of 70”), or<br />
• the member had at least 25 years of service credit<br />
Members who are grandfathered will have their benefits<br />
determined in the following manner:<br />
• Final Average Salary at retirement will be determined<br />
by the highest three years (instead of five<br />
years) of salary.<br />
• Preservation of certain retirement reduction<br />
factors means that members age 55 or older with 20<br />
to 24 years of credited service who take early retirement<br />
will receive a lesser reduction to their annuities than<br />
those members who are not grandfathered.<br />
• Partial Lump Sum Option eligibility will require<br />
either age 65 with at least five years of service credit,<br />
or a combined age plus years of credited service that<br />
equals at least 80 (“Rule of 80”) instead of 90.<br />
H E A L T H B E N E F I TS<br />
The major health benefits and long-term care provisions are:<br />
HEALTH BENEFITS FOR ACTIVE PUBLIC<br />
SCHOOL EMPLOYEES<br />
<strong>TRS</strong>-ActiveCare, the statewide health benefits program<br />
for employees of school districts, open enrollment charter<br />
schools, regional education service centers, and other<br />
educational districts whose employees are members of<br />
<strong>TRS</strong>, went into effect on September 1, 2002. The program<br />
initially addressed the most critical areas of the state with<br />
regard to availability and affordability of health benefits<br />
for public school employees and therefore focused on<br />
smaller districts. The program has now been expanded to<br />
include larger school districts and more than 1,118 entities<br />
participated in the program in fiscal year <strong>2011</strong>. Employees<br />
of participating entities can choose from four preferred<br />
provider organization plans, and employees of certain areas<br />
also have the option of choosing coverage under a health<br />
maintenance organization.<br />
BENEFITS SECTION<br />
155
TEACHER RETIREMENT SYSTEM OF TEXAS COMPREHENSIVE ANNUAL FINANCIAL REPORT <strong>2011</strong><br />
Summary of Benefits<br />
RETIREE HEALTH COVERAGE<br />
The program under the Texas Public School Retired Employees<br />
Group Benefits Act, known as <strong>TRS</strong>-Care, makes available a<br />
basic level of health coverage without cost to eligible <strong>TRS</strong><br />
public school retirees. Eligible retirees and their eligible<br />
dependents may pay premiums and participate in one of<br />
two plans of more comprehensive benefits and coverage.<br />
For information on <strong>TRS</strong>-Care eligibility, please refer to the<br />
<strong>TRS</strong> website.<br />
LONG-TERM CARE INSURANCE PROGRAM<br />
Eligible active and retired members, their dependents, and<br />
certain other family members may participate in the <strong>TRS</strong><br />
long-term care insurance program. The plan pays benefits<br />
if the participant becomes unable to perform at least two<br />
activities of daily living without substantial assistance from<br />
another person. The plan also pays benefits as a result of<br />
a severe cognitive impairment that requires supervision or<br />
verbal direction from another person in order to protect the<br />
member or others from serious injury.<br />
156 BENEFITS SECTION
TEACHER RETIREMENT SYSTEM OF TEXAS COMPREHENSIVE ANNUAL FINANCIAL REPORT <strong>2011</strong><br />
Average Monthly Benefit<br />
* Before adjustment for the Partial Lump Sum Option, average original benefits were $1,755, $1,982, $2,298 and $2,440 for fiscal years 2000, 2005, 2010 and<br />
<strong>2011</strong>, respectively.<br />
** For each of the retirement years shown, number of service retirees currently receiving benefits.<br />
BENEFITS SECTION<br />
157
TEACHER RETIREMENT SYSTEM OF TEXAS COMPREHENSIVE ANNUAL FINANCIAL REPORT <strong>2011</strong><br />
Growth of the System<br />
Benefit payments during fiscal year <strong>2011</strong> totaled approximately<br />
$7.18 billion, an increase of $556 million from the<br />
previous year. As of August <strong>2011</strong>, the monthly annuity<br />
payroll had grown to approximately $568 million, and <strong>TRS</strong><br />
was paying benefits to 312,680 recipients.<br />
Service recipients include retirees and beneficiaries receiving<br />
continuing monthly annuity payments. Disability<br />
recipients are disabled members who are receiving continuing<br />
monthly disability payments. Survivor recipients are<br />
beneficiaries who have elected to receive death benefits<br />
in the form of monthly benefits. The number of retiree<br />
accounts increased by 16,189 during fiscal year <strong>2011</strong>.<br />
Of the current <strong>TRS</strong> member accounts, 847,847 (active<br />
contributing and deferred retirement option participants)<br />
were employed during fiscal year <strong>2011</strong> and made contributions<br />
to the system. The remaining 156,039 members are<br />
no longer employed by <strong>TRS</strong>-covered employers but have<br />
maintained their membership in <strong>TRS</strong> by leaving their contributions<br />
with the system. The number of current member<br />
accounts decreased by 303 during fiscal year <strong>2011</strong>.<br />
158 BENEFITS SECTION
Teacher Retirement System of Texas<br />
1000 Red River Street<br />
Austin, Texas 78701-2698<br />
(512) 542-6400<br />
1-800-223-8778<br />
www.trs.state.tx.us