njit-etd2003-032 - New Jersey Institute of Technology
njit-etd2003-032 - New Jersey Institute of Technology
njit-etd2003-032 - New Jersey Institute of Technology

Create successful ePaper yourself
Turn your PDF publications into a flip-book with our unique Google optimized e-Paper software.
27<br />
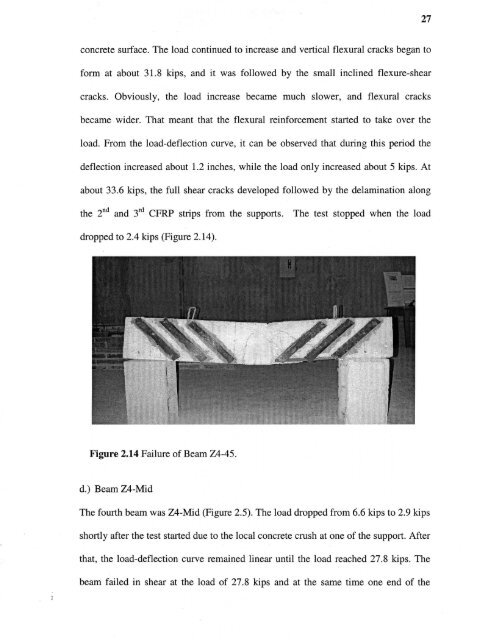
concrete surface. The load continued to increase and vertical flexural cracks began to<br />
form at about 31.8 kips, and it was followed by the small inclined flexure-shear<br />
cracks. Obviously, the load increase became much slower, and flexural cracks<br />
became wider. That meant that the flexural reinforcement started to take over the<br />
load. From the load-deflection curve, it can be observed that during this period the<br />
deflection increased about 1.2 inches, while the load only increased about 5 kips. At<br />
about 33.6 kips, the full shear cracks developed followed by the delamination along<br />
the 2 nd and 3 rd CFRP strips from the supports.<br />
The test stopped when the load<br />
dropped to 2.4 kips (Figure 2.14).<br />
Figure 2.14 Failure <strong>of</strong> Beam Z4-45.<br />
d.) Beam Z4-Mid<br />
The fourth beam was Z4-Mid (Figure 2.5). The load dropped from 6.6 kips to 2.9 kips<br />
shortl y after the test started due to the local concrete crush at one <strong>of</strong> the support. After<br />
that, the load-deflection curve remained linear until the load reached 27.8 kips. The<br />
beam failed in shear at the load <strong>of</strong> 27.8 kips and at the same time one end <strong>of</strong> the