pdf file - SEED Center for Data Farming - Naval Postgraduate School
pdf file - SEED Center for Data Farming - Naval Postgraduate School
pdf file - SEED Center for Data Farming - Naval Postgraduate School

You also want an ePaper? Increase the reach of your titles
YUMPU automatically turns print PDFs into web optimized ePapers that Google loves.
within the Army. The optimization model is solved in<br />
CPLEX. A number of iterations of the optimization are<br />
per<strong>for</strong>med in order to converge on an optimal solution. The<br />
final iteration of the optimizer produces a <strong>for</strong>ecast that is an<br />
integer value and resolves any final discrepancies in the ES<br />
projections. As the program is currently configured it takes<br />
approximately four hours to determine rates and factors and<br />
then 17 hours <strong>for</strong> the model to process through all 15<br />
simulation and optimizations iterations.<br />
In order to meet the objectives of the first research<br />
question, traditional experimental design techniques were<br />
followed. Design of Experiment (DOX) is a systematic way of<br />
exploring a problem where variations are present. The<br />
experiments are designed so they can conduct simultaneous<br />
examination of multiple factors and explore input factors and<br />
their relation to output responses. This allows researchers to<br />
identify, compare, and contrast current values while<br />
minimizing the number of experiments that need to be<br />
conducted. Practicing good experimental design techniques<br />
allows <strong>for</strong> the most cost-effective (in terms of computer<br />
processing time, money, etc.) collection of data <strong>for</strong> future<br />
analysis.<br />
Experimental design methodology was used by<br />
executing the steps below:<br />
Step 1: Identify input factors, output factor(s) (response<br />
variable)<br />
Step 2: Selected ranges that the input factors can take on<br />
Step 3: Identify a screening experiment that will allow the<br />
estimation of main effects and potentially two factor<br />
interactions<br />
Step 4: Run experiments<br />
Step 5: Analyze data from experiments<br />
Step 6: Based on results suggest an additional<br />
experiments required<br />
The input factors are the 52 coefficient values in the<br />
objective function, which are presented in Figure 1. The<br />
output response is OSD. The levels <strong>for</strong> each of the 52 input<br />
factors are also presented in Figure 1.<br />
A screening experiment allows the researcher to search<br />
<strong>for</strong> a subset of effects that have the most influence on the<br />
response variable. The goal of the first research objective in<br />
this work is to determine which of the 52 Objective Coefficient<br />
Variables were of importance in terms of the response<br />
variable, OSD. A Plackett-Burman design was used to study<br />
this. The Plackett-Burman is a non-regular factorial design<br />
with a low number of experimental requirements, which was<br />
important in the case of the ES model because of the long<br />
simulation run length. A non-regular design is one that<br />
involves partially confounded factors. The Plackett-Burman<br />
design created consisted of 56 runs.<br />
Results of the Plackett-Burman design as well as a small<br />
set of additional experiments that were conducted during<br />
IDFW 20 are presented in the next section.<br />
RESULTS<br />
This section presents the results of the initial<br />
experimental design and provides a brief description of the<br />
additional experiment and follow-on analysis conducted<br />
during the workshop.<br />
Figure 1: 52 Objective Coefficient Variables with minimum,<br />
maximum, and default values<br />
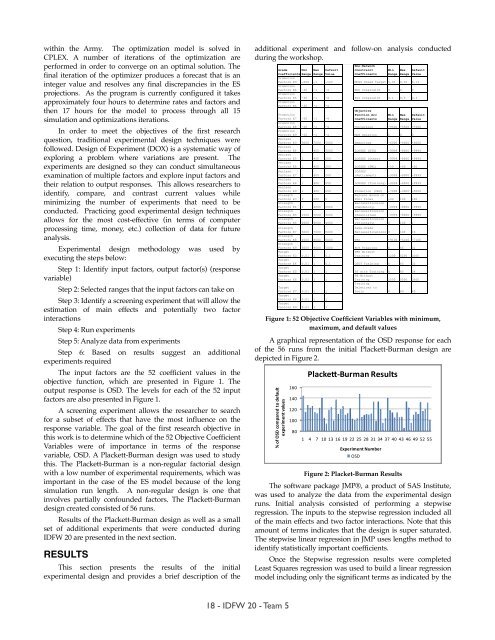
A graphical representation of the OSD response <strong>for</strong> each<br />
of the 56 runs from the initial Plackett-Burman design are<br />
depicted in Figure 2.<br />
Figure 2: Placket-Burman Results<br />
The software package JMP®, a product of SAS Institute,<br />
was used to analyze the data from the experimental design<br />
runs. Initial analysis consisted of per<strong>for</strong>ming a stepwise<br />
regression. The inputs to the stepwise regression included all<br />
of the main effects and two factor interactions. Note that this<br />
amount of terms indicates that the design is super saturated.<br />
The stepwise linear regression in JMP uses lengths method to<br />
identify statistically important coefficients.<br />
Once the Stepwise regression results were completed<br />
Least Squares regression was used to build a linear regression<br />
model including only the significant terms as indicated by the<br />
18 - IDFW 20 - Team 5