pdf file - SEED Center for Data Farming - Naval Postgraduate School
pdf file - SEED Center for Data Farming - Naval Postgraduate School
pdf file - SEED Center for Data Farming - Naval Postgraduate School

You also want an ePaper? Increase the reach of your titles
YUMPU automatically turns print PDFs into web optimized ePapers that Google loves.
Our initial design used a full factorial considering each<br />
of the six interventions at three levels (0, .5, 1) resulting in 729<br />
design points, or simulation model runs. We improved our<br />
design by using a Nearly Orthogonal Latin Hypercube<br />
(NOLH) model based on the <strong>SEED</strong> <strong>Center</strong> NOLH<br />
spreadsheet. 2 This provided a more robust sampling of our<br />
design space, with a reduction of 257 design points, however<br />
continued to expose some gaps based on the resulting<br />
combinations of intervention coverage inputs. We were also<br />
concerned that results showed possible dependencies<br />
between interventions-based sampling patterns. After<br />
conferring with <strong>SEED</strong> <strong>Center</strong> staff on how to more<br />
completely fill our design space, we used a rotated NOLH<br />
design, resulting in 1542 design points (simulation runs) and<br />
much richer sampling space represented by the right hand<br />
side design in figure 3. This final DOE allowed us a robust<br />
and efficient sampling plan to examine all combinations of<br />
intervention programs at many different levels (ranging from<br />
0…1).<br />
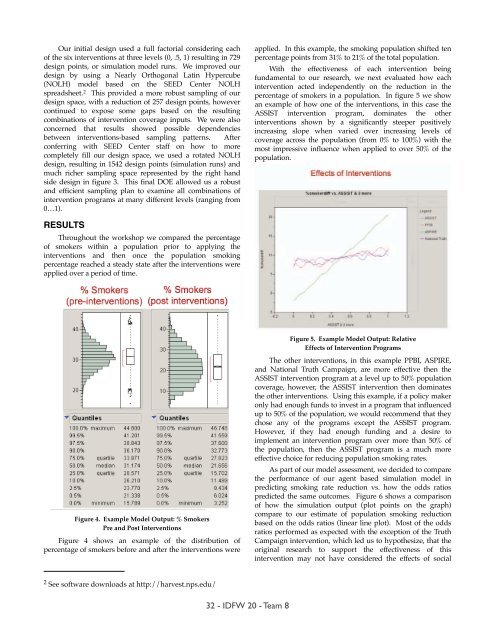
applied. In this example, the smoking population shifted ten<br />
percentage points from 31% to 21% of the total population.<br />
With the effectiveness of each intervention being<br />
fundamental to our research, we next evaluated how each<br />
intervention acted independently on the reduction in the<br />
percentage of smokers in a population. In figure 5 we show<br />
an example of how one of the interventions, in this case the<br />
ASSIST intervention program, dominates the other<br />
interventions shown by a significantly steeper positively<br />
increasing slope when varied over increasing levels of<br />
coverage across the population (from 0% to 100%) with the<br />
most impressive influence when applied to over 50% of the<br />
population.<br />
RESULTS<br />
Throughout the workshop we compared the percentage<br />
of smokers within a population prior to applying the<br />
interventions and then once the population smoking<br />
percentage reached a steady state after the interventions were<br />
applied over a period of time.<br />
Figure 4. Example Model Output: % Smokers<br />
Pre and Post Interventions<br />
Figure 4 shows an example of the distribution of<br />
percentage of smokers be<strong>for</strong>e and after the interventions were<br />
Figure 5. Example Model Output: Relative<br />
Effects of Intervention Programs<br />
The other interventions, in this example PPBI, ASPIRE,<br />
and National Truth Campaign, are more effective then the<br />
ASSIST intervention program at a level up to 50% population<br />
coverage, however, the ASSIST intervention then dominates<br />
the other interventions. Using this example, if a policy maker<br />
only had enough funds to invest in a program that influenced<br />
up to 50% of the population, we would recommend that they<br />
chose any of the programs except the ASSIST program.<br />
However, if they had enough funding and a desire to<br />
implement an intervention program over more than 50% of<br />
the population, then the ASSIST program is a much more<br />
effective choice <strong>for</strong> reducing population smoking rates.<br />
As part of our model assessment, we decided to compare<br />
the per<strong>for</strong>mance of our agent based simulation model in<br />
predicting smoking rate reduction vs. how the odds ratios<br />
predicted the same outcomes. Figure 6 shows a comparison<br />
of how the simulation output (plot points on the graph)<br />
compare to our estimate of population smoking reduction<br />
based on the odds ratios (linear line plot). Most of the odds<br />
ratios per<strong>for</strong>med as expected with the exception of the Truth<br />
Campaign intervention, which led us to hypothesize, that the<br />
original research to support the effectiveness of this<br />
intervention may not have considered the effects of social<br />
2 See software downloads at http://harvest.nps.edu/<br />
32 - IDFW 20 - Team 8