Energy Wizard Brochure - Intech Instruments Ltd
Energy Wizard Brochure - Intech Instruments Ltd
Energy Wizard Brochure - Intech Instruments Ltd

You also want an ePaper? Increase the reach of your titles
YUMPU automatically turns print PDFs into web optimized ePapers that Google loves.
Introduction<br />
This energy management software has<br />
been designed to answer the differing<br />
requirements of management who<br />
want analysed data for strategic planning,<br />
audit, accounts or tariff negotiations<br />
and site personnel who need real<br />
time information to optimize plant processes,<br />
with the flexibility to move to<br />
automatic control if desired.<br />
<strong>Energy</strong> <strong>Wizard</strong> has been developed as<br />
a result of numerous request from clients<br />
who anticipated the opportunities<br />
and pitfalls of the deregulated energy<br />
markets of the 1900’s and is an additional<br />
feature to our very successful<br />
MicroScan SCADA package.<br />
<strong>Intech</strong> <strong>Instruments</strong> <strong>Ltd</strong> and ECNZ (who<br />
produced the original conceptual<br />
design), both have long track records in<br />
the <strong>Energy</strong> Sector. <strong>Intech</strong> <strong>Instruments</strong><br />
<strong>Ltd</strong> supply software, instrumentation<br />
and SCADA systems to Industry in 22<br />
countries world wide. ECNZ is New<br />
Zealand’s primary electricity producer<br />
with considerable knowledge of electricity<br />
markets and industrial customers.<br />
We believe that the future energy market<br />
will lead to more stringent industry<br />
tariffs and more price volatility, making<br />
automation of load control increasingly<br />
valuable as a necessary cost control<br />
function.<br />
www.intech.co.nz<br />
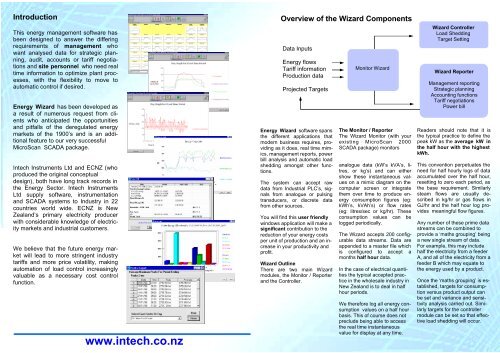
Overview of the <strong>Wizard</strong> Components<br />
Data Inputs<br />
<strong>Energy</strong> flows<br />
Tariff information<br />
Production data<br />
Projected Targets<br />
<strong>Energy</strong> <strong>Wizard</strong> software spans<br />
the different applications that<br />
modern business requires, providing<br />
as it does, real time mimics,<br />
management reports, power<br />
bill analysis and automatic load<br />
shedding amongst other functions.<br />
The system can accept raw<br />
data from Industrial PLC’s, signals<br />
from analogue or pulsing<br />
transducers, or discrete data<br />
from other sources.<br />
You will find this user friendly<br />
windows application will make a<br />
significant contribution to the<br />
reduction of your energy costs<br />
per unit of production and an increase<br />
in your productivity and<br />
profit.<br />
<strong>Wizard</strong> Outline<br />
There are two main <strong>Wizard</strong><br />
modules, the Monitor / Reporter<br />
and the Controller.<br />
Monitor <strong>Wizard</strong><br />
The Monitor / Reporter<br />
The <strong>Wizard</strong> Monitor (with your<br />
existing MicroScan 2000<br />
SCADA package) monitors<br />
analogue data (kW’s kVA’s, litres,<br />
or kg’s) and can either<br />
show these instantaneous values<br />
on a mimic diagram on the<br />
computer screen or integrate<br />
them over time to produce energy<br />
consumption figures (eg:<br />
kWh’s, kVAh’s) or flow rates<br />
(eg: litres/sec or kg/hr). These<br />
consumption values can be<br />
logged periodically.<br />
The <strong>Wizard</strong> accepts 200 configurable<br />
data streams. Data are<br />
appended to a master file which<br />
is configured to accept a<br />
months half hour data.<br />
In the case of electrical quantities<br />
the typical accepted practice<br />
in the wholesale industry in<br />
New Zealand is to deal in half<br />
hour periods.<br />
We therefore log all energy consumption<br />
values on a half hour<br />
basis. This of course does not<br />
preclude being able to access<br />
the real time instantaneous<br />
value for display at any time.<br />
<strong>Wizard</strong> Controller<br />
Load Shedding<br />
Target Setting<br />
<strong>Wizard</strong> Reporter<br />
Management reporting<br />
Strategic planning<br />
Accounting functions<br />
Tariff negotiations<br />
Power bill<br />
Readers should note that it is<br />
the typical practice to define the<br />
peak kW as the average kW in<br />
the half hour with the highest<br />
kWh.<br />
This convention perpetuates the<br />
need for half hourly logs of data<br />
accumulated over the half hour,<br />
resetting to zero each period, as<br />
the base requirement. Similarly<br />
steam flows are usually described<br />
in kg/hr or gas flows in<br />
GJ/hr and the half hour log provides<br />
meaningful flow figures.<br />
Any number of these prime data<br />
streams can be combined to<br />
provide a ‘maths grouping’ being<br />
a new single stream of data.<br />
For example, this may include<br />
half the electricity from a feeder<br />
A, and all of the electricity from a<br />
feeder B which may equate to<br />
the energy used by a product.<br />
Once the ‘maths grouping’ is established,<br />
targets for consumption<br />
versus product output can<br />
be set and variance and sensitivity<br />
analysis carried out. Similarly<br />
targets for the controller<br />
module can be set so that effective<br />
load shedding will occur.


![NZ Catalogue Pages [PDF] - Intech Instruments Ltd](https://img.yumpu.com/36229536/1/184x260/nz-catalogue-pages-pdf-intech-instruments-ltd.jpg?quality=85)