Bunker Silo/Pile Density Study – Findings & Industry Applications
Bunker Silo/Pile Density Study – Findings & Industry Applications
Bunker Silo/Pile Density Study – Findings & Industry Applications

You also want an ePaper? Increase the reach of your titles
YUMPU automatically turns print PDFs into web optimized ePapers that Google loves.
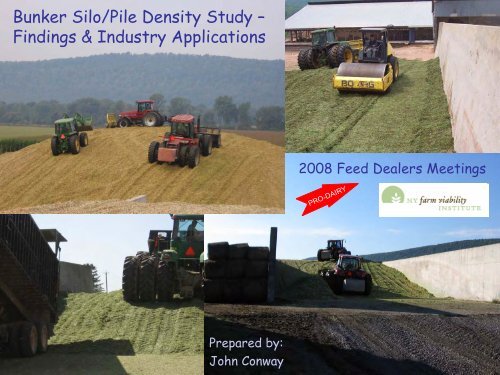
<strong>Bunker</strong> <strong>Silo</strong>/<strong>Pile</strong> <strong>Density</strong> <strong>Study</strong> –<br />
<strong>Findings</strong> & <strong>Industry</strong> <strong>Applications</strong><br />
2008 Feed Dealers Meetings<br />
Prepared by:<br />
John Conway
Will we have adequate packing?<br />
Major influencers of silage density --<br />
•Tractor weight<br />
•Packing time per ton<br />
•Layer thickness<br />
•Crop DM<br />
---------------------------<br />
(lesser extent)<br />
•Particle length<br />
•Height of silo
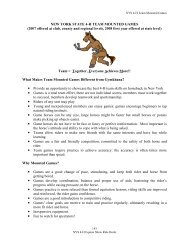
Where it all started… still basis for WI spreadsheets<br />
Packing <strong>Density</strong> & DM Loss - Ruppel, 1992<br />
DM loss,%<br />
21<br />
19<br />
17<br />
15<br />
13<br />
11<br />
9<br />
7<br />
5<br />
10 14 16 18 22<br />
<strong>Density</strong> (lbs DM/ft3)
<strong>Bunker</strong> <strong>Silo</strong> Densities - Holmes, 1999<br />
• Hay crop silage (87 silos)<br />
• Average = 14.8 lbs/cu ft (6.6 - 27.1)<br />
• Corn silage (81 silos)<br />
• Average = 14.5 lbs/cu ft (7.8 - 23.6)<br />
(note that these were single samples, “chest high”)
<strong>Bunker</strong> <strong>Silo</strong>/<strong>Pile</strong> <strong>Density</strong> <strong>Study</strong> – Describe <strong>Silo</strong> Filling Dynamic Relative<br />
to DM Densities:<br />
124 Samples from 68 <strong>Silo</strong> Faces<br />
Legume, Grass, Mixed, Corn Silage & BMR CS<br />
2004 2008, Most in 2006 & 2007 Crop Seasons<br />
Led us to these conclusions…
What We’ve Found:<br />
University of Wisconsin spreadsheets for predicting density of<br />
bunkers and piles remain the most reliable tool out there. But…<br />
- Legumes, particularly when drier, tend to run slightly higher<br />
than predictions. The “glueyness” factor.<br />
- Corn silage trends slightly lower than predictions – sometimes<br />
due to loads being dumped faster than you think they are.<br />
- Grass really resists compression. It is also tough to blade as it<br />
wants to roll. We need more data. Same equipment and delivery<br />
rates and it’s up to 5 lbs./ft. 3 lower. More storage needed!<br />
You can use your own “tested” density predictions to arrive at a<br />
“smaller silo space required” compared with average densities. This<br />
allows bunkers or piles to be compared fairly with other storage<br />
systems or with each other. (See “Cost of Forage Storage” spreadsheet)
What We’ve Found… continued:<br />
Water trapped in plant material occupies space. Wetter materials<br />
do not achieve the dry matter densities of similarly packed drier<br />
materials.<br />
-Top notch packing does not help with consequential<br />
fermentation problems (i.e. butyrate) when silage is put up<br />
too wet (
What We’ve Found… continued:<br />
While dry matter losses translate easily into dollars, it is the cost<br />
of additional storage needed with sub-optimal densities that really<br />
drives up storage costs.<br />
A haylage silo filling strategy that seems to work well… use a long<br />
ramp to keep blade layer minimized. When stretching out the life of<br />
silo; layering a subsequent cutting on top and in front of initial<br />
cutting will compress the lower material even more. Useful when you<br />
need to stretch the utilization of a silo while minimizing losses.<br />
When corn silage (or haylage) is so far over the sidewalls that it looks<br />
like a bread loaf, it’s time to consider more packing weight or even<br />
better, a new silo! A lot of diesel and labor is spent on not a lot of<br />
dry matter!
Closer L k – Straight Grass<br />
Grass “Rolling”<br />
<br />
, “Ridging”<br />
<br />
& “Springing Back”<br />
Mvi_0240.avi
Closer L k – Storage Costs<br />
Horizontal <strong>Silo</strong><br />
What’s Happening in that Cubic Foot<br />
of <strong>Bunker</strong> <strong>Silo</strong> Storage “Space”?<br />
32’W x 106’L x 10’H = 33,900 ft. 3<br />
Capital Cost structure plus share of tractors = ~$61,000.<br />
Capital Cost per ft. 3 = $1.80<br />
Annualized Capital Cost per ft. 3 (10 yr. depreciable life) = $0.18<br />
13 lbs. forage DM/ ft. 3 density @ 17.5% storage loss = 10.7 lbs./ft. 3 retained<br />
18 lbs. forage DM/ ft. 3 density @ 13.4% storage loss = 15.6 lbs./ft. 3 retained<br />
Value of 10.7 lbs./ft. 3 @ $0.05/lb.* over 33,900 ft. 3 = $18,136.00<br />
Value of 15.6 lbs./ft. 3 @ $0.05/lb.* over 33,900 ft. 3 = $26,442.00<br />
A 38% difference in packing density amplifies to a 45.8% difference in forage $<br />
value retained and fit into “space”. A $8,306.00 difference in retained forage value.<br />
Net value of forage losses due to lower density = $1271.00<br />
…but you may still need to find a home for 4.9 lbs. DM/ ft. 3 you need as feed that<br />
did not fit into the “space”. At $0.18 annualized capital cost per ft. 3 = $2300.00<br />
Wasted silo “space” costs are additive to DM losses – twice the $ value!!<br />
*Value of $35.00/ton haylage at 35% Dry Matter (DM), converted to 100% DM and expressed in pounds
Closer L k – Storage Costs<br />
The “Beast”<br />
(dozer that is)<br />
110,000 lbs. of<br />
packing force
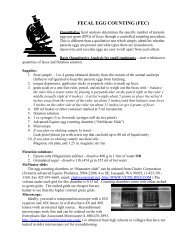
Closer L k – “Re-Packing”<br />
4 th/ 5 th Crop<br />
18.4 lbs./ft. 3<br />
over 3rd<br />
17.6 lbs./ft. 3<br />
over 3rd & 1st<br />
3 rd Crop<br />
17.0 lbs./ft. 3<br />
sole face<br />
19.0 lbs./ft. 3<br />
over 1st & under 4 th /5 th<br />
1 st Crop<br />
17.6 lbs./ft. 3<br />
sole face<br />
23.8 lbs./ft. 3<br />
under 3 rd & 4 th /5 th<br />
Each new crop came over the top of what was<br />
below and had a full face of its own on the front side. Peak<br />
height is 6’ over side walls. Little or no waste. Trucks dump<br />
fresh forage onto a concrete backwall/landing area that is just<br />
below the top of the sidewalls.
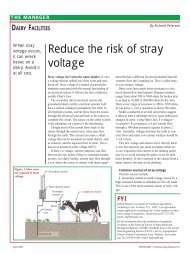
Closer L k – Overtopping<br />
The “breadloaf” top – 10’+ above sidewalls. Dry matter density of only<br />
12.8 lbs./ft. 3 at 6’ from top, means a lot of diesel and tractor labor are<br />
burnt for not a whole heck of a lot of feed-able corn silage. Pad work is<br />
done for new silo with shared sidewall (into use Fall, 2008).<br />
2007
Useful Tools to Integrate Forage Production<br />
with Feeding System at the <strong>Silo</strong><br />
(CD of Related Wisconsin Spreadsheets)
Useful Tools to Integrate Forage Production<br />
with Feeding System at the <strong>Silo</strong> (continued)<br />
(CD of Related Wisconsin Spreadsheets)<br />
*<strong>Bunker</strong> <strong>Silo</strong> <strong>Density</strong> Calculator (English & Spanish)<br />
BunkDensCalc8-24-07wPOROSITY.xls (spreadsheet)<br />
Documentation: Bunk<strong>Density</strong>CalcDoc2-28-06.doc<br />
Dr. Brian Holmes &<br />
Dr. Richard Muck<br />
Univ. of Wisconsin<br />
Inputs:<br />
<strong>Silo</strong> wall height<br />
Maximum height<br />
Silage delivery rate<br />
Silage DM content<br />
Silage packing layer thickness<br />
Packing tractor(s) weight(s)<br />
Outputs:<br />
Wet density<br />
Porosity<br />
DM density
Useful Tools to Integrate Forage Production<br />
with Feeding System at the <strong>Silo</strong> (continued)<br />
(CD of Related Wisconsin Spreadsheets)<br />
*Silage <strong>Pile</strong> <strong>Density</strong> Calculator (English & Spanish)<br />
<strong>Pile</strong>DensCalcwPOROSITY8-24-07.xls (spreadsheet)<br />
Documentation: <strong>Pile</strong><strong>Density</strong>CalculatorDoc2-28-06.doc<br />
Dr. Brian Holmes &<br />
Dr. Richard Muck<br />
Univ. of Wisconsin<br />
Inputs:<br />
Bottom width<br />
Height<br />
Top width<br />
Side slope (if known)<br />
Silage delivery rate<br />
Silage DM content<br />
Silage packing layer thickness<br />
Packing tractor(s) weight(s)<br />
Outputs:<br />
Wet density<br />
Porosity<br />
DM density
Packed pile with same tonnage stored as last bunker silo –<br />
best density achievable is 9% lower (16.6 vs. 18.1 lbs./ft. 3)
Useful Tools to Integrate Forage Production<br />
with Feeding System at the <strong>Silo</strong> (continued)<br />
(CD of Related Wisconsin Spreadsheets)<br />
*Determining Value of Improved Silage Management<br />
FeedLo$$5-6-08.xls (spreadsheet)<br />
Documentation is a sheet (tab) within spreadsheet<br />
Dr. Brian Holmes,<br />
Univ. of Wisconsin<br />
Inputs:<br />
Animal numbers<br />
DM consumption<br />
Ration ratio of haylage:corn silage<br />
Haylage $ value<br />
Corn silage $ value<br />
Loss values – before<br />
Loss values – after<br />
Output:<br />
Bottom line – Total improvement in value lost, $/year
Useful Tools to Integrate Forage Production<br />
with Feeding System at the <strong>Silo</strong> (continued)<br />
(CD of Related Wisconsin Spreadsheets)<br />
*Cost of Forage Storage Spreadsheet<br />
(Capital investment & annual costs of forage storage)<br />
(Ideal for comparing costs of bunkers vs. piles)<br />
(Has bunker silo sizing spreadsheet (above) embedded as tab)<br />
CSTFORST5-1-03.xls (spreadsheet)<br />
Documentation: for-stor.pdf<br />
Dr. Brian Holmes &<br />
Dr. Gary Frank<br />
Univ. of Wisconsin<br />
Inputs:<br />
Very detailed, all possible costs<br />
Helpful calculators for different cost cells<br />
Can ignore other types of storage not wanted in comparison<br />
Relative cost of concrete vs. macadam may swing results over time<br />
Choosing bunker vs. pile generally has other factors to consider beyond cost alone<br />
Outputs:<br />
Total annual storage cost ($/year)<br />
Annual storage cost per ton of DM ($/ton)<br />
Annual storage cost per ton of DM fed ($/ton)
Project’s contribution to<br />
farm’s Forage Feed Flow<br />
operations management:<br />
Real time, web-based,<br />
silo inventory management<br />
software.<br />
http://www.agmodels.com/clients/silostor/<br />
Why web-based?<br />
Speed & capacity of server<br />
Greater programming flexibility & efficiency<br />
Continuous enhancements/upgrading without user disruptions
You will receive an e-mail – click<br />
through and you’re in!
Why use tools?<br />
Help in Complicated<br />
Decision Making<br />
Dynamic<br />
Have Competing Related<br />
Investment Needs and Wants?<br />
*Current Operational Bottleneck(s)<br />
-Mowing capacity<br />
-Merging capacity<br />
-Chopping capacity<br />
-Hauling capacity<br />
-”Blading” capacity<br />
-Packing capacity<br />
-Available quality labor<br />
for all above<br />
-Functional silo capacity<br />
What are Short/Long<br />
Term Goals?<br />
*Need to get more storage<br />
out of existing space.<br />
(Pack it in tighter)<br />
*Want to limit DM losses<br />
*Both of the above<br />
Spend Labor<br />
and/or Machinery<br />
Dollars on More<br />
Intensive Packing?<br />
What’s Driving Demand to<br />
Conserve the Most Possible?<br />
*Acres available<br />
*Yield per acre<br />
*Total Herd Forage DM Needs<br />
-Current “steady state”<br />
+ with optimum quality<br />
+ at maximum inclusion rate<br />
+ want/need future expansion<br />
Want to Mitigate Risks<br />
Associated with Mother Nature?<br />
*Are you willing to gamble<br />
on 1 st crop weather window<br />
“length” in days? 2006 was<br />
really only 4 – 5!<br />
*Soil related constraints<br />
under saturated conditions
Benefits Experienced by Project Farms<br />
“Guy with clipboard” effect; big response in added tractor<br />
weight and packing intensity.<br />
Gains in inventory carried over – even in modest yield years<br />
like 2006 & 2007 crop seasons.<br />
Inventory gains are very real. Opens door to some<br />
interesting options:<br />
- Grow herd if in position to do so<br />
-Shift rotations to mix of hay and corn that best suits<br />
land resource<br />
-Divert some acreage to energy and/or protein grain<br />
production<br />
-Some profit generating combination of the above
Let’s end with the start of a well-packed pile…