Disabled Student Programs & Services - California Community ...
Disabled Student Programs & Services - California Community ...
Disabled Student Programs & Services - California Community ...

You also want an ePaper? Increase the reach of your titles
YUMPU automatically turns print PDFs into web optimized ePapers that Google loves.
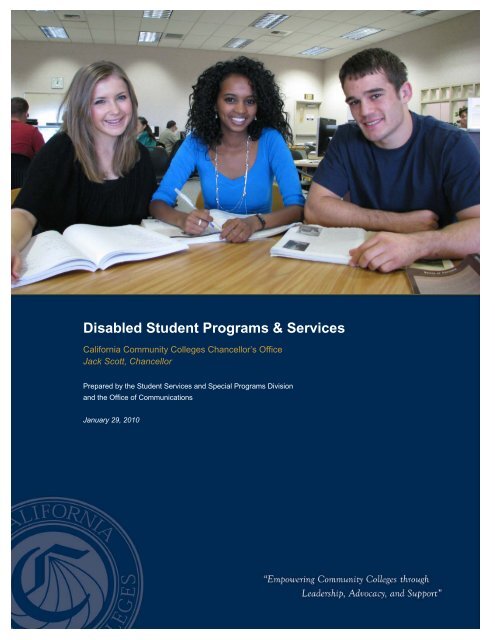
<strong>Disabled</strong> <strong>Student</strong> <strong>Programs</strong> & <strong>Services</strong><br />
<strong>California</strong> <strong>Community</strong> Colleges Chancellor’s Office<br />
Jack Scott, Chancellor<br />
Prepared by the <strong>Student</strong> <strong>Services</strong> and Special <strong>Programs</strong> Division<br />
and the Office of Communications<br />
January 29, 2010
STATE OF CALIFORNIA<br />
JACK SCOTT, CHANCELLOR<br />
CALIFORNIA COMMUNITY COLLEGES<br />
CHANCELLOR’S OFFICE<br />
1102 Q STREET<br />
SACRAMENTO, CA 95811-6549<br />
(916) 445-8752<br />
http://www.cccco.edu<br />
January 29, 2010<br />
The Honorable Arnold Schwarzenegger<br />
Governor of <strong>California</strong><br />
State Capitol<br />
Sacramento, <strong>California</strong> 95814<br />
Dear Governor Schwarzenegger:<br />
On behalf of the Board of Governors, I am pleased to present to you the<br />
Chancellor’s Office report on <strong>Disabled</strong> <strong>Student</strong> <strong>Programs</strong> and <strong>Services</strong> (DSPS).<br />
This report covers July 2007 through September 2009. During this time, DSPS<br />
programs throughout the <strong>California</strong> <strong>Community</strong> Colleges served 86,651<br />
students in 2007-08 and 94,945 students in 2008-09.<br />
Included in this report are measurable outcomes for students with disabilities as<br />
compared with their nondisabled peers, an analysis of staff and student<br />
perceptions of program effectiveness and data on the implementation of<br />
accessibility requirements of Section 794 of Title 29 of the Federal<br />
Rehabilitation Act of 1973.<br />
If you or your staff have questions, please feel free to contact Morgan Lynn,<br />
executive vice chancellor for programs, at (916) 445-1774 or<br />
mlynn@cccco.edu.<br />
Sincerely,<br />
Jack Scott, Ph.D.<br />
Chancellor
<strong>Disabled</strong> <strong>Student</strong> <strong>Programs</strong> and <strong>Services</strong>:<br />
Executive Summary<br />
The <strong>California</strong> <strong>Community</strong> Colleges serve more than 2.9 million students and is the<br />
largest system of higher education in the nation. The state’s 110 community colleges are<br />
charged with providing workforce training, basic skills education and preparing students<br />
for transfer to four-year institutions.<br />
<strong>Disabled</strong> <strong>Student</strong> <strong>Programs</strong> and <strong>Services</strong> (DSPS) provide support services and<br />
educational accommodations to students with disabilities so that they can have full and<br />
equal access to the community college experience. In addition, many colleges provide<br />
specialized instruction as part of their DSPS program.<br />
Examples of these services include: test-proctoring; assessment for learning disabilities;<br />
specialized counseling; interpreter or captioning services for hearing-impaired or deaf<br />
students; mobility assistance; note-taker services; reader services; speech services;<br />
transcription services; on-campus transportation; specialized tutoring; access to<br />
adaptive equipment; job development/placement; registration assistance; and special<br />
parking and specialized instruction. DSPS served 86,651 students during the 2007-08<br />
academic year and 94,945 students during the 2008-09 academic year, with an<br />
allocation of $115 million provided during each of these years.<br />
This report is written in response to Education Code section 67312(b), which requires<br />
the board of governors to report every two years to the Governor, the education<br />
policy committees of the Legislature, and the <strong>California</strong> Postsecondary Education<br />
Commission on its system for evaluating “state-funded programs and services for<br />
disabled students on each campus at least every five years.” Education Code section<br />
67312(a)(4) states, “At a minimum, these systems shall provide for the gathering of<br />
outcome data, staff and student perceptions of program effectiveness, and data on the<br />
implementation of the program and physical accessibility requirements of Section 794<br />
of Title 29 of the Federal Rehabilitation Act of 1973.”<br />
The information presented in this report comes from two sources: compiled<br />
Chancellor’s Office Management Information Systems annual data reports, submitted<br />
by all community colleges, and the coordinated student services programmatic site<br />
reviews. The latter was developed by the Chancellor’s Office, in consultation with the<br />
executive board of the Chief <strong>Student</strong> <strong>Services</strong> Officers Association. The site visit model<br />
included a self evaluation report completed by the college in advance of an onsite visit<br />
of the college. The site visit teams conducted their reviews on campus for two days,<br />
and the teams were generally composed of: a team leader, who was normally a chief<br />
student services officer; a Chancellor’s Office representative; and a team of peer experts<br />
<strong>Disabled</strong> <strong>Student</strong> <strong>Programs</strong> and <strong>Services</strong> | 2 0 1 0 | 1
each assigned to review one of the student service programs included in this model,<br />
including DSPS. The intent of the review was to evaluate program effectiveness, the<br />
integration of services of those programs reviewed, and to assist in the preparation for<br />
accreditation.<br />
The reviews were conducted in academic years 2007-08 and 2008-09 at a total of 38 of<br />
the 110 community colleges. These 38 colleges were chosen as cohorts of colleges who<br />
were scheduled for their accreditation review two years following the Chancellor’s<br />
Office visits. In addition, the report includes a campus-by-campus review of the<br />
enrollment, retention, transition and graduation rates of community college students<br />
receiving services through DSPS. This data was collected from all 110 colleges and is<br />
presented in the report in system wide aggregated summaries.<br />
Additionally, as required by statute, campus by campus outcome data will be found on<br />
the website for the <strong>California</strong> <strong>Community</strong> College system by going to the link posted at:<br />
www.cccco.edu/ChancellorsOffice/Divisions/<strong>Student</strong><strong>Services</strong>/DSPS/tabid/616/Default.aspx<br />
2 | <strong>California</strong> <strong>Community</strong> Colleges Chancellor’s Office
<strong>Disabled</strong> <strong>Student</strong> <strong>Programs</strong> and <strong>Services</strong>:<br />
Methodology for Data Collection<br />
Education Code 67312 requires this report to include information on four key areas:<br />
1) The system for evaluating state-funded programs and services for disabled<br />
students on each campus;<br />
2) Outcome data;<br />
3) Staff and student perceptions of program effectiveness; and<br />
4) Implementation of the program and physical accessibility requirements of Section<br />
794 of Title 29 of the Federal Rehabilitation Act of 1973.<br />
The data attained and analyzed to complete the report for the second element listed<br />
above (Outcome Data), came from compiled Chancellor’s Office Management<br />
Information Systems Annual Data Reports that were submitted by all 110 <strong>Community</strong><br />
Colleges. Please note that in the reporting areas of Degree and Certificate Attainment<br />
and on Transfer, a five-year cohort study from the Chancellor’s Office Management<br />
Information Systems data was analyzed.<br />
The information necessary to report on the remaining three elements (evaluating statefunded<br />
programs, staff and student perceptions, and program and physical access<br />
requirements) came from 38 site visits that were conducted by the Chancellor’s Office,<br />
as described in the Introduction of this report.<br />
<strong>Disabled</strong> <strong>Student</strong> <strong>Programs</strong> and <strong>Services</strong> | 2 0 1 0 | 3
<strong>Disabled</strong> <strong>Student</strong> <strong>Programs</strong> and <strong>Services</strong>:<br />
Key Findings<br />
The data compiled for this report show that while students with disabilities served by<br />
DSPS are underrepresented in the college population in comparison to their<br />
nondisabled peers, they:<br />
• Take both credit and noncredit courses at greater rates;<br />
• Show greater persistence and essentially the same retention level, (with the<br />
notable exceptions of basic skills and workforce preparation classes); and<br />
• Are successful at both degree and certificate attainment at a substantially<br />
higher rate.<br />
However, despite these positive indicators, DSPS students were substantially less likely<br />
to be transfer directed (completed transfer level math and English) than their<br />
nondisabled peers. And, despite the fact they were more transfer-prepared (completed<br />
60 CSU or CSU transferrable units), they were far less likely to actually transfer to a fouryear<br />
institution.<br />
Staff and student perceptions of program effectiveness reveal:<br />
• Staff and students share a common perception that DSPS is effective at assisting<br />
students in overcoming barriers posed by their disabilities.<br />
• <strong>Student</strong>s shared that specific DSPS tutoring was beneficial.<br />
• <strong>Student</strong>s requested that confidentiality during counseling be improved.<br />
• <strong>Student</strong>s requested that testing facilities have readily available distraction-free<br />
testing hours for students with learning disabilities and sufficient proctored<br />
testing hours available.<br />
• <strong>Student</strong>s requested that DSPS services be provided at off-site satellite locations.<br />
• Staff perceives appreciation by their administrators and students, and expressed<br />
high job satisfaction.<br />
• Staff indicated that their outreach to faculty has resulted in much better<br />
collaboration between the academic and student services divisions.<br />
With regard to the Implementation of the Program and Physical Accessibility<br />
Requirements of Section 794 of Title 29 of the Federal Rehabilitation Act of 1973,<br />
colleges continue to request information and guidance on making their<br />
campuses fully accessible from architectural, communications and programmatic<br />
perspectives. Data uncovered during the site reviews indicated continuing access issues<br />
related to physical accessibility and architectural access, and the need for additional<br />
technical assistance related to the following: the roles and responsibilities of the Section<br />
504/ADA Coordinator; emergency evacuation policies and procedures; alternative<br />
service access for students who choose not to use DSPS; Title IX compliance; faculty<br />
4 | <strong>California</strong> <strong>Community</strong> Colleges Chancellor’s Office
awareness; academic accommodations and course substitution policies and procedures;<br />
test accommodations; timely access to services; policies and procedures related to<br />
suspension of services; sign language interpreters and real time captioners; alternate<br />
media including captioning; general assistive technology; campus-wide access to<br />
computers; accessible distance education; and Section 508 policies and procedures.<br />
Outcome Data including: Enrollment, Retention, Transition and Graduation<br />
Total Enrollment<br />
FY 2008-09 FY 2007-08<br />
# of <strong>Student</strong>s<br />
% of<br />
Population<br />
# of<br />
<strong>Student</strong>s<br />
% of<br />
Population<br />
DSPS <strong>Student</strong>s 94,945 3.41% 86,651 3.58%<br />
Non-DSPS<br />
<strong>Student</strong>s 2,691,973 96.59% 2,334,470 96.42%<br />
All <strong>Student</strong>s 2,786,918 100.00% 2,421,121 100.00%<br />
<strong>Student</strong>s with disabilities decreased from 3.6 to 3.4 percent from 2007-08 to 2008-09.<br />
They remain underrepresented in the <strong>California</strong> <strong>Community</strong> Colleges student population<br />
when compared to U.S. Census data taken from the 2004 Disability Status Reports by<br />
Cornell University, U.S. Census Bureau’s population estimates program, which shows<br />
<strong>California</strong>’s disability rate (ages 16 to 64) at approximately 10 percent. While some<br />
students with disabilities enrolled in <strong>California</strong> <strong>Community</strong> Colleges may not request<br />
services from DSPS, and thus not be reflected in this enrollment data, this alone is not<br />
likely to account for the significant degree of under-representation. DSPS staff at the<br />
colleges reports that funding constraints affecting staff resources negatively impact both<br />
their ability to conduct outreach efforts and to serve the current population of DSPS<br />
students. Nevertheless, DSPS programs do maintain a number of collaborative<br />
relationships within existing staffing and service constraints, which support ongoing<br />
referrals of new students.<br />
<strong>Disabled</strong> <strong>Student</strong> <strong>Programs</strong> and <strong>Services</strong> | 2 0 1 0 | 5
Enrollment in Credit Classes<br />
FY 2008-09 FY 2007-08<br />
# of % of<br />
# of % of<br />
<strong>Student</strong>s Population <strong>Student</strong>s Population<br />
DSPS <strong>Student</strong>s 80,878 3.84% 75,112 3.80%<br />
Non-DSPS<br />
<strong>Student</strong>s 2,023,509 96.16% 1,901,399 96.20%<br />
All <strong>Student</strong>s 2,104,387 100.00% 1,976,511 100.00%<br />
<strong>Student</strong>s served by DSPS are represented at slightly higher rates in credit enrollment<br />
compared to their representation in the entire student population. While these<br />
students comprised 3.6 percent in 2007-08 and 3.4 percent in 2008-09 of the total<br />
student population in the <strong>California</strong> <strong>Community</strong> Colleges, DSPS students made up 3.8<br />
percent of students enrolled in credit classes during these school years.<br />
Credit Full Time Equivalent <strong>Student</strong>s (FTES)<br />
# of<br />
<strong>Student</strong>s<br />
FY 2008-09 FY 2007-08<br />
% of # of<br />
Population <strong>Student</strong>s<br />
% of<br />
Population<br />
DSPS <strong>Student</strong>s 55,227 4.95% 49,377 4.88%<br />
Non-DSPS<br />
<strong>Student</strong>s 1,059,354 95.05% 961,848 95.12%<br />
All <strong>Student</strong>s 1,114,581 100.00% 1,011,225 100.00%<br />
In addition, students served by DSPS represented a substantially higher proportion of<br />
credit full-time equivalent students than their representation in the student population.<br />
While they represented 3.5 percent of the <strong>California</strong> <strong>Community</strong> Colleges student<br />
population from 2007-2009, they represented 4.9 percent of the credit full-time<br />
equivalent students. This may be accounted for by the reception of benefits, which<br />
support part or all of the living expenses, enabling them to enroll in additional college<br />
units. Additionally, some are Department of Rehabilitation consumers and, as such, are<br />
required to take a full course load unless they cannot do so because of a disabilityrelated<br />
reason.<br />
6 | <strong>California</strong> <strong>Community</strong> Colleges Chancellor’s Office
Enrollment in Noncredit Classes<br />
FY 2008-09 FY 2007-08<br />
# of <strong>Student</strong>s<br />
% of<br />
Population<br />
# of<br />
<strong>Student</strong>s<br />
% of<br />
Population<br />
DSPS <strong>Student</strong>s 35,981 6.57% 37,057 4.87%<br />
Non-DSPS<br />
<strong>Student</strong>s 511,648 93.43% 723,733 95.13%<br />
All <strong>Student</strong>s 547,629 100.00% 760,790 100.00%<br />
DSPS students were also over-represented in noncredit classes compared to their overall<br />
representation in the <strong>California</strong> <strong>Community</strong> Colleges, and this trend increased between<br />
2007-08 to 2008-09. DSPS noncredit enrollment decreased only slightly while non-DSPS<br />
students’ enrollment in noncredit classes decreased markedly. This may be because some<br />
students with developmental disabilities or acquired brain injuries, as well as senior<br />
citizens, may find that noncredit courses better meet their educational needs. In<br />
response, colleges offer noncredit classes and a wide range of courses for them. Other<br />
DSPS students, including veterans and those returning to college after acquiring a<br />
disability, may need to review basic skills material and use noncredit education as a way<br />
to enter the higher educational system.<br />
# of<br />
<strong>Student</strong>s<br />
Noncredit FTES<br />
FY 2008-09 FY 2007-08<br />
% of # of<br />
Population <strong>Student</strong>s<br />
% of<br />
Population<br />
DSPS <strong>Student</strong>s 7,356 12.81% 7,701 9.22%<br />
Non-DSPS<br />
<strong>Student</strong>s 50,059 87.19% 75,839 90.78%<br />
All <strong>Student</strong>s 57,415 100.00% 83,540 100.00%<br />
In accordance with their increased enrollment in noncredit classes, DSPS students<br />
represented a significantly higher percentage of the noncredit full-time equivalent<br />
students for 2007-2009. While they represented 3.5 percent of the student population,<br />
they increased from 9.2 to 12.8 percent of the noncredit full-time equivalent students.<br />
The significant amount of noncredit full-time equivalent students for DSPS students may<br />
be accounted for by colleges offering multiple classes per week, designed to meet the<br />
needs of designated groups of DSPS students.<br />
<strong>Disabled</strong> <strong>Student</strong> <strong>Programs</strong> and <strong>Services</strong> | 2 0 1 0 | 7
Retention and Persistence<br />
Enrolled in Fall 2007/2008 to Spring 2008/2009<br />
# Persisted<br />
(Spring)<br />
FY 2008-09<br />
# Enrolled<br />
(Fall)<br />
%Persisted<br />
DSPS <strong>Student</strong>s 62,659 77,187 81.18%<br />
Non-DSPS <strong>Student</strong>s 1,140,561 1,742,149 65.47%<br />
All <strong>Student</strong>s 1,203,220 1,819,336 66.14%<br />
# Persisted<br />
(Spring)<br />
FY 2007-08<br />
# Enrolled<br />
(Fall)<br />
%Persisted<br />
DSPS <strong>Student</strong>s 58,689 72,777 80.64%<br />
Non-DSPS <strong>Student</strong>s 1,070,358 1,652,323 64.78%<br />
All <strong>Student</strong>s 1,129,047 1,725,100 65.45%<br />
<strong>Student</strong>s served by DSPS showed significantly greater persistence from fall to spring<br />
than other students. This data shows that, given appropriate support services and<br />
specialized counseling, students with disabilities can do well and, in fact, excel in<br />
staying in school at the community college level.<br />
8 | <strong>California</strong> <strong>Community</strong> Colleges Chancellor’s Office
Retention Completed vs. Attempted Enrollments<br />
FY 2008-09<br />
# Completed # Attempted % Completed<br />
DSPS <strong>Student</strong>s 355,286 419,013 84.79%<br />
Non-DSPS <strong>Student</strong>s 7,596,908 8,746,319 86.86%<br />
All <strong>Student</strong>s 7,952,194 9,165,332 86.76%<br />
FY 2007-08<br />
# Completed # Attempted % Completed<br />
DSPS <strong>Student</strong>s 322,010 383,618 83.94%<br />
Non-DSPS <strong>Student</strong>s 6,898,499 8,044,513 85.75%<br />
All <strong>Student</strong>s 7,220,509 8,428,131 85.67%<br />
<strong>Student</strong>s with disabilities were slightly less successful in their retention level as their<br />
peers without disabilities. <strong>Student</strong>s with disabilities completed units attempted about<br />
two percent less often as students without disabilities.<br />
Retention for Degree Applicable Courses<br />
Completed vs. Attempted Degree Applicable Enrollments<br />
FY 2008-09<br />
# Completed # Attempted % Completed<br />
DSPS <strong>Student</strong>s 355,286 419,013 84.79%<br />
Non-DSPS <strong>Student</strong>s 7,596,908 8,746,319 86.86%<br />
All <strong>Student</strong>s 7,952,194 9,165,332 86.76%<br />
FY 2007-08<br />
# Completed # Attempted % Completed<br />
DSPS <strong>Student</strong>s 322,010 383,618 83.94%<br />
Non-DSPS <strong>Student</strong>s 6898,499 8,746,319 85.75%<br />
All <strong>Student</strong>s 7,220,509 8,428,131 85.67%<br />
DSPS students completed the degree applicable courses they enrolled in at somewhat<br />
lower frequency than did their non-disabled peers. This data may reflect increased<br />
challenges, such as finding and utilizing instructional strategies in math and English<br />
courses. It may also reflect the need to seek additional instructional strategies to<br />
address these barriers to course and degree completion.<br />
<strong>Disabled</strong> <strong>Student</strong> <strong>Programs</strong> and <strong>Services</strong> | 2 0 1 0 | 9
Retention for Basic Skills Courses<br />
Completed vs. Attempted Basic Skills Class Enrollments<br />
FY 2008-09<br />
# Completed # Attempted % Completed<br />
DSPS <strong>Student</strong>s 18,167 49,797 36.48%<br />
Non-DSPS <strong>Student</strong>s 217,967 459,020 47.49%<br />
All <strong>Student</strong>s 236,134 508,817 46.41%<br />
FY 2007-08<br />
# Completed # Attempted % Completed<br />
DSPS <strong>Student</strong>s 15,923 45,258 35.18%<br />
Non-DSPS <strong>Student</strong>s 190,124 413,335 46.00%<br />
All <strong>Student</strong>s 206,047 458,593 44.93%<br />
DSPS students completed approximately 11 percent less of the basic skills classes they<br />
attempted compared to non-DSPS students. Combinations of special classes (i.e. those<br />
designed for students with disabilities) and basic skills classes are increasing, perhaps to<br />
address this need. Universal Learning Design, a method of teaching that uses techniques<br />
originally designed to address the needs of learning disabled, as well as non-disabled, is<br />
being used in basic skills classes to increase the success rate.<br />
10 | <strong>California</strong> <strong>Community</strong> Colleges Chancellor’s Office
Retention in Workforce Development Courses<br />
FY 2008-09<br />
# Completed # Attempted %Completed<br />
DSPS <strong>Student</strong>s 49,133 73,699 66.67%<br />
Non-DSPS <strong>Student</strong>s 1,141,079 1,574,727 72.46%<br />
All <strong>Student</strong>s 1,190,212 1,648,426 72.20%<br />
FY 2007-08<br />
# Completed # Attempted %Completed<br />
DSPS <strong>Student</strong>s 44,598 67,541 66.03%<br />
Non-DSPS <strong>Student</strong>s 1,046,715 1,453,063 72.04%<br />
All <strong>Student</strong>s 1,091,313 1,520,604 71.77%<br />
<strong>Student</strong>s served by DSPS had approximately six percent less retention in workforce<br />
development courses than their peers without disabilities. Given the availability of<br />
career technical education, this needs to be further examined so strategies can be<br />
recommended to improve their retention.<br />
# of<br />
<strong>Student</strong>s<br />
Degree and Certificate Attainment<br />
FY 2008-09 FY 2007-08<br />
Total Cohort<br />
%<br />
Completed<br />
# of<br />
<strong>Student</strong>s<br />
Total Cohort<br />
%<br />
Completed<br />
DSPS<br />
<strong>Student</strong>s 1,755 15,846 11.08% 1,859 17,921 10.37%<br />
Non-DSPS<br />
<strong>Student</strong>s 30,672 374,276 8.20% 33,971 474,831 7.15%<br />
All <strong>Student</strong>s 32,427 390,122 8.31% 35,830 492,752 7.27%<br />
<strong>Disabled</strong> <strong>Student</strong> <strong>Programs</strong> and <strong>Services</strong> | 2 0 1 0 | 11
Degree Attainment<br />
# of<br />
<strong>Student</strong>s<br />
FY 2008-09 FY 2007-08<br />
Total Cohort<br />
%<br />
Completed<br />
# of<br />
<strong>Student</strong>s<br />
Total<br />
Cohort<br />
%<br />
Completed<br />
DSPS<br />
<strong>Student</strong>s 653 15,846 4.13% 668 17,921 3.72%<br />
Non-DSPS<br />
<strong>Student</strong>s 18,304 374,276 4.9% 20,315 474,831 4.27%<br />
All <strong>Student</strong>s 18,957 390,122 4.86% 20,983 492,752 4.26%<br />
# of<br />
<strong>Student</strong>s<br />
Certificate Attainment<br />
FY 2008-09 FY 2007-08<br />
Total %<br />
# of Total<br />
Cohort Completed <strong>Student</strong>s Cohort<br />
%<br />
Completed<br />
DSPS<br />
<strong>Student</strong>s 1,102 15,846 6.95% 1,191 17,921 6.65%<br />
Non-DSPS<br />
<strong>Student</strong>s 12,368 374,276 3.30% 13,656 474,831 2.88%<br />
All <strong>Student</strong>s 13,470 390,122 3.45% 14,847 492,752 3.01%<br />
The five-year cohort of students showed that DSPS students were far more successful at<br />
both degree and certificate attainment than their nondisabled peers. This encouraging<br />
outcome speaks to the effectiveness of DSPS programs and services in assisting students<br />
with disabilities to attain a <strong>California</strong> <strong>Community</strong> Colleges degree, and demonstrates<br />
that they possess the motivation and ability to be successful in the college environment<br />
with appropriate supports and accommodations.<br />
12 | <strong>California</strong> <strong>Community</strong> Colleges Chancellor’s Office
Transfer Directed<br />
(Completed both transfer level math and English)<br />
# of<br />
<strong>Student</strong>s<br />
FY 2008-09 FY 2007-08<br />
Total % # of Total<br />
Cohort Completed <strong>Student</strong>s Cohort<br />
% Completed<br />
DSPS<br />
<strong>Student</strong>s 1,604 15,846 10.12% 1,733 17,921 9.67%<br />
Non-DSPS<br />
<strong>Student</strong>s 47,081 374,276 12.58% 52,665 474,831 11.09%<br />
All <strong>Student</strong>s 48,685 390,122 12.48% 54,398 492,752 11.04%<br />
Transfer Prepared<br />
(Completed 60 CSU or UC transferable units)<br />
# of<br />
<strong>Student</strong>s<br />
FY 2008-09 FY 2007-08<br />
Total % # of Total<br />
Cohort Completed <strong>Student</strong>s Cohort<br />
%<br />
Completed<br />
DSPS<br />
<strong>Student</strong>s 2,269 15,846 14.32% 2,368 17,921 13.21%<br />
Non-DSPS<br />
<strong>Student</strong>s 44,959 374,276 12.01% 48,652 474,831 10.25%<br />
All <strong>Student</strong>s 47,228 390,122 12.11% 51,020 492,752 10.35%<br />
<strong>Disabled</strong> <strong>Student</strong> <strong>Programs</strong> and <strong>Services</strong> | 2 0 1 0 | 13
# of<br />
<strong>Student</strong>s<br />
Transfers to Four-Year Colleges<br />
FY 2008-09 FY 2007-08<br />
Total Cohort<br />
%<br />
Completed<br />
# of<br />
<strong>Student</strong>s<br />
Total Cohort<br />
%<br />
Completed<br />
DSPS<br />
<strong>Student</strong>s 1,882 15,846 11.88% 2,413 17,921 13.46%<br />
Non-DSPS<br />
<strong>Student</strong>s 75,891 374,276 20.28% 109,001 474,831 22.96%<br />
All <strong>Student</strong>s 77,773 390,122 19.94% 111,414 492,752 22.61%<br />
DSPS students were less likely to be transfer directed than their nondisabled peers (9.67<br />
to 11.09 percent in 2007-08 and 10.12 to 12.58 percent in 2008-09). Despite being less<br />
transfer directed, a higher percentage were transfer prepared (13.21 to 10.25 percent in<br />
2007-08 and 14.32 to 12.01 percent in 2008-09). However, they were approximately<br />
nine percent less likely to actually transfer to a four-year institution than their peers<br />
without disabilities. This discovery presents significant questions. Since many highdemand,<br />
high-skill occupations require a baccalaureate degree and beyond, and given<br />
the significant unemployment and underemployment of persons with disabilities, the<br />
reasons for fewer transfer directed students and fewer actual transfers need further<br />
study. Discussions need to occur within the <strong>California</strong> <strong>Community</strong> College system and<br />
with the <strong>California</strong> State University and University of <strong>California</strong> systems to improve the<br />
transfer rates of students with disabilities.<br />
14 | <strong>California</strong> <strong>Community</strong> Colleges Chancellor’s Office
Findings of State-Funded <strong>Programs</strong> and <strong>Services</strong> for <strong>Student</strong>s with<br />
Disabilities<br />
Eighteen colleges were reviewed during the 2007/08 academic year: Allan Hancock,<br />
American River, Chabot, Chaffey, Citrus, Cosumnes River, Folsom Lake, Glendale, Las<br />
Positas, Mira Costa, Monterey Peninsula, Napa Valley, Sacramento City, Santa Barbara<br />
City, Santa Monica, College of the Siskiyous, Southwestern, and Taft.<br />
Twenty colleges were reviewed during the 2008/09 academic year: Antelope Valley,<br />
Cypress, College of the Desert, Evergreen Valley, Fullerton, Irvine Valley, College of<br />
Marin, Merced, Moorpark, Mount San Antonio, Oxnard, Saddleback, San Diego City, San<br />
Diego Mesa, San Diego Miramar, San Jose City, Ventura, Victor Valley, West Hills<br />
Coalinga, and West Hills Lemoore.<br />
The colleges reviewed struggle with how to develop and describe measurable student<br />
learning outcomes, address the high demand for learning disability assessment,<br />
preserve adapted physical education’s role in assisting academic achievement,<br />
appropriately serve developmentally delayed learners, maintain student documentation<br />
and records in compliance with all applicable regulations and statute, sufficiently staff<br />
the DSPS coordinator position, contribute college effort, and accurately and efficiently<br />
utilize management information system tracking and data management services.<br />
Common themes that emerged from these reviews pertained to the following issues:<br />
<strong>Student</strong> Learning Outcomes<br />
College staff, in general, and DSPS, in particular, are struggling with how to develop and<br />
describe measurable <strong>Student</strong> Learning Outcomes that meet the intent of the 2004<br />
revised guidelines published by the Accrediting Commission for <strong>Community</strong> and Junior<br />
Colleges. The Chancellor’s Office site review teams helped all the colleges learn more<br />
about how to develop meaningful and relevant student learning outcomes. DSPS staff<br />
has a unique opportunity to see their students grow due to regular contact over a<br />
period of years, as opposed to an instructor who may only see a student for a semester<br />
or two. As a result, the colleges were encouraged to develop ways to define and<br />
measure this growth.<br />
<strong>Disabled</strong> <strong>Student</strong> <strong>Programs</strong> and <strong>Services</strong> | 2 0 1 0 | 15
Learning Disabilities Assessment and Testing<br />
Colleges reported several issues related to serving students with learning disabilities,<br />
and the site review teams provided technical assistance and possible solutions:<br />
• Issue: How best to improve a learning disability program’s collaboration with<br />
the main DSPS program, in situations where the two programs are operated<br />
separately on campus.<br />
• Conclusions: The site review teams recommended that a plan be developed to<br />
combine these programs. The consolidation would eliminate the ambiguity and<br />
duplication of effort that currently exists in such separate models.<br />
• Issue: Colleges sought assistance with how best to provide learning disability<br />
assessment and services while coping with staff retirements, hiring freezes, and<br />
other limited resource issues.<br />
• Conclusion: The site review teams recommended a more timely and efficient<br />
eligibility process for learning disability students by using qualified, part-time<br />
and/or retired staff.<br />
• Issue: Colleges were utilizing all current versions of the appropriate assessment<br />
tests and adhering to the Chancellor’s Office Learning Disability Eligibility and<br />
<strong>Services</strong> Model, but some were not using the computerized scoring and<br />
eligibility software and system that is maintained by the Chancellor’s Office that<br />
most other colleges use.<br />
• Conclusion: As a result of the site visit, the appropriate software was installed<br />
and configured and staff was trained in proper procedures for its use.<br />
At some colleges, staff utilized software programs that could be used in a writing class,<br />
as well as techniques for developing students’ reading comprehension and their ability<br />
to organize and develop compositions across academic disciplines.<br />
16 | <strong>California</strong> <strong>Community</strong> Colleges Chancellor’s Office
Adapted Physical Education<br />
Colleges reported several issues related to successfully serving students with disabilities<br />
in adapted physical education programs and the site review teams provided technical<br />
assistance and possible solutions:<br />
• Issue: One college reviewed wished to start an adapted physical education<br />
program, but found that little information was available on starting new<br />
programs.<br />
• Conclusion: The benefits versus the disadvantages of starting a program at the<br />
college were discussed. The discussion included the possible availability of<br />
community resources to address the need for ongoing exercise, with the college<br />
possibly developing an adapted health/disability management class to introduce<br />
the concept of health and exercise to students with disabilities.<br />
• Issue: Two colleges were looking for ways to improve their adapted physical<br />
education programs.<br />
• Conclusion: The site review team recommended some creative options,<br />
including instituting a curriculum that directly supports the academic<br />
environment by incorporating stress management. Another recommendation<br />
was to augment the curriculum with perceptual motor classes and classes that<br />
would supplement learning disability efforts, such as left-right discrimination,<br />
mid-line issues and numbers sequencing.<br />
Developmentally Delayed Learners<br />
Colleges reported issues related to successfully serving students with developmental or<br />
intellectual disabilities (referred to as developmentally delayed learners in title 5) and<br />
the site review teams provided technical assistance and possible solutions:<br />
• Issue: Identifying the role of higher education in serving developmentally<br />
delayed learners and to define and articulate the minimum accommodations<br />
required by the Americans with Disabilities Act and state law.<br />
• Conclusion: Samples of policies and procedures for serving developmentally<br />
delayed learners, examples of “readiness criteria”, and Taft College’s integration<br />
program were shared for use. The site review teams addressed the role of the<br />
colleges in outreach to high schools and in transition classes. Ideas for working<br />
with local agencies to find alternative avenues and funds to support<br />
developmentally delayed learners were explored. College staff were also<br />
provided with information on a federal grant focused on leadership and<br />
curriculum development.<br />
<strong>Disabled</strong> <strong>Student</strong> <strong>Programs</strong> and <strong>Services</strong> | 2 0 1 0 | 17
<strong>Student</strong> Documentation and Records<br />
Questions covered during the visits addressed third-party medical verification of<br />
disability; length of time student records should be kept; purging files and what critical<br />
information should be retained; intake forms in Spanish and other languages; recording<br />
of contacts for students receiving DSPS services, including special instruction and those<br />
who drop classes before census; reconciling Chancellor’s Office Management<br />
Information Systems data before the end of the fiscal year, and developing and utilizing<br />
a secure electronic record-keeping system at multiple campuses/satellites.<br />
Staffing<br />
Although the Chancellor’s Office does not have definitive data on this issue, it appears<br />
that of the 110 colleges, up to two-thirds have full-time administrative positions; the<br />
other third are faculty positions with the coordinator taking on the role of counselor,<br />
learning disabilities specialist or instructor. Team members described their own<br />
experiences and provided names of DSPS coordinators who are successfully working<br />
across faculty/student service lines. Job descriptions for both faculty and administrative<br />
DSPS coordinator positions were also provided by the site review teams.<br />
College Effort<br />
Colleges providing a portion of general funds to assist in supporting the DSPS program is<br />
defined as college effort in the DSPS allocation formula. The provision of college effort is<br />
not required in the education code but additional dollars may be required if the DSPS<br />
allocation is not sufficient. While DSPS programs can also generate additional income<br />
through special class revenue, colleges that do not offer such courses also report that<br />
they lack the faculty and staff resources to add special classes that will bring additional<br />
income to their programs.<br />
Chancellor’s Office Management Information Systems Tracking and Data<br />
Management<br />
Many colleges requested recommendations pertaining to their management<br />
information systems tracking and data management. Site review team members at<br />
both colleges recommended staff visit colleges using different methods of recordkeeping<br />
and data monitoring.<br />
18 | <strong>California</strong> <strong>Community</strong> Colleges Chancellor’s Office
Staff and <strong>Student</strong> Perceptions of Program Effectiveness<br />
Shared Perceptions<br />
• Staff and students share a common perception that DSPS is effective at assisting<br />
students in overcoming barriers posed by their disabilities. This satisfaction is<br />
especially high at colleges where staff and students felt that staffing was adequate.<br />
• <strong>Student</strong>s and staff also expressed their belief in a close relationship between<br />
students, staff, college and community, as demonstrated by a quote from one site<br />
visit report in which they spoke of the “interwoven relationships and the<br />
team/family culture.”<br />
<strong>Student</strong> Commendations<br />
• <strong>Student</strong>s reported that staff are experienced and empathetic, and provide vital<br />
assistance.<br />
• <strong>Student</strong>s felt that tutoring, when available, is particularly helpful. In spite of this,<br />
many colleges reviewed provide no specific DSPS tutoring apart from the general<br />
academic tutoring available to all students.<br />
<strong>Student</strong> Recommendations<br />
• <strong>Student</strong>s recommended sufficient confidentiality in areas where they participate in<br />
DSPS counseling, due to crowded cubicles with partial walls.<br />
• <strong>Student</strong>s recommended that testing facilities have readily available testing hours<br />
with distraction-free testing areas, for students with learning disabilities who<br />
require that accommodation.<br />
• <strong>Student</strong>s recommended colleges have sufficient hours available for test proctoring<br />
services for students with learning disabilities who may require that<br />
accommodation.<br />
• <strong>Student</strong>s recommended that sufficient services be provided at off-site satellite<br />
locations so they would not be required to go to the main campus to receive<br />
assessment and counseling.<br />
Staff Commendations<br />
• Staff felt appreciated by their administrators and students, expressed a great deal of<br />
job satisfaction, and feel that DSPS works well in serving students.<br />
• Staff outreach to faculty has resulted in much better collaboration between the<br />
academic and student services divisions.<br />
<strong>Disabled</strong> <strong>Student</strong> <strong>Programs</strong> and <strong>Services</strong> | 2 0 1 0 | 19
Staff Recommendations<br />
• Staff recommended more training in mental health issues and in using new<br />
management information systems such as Banner.<br />
• DSPS administrators recommended training in specific budget issues, such as how<br />
special class full-time equivalent students and in how Access to Print funds are used.<br />
• Staff recommended more training or direction in the process of combining student<br />
services service areas. Concerns were expressed over student confidentiality in<br />
newly combined student services service areas that are becoming more common, as<br />
colleges struggle to combine staff functions and facilitate coordination between<br />
student services programs that serve many of the same students.<br />
Implementation of the Program and Physical Accessibility Requirements of<br />
Section 794 of Title 29 of the Federal Rehabilitation Act of 1973<br />
While colleges have made great strides in meeting the program and physical<br />
accessibility requirements of Section 794 of the federal Rehabilitation Act of 1973,<br />
known as Section 504, as well as the subsequent passage of the Americans with<br />
Disabilities Act (ADA) in 1990, work remains to be done on campuses. Section 504 is<br />
known as the first comprehensive civil rights legislation providing equal access to<br />
programs and services for persons with disabilities. It requires all recipients of federal<br />
financial assistance, which includes colleges and universities, to undertake a variety of<br />
actions to ensure that its policies, programs, and services are accessible to and usable by<br />
eligible persons with disabilities.<br />
Areas of need include:<br />
Physical Accessibility and Architectural Access<br />
<strong>Student</strong>s with disabilities continue to face architectural barriers on campus. In most<br />
cases, this is due to the age of the campuses, some of which were built before barrier<br />
removal legislation was in place or when the legal requirements were less stringent.<br />
Colleges visited were in the process of erecting new buildings, causing issues related to<br />
temporary barriers, additional campus vehicles and re-routed walkways. Districts have<br />
been making progress establishing ADA Barrier Removal Plans since the 1990’s.<br />
However, there still remain challenges in some areas to access. As part of the local<br />
assistance facilities related program called Physical Plant and Instructional Support,<br />
Architectural Barrier Removal is an approved state allocation of funds including a 50/50<br />
match with district funds. Unfortunately, due to budgetary cuts in funding, the full<br />
program went unfunded in 2009-10.<br />
20 | <strong>California</strong> <strong>Community</strong> Colleges Chancellor’s Office
In order to address remaining architectural barriers on campus, the site review teams<br />
suggested the use of a small advisory group, consisting of facilities personnel, DSPS staff,<br />
students with disabilities and other interested personnel. The group would survey all<br />
campus buildings, access routes and parking lots, noting where barriers exist. Once a<br />
list has been generated, it should be prioritized in connection with the Business Office,<br />
including plans and completion dates for all identified barriers. It was also<br />
recommended that this process be repeated on an annual/bi-annual basis, and<br />
whenever remodeling or new building is initiated.<br />
Several colleges had received or were about to receive bond funds for capital<br />
improvements. With over $22 billion in local bond funds and $1.5 billion in state funds<br />
from Proposition 1D, there are many ongoing construction projects on campuses, some<br />
of which will cause temporary challenges. All major construction projects require the<br />
Division of the State Architect’s review of accessibility during and after construction. So,<br />
all of the buildings renovated or replaced with new buildings will be complaint with ADA<br />
requirements upon completion.<br />
Clarity on the Roles and Responsibilities of the Section 504/ADA<br />
Coordinator<br />
The site review teams provided technical assistance with the implementation of their<br />
ADA/504 policy and clarification of the job duties of the ADA/504 Coordinator. They<br />
also requested clarification on the issue of whose responsibility it is to pay for needed<br />
accommodations for employees with disabilities, students who choose not to use the<br />
DSPS program, and special events requiring public accommodations. The site review<br />
teams provided guidance in each of those areas.<br />
Emergency Evacuation Policies and Procedures<br />
The site review teams referred colleges to the National Incidence Training Initiative,<br />
provided through the Federal Emergency Management Agency, to ensure DSPS is<br />
represented on relevant committees and all evacuation procedures encompass the<br />
needs of students with disabilities.<br />
<strong>Disabled</strong> <strong>Student</strong> <strong>Programs</strong> and <strong>Services</strong> | 2 0 1 0 | 21
Faculty Awareness<br />
A common issue on virtually every campus is trying to find creative ways to educate<br />
faculty, particularly adjunct faculty, about students with disabilities. Their willingness to<br />
implement accommodations is key to removing educational barriers to students with<br />
disabilities. Specifically, faculty required help to understand:<br />
• Educational limitations and the various accommodations/auxiliary aids and<br />
devices that may be used in the classroom.<br />
• The need to ensure that materials used in class are accessible.<br />
• Testing accommodations - how to build a level of trust that testing will be<br />
proctored appropriately.<br />
• Ways they might identify students with possible disabilities.<br />
• Ways to make appropriate referrals to DSPS.<br />
• The need to make their websites and all distance education courses accessible.<br />
Faculty handbooks, faculty training workshops, disability awareness events, and on-line<br />
communiqués were all recommended as ways to address these issues.<br />
Academic Accommodations/Course Substitution Policies & Procedures<br />
Colleges are required to have policies and procedures in place to respond in a timely<br />
manner to accommodation requests involving academic adjustments and disputes as<br />
stipulated in Section 504 of the Rehabilitation Act of 1973, as amended, and as further<br />
specified in DSPS’ title 5 Implementing Guidelines, Section 56027. Section 504 of the<br />
Rehabilitation Act of 1973, as amended, allows for accommodations in academic<br />
programs for the purpose of avoiding discrimination based on disability. Among the<br />
accommodations that are allowed is “. . . the substitution of specific courses required.”<br />
Given the inevitability of requests on course requirements, grades, and individual<br />
accommodations, colleges were urged by the site review teams to adopt such a policy as<br />
soon as possible to avoid the potential legal action that could follow in the absence of<br />
such a policy.<br />
Test Accommodations<br />
The site review teams informed the colleges that their policy on cheating covered<br />
students with disabilities, and that when DSPS is providing test proctoring services for<br />
students who require such an accommodation, they should utilize the college-wide<br />
procedures for dealing with students who have been found cheating.<br />
22 | <strong>California</strong> <strong>Community</strong> Colleges Chancellor’s Office
Timely Access to <strong>Services</strong><br />
The teams encouraged the implementation of recent decisions to accept students on a<br />
conditional basis by serving them under the “Other Disability” category, if<br />
documentation that is less than five years old could be provided, and followed up by<br />
updated learning disabilities assessments as time permits. The site review teams also<br />
discussed strategies for the provision of cost-effective ways to provide services for<br />
evening, weekend, and summer classes.<br />
Policies and Procedures – Suspension of <strong>Services</strong><br />
The site review teams recommended to colleges that clear policy statements and<br />
procedures be followed regarding grounds for termination, and that the approved<br />
process be followed, including student rights for due process and appeal. The policy and<br />
procedures should be implemented in a manner that allows students to become aware<br />
of them prior to their enrollment date.<br />
Sign Language Interpreters and Real Time Captioners<br />
The cost and availability of qualified sign language interpreters for deaf and hearing<br />
impaired students continues to be an issue for many colleges. Finding and keeping<br />
interpreters is a shared concern of many colleges in rural or remote areas. The site<br />
review teams offered recommendations regarding pay scales, hourly minimums, prep<br />
time pay, no-show policies, provision of parking and mileage reimbursement, training<br />
new interpreters through a mentoring program, effective use of real-time captioning<br />
and evaluation of interpreter skills.<br />
Alternate Media<br />
Colleges expressed some concerns related to alternate media production, such as Braille<br />
and Electronic Text (E-text). Colleges reported increasing sophistication of students<br />
about technology options that are available and various alternate formats of print and<br />
non-print forms of instruction. The site review teams provided various sample alternate<br />
media policies to the colleges seeking assistance with this issue.<br />
General Assistive Technology and Campus-Wide Access to Computers<br />
The site review teams suggested that a technology plan be implemented that provides<br />
an adequate number of accessible workstations available for use by students with<br />
disabilities. The teams also suggested identifying the best ways to ensure universal<br />
computer access. One suggestion was to place all adaptive software on a server.<br />
<strong>Disabled</strong> <strong>Student</strong> <strong>Programs</strong> and <strong>Services</strong> | 2 0 1 0 | 23
As all lab computers are networked, they would therefore be available for use by any<br />
student with a disability. Certainly, networking provides a more universal approach to<br />
accessibility, however it may also present issues related to licensing and compatibility.<br />
Technical assistance from the High Tech Center Training Unit was also useful in<br />
developing strategies to ensure campus-wide technology access.<br />
Distance Education<br />
The site reviews included an overview of legal requirements for accessibility, advantages<br />
created by improving accessibility, and the importance of content preparation outside<br />
of the framework of online learning management systems, such as WebCT. Barriers<br />
identified included: how to achieve accessibility for students using various assistive<br />
technologies; and strategies for improving the capability for offering extended time for<br />
on-line quizzes. Utilizing its Program and Accountability and Development <strong>Services</strong><br />
funds, the Chancellor’s Office hired the Galvin Group to work collaboratively with the<br />
HTCTU at De Anza College to offer faculty WebCT training at two colleges.<br />
The site review teams provided guidance to the colleges regarding on-line course<br />
content, emphasizing that screen readers function most effectively in a web<br />
environment, so course material saved as HTML will be most accessible. Computer<br />
software features that allow accessible course structure were demonstrated and more<br />
complex style sheets were described.<br />
Section 508 Policies and Procedures<br />
Twelve colleges requested assistance with the development of comprehensive Section<br />
508 policy and procedures. Section 508 of the Rehabilitation Act was enacted by<br />
Congress in 1998 to require federal agencies to make their electronic and information<br />
technology accessible to people with disabilities. The law applies to all federal agencies<br />
when they develop, procure, maintain, or use electronic and information technology.<br />
Under Section 508, agencies must give employees with disabilities and members of the<br />
public with disabilities, access to information that is comparable to the access available<br />
to others. In 2002, <strong>California</strong> amended Government Code Section 11135 et. seq. to<br />
make the requirements of Section 508 applicable to public entities in <strong>California</strong>.<br />
The main challenge for each DSPS program was getting the campus at large involved in<br />
the initiation, development, and ongoing monitoring of compliance with the accessibility<br />
requirements of Section 508. Site review team members described the initiation and<br />
ongoing activities of the interdisciplinary task forces on their own campuses.<br />
24 | <strong>California</strong> <strong>Community</strong> Colleges Chancellor’s Office
<strong>Disabled</strong> <strong>Student</strong> <strong>Programs</strong> and <strong>Services</strong>:<br />
Conclusion<br />
2004 U.S. Census data indicates that approximately 10 percent of adults in <strong>California</strong><br />
have a disability. However, only 3.5 percent of those students who enroll in <strong>California</strong><br />
community colleges have a disability. A comparison of 2007/08 to 2008/09 data of DSPS<br />
students highlights these facts:<br />
• Non-credit class enrollment showed gains, 4.87 percent to 6.57 percent.<br />
• Full-time equivalent students increased, 9.22 percent to 12.81 percent, perhaps<br />
due to increased class offerings.<br />
Comparing data of DSPS students and non-disabled peers, we learn that:<br />
• DSPS students showed an 81.18 percent persistence rate compared to 65.47<br />
percent, and were only 2 percent less successful in completing units attempted.<br />
• DSPS students were more likely to complete degree and certificate goals, 10.37<br />
percent to 7.15 percent.<br />
The report also sheds light on what warrants further research:<br />
• DSPS students have difficulty compared with their nondisabled peers in<br />
completing both workforce development programs, 66.67 percent vs. 72.46<br />
percent, and basic skills classes, 36 percent vs. 47.49 percent.<br />
• Most troubling, although they are better transfer prepared (13.21 percent vs.<br />
10.25 percent), is that they actually transfer at a nine percent lower rate to fouryear<br />
postsecondary institutions.<br />
<strong>Student</strong>s with disabilities served by DSPS programs remain underrepresented in the<br />
<strong>California</strong> <strong>Community</strong> College population when compared to their incidence in the<br />
general population. A significant increase in students to be served by DSPS will require<br />
additional resources for the program. That it is worth the effort is evidenced by the fact<br />
that DSPS helps students earn certificates and degrees at higher rates than their nondisabled<br />
peers, as outlined in the data presented in this report. In most other outcome<br />
measures students with disabilities that are served by DSPS are performing as well and<br />
sometimes better than their peers without disabilities.<br />
<strong>Disabled</strong> <strong>Student</strong> <strong>Programs</strong> and <strong>Services</strong> | 2 0 1 0 | 25
This report provides a timely review of the many program, policy, and fiscal challenges<br />
facing DSPS programs. Through site reviews, college peer support, Chancellor’s Office<br />
technical assistance and training, and specialized consultation and support through<br />
targeted grants, we shall continue to assist colleges in making progress with meeting the<br />
needs of their students with disabilities.<br />
26 | <strong>California</strong> <strong>Community</strong> Colleges Chancellor’s Office
Acknowledgements<br />
Chancellor Jack Scott would like to acknowledge and thank those individuals who have made<br />
significant contributions to this report. In addition, the Chancellor’s Office staff would like to<br />
thank all those who participated in the <strong>Student</strong> <strong>Services</strong> Program Review & Technical<br />
Assistance Site Visits.<br />
Morgan Lynn<br />
Executive Vice Chancellor for <strong>Programs</strong><br />
The <strong>Student</strong> <strong>Services</strong> Division<br />
<strong>California</strong> <strong>Community</strong> Colleges Chancellor’s Office<br />
Linda Michalowski<br />
Vice Chancellor<br />
Jeff Spano<br />
Dean<br />
Scott Berenson<br />
DSPS Coordinator<br />
Catherine Campisi<br />
Retired Annuitant<br />
Scott Valverde<br />
Program Assistant II<br />
Michelle Ala’Chappelle<br />
Staff <strong>Services</strong> Analyst<br />
Randy Fong<br />
Fiscal Specialist<br />
Management Information Systems Division Staff<br />
Patrick Perry<br />
Vice Chancellor<br />
Myrna Huffman<br />
Administrator<br />
Vinod Verma<br />
Specialist<br />
Tom Norbert<br />
Specialist<br />
Jeannine Clemons<br />
Digital Composition Specialist<br />
Communications Division<br />
Terri M. Carbaugh<br />
Vice Chancellor<br />
Phawnda Moore<br />
Associate Editor of Publications<br />
<strong>Disabled</strong> <strong>Student</strong> <strong>Programs</strong> and <strong>Services</strong> | 2 0 1 0 | 27
28 | <strong>California</strong> <strong>Community</strong> Colleges Chancellor’s Office