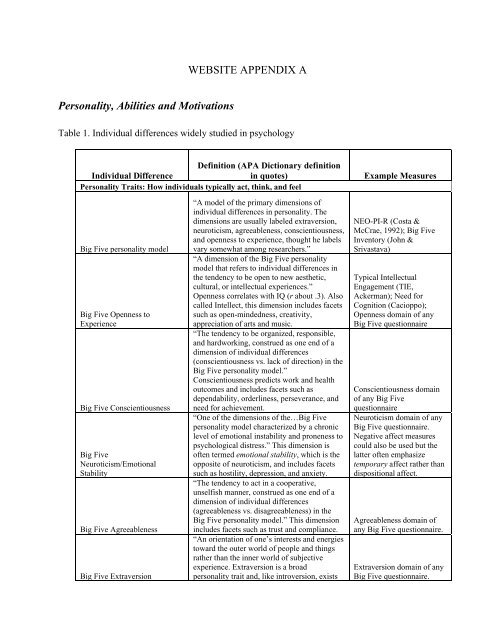
WEBSITE APPENDIX A Personality, Abilities and Motivations
WEBSITE APPENDIX A Personality, Abilities and Motivations
WEBSITE APPENDIX A Personality, Abilities and Motivations

You also want an ePaper? Increase the reach of your titles
YUMPU automatically turns print PDFs into web optimized ePapers that Google loves.
<strong>WEBSITE</strong> <strong>APPENDIX</strong> A<br />
<strong>Personality</strong>, <strong>Abilities</strong> <strong>and</strong> <strong>Motivations</strong><br />
Table 1. Individual differences widely studied in psychology<br />
Definition (APA Dictionary definition<br />
Individual Difference<br />
in quotes)<br />
<strong>Personality</strong> Traits: How individuals typically act, think, <strong>and</strong> feel<br />
Example Measures<br />
Big Five personality model<br />
Big Five Openness to<br />
Experience<br />
Big Five Conscientiousness<br />
Big Five<br />
Neuroticism/Emotional<br />
Stability<br />
Big Five Agreeableness<br />
Big Five Extraversion<br />
“A model of the primary dimensions of<br />
individual differences in personality. The<br />
dimensions are usually labeled extraversion,<br />
neuroticism, agreeableness, conscientiousness,<br />
<strong>and</strong> openness to experience, thought he labels<br />
vary somewhat among researchers.”<br />
“A dimension of the Big Five personality<br />
model that refers to individual differences in<br />
the tendency to be open to new aesthetic,<br />
cultural, or intellectual experiences.”<br />
Openness correlates with IQ (r about .3). Also<br />
called Intellect, this dimension includes facets<br />
such as open-mindedness, creativity,<br />
appreciation of arts <strong>and</strong> music.<br />
“The tendency to be organized, responsible,<br />
<strong>and</strong> hardworking, construed as one end of a<br />
dimension of individual differences<br />
(conscientiousness vs. lack of direction) in the<br />
Big Five personality model.”<br />
Conscientiousness predicts work <strong>and</strong> health<br />
outcomes <strong>and</strong> includes facets such as<br />
dependability, orderliness, perseverance, <strong>and</strong><br />
need for achievement.<br />
“One of the dimensions of the…Big Five<br />
personality model characterized by a chronic<br />
level of emotional instability <strong>and</strong> proneness to<br />
psychological distress.” This dimension is<br />
often termed emotional stability, which is the<br />
opposite of neuroticism, <strong>and</strong> includes facets<br />
such as hostility, depression, <strong>and</strong> anxiety.<br />
“The tendency to act in a cooperative,<br />
unselfish manner, construed as one end of a<br />
dimension of individual differences<br />
(agreeableness vs. disagreeableness) in the<br />
Big Five personality model.” This dimension<br />
includes facets such as trust <strong>and</strong> compliance.<br />
“An orientation of one’s interests <strong>and</strong> energies<br />
toward the outer world of people <strong>and</strong> things<br />
rather than the inner world of subjective<br />
experience. Extraversion is a broad<br />
personality trait <strong>and</strong>, like introversion, exists<br />
NEO-PI-R (Costa &<br />
McCrae, 1992); Big Five<br />
Inventory (John &<br />
Srivastava)<br />
Typical Intellectual<br />
Engagement (TIE,<br />
Ackerman); Need for<br />
Cognition (Cacioppo);<br />
Openness domain of any<br />
Big Five questionnaire<br />
Conscientiousness domain<br />
of any Big Five<br />
questionnaire<br />
Neuroticism domain of any<br />
Big Five questionnaire.<br />
Negative affect measures<br />
could also be used but the<br />
latter often emphasize<br />
temporary affect rather than<br />
dispositional affect.<br />
Agreeableness domain of<br />
any Big Five questionnaire.<br />
Extraversion domain of any<br />
Big Five questionnaire.
Social vitality<br />
Social dominance<br />
Need for<br />
Achievement/Ambition<br />
Delay of<br />
gratification/Impulsivity/Self-<br />
Control/Time Preference<br />
Sensation Seeking<br />
Perceived Self-efficacy/locus of<br />
control/optimism<br />
on a continuum of attitudes <strong>and</strong> behaviors.<br />
Extroverts are relatively more outgoing,<br />
gregarious, sociable, <strong>and</strong> openly expressive.”<br />
Roberts (2006) suggests that there are two<br />
aspects of Extraversion: social dominance <strong>and</strong><br />
social vitality. See below.<br />
A subdimension of Big Five Extraversion<br />
proposed by Roberts (2006) that includes<br />
facets such as sociability, positive effect, <strong>and</strong><br />
gregariousness.<br />
A subdimension of Big Five Extraversion that<br />
includes facets such as dominance,<br />
independent, <strong>and</strong> self-confidence, especially<br />
in social settings.<br />
“A strong desire to accomplish goals <strong>and</strong><br />
attain a high st<strong>and</strong>ard of performance <strong>and</strong><br />
personal fulfillment. People with high need for<br />
achievement undertake tasks in which there is<br />
a reasonable probability of success <strong>and</strong> avoid<br />
tasks that are too easy or too difficult”<br />
A facet of Big Five Conscientiousness. Desire<br />
to achieve difficult goals or reach high<br />
st<strong>and</strong>ards.<br />
“forgoing immediate reward in order to obtain<br />
a larger or more desirable reward in the<br />
future”<br />
A facet of either Neuroticism or<br />
Conscientiousness. When faced with a choice<br />
between immediate temptation <strong>and</strong> superior,<br />
deferred gratification, the ability to control<br />
behavior, attention, <strong>and</strong> thoughts in order to<br />
attain superior, deferred reward.<br />
“The tendency to search out <strong>and</strong> engage in<br />
thrilling activities as a method of increasing<br />
stimulation <strong>and</strong> arousal. It takes the form of<br />
engaging in highly stimulating activities<br />
accompanied by a perception of danger.” A<br />
facet of either Conscientiousness or<br />
Extraversion. Attraction to novel, intense<br />
experiences <strong>and</strong> willingness to take risks for<br />
them.<br />
Perceived Self Efficacy: “Subjective<br />
perception of own capability of performance<br />
or ability to attain results”. Locus of Control:<br />
“perception of how much control individuals<br />
have over conditions of their lives”. Possibly a<br />
facet of Neuroticism. The belief that one has<br />
control over outcomes. The opposite of<br />
helplessness.<br />
CPI Sociability Scale; NEO-<br />
PI-R Gregariousness <strong>and</strong><br />
Activity Scales<br />
NEO-PI-R Assertiveness<br />
scale; 16PF Dominance<br />
Scale<br />
Projective measures<br />
(unreliable),<br />
Conscientiousness subscales<br />
Marshmallow task<br />
(Mischel); UPPS Impulsive<br />
Behavior Subscale<br />
(Whiteside & Lynam); Self-<br />
Control Scale (Baumeister);<br />
Time Perspective Inventory<br />
(Zimbardo)<br />
Sensation-seeking Scale<br />
Generalized self-efficacy<br />
scales 41 , Rotter Locus of<br />
Control Scale, Attributional<br />
Style Questionnaire<br />
41 B<strong>and</strong>ura does not endorse any trait-level scales<br />
1
Regulatory Focus<br />
Affect, Well-Being<br />
Self-esteem<br />
Temperament (childhood)<br />
Psychopathology<br />
Orientation toward either promotion of<br />
positive outcomes or prevention of negative<br />
outcomes.<br />
Positive affect is the internal feeling state that<br />
occurs when a goal has been attained, a source<br />
if threat has been avoided or the individual is<br />
satisfied with the present state of affairs”<br />
Positive affect includes emotions such as joy,<br />
contentment, <strong>and</strong> pride. Negative effect,<br />
which is only moderately inversely correlated<br />
with positive effect, includes fear, anxiety,<br />
sadness, etc. Life satisfaction is a cognitive,<br />
not affective, appraisal of the quality of one’s<br />
life. Well-being is characterized by the<br />
presence of positive effect, the absence of<br />
negative effect, <strong>and</strong> positive life satisfaction.<br />
“The degree to which the qualities <strong>and</strong><br />
characteristics contained in one’s self concept<br />
are perceived to be positive”<br />
One's estimation of one's own self-worth. A<br />
construct that enjoyed tremendous popularity<br />
in the 1970ss but since has been considered<br />
epiphenomenal not causal. A minority of<br />
psychologists consider positive <strong>and</strong> negative<br />
evaluations of the self to be the sixth <strong>and</strong><br />
seventh factors of personality. Possibly<br />
grouped with self-efficacy, etc.<br />
“Basic foundation of personality, usually<br />
assumed to be biologically determined <strong>and</strong><br />
present early in life[…] Includes<br />
characteristics such as energy level, emotional<br />
responsiveness, response tempo <strong>and</strong><br />
willingness to explore”<br />
Precursors to personality traits, temperament<br />
variables are patterns in behavior or affect that<br />
appear early in life that are assumed to have a<br />
neurobiological basis. There are fewer<br />
temperament variables than personality traits<br />
because these individual differences are less<br />
salient <strong>and</strong> stable in children than in adults.<br />
“Patterns of behavior or thought processes<br />
that are abnormal or maladaptive”. A broad<br />
category comprising dysfunctional patterns of<br />
thought, feeling, or behavior. Most disorders<br />
are included in the DSM-IV manual. Axis I<br />
disorders (e.g., depression) are more intense<br />
<strong>and</strong> episodic/discreet, whereas Axis II<br />
disorders (i.e., personality disorders) are more<br />
tonic <strong>and</strong> enduring.<br />
Regulatory Focus<br />
Questionnaire (Higgins et<br />
al., 2001)<br />
PANAS (Watson, Clark, &<br />
Tellegen) for positive <strong>and</strong><br />
negative affect; SWLS<br />
(Diener) for life satisfaction<br />
Rosenberg Self-Esteem<br />
Scale<br />
Children's Behavior<br />
Questionnaire<br />
Beck Depression Inventory;<br />
Beck Anxiety Inventory;<br />
MMPI (omnibus measure);<br />
Child Behavior Checklist<br />
(Achenbach)<br />
2
Myers-Briggs Type Indicator<br />
(MPTI)<br />
Type A/Type B personality<br />
Intelligence, General Mental<br />
Ability, “g”, IQ<br />
Specific mental abilities<br />
Creativity<br />
“A personality test designed to classify<br />
individuals according to their expressed<br />
choices between contrasting alternatives in<br />
certain categories of traits. The categories,<br />
based on Jungian typology, are extraversion-<br />
Introversion, Sensing-Intuition, Thinking-<br />
Feeling, <strong>and</strong> Judging-Perceiving…The test has<br />
little credibility among research psychologists<br />
but is widely used in educational counseling<br />
<strong>and</strong> human resource management…”<br />
Type A personality is “a personality pattern<br />
characterized by chronic competitiveness,<br />
high levels of achievement motivation, <strong>and</strong><br />
hostility.” Type B personality is “a personality<br />
pattern characterized by low levels of<br />
competitiveness <strong>and</strong> frustration <strong>and</strong> a relaxed,<br />
easy going approach.”<br />
Intelligence <strong>and</strong> general mental ability both<br />
refer to “the ability to derive information,<br />
learn from experience, adapt to the<br />
environment, underst<strong>and</strong> <strong>and</strong> correctly utilize<br />
thought <strong>and</strong> reason.” “g” (“general factor”)<br />
refers to the first factor extracted from a factor<br />
analysis of cognitive tasks, which many<br />
researchers consider to represent general (vs.<br />
specific) intelligence.”It represents<br />
individuals’ abilities to perceive relationships<br />
<strong>and</strong> to derive conclusions from them. It is the<br />
basic ability that underlies the performance of<br />
different intellectual tasks”<br />
“ Intelligence quotient (IQ) refers to one’s<br />
intelligence relative to one’s age group<br />
(especially for children) but can also be used<br />
synonymously with intelligence.<br />
“<strong>Abilities</strong> as measured by tests of an<br />
individual in areas of spatial visualization,<br />
perceptual need, number facility, verbal<br />
comprehension, word fluency, memory,<br />
inductive reasoning <strong>and</strong> so forth”<br />
An umbrella category for lower-level mental<br />
abilities, including math, verbal, <strong>and</strong> spatial<br />
abilities, as well as even more specific mental<br />
capacities. 42<br />
“Ability to produce original work, theories,<br />
techniques or thoughts […] Related with<br />
imagination, expressiveness, originality.”<br />
Ability to generate novel ideas <strong>and</strong> behaviors<br />
that solve problems.<br />
MBTI<br />
WISC, WAIS, Raven’s<br />
Progressive Matrices,<br />
ASVAB<br />
Subtest scores on IQ tests<br />
Creative <strong>Personality</strong> Scale<br />
(Gough, 1979)<br />
42 Cattell considered fluid (capacity to learn) <strong>and</strong> crystallized intelligence (knowledge) to be second-order aspects of<br />
intelligence.<br />
3
Executive Function<br />
Cognitive reflection<br />
Emotional Intelligence<br />
“Higher level cognitive processes that<br />
organize <strong>and</strong> order behavior, including logic<br />
<strong>and</strong> reasoning, abstract thinking, problem<br />
solving, planning <strong>and</strong> carrying out <strong>and</strong><br />
terminating goal directed behavior” Broad set<br />
of higher-level cognitive capacities attributed<br />
to the prefrontal cortex, often involving the<br />
coordination <strong>and</strong> management of lower-level<br />
processes.<br />
A specific mental ability. The tendency to<br />
reflect before taking an intuitive answer as<br />
correct.<br />
“Ability to process emotional information <strong>and</strong><br />
use it in reasoning <strong>and</strong> other cognitive<br />
activities. According to Mayer <strong>and</strong> Slovey<br />
1997 model it comprises four abilities: to<br />
perceive <strong>and</strong> appraise emotions accurately, to<br />
access <strong>and</strong> evoke emotions when they<br />
facilitate cognition, to comprehend emotional<br />
language <strong>and</strong> make use of emotional<br />
information, <strong>and</strong> to regulate one’s own <strong>and</strong><br />
others’ emotions to promote growth <strong>and</strong> wellbeing”<br />
Ability to perceive emotion, to<br />
integrate it in thought, to underst<strong>and</strong> it <strong>and</strong> to<br />
manage it (Mayer)<br />
Innumerable<br />
neuropsychology tasks (e.g.,<br />
go/no-go, Stroop,<br />
Continuous Performance<br />
Task)<br />
Cognitive Reflection Test<br />
(Frederick, 2005)<br />
MSCEIT (Mayer &<br />
Salovey) but really there are<br />
no good measures<br />
Motivation – What individuals want to do, feel, or think<br />
“A moral, social or aesthetic principle<br />
accepted by an individual (or society) as a<br />
guide to what is good, desirable or important.”<br />
What individuals feel is important in a moral<br />
Values<br />
sense.<br />
“Attitude characterized by a need to give<br />
selective attention to something that is<br />
significant to the individual”.<br />
What spontaneously attracts <strong>and</strong> holds one’s<br />
Interests<br />
attention, <strong>and</strong> is considered pleasant.<br />
Goal: “The end state toward which a human is<br />
striving” Motive:”physiological or<br />
psychological state of arousal that directs an<br />
organism’s energies toward a goal”.<br />
What individuals aim to achieve or<br />
experience. Examples include need for<br />
power, need for affiliation, <strong>and</strong> need for<br />
achievement. Note that many consider need<br />
Goals, Needs, Motives for achievement as an aspect of personality.<br />
Values in Action Inventory<br />
of Strengths<br />
Self-Directed Search, Strong<br />
Interest Inventory<br />
Thematic Apperception Test<br />
(TAT), need for<br />
achievement questionnaires<br />
4
Figure 1<br />
Problem similar to the Raven’s Progressive Matrices test items<br />
Note: The bottom right entry of this 3x3 matrix of figures is missing <strong>and</strong> must be selected<br />
from among 8 alternatives. Looking across the rows <strong>and</strong> down the columns, the test taker<br />
attempts to determine the underlying pattern <strong>and</strong> then pick the appropriate missing piece.<br />
The correct answer to this problem is 5. Figure taken from Carpenter, Just, <strong>and</strong> Shell<br />
(1990), used with permission of the publisher, copyright American Psychological<br />
Association.
Measurement Error Can Create the Illusion of Multiple Factors when Only One is<br />
Operative<br />
If some outcome Y<br />
j<br />
is predicted by f k<br />
, <strong>and</strong> there are multiple mismeasured<br />
proxies for f<br />
k<br />
, those proxies will be predictive for Y<br />
j<br />
even though only one factor<br />
generates the outcome. Thus, if the following relationship holds between Y j <strong>and</strong> f k , where<br />
U<br />
j<br />
is statistically independent of f<br />
k<br />
,<br />
Y f U ,<br />
j k j<br />
<strong>and</strong> we use N Q-adjusted proxies for f<br />
k<br />
n<br />
n n n n<br />
M M ( Q)<br />
f <br />
k k k k k k<br />
n<br />
where <br />
k<br />
is independent of f k<br />
, has mean zero <strong>and</strong> variance<br />
n<br />
means of the measures to depend on Q ( ( Q))<br />
, we obtain an equation<br />
k<br />
N<br />
n<br />
Y <br />
j<br />
nM k U<br />
j ,<br />
n1<br />
<br />
2<br />
n<br />
k<br />
, where we allow the<br />
where U j <br />
fk U<br />
j<br />
<strong>and</strong> where the true values of <br />
n<br />
are all zero, because the test scores<br />
do not determine Y<br />
j<br />
but instead f<br />
k<br />
determines it unless 0 . Straightforward<br />
calculations show that under general conditions, if one arrays the <br />
n<br />
in a vector of length<br />
N, γ N , <strong>and</strong> the Q-adjusted test scores in a vector of length N, denoted M , the OLS<br />
estimator<br />
<br />
N<br />
1<br />
<br />
<br />
Cov M, M Cov M , Y n<br />
<br />
converges in large samples to
2<br />
2 1 2 1 2 2 1 N 2<br />
1 k <br />
f<br />
<br />
k kk f<br />
<br />
k kk <br />
f<br />
k<br />
k<br />
<br />
1<br />
1 2 2 2 2<br />
2<br />
2<br />
<br />
<br />
k<br />
N<br />
2<br />
<br />
2<br />
kk <br />
f<br />
<br />
k<br />
k<br />
<br />
<br />
fk<br />
plim <br />
<br />
<br />
k<br />
f<br />
.<br />
k<br />
<br />
<br />
<br />
k<br />
<br />
<br />
<br />
<br />
N <br />
1 L 2 2 N<br />
2<br />
2<br />
<br />
kk <br />
f<br />
<br />
N <br />
k<br />
k<br />
<br />
f<br />
<br />
k<br />
k <br />
1<br />
Assuming<br />
2<br />
0,<br />
0<br />
<strong>and</strong> 0 , for all n1, , N , any error-ridden predictor of<br />
2<br />
f k<br />
n<br />
k<br />
f<br />
k<br />
will be statistically significant in a large enough sample. Using a purely predictive<br />
criterion to determine personality traits produces a proliferation of “significant”<br />
predictors for outcome Y<br />
j<br />
, as is found in the psychological studies that we survey in the<br />
text. Cunha <strong>and</strong> Heckman (this issue) show that estimated measurement errors in both<br />
cognitive <strong>and</strong> noncognitive tests are important so that the problem of proxy proliferation<br />
using a predictive criterion is serious. Under such a criterion, many “significant”<br />
predictors of an outcome can be found that are all proxies for a single latent construct.<br />
If, in addition to these considerations, the measures fail discriminant validity, the<br />
predictors for one outcome may proxy both f<br />
k<br />
<strong>and</strong> f k<br />
k<br />
k<br />
if f<br />
k<br />
<strong>and</strong> f k<br />
are<br />
correlated. We present evidence in the text, Section III, that IQ tests proxy both cognitive<br />
<strong>and</strong> personality factors. A purely predictive criterion fails to distinguish predictors for<br />
clusters associated with the f<br />
k<br />
from predictors for clusters proxying the fk<br />
. Thus, items<br />
in one cluster can be predictive of outcomes more properly allocated to another cluster.<br />
Accounting for Reverse Causality<br />
A test score may predict an outcome because the outcome affects the test score.<br />
Hansen, Heckman, <strong>and</strong> Mullen (2004) analyze a model in which, in the previous<br />
representation, the outcome being related to cluster (factor) k, say Y<br />
j<br />
, is an element of Q
n<br />
n<br />
<strong>and</strong> determines <br />
k<br />
( Q)<br />
<strong>and</strong> <br />
k<br />
( Q)<br />
. In addition, they allow (factor) f<br />
k<br />
to be a<br />
determinant of Y<br />
j<br />
. They establish conditions under which it is possible to identify causal<br />
effects of f<br />
k<br />
on Y<br />
j<br />
when the proxies for f<br />
k<br />
suffer from the problem of reverse causality<br />
n<br />
n<br />
because the Q in ( Q)<br />
<strong>and</strong> ( Q)<br />
may include Y<br />
j<br />
among its components. They<br />
k<br />
k<br />
establish that tests of cognitive ability (e.g., AFQT) are substantially affected by<br />
schooling levels at the date the test is taken.<br />
To underst<strong>and</strong> how their method works at an intuitive level, consider the effect of<br />
schooling on measured test scores. Schooling attainment likely depends on true or<br />
“latent” ability, f<br />
k<br />
. At the same time, the measured test score depends on schooling<br />
n<br />
n<br />
attained so it affects ( Q)<br />
or ( Q)<br />
or both. Hansen, Heckman, <strong>and</strong> Mullen (2004)<br />
k<br />
k<br />
assume access to longitudinal data that r<strong>and</strong>omly sample the population. Included in the<br />
sample are adolescents. At the time the adolescents are given the test, persons who<br />
eventually attain the same schooling level are at different grade levels at the date of the<br />
test because the longitudinal sample includes people of different ages <strong>and</strong> schooling<br />
levels. From the longitudinal data we can determine final schooling levels. Final<br />
schooling levels are assumed to depend on latent ability f k<br />
. Conditional on the final<br />
schooling level attained, schooling levels at the date of the test are r<strong>and</strong>om with respect to<br />
f<br />
k<br />
because the sampling rule is r<strong>and</strong>om across ages at a point in time. One can identify<br />
the causal effect of schooling on test scores from the effect of variation in the years of<br />
education attained at the date of test on test scores for persons who attain the same final<br />
schooling level. See Hansen, Heckman, <strong>and</strong> Mullen (2004) for additional details on this<br />
method <strong>and</strong> alternative identification strategies. The basic idea of their procedure is to
model the dependence between Q <strong>and</strong> f<br />
k<br />
<strong>and</strong> to solve the problem of reverse causality<br />
using this model. Heckman, Stixrud <strong>and</strong> Urzua (2006) develop this method further.<br />
Cunha <strong>and</strong> Heckman (2007) <strong>and</strong> Cunha, Heckman <strong>and</strong> Schennach (2006) extend this<br />
procedure to allow f<br />
k<br />
to evolve over time through investment <strong>and</strong> experience.
a) <strong>Personality</strong><br />
a1. “BIG FIVE”:<br />
The literature on personality psychology widely adopts “the big five” as a taxonomy for describing one’s<br />
personality traits.<br />
The idea is that there are five big dimensions over which personality can be studied. These dimensions are<br />
openness to experience, conscientiousness, neuroticism, agreeableness <strong>and</strong> extraversion.<br />
Each dimension is then subdivided in lower level traits called “facets”. While there is a relatively broad<br />
consensus over the big five, there is still a wide disagreement over which facets correspond to each<br />
dimension. In the present scheme, we propose one of the possible lower order structure.<br />
Measures for the big five:<br />
- Big Five Inventory, 44 items questionnaire at page 70 of John O., Srivastava S., (1999): “The Big Five<br />
Traits Taxonomy: History, Measurement, <strong>and</strong> Theoretical Perspectives”:<br />
http://www.uoregon.edu/~sanjay/pubs/bigfive.pdf<br />
- NEO-PI-R (Costa, McCrae, 1992), 240 items. It measures not only the Big Five, but also six "facets" of<br />
each of the Big Five. Commercial product not publicly available. See<br />
http://www3.parinc.com/products/product.aspx?Productid=NEO-PI-R<br />
- NEO FFI, 60 items only measuring the big five. Also not publicly available.<br />
http://www3.parinc.com/products/product.aspx?Productid=NEO-SS_PIR-FFI<br />
For a general introductory literature on the “big five”:<br />
- Costa P., McCrae R. (1999), “A five factors model of personality”, H<strong>and</strong>book of <strong>Personality</strong>, Theory<br />
<strong>and</strong> research, Guilford Press, New York.<br />
- Digman J., (1990) “<strong>Personality</strong> Structure: Emergency of the Five factor model”, Annual Review of<br />
Psychology 41, 417-440<br />
- Goldberg L.R., (1990), “An alternative description of personality: the big five factor structure”, Journal<br />
of <strong>Personality</strong>, 59(6), 1216-1229<br />
- John O., Srivastava S., (1999), “The big five trait taxonomy: history, measurement <strong>and</strong> Theoretical<br />
Perspectives”, 102-139 in “H<strong>and</strong>book of personality: Theory <strong>and</strong> research”, Guilford Press, New York.<br />
- John O., (1989) “Towards a taxonomy of <strong>Personality</strong> Descriptors”, in Buss <strong>and</strong> Cantor Eds, <strong>Personality</strong><br />
Psychology: Recent trends <strong>and</strong> Emerging Directions”, 261-271, Springer, NY.<br />
- John O., Goldber L.R., (1991)” Is there a level of personality description?”, Journal of <strong>Personality</strong> <strong>and</strong><br />
Social Psychology 60, 348-361<br />
- Srivastava, S. (2006). Measuring the Big Five <strong>Personality</strong> Factors. Retrieved from<br />
http://www.uoregon.edu/~sanjay/bigfive.html<br />
For a discussion of facets:<br />
- Costa, McCrae,Dye,(1992). “Facet scales for agreeableness <strong>and</strong> conscientiousness: A revision of the<br />
NEO <strong>Personality</strong> Inventory”. <strong>Personality</strong> <strong>and</strong> Individual Differences, 12, 887-898.<br />
- Costa, McCrae (1995): “Domains <strong>and</strong> facets: Hierarchical <strong>Personality</strong> Assessment using the revised<br />
NEO PI”, Journal of <strong>Personality</strong> Assessment 64, 21-50<br />
For further readings on the links between big five <strong>and</strong> smoking, crime, scholastic achievement <strong>and</strong><br />
labor market outcomes.:<br />
1) on smoking <strong>and</strong> alcohol use:<br />
- T. Trull , C. Waudby, K. Sher K. (2004): “ Alcohol, Tobacco <strong>and</strong> Drug use disorders <strong>and</strong> personality<br />
disorder symptoms” Experimental <strong>and</strong> Clinical Psychopharmacology 12 (1), 65-75; for a review.<br />
5
- Zuckermann M., (1993) “Behavioral expression <strong>and</strong> biosocial bases of sensation seeking” New York,<br />
Cambridge University Press<br />
2) on crime<br />
- Gottfredson <strong>and</strong> Hirschi 1990, “ A General Theory of Crime”, Stanford, CA: Stanford University Press;<br />
on relationship between self control <strong>and</strong> crime<br />
- Schaeffer C., Petras H., Ialongo N., Poduscka J., Kellman S., (2003), “Modeling Growth in Boys’<br />
Aggressive Behavior Across Elementary School: Links to Later Criminal Involvement, Conduct<br />
Disorder <strong>and</strong> Antisocial <strong>Personality</strong> Disorder” Developmental Psychology 39 (6): 1020-1035; on<br />
relationship between aggression <strong>and</strong> crime<br />
3) on scholastic achievement<br />
- Borghans L., Meijers H. <strong>and</strong> Ter Weel B., (2006), “The role of non cognitive skills in explaining non<br />
cognitive test scores” Maastricht University working paper, Maastricht, the Netherl<strong>and</strong>s.<br />
- Duckworth A., Seligman M.(2005),” Self Discipline outdoes IQ in predicting Academic Performance in<br />
Adolescents” Psychological Science 16, 934-944; on self control <strong>and</strong> scholastic achievement<br />
- Noftle <strong>and</strong> Robins, in press. I can’t find it!<br />
- Wolfe R. <strong>and</strong> Johnson S., (1995), “<strong>Personality</strong> as a Prediction of College Performance”, Educational <strong>and</strong><br />
Psychological Measurement, 55 (2), 177-185<br />
4) on labor market performance<br />
- Barrick, Mount, (1991) “ The big five personality dimensions <strong>and</strong> job performance”, Personnel<br />
Psychology, Blackwell Synergy.<br />
- Roberts B., Wood D., Smith J.(2005) “Evaluating Five Factor Theory <strong>and</strong> Social Investment<br />
Perspectives on <strong>Personality</strong> Trait Development”, Journal of Research on <strong>Personality</strong> 39: 166-184<br />
- Barrick, Higgins, Murray, Chad, Judge, Thoresen (1999) “The Big Five <strong>Personality</strong> Traits, General<br />
Mental Ability <strong>and</strong> Career Success across the Life Span”, Personnel Psychology, 52<br />
Roberts, B. W., & Robins, R. W. (2000). Broad dispositions, broad aspirations: The intersection of the<br />
Big Five dimensions <strong>and</strong> major life goals. <strong>Personality</strong> <strong>and</strong> Social Psychology Bulletin, 26, 1284-1296.<br />
- Roberts, B. W., & Robins, R. W. (2004). A longitudinal study of person-environment fit <strong>and</strong><br />
personality development”. Journal of <strong>Personality</strong>, 72, 89-110.<br />
DOMAINS OF THE BIG FIVE:<br />
1. Openness to experience<br />
“A dimension of the Big Five personality model that refers to individual differences in the tendency to<br />
be open to new aesthetic, cultural, or intellectual experiences.” (APA Dictionary)<br />
It is the Big Five domain that correlates most with IQ (r about .3). It is also called Intellect. Includes<br />
facets such as open-mindedness, creativity, appreciation of arts <strong>and</strong> music.<br />
For its correlation with openness to experience, authors include into this category also J. Cacioppo’s<br />
need for cognition concept: an individual's tendency to engage in <strong>and</strong> enjoy effortful cognitive<br />
endeavours. For a measure of need for cognition see the 18 items questionnaire at Cacioppo, Kao,<br />
Petty (1984), - http://www.leaonline.com/doi/pdfplus/10.1207/s15327752jpa4803_13.<br />
Another measure related to openness to experience is the TIE, Typical Intellectual Engagement (see<br />
Ackerloff <strong>and</strong> Goff, 1992, 1994)<br />
For readings on Openness to Experience:<br />
- Cacioppo, Kao, Petty, (1984), “An efficient assessment for need for cognition”, Journal of <strong>Personality</strong><br />
Assessment, 48 (3) http://www.leaonline.com/doi/pdfplus/10.1207/s15327752jpa4803_13<br />
- Elias, Loomis (2002) : Utilizing Need for Cognition <strong>and</strong> Perceived Self-Efficacy to Predict Academic<br />
Performance, Journal of Applied Social Psychology 32 (8), 1687–1702.<br />
- Goff, Ackerman, (1992), “Typical Intellectual Engagement (TIE) measure”, Journal of Educational<br />
Psychology 84(4), December 1992, 537–552<br />
2. Conscientiousness<br />
“The tendency to be organized, responsible, <strong>and</strong> hardworking, construed as one end of a dimension of<br />
individual differences (conscientiousness vs. lack of direction) in the Big Five personality model.”<br />
(APA Dictionary)<br />
Conscientiousness is the Big Five domain that best predicts work <strong>and</strong> health outcomes.<br />
6
Most of the work on conscientiousness is done by Brent Roberts. His website link below is a good<br />
source for further readings.<br />
Two well studied facets empirically related to conscientiousness are need for achievement <strong>and</strong> delay<br />
for gratification.<br />
- Need for achievement is defined as “A strong desire to accomplish goals <strong>and</strong> attain a high st<strong>and</strong>ard of<br />
performance <strong>and</strong> personal fulfillment. People with high need for achievement undertake tasks in which<br />
there is a reasonable probability of success <strong>and</strong> avoid tasks that are too easy or too difficult”<br />
- while Delay for gratification is the ability of foregoing immediate reward in order to obtain a larger or<br />
more desirable reward in the future” (APA Dictionary)<br />
The “Marshmallow test” (Mischel 1989) was the first study of the relationship between delayed<br />
gratifications <strong>and</strong> outcomes later in life. See literature below. There is no single measure for delay of<br />
gratification.<br />
As for need for achievement, it is usually measured by McClell<strong>and</strong> N-Ach Tematic Apperception Test<br />
(TAT), a projective test that however has come under serious critique from mainstream psychology.<br />
For readings on Conscientiousness<br />
- Brent Roberts papers on conscientiousness are available at his<br />
website,http://www.psych.uiuc.edu/~broberts/Brent%20W%20Roberts%20Research%20Interests.htm<br />
- Need for Achievement:<br />
- McClell<strong>and</strong>, D.C. (1961) The achieving society. Princeton: Van Nostr<strong>and</strong>.<br />
- McClell<strong>and</strong>, D. C., Atkinson, J. W., Clark, R. A., & Lowell, E. L. (1958). A scoring manual for the<br />
achievement motive; in J. W. Atkinson (Ed.), Motives in Fantasy, Action <strong>and</strong> Society. New York: Van<br />
Nostr<strong>and</strong>.<br />
- Costa <strong>and</strong> McCrae, (1992) “ NEO PI-R professional manual”. Odessa, FL: Psychological Assessment<br />
Resources, Inc.<br />
- Delay of Gratification:<br />
- Mischel, Shoda, Rodriguez,. (1989). “Delay of gratification in children”. Science, 244, 933-938.<br />
- Funder, Block (1989) “The role of Ego-Control, Ego-Resiliency <strong>and</strong> IQ Delay of Gratification in<br />
Adolescence”. Journal of <strong>Personality</strong> <strong>and</strong> Social Psychology, 57(6), 1041–1050. A delay gratification<br />
experiment with 14 years old adolescent, evidence that delay behaviour is related with IQ.<br />
- Self Control:<br />
- Roy Baumesteir at http://www.psy.fsu.edu/~baumeistertice/<br />
3. Neuroticism<br />
Neuroticism is “characterized by a chronic level of emotional instability <strong>and</strong> proneness to psychological<br />
distress.” (APA Dictionary)<br />
It describes the tendency to feel negative emotions, such as anxiety, fear, sadness, <strong>and</strong> hostility,<br />
particularly when under stress.<br />
Facets empirically loading on neuroticism are self efficacy <strong>and</strong> locus of control. Although some<br />
literature considers these measures as independent traits of personality, they are much correlated with<br />
each other (with a correlation of about r=.6), as they both refer to the belief to have outcomes under<br />
control. Perceived Self Efficacy (B<strong>and</strong>ura, A.) is the “Subjective perception of own capability of<br />
performance or ability to attain results”. Self Efficacy is case dependent (one can have highs elf efficacy<br />
in one field but low in another). It is emphasized that self efficacy is different from ability. For example,<br />
some studies have documented that, given ability, girls have lower measure of self efficacy than boys<br />
(Pajares, 1996, among others). Locus of Control is the “perception of how much control individuals<br />
have over conditions of their lives”.<br />
Locus of Control can be internal or external. If internal, the individual attributes events to his own<br />
control: success or insuccess is a consequence of his or her actions. If external, the individual believes<br />
instead that outcomes are a consequence of good or bad luck.<br />
Measures for perceived self efficacy <strong>and</strong> locus of control:<br />
Perceived Self efficacy:<br />
B<strong>and</strong>ura does not endorse <strong>and</strong> trait specific scales, but generalized self efficacy scales can be found into<br />
the “Self Efficacy Measures” paragraph of the website on self efficacy:<br />
http://www.des.emory.edu/mfp/self-efficacy.html<br />
Locus of Control:<br />
7
Rotter has a 29 items questionnaire to measure locus of control, available at<br />
http://wilderdom.com/psychology/loc/RotterLOC29.html<br />
For a measure of optimism: Seligman M., Abramson L., Semmel A., von Baeyer C., Peterson C.:<br />
“Attributional Style Questionnaire: description <strong>and</strong> assessment”, Cognitive Therapy 6(3), 287-299.<br />
http://www.springerlink.com.proxy.uchicago.edu/content/t372377276jp6636/?p=aded4ffddd064fe8be8<br />
3883d5bb91b78&pi=4<br />
For reading on the facets of self efficacy <strong>and</strong> locus of control:<br />
- B<strong>and</strong>ura A., 1977, “Self-efficacy: Toward a unifying theory of behavioral change”<br />
Psychological Review, 84 (2), 191-215<br />
- All of B<strong>and</strong>ura’ publications can be found in his website: http://www.des.emory.edu/mfp/banpubs.html<br />
- Website on self efficacy: http://www.des.emory.edu/mfp/self-efficacy.html<br />
- Rotter, J.B. (1966). "Generalized expectancies of internal versus external control of reinforcements".<br />
- Judge, Bono, Thoresen (2002), “Are Measures of Self-Esteem, Neuroticism, Locus of Control, <strong>and</strong><br />
Generalized Self-Efficacy Indicators of a Common Core Construct?” Journal of <strong>Personality</strong> <strong>and</strong> Social<br />
Psychology, 83(3)<br />
4. Agreeableness<br />
“The tendency to act in a cooperative, unselfish manner, construed as one end of a dimension of<br />
individual differences (agreeableness vs. disagreeableness) in the Big Five personality model.” This<br />
dimension includes facets such as trust <strong>and</strong> compliance. (APA Dictionary)<br />
5. Extraversion<br />
“An orientation of one’s interests <strong>and</strong> energies toward the outer world of people <strong>and</strong> things rather than<br />
the inner world of subjective experience. Extraversion is a broad personality trait <strong>and</strong>, like introversion,<br />
exists on a continuum of attitudes <strong>and</strong> behaviors. Extroverts are relatively more outgoing, gregarious,<br />
sociable, <strong>and</strong> openly expressive.” (APA dictionary)<br />
Roberts (2006) suggests that there are two aspects of Extraversion: Social Dominance <strong>and</strong> Social<br />
Vitality.<br />
- Social Dominance: describes dominance, independent, <strong>and</strong> self-confidence, especially in social<br />
settings. See NEO PI for a measure.<br />
- Social Vitality: describes sociability, positive effect, <strong>and</strong> gregariousness. See NEO PI <strong>and</strong> CPI<br />
(California Psychological Inventory) sociability scale for a measure.<br />
A third facet is empirically related to both extraversion <strong>and</strong> conscientiousness:<br />
- Sensation Seeking: “the tendency to search out <strong>and</strong> engage in thrilling activities as a method of<br />
increasing stimulation <strong>and</strong> arousal. It takes the form of engaging in highly stimulating activities<br />
accompanied by a perception of danger” (APA Dictionary). Zuckermann is the main author for<br />
sensation seeking: he is also the creator of a sensation seeking scale:<br />
- Zuckerman (1979) “Sensation seeking: beyond the optimal level of arousal”. Hillsdale, NJ:Erlbaum. The<br />
scale is online at<br />
http://www.rta.nsw.gov.au/licensing/tests/driverqualificationtest/sensationseekingscale/<br />
Zuckermann has recently published a book on sensation seeking <strong>and</strong> risky behaviour:<br />
- Zuckermann M. (2006) “Sensation Seeking <strong>and</strong> Risky Behavior”, Washington, DC : American<br />
Psychological Association.<br />
a2. POSITIVE AFFECT, WELL BEING AND HAPPINESS<br />
“Positive effect is the internal feeling state that occurs when a goal has been attained, a source if threat<br />
has been avoided or the individual is satisfied with the present state of affairs”<br />
Positive affect includes emotions like joy, contentment, <strong>and</strong> pride. Negative affect, which is only<br />
moderately inversely correlated with positive emotions, includes fear, anxiety, sadness, etc. Life<br />
satisfaction (Diener, Seligman) is a cognitive, not affective, appraisal of the quality of one’s life. Wellbeing<br />
is the presence of positive effect, the absence of negative <strong>and</strong> positive life satisfaction.<br />
Measures:<br />
8
- SWLS, “Satisfaction with life scale”, (Ed Diener). A 5 questions cognitive, not affective, appraisal of<br />
the quality of one’s life: http://www.psych.uiuc.edu/~ediener/hottopic/hottopic.html<br />
- PANAS, “Positive <strong>and</strong> Negative Affect Schedule” (Watson, Clark, & Tellegen) for positive <strong>and</strong><br />
negative effect. For presentation <strong>and</strong> for example of PANAS see:<br />
http://www.psychology.uiowa.edu/Faculty/Watson/PANAS-X.pdf<br />
Literature:<br />
- Websites, with links to publications:<br />
http://www.authentichappiness.sas.upenn.edu/<br />
http://www.centreforconfidence.co.uk/pp/contributors.php<br />
http://www.enpp.org/<br />
- Snyder, C. R., Lopez, S. J. (Eds.). H<strong>and</strong>book of positive psychology. New York: Oxford University<br />
Press.<br />
- Feldman Barrett L., Russell J., (1999), “The Structure of Current Affect: Controversies <strong>and</strong> Emerging<br />
Consensus”, Current Directions in Psychological Science 8 (1), 10–14.<br />
- Feldman Barrett L., Mesquita B., Ochsner K., Gross J., (2007) “The Experience of Emotion” Annual<br />
Review of Psychology 58:1, 373<br />
a3. SELF ESTEEM<br />
“The degree to which the qualities <strong>and</strong> characteristics contained in one’s self concept are perceived to<br />
be positive”<br />
Self-esteem is a positive or negative orientation toward oneself: an overall evaluation of one's worth or<br />
value<br />
It is a construct that enjoyed tremendous popularity in the 1970ss but since has been considered<br />
epiphenomenal not causal. A minority of psychologists consider positive <strong>and</strong> negative evaluations of<br />
the self to be the sixth <strong>and</strong> seventh factors of personality.<br />
It is measured with Self Esteem Rosemberg Scale. Link at:<br />
http://www.atkinson.yorku.ca/~psyctest/rosenbrg.pdf<br />
Literature:<br />
- Baumeister, Campbell, Krueger, Vohs, (2003). “Does High Self-esteem Cause Better Performance,<br />
Interpersonal Success, Happiness, or Healthier Lifestyles?” Psychological Science in the Public<br />
Interest, 4, 1-44. http://www.psy.fsu.edu/~baumeistertice/baumeisteretal2003.pdf<br />
- Robins R., Trzesniewski K., Moffit T., Caspi A., Donnellan B., Poulton R., (2006): “Low Self Esteem<br />
During Adolescence predicts poor health, criminal behaviour <strong>and</strong> limited economic prospects during<br />
adulthood” Developmental Psychology 42(2); in a different perspective than Bauemeister, Robins <strong>and</strong><br />
Trzesniewski work show evidence that self esteem does matter.<br />
a4. TEMPERAMENT (childhood)<br />
“Basic foundation of personality, usually assumed to be biologically determined <strong>and</strong> present early in<br />
life. It Includes characteristics such as energy level, emotional responsiveness, response tempo <strong>and</strong><br />
willingness to explore” (APA Dictionary)<br />
There are fewer temperament variables than personality traits because these individual differences are<br />
less salient <strong>and</strong> stable in children than in adults.<br />
After the pioneering work of Thomas <strong>and</strong> Chess (1977), different taxonomies have been proposed in the<br />
literature. A recent <strong>and</strong> very comprehensive is the one in Shiner R. And Caspi A. (2003) , which<br />
individuates four main domains in child personality:<br />
1)Extraversion/Positive Emotionality, with lower order traits of social inhibition, sociability,<br />
dominance <strong>and</strong> activity level. 2) Neuroticism/Negative Emotionality with lower traits of anxious<br />
distress (tapping fear <strong>and</strong> anxiety) <strong>and</strong> irritable distress (tapping anger <strong>and</strong> irritability).<br />
3)Conscientiousness/Constraints, with lower traits of attention, inhibitory control <strong>and</strong> achievement<br />
motivation. 4)Agreeableness<br />
Little is still known about how these early emerging differences evolve into personality traits.<br />
Measures:<br />
9
There are different typologies of measures for children personality. It should be emphasized that all of<br />
them have biases, <strong>and</strong> that therefore is always good to use more than one.<br />
The typologies are, as indicated in Shiner <strong>and</strong> Caspi (2003):<br />
1) Naturalistic observations (infants): Naturalistic observations are based on the direct observation of<br />
the child's behavior in naturalistic settings, such as the child's home environment. In this procedure,<br />
observers typically watch the child for periods of several hours <strong>and</strong> then use coding procedures for<br />
observing a variety of specific behavioral tendencies.<br />
The most used behavioural code is Eaton, Enns <strong>and</strong> Presse (1987), Journal of Psychoeducational<br />
Assessment 3, 273-280. The code is available on the article. Some rate the child's temperament across a<br />
variety of dimensions after the observation is completed, using one of the st<strong>and</strong>ard temperament<br />
questionnaires<br />
2) Questionnaires completed by parents or teachers (infants <strong>and</strong> children):<br />
These questionnaires mainly study temperament along the lines of the “big five”<br />
- IBQ (Infant Behavior Questionnaire): M. Rothbart<br />
- CBQ (Children behaviour Questionnaire): Rothbart M, Ahadi S., Hershey K., Fisher P., (2001) “ Child<br />
Development 72 (5), 1394-1408. The CBQ detected 15 primary temperament questionnaires, factor<br />
analysis individuates 3 main factors: 1) extraversion/Surgency 2) Negative Affectivity 3) Effortful<br />
Control. In appendix A of the paper there are scale definitions <strong>and</strong> sample items for CBQ.<br />
http://www.bowdoin.edu/~sputnam/rothbart-temperament-questionnaires/<br />
- ICID: Inventory Child Individual Differences: Halverson C., Havill V., Deal J. (2003):”<strong>Personality</strong><br />
Structure as derived from parental ratings of free descriptions of children: The Inventory of Child<br />
Individual Differences” , Journal of <strong>Personality</strong> 71 (3). Representative items of ICID are in the<br />
“Appendix A” of the article.<br />
- (HiPIC): Mervielde I., De Fruyt F. (1999): “Construction of the hierarchical personality inventory for<br />
Children” Hierarchical <strong>Personality</strong> Inventory for Children in Mervielde, Deary, DeFruyt,Ostendorf,<br />
<strong>Personality</strong> Psychology in Europe:Proceedings of the Eight European Conference on <strong>Personality</strong>, 107-<br />
127, Tillburg U Press.Couldn’t find the article on line.<br />
Principal component analyses at the item level indicated that, for each age level, the first five principal<br />
components tended to group items according to the Big Five. five domains: Conscientiousness,<br />
Benevolence, Extraversion, Imagination, <strong>and</strong> Emotional Stability.<br />
- Dutch BLIK: Slotboom, A., & Elphick, E. (1997). Parents’ perceptions of child personality:<br />
Developmental precursors of the Big Five. Alblasserdam, The Netherl<strong>and</strong>s:<br />
Haveka b. v.<br />
- Goldberg (2001):”Analyses of Digman’s child-personality data: Derivation of Big Five factor scores<br />
from each of six samples. Journal of <strong>Personality</strong>, 69, 709–744.Working on Digman data on Hawaiian<br />
children shows that the big five are derived as dimensions of personality of children.<br />
3) Q-Sets (children) : an informant (parents, teachers, observers or clinicians) sorts a set of cards into a<br />
quasi normal distribution based on how well each item describes the child. Also constructed along the<br />
“big five” taxonomy.<br />
The main two Q-Sets are:<br />
- California Child Q-Set: Block J., Block JH.(1969/1980): “The California Child Q-Set” Palo Alto, CA:<br />
Consulting Psychologists Press. Not publicly available. This Q-set consists of 100 cards; on each was a<br />
descriptive statement which parents rank-ordered into nine categories ranging from "most descriptive"<br />
to<br />
"least descriptive" of their child.<br />
- Common Language Q-set: Caspi A., Block J., Block JH., Klopp B., Lynam D., Moffit T., Stouthamer-<br />
Loeber M. (1992): “A ‘common language’ version of the California Child Q set for personality<br />
assessment” Psychological Assessment 4, 512-523. Represents the CCQset in a simpler language <strong>and</strong><br />
focuses especially on antisocial behavior. An example of the cards can be found at page. 520 of the<br />
article.<br />
4) Laboratory tasks (children):<br />
- Laboratory procedures (LAB-TAB: Goldsmith, Rothbart, 1993): contains measures such as<br />
Stranger Approach, Modified Peek-a-Boogame, <strong>and</strong> Puppet Game. In the lab, 20 episodes or games are<br />
used to elicit reactions of frustration (anger), wariness (fear), interest, pleasure, <strong>and</strong> activity level.<br />
10
- Preschool Lab-TAB (Goldsmith, Reilly, 1995):<br />
Information on both at:<br />
http://psych.wisc.edu/goldsmith/Researchers/GEO/lab_TAB.htm<br />
The LAB-TAB manual can be downloaded at:<br />
http://psych.wisc.edu/goldsmith/Researchers/GEO/Lab_TAB_download_info.htm<br />
Some of the studies using LAB-TAB:<br />
- Goldsmith, H. H., & Rieser-Danner, L. (1990). Assessing early temperament. In C. R. Reynolds & R.<br />
Kamphaus (Eds.), H<strong>and</strong>book of psychological <strong>and</strong> educational assessment of children. (vol. 2)<br />
<strong>Personality</strong>, behavior, <strong>and</strong> context. (pp. 345-378). New York: Guilford Press.<br />
- Goldsmith, H., Rieser-Danner, L., & Briggs, S. (1991). Evaluating convergent <strong>and</strong> discriminant validity<br />
of temperament questionnaires for preschoolers, toddlers, <strong>and</strong> infants. Developmental Psychology, 27,<br />
No. 4, 566-579.<br />
5) Peer Nominations (adolescents): the peer group nominates who is the best described by a particular<br />
item.<br />
- Mervielde I., Defruyt F. (2000):”The Big Five <strong>Personality</strong> Factors as a model for the structure of<br />
children’s peer nominations” European Journal of <strong>Personality</strong> 14, 91-106<br />
- Masten A., Morison P., Pellegrini D., (1985): “A revised class method of peer assessment”,<br />
Developmental Psychology 21, 523-533<br />
6) Self Reports (adolescents, only recently also children).<br />
- Vance H., Pumariega A. (2001):”Clinical Assessment of children <strong>and</strong> adolescents behaviour”, New<br />
York: Wiley.<br />
- Eder R.(1990): “Uncovering young children’s psychological selves: Individual <strong>and</strong> developmental<br />
differences” child Development 61, 849-863. New method for underst<strong>and</strong>ing children individual<br />
differences through self reports with a Puppet interview. The children are 4-8 years old, <strong>and</strong> the study<br />
shows consistency of traits after one month.<br />
Literature:<br />
- Crespi A., Shiner R. (2003) “<strong>Personality</strong> Differences in childhood <strong>and</strong> adolescence: measurement,<br />
development <strong>and</strong> consequences”, Journal of Psychology <strong>and</strong> Psychiatry 44(1), 2-32<br />
- Shiner, R. (2006), “Temperament <strong>and</strong> personality in childhood”. In D. K. Mroczek & T. Little (Eds.),<br />
H<strong>and</strong>book of personality development (pp. 213-230). Mahwah, NJ, Erlbaum.<br />
- Shiner, R. (<strong>Personality</strong> Differences in Childhood <strong>and</strong> adolescence: measurement, development <strong>and</strong><br />
consequences”, Journal of Child Psychology <strong>and</strong> Psychiatry, 44 (1), 2003, p.2-32<br />
- Shiner R., Masten A., Roberts J.(2003). “Childhood personality foreshadows adult personality <strong>and</strong> life<br />
outcomes two decades later”. Journal of <strong>Personality</strong>, 71, 1145-1170. Special issue: <strong>Personality</strong><br />
development.<br />
- Thomas A., Chess S. (1977): “Temperament <strong>and</strong> Development” NY: Brunner/Mazel<br />
Jerry Kagan:<br />
- Kagan J., 1988, “Biological basis of childhood shyness”, Science, 240 (4849) , 167 - 171<br />
Mary Rothbart:<br />
- Rothbart, M. K. (1981). Measurement of temperament in infancy. Child Development, 52, 569-578.<br />
- Rothbart, M, Bates, J (1998)”Temperament”, in H<strong>and</strong>book of child psychology: Vol 3, Social,<br />
emotional <strong>and</strong> personality development, Damon Eisemberg Eds,<br />
a5. PSYCHOPATHOLOGY<br />
A broad category comprising dysfunctional patterns of thought, feeling, or behavior. Most disorders are<br />
included in the DSM-IV manual. Axis I disorders (e.g., depression) are more intense <strong>and</strong><br />
episodic/discreet, whereas Axis II disorders (i.e., personality disorders) are more tonic <strong>and</strong> enduring.<br />
Measure:<br />
For depression, the main scale is the Beck one. It indicates the acuteness of depression, but it is only for<br />
adults.<br />
- Beck, A., (1961) “An inventory for measuring depression “, Arch Gen Psychiatry, Archives of General<br />
Psychiatry 4, 561-571<br />
A version for kids is Achenbach Child Behavior Checklist:<br />
11
- http://www.aseba.org/products/forms.html<br />
Achenbach, T. M. (1991). Manual for the Child Behavior Check List/4–18 <strong>and</strong> 1991 Profile. Burlington:<br />
University of Vermont.<br />
- Another measure of Psychopathology is the Child Depression Index, which can be found in PSID.<br />
Literature:<br />
- Seligman, M.E.P., Walker, E., & Rosenhan, D.L. (2001). Abnormal psychology. (4th ed.) New York:<br />
W.W. Norton. Manual in Abnormal Psychology.<br />
- “Diagnostic <strong>and</strong> Statistical Manual of Mental Disorders”, (1995), American Psychiatric Association<br />
Pub, Inc<br />
b) <strong>Abilities</strong><br />
b1. IQ AND “G” FACTOR<br />
“Ability to reason, solve problems, comprehend abstract associations, learn from experience <strong>and</strong> think<br />
abstractly.”<br />
One dominant factor “g” (“general factor”) refers to the first factor extracted from a factor analysis of<br />
cognitive tasks, which many researchers consider to represent general (vs. specific) intelligence.”It<br />
represents individuals’ abilities to perceive relationships <strong>and</strong> to derive conclusions from them. It is the<br />
basic ability that underlies the performance of different intellectual tasks”<br />
IQ specifically refers to one’s intelligence relative to one’s age group (especially for children)<br />
Main authors: Arthur Jensen;; Nathan Brody<br />
Measures:<br />
WISC: Wechsler Intelligence Scale for Children<br />
- Wechsler, D. (1974). Wechsler Intelligence Scale for Children-Revised (WISC-R). New York: The<br />
Psychological Corporation.<br />
WAIS<br />
Raven’s Progressive Matrices<br />
ASVAB<br />
Literature:<br />
- Neisser U., Boodoo G., Bouchard T., Boykin W., Brody N., Ceci S., Halpern D., Loehlin J., Perloff R.,<br />
Sternberg R., Urbina S., (1996): “Intelligence: Knowns <strong>and</strong> Unknowns” American Psychologist 51(2),<br />
77-101<br />
- Gottfredson L., (1997) “Why “g” matters: the complexity of everyday life”, Intelligence.<br />
- Brody, N., (1992). Intelligence. Boston: Academic Press<br />
b2. SPECIFIC MENTAL ABILITIES<br />
“<strong>Abilities</strong> as measured by tests of an individual in areas of spatial visualization, perceptual need,<br />
number facility, verbal comprehension, word fluency, memory, inductive reasoning <strong>and</strong> so forth”<br />
An umbrella category for lower-level mental abilities, including math, verbal, <strong>and</strong> spatial abilities, as<br />
well as even more specific mental capacities. Measured by subtest scores on IQ tests<br />
- Lubinski D. (2004), “Introduction to the special section on cognitive abilities: 100 years after<br />
- Spearman's (1904) "‘General intelligence,’ objectively determined <strong>and</strong> measured." J <strong>Personality</strong> <strong>and</strong><br />
Social Psychology 86, 96–111<br />
b3. CREATIVITY<br />
Ability to generate novel ideas <strong>and</strong> behaviors that solve problems.<br />
Measures:<br />
One measure for creativity is Gough 1979 “Creative <strong>Personality</strong> Scale”:<br />
- Gough, H. G. (1979). “A creative personality scale for the Adjective Check List”. Journal of <strong>Personality</strong><br />
<strong>and</strong> Social Psychology, 37,1398-1405. Link to the scale:<br />
http://www.indiana.edu/~bobweb/Bob/Gough_Scale.doc<br />
Literature:<br />
- Eysenck, H.J. (1993): Creativity <strong>and</strong> <strong>Personality</strong>: Suggestions for a Theory, Psychological Inquiry,<br />
- Eysenck, H.J. (1994), “The measurement of creativity. In Dimensions of Creativity, M.A. Boden.<br />
- Cziksentmihalyi, M. (1996) “Creativity, Flow <strong>and</strong> the Psychology of Discovery <strong>and</strong> Invention”,<br />
London: Harper Collins<br />
12
- Simonton, D.(1984) , “Genius, Creativity <strong>and</strong> Leadership: Historiometric inquiries”, Harvard U Press.<br />
- Simonton, D. (1997) “Genius <strong>and</strong> Creativity: selected papers” Ablex Ed.<br />
b4. EXECUTIVE FUNCTION<br />
“Higher level cognitive processes that organize <strong>and</strong> order behavior, including logic <strong>and</strong> reasoning,<br />
abstract thinking, problem solving, planning <strong>and</strong> carrying out <strong>and</strong> terminating goal directed behavior”<br />
Broad set of higher-level cognitive capacities attributed to the prefrontal cortex, often involving the<br />
coordination <strong>and</strong> management of lower-level processes” (APA Dictionary)<br />
Executive functions are unrelated to “g”, but determine more basic abilities that can vary considerably<br />
among the population <strong>and</strong> that can be important in the process of acquiring cognitive skills: for<br />
example, Kim, Whyte, Vaccaro et al. show how executive functions may relate to attention, while<br />
Carpenter shows the relationship with working memory.<br />
Executive functions are usually measured by neuropsychology tasks (e.g., go/no-go, Stroop, Continuous<br />
Performance Task)<br />
Literature:<br />
- Miller E, Cohen J. (2001) "An integrative theory of prefrontal cortex function". Annual Review of<br />
Neuroscience 24, 167-202<br />
- Miller, E.K. (2000) The prefrontal cortex <strong>and</strong> cognitive control. Nature Reviews Neuroscience, 1:59-65<br />
- Miller Lab, with links to publications: http://www.millerlab.org<br />
- Blair C., Razza R.(2007), “Relating Effortful Control, Executive Function, <strong>and</strong> False Belief<br />
Underst<strong>and</strong>ing to Emerging Math <strong>and</strong> Literacy Ability in Kindergarten” Child Development 78 (2),<br />
647–663.<br />
- Carpenter P., (2000): “Working memory <strong>and</strong> executive function”, Current Opinion in Neurobiology, 10,<br />
195–19<br />
b6. EMOTIONAL INTELLIGENCE<br />
“Ability to process emotional information <strong>and</strong> use it in reasoning <strong>and</strong> other cognitive activities.<br />
According to Mayer <strong>and</strong> Slovey 1997 model It comprises four abilities: to perceive <strong>and</strong> appraise<br />
emotions accurately, to access <strong>and</strong> evoke emotions when they facilitate cognition, to comprehend<br />
emotional language <strong>and</strong> make use of emotional information, <strong>and</strong> to regulate one’s own <strong>and</strong> others’<br />
emotions to promote growth <strong>and</strong> well-being” Ability to perceive emotion, to integrate it in thought, to<br />
underst<strong>and</strong> it <strong>and</strong> to manage it (Mayer)” (APA Dictionary)<br />
Emotion is here considered as a feeling state that conveys information about relationships (Mayer), <strong>and</strong><br />
intelligence refers to the ability of reason validly about this information.<br />
Measures:<br />
The most reliable measure is considered to be the MSCEIT test, but it is not publicly available.<br />
The validity of self reported judgments is still highly debated<br />
Literature:<br />
- John Mayer website for emotional intelligence, with links to all relevant papers:<br />
http://www.unh.edu/emotional_intelligence/.<br />
See also:<br />
- Mayer J., Slovey P., (1997) ”What is emotional intelligence? In P. Salovey y D. Sluyter Eds., Emotional<br />
development <strong>and</strong> EI: Educational implications New York: Basic Books<br />
- Mayer, J. Caruso, D., Salovey, P. (1999).”Emotional intelligence meets traditional st<strong>and</strong>ards for an<br />
intelligence”. Intelligence, 27, 267-298.<br />
- Mayer, J. D., Salovey, P., Caruso, D. R. (2000). Models of emotional intelligence. In R. J. Sternberg<br />
(Ed.). H<strong>and</strong>book of Intelligence (pp. 396-420). Cambridge, Engl<strong>and</strong>: Cambridge University Press.<br />
- Roberts R., Matthews G., Zeidner M., (2001), “Does Emotional Intelligence meet Traditional<br />
St<strong>and</strong>ards for Intelligence? Some New Data <strong>and</strong> Conclusions” Emotion, 1 (3), 196-231<br />
http://www-users.york.ac.uk/~pjm21/psychometrics/robertsetal2001.pdf<br />
- Roberts R., Matthews G., Zeidner M., (2004) “Emotional Intelligence: Science <strong>and</strong> Myth”, MIT Press,<br />
Cambridge, Massachussets.<br />
Goleman D.<br />
13
Motivation <strong>and</strong> IQ Summary<br />
Many of these studies used a within-subject design <strong>and</strong> measured the effect of motivation as the<br />
differential between performance with <strong>and</strong> without incentives. An intriguing possibility for<br />
measuring motivation not available at the time of these early studies is offered by Pailing &<br />
Segalowitz (2004). A particular error-related ERP (event-related potential) is a metric for the<br />
salience or importance of making an error. Subjects who are high in Conscientiousness or low in<br />
Neuroticism showed dampened changes in this particular ERP when incentives were given for<br />
improved performance.<br />
Table 3. Studies documenting an effect of motivation at the time of test administration <strong>and</strong> IQ<br />
score<br />
Study<br />
Edlund<br />
(1972)<br />
Ayllon &<br />
Kelly (1972)<br />
Sample 1<br />
Ayllon &<br />
Kelly (1972)<br />
Sample 2<br />
Ayllon &<br />
Kelly<br />
(1972)Sample<br />
3<br />
Sample <strong>and</strong><br />
Study Design<br />
Between<br />
subjects study.<br />
11 matched<br />
pairs of low<br />
SES children;<br />
children were<br />
about 1 SD<br />
below average<br />
in IQ at<br />
baseline<br />
Within subjects<br />
study. 12<br />
mentally<br />
retarded<br />
children (avg<br />
IQ 46.8)<br />
Within subjects<br />
study 34 urban<br />
fourth graders<br />
(avg IQ = 92.8)<br />
Within subjects<br />
study of 12<br />
matched pairs<br />
of mentally<br />
retarded<br />
children<br />
Experimental<br />
Group<br />
M&M c<strong>and</strong>ies<br />
given for each<br />
right answer<br />
Tokens given in<br />
experimental<br />
condition for<br />
right answers<br />
exchangeable for<br />
prizes<br />
Tokens given in<br />
experimental<br />
condition for<br />
right answers<br />
exchangeable for<br />
prizes<br />
Six weeks of<br />
token<br />
reinforcement for<br />
good academic<br />
performance<br />
Effect size of<br />
incentive (in<br />
st<strong>and</strong>ard<br />
deviations)<br />
Experimental<br />
group scored 12<br />
points higher<br />
than control<br />
group during a<br />
second testing<br />
on an<br />
alternative form<br />
of the Stanford<br />
Binet (about .8<br />
SD)<br />
6.25 points out<br />
of a possible 51<br />
points on<br />
Metropolitan<br />
Readiness Test.<br />
t = 4.03<br />
t = 5.9<br />
Experimental<br />
group scored<br />
3.67 points out<br />
of possible 51<br />
points on a<br />
post-test given<br />
Summary<br />
“…a carefully chosen<br />
consequence, c<strong>and</strong>y,<br />
given contingent on<br />
each occurrence of<br />
correct responses to an<br />
IQ test, can result in a<br />
significantly higher IQ<br />
score.”(p. 319)<br />
“…test scores often<br />
reflect poor academic<br />
skills, but they may<br />
also reflect lack of<br />
motivation to do well<br />
in the criterion<br />
test…These results,<br />
obtained from both a<br />
population typically<br />
limited in skills <strong>and</strong><br />
ability as well as from<br />
a group of normal<br />
children (Experiment<br />
II), demonstrate that<br />
the use of<br />
reinforcement<br />
procedures applied to a<br />
behavior that is tacitly<br />
1
Clingman &<br />
Fowler<br />
(1976)<br />
Zigler &<br />
Butterfield<br />
(1968)<br />
Within subjects<br />
study of 72<br />
first- <strong>and</strong><br />
second-graders<br />
assigned<br />
r<strong>and</strong>omly to<br />
contingent<br />
reward,<br />
noncontingent<br />
reward, or no<br />
reward<br />
conditions.<br />
Within <strong>and</strong><br />
between<br />
subjects study<br />
of 40 low SES<br />
children who<br />
did or did not<br />
attend nursery<br />
school were<br />
tested at the<br />
beginning <strong>and</strong><br />
end of the year<br />
on Stanford-<br />
Binet<br />
Intelligence<br />
Test under<br />
either<br />
optimized or<br />
st<strong>and</strong>ard cdtns.<br />
M&Ms given for<br />
right answers in<br />
contingent cdtn;<br />
M&Ms given<br />
regardless of<br />
correctness in<br />
noncontingent<br />
cdtn<br />
Motivation was<br />
optimized<br />
without giving<br />
test-relevant<br />
information.<br />
Gentle<br />
encouragement,<br />
easier items after<br />
items were<br />
missed, etc.<br />
under st<strong>and</strong>ard<br />
conditions<br />
higher than at<br />
baseline;<br />
control group<br />
dropped 2.75<br />
points. On a<br />
second post-test<br />
with incentives,<br />
exp <strong>and</strong> control<br />
groups<br />
increased 6.25<br />
<strong>and</strong> 7.17 points,<br />
respectively<br />
Only among<br />
low-IQ (
Breuning &<br />
Zella (1978)<br />
Holt & Robbs<br />
(1979)<br />
Within <strong>and</strong><br />
between<br />
subjects study<br />
of 485 special<br />
education high<br />
school students<br />
all took IQ<br />
tests, then were<br />
r<strong>and</strong>omly<br />
assigned to<br />
control or<br />
incentive<br />
groups to retake<br />
tests. Subjects<br />
were belowaverage<br />
in IQ.<br />
Between <strong>and</strong><br />
within subjects<br />
study of 80<br />
delinquent boys<br />
r<strong>and</strong>omly<br />
assigned to 3<br />
experimental<br />
groups <strong>and</strong> 1<br />
control group.<br />
Each exp group<br />
received a<br />
st<strong>and</strong>ard <strong>and</strong><br />
modified<br />
administration<br />
of the WISCverbal<br />
section.<br />
Incentives such<br />
as record albums,<br />
radios (
Larson (1994) Between<br />
subjects study<br />
of 109 San<br />
Diego State<br />
University<br />
psychology<br />
students<br />
Duckworth<br />
(in<br />
preparation)<br />
Within subjects<br />
study of 61<br />
urban lowachieving<br />
high<br />
school students<br />
tested with a<br />
groupadministered<br />
Otis-Lennon IQ<br />
test during their<br />
freshman year,<br />
then again 2<br />
years later with<br />
a one-on-one<br />
(WASI) test<br />
Up to $20 for<br />
improvement<br />
over baseline<br />
performance on<br />
cognitive speed<br />
tests<br />
St<strong>and</strong>ard<br />
directions for<br />
encouraging<br />
effort were<br />
followed for the<br />
WASI brief test.<br />
Performance was<br />
expected to be<br />
higher because of<br />
the one-on-one<br />
environment.<br />
“While both<br />
groups<br />
improved with<br />
practice, the<br />
incentive group<br />
improved<br />
slightly more.”<br />
need to<br />
calculate effect<br />
size, but it was<br />
not large<br />
Performance on<br />
the WASI as<br />
juniors was<br />
about 16 points<br />
higher than on<br />
the groupadministered<br />
test as<br />
freshmen.<br />
Notably, on the<br />
WASI, this<br />
population<br />
looks almost<br />
“average” in<br />
IQ, whereas by<br />
Otis-Lennon<br />
st<strong>and</strong>ards they<br />
are low IQ. t<br />
(60) = 10.67, p<br />
< .001<br />
2 reasons why<br />
incentive did not<br />
produce dramatic<br />
increase: 1) few or no<br />
unmotivated subjects<br />
among college<br />
volunteers, 2)<br />
information processing<br />
tasks are too simple for<br />
‘trying harder’ to<br />
matter<br />
The increase in IQ<br />
scores could be<br />
attributed to any<br />
combination of the<br />
following 1) an<br />
increase in “g” due to<br />
schooling at an<br />
intensive charter<br />
school, 2) an increase<br />
in knowledge or<br />
crystallized<br />
intelligence, 3) an<br />
increase in motivation<br />
due to the change in IQ<br />
test format, <strong>and</strong>/or 4)<br />
an increase in<br />
motivation due to<br />
experience at high<br />
performing school<br />
Ayllon, T., & Kelly, K. (1972). Effects of reinforcement on st<strong>and</strong>ardized test performance.<br />
Journal of Applied Behavior Analysis. Vol., 5(4), 477-484.<br />
Breuning, S. E., & Zella, W. F. (1978). Effects of individualized incentives on norm-referenced<br />
IQ test performance of high school students in special education classes. Journal of<br />
School Psychology, 16(3), 220-226.<br />
Clingman, J., & Fowler, R. L. (1976). The effects of primary reward on the I.Q. performance of<br />
grade-school children as a function of initial I.Q. level. Journal of Applied Behavior<br />
Analysis, 9(1), 19-23.<br />
Edlund, C. V. (1972). The effect on the behavior of children, as reflected in the IQ scores, when<br />
reinforced after each correct response. Journal of Applied Behavior Analysis. Vol., 5(3),<br />
317-319.<br />
4
Holt, M. M., & Hobbs, T. R. (1979). The effects of token reinforcement, feedback <strong>and</strong> response<br />
cost on st<strong>and</strong>ardized test performance. Behaviour Research <strong>and</strong> Therapy, 17(1), 81-83.<br />
Larson, G. E., Saccuzzo, D. P., & Brown, J. (1994). Motivation: Cause or confound in<br />
information processing/intelligence correlations? Acta Psychologica, 85(1), 25-37.<br />
Pailing, P. E., & Segalowitz, S. J. (2004). The error-related negativity as a state <strong>and</strong> trait<br />
measure: Motivation, personality, <strong>and</strong> ERPs in response to errors. Psychophysiology,<br />
41(1), 84-95.<br />
Zigler, E., & Butterfield, E. C. (1968). Motivational Aspects of Changes in Iq Test Performance<br />
of Culturally Deprived Nursery School Children. Child Development, 39(1), 1-14.<br />
5
Ability Bias, Errors in<br />
Variables <strong>and</strong> Sibling Methods<br />
James J. Heckman<br />
University of Chicago<br />
Econ 312<br />
This draft, May 26, 2006<br />
1
1 Ability Bias<br />
Consider the model:<br />
log = 0 + 1 + <br />
where =income, = schooling, <strong>and</strong> 0 <strong>and</strong> 1 are parameters<br />
of interest. What we have omitted from the above<br />
specification is unobserved ability, which is captured in the<br />
residual term .Wethusre-writetheaboveas:<br />
log = 0 + 1 + + <br />
where is ability, ( 0 ) ( 0), <strong>and</strong>webelievethat<br />
( ) 6= 0.Thus,( | ) 6= 0,sothatOLS on our<br />
original specification gives biased <strong>and</strong> inconsistent estimates.<br />
2
1.1 Strategies for Estimation<br />
1. Use proxies for ability: Find proxies for ability <strong>and</strong> include<br />
them as regressors. Examples may include: height,<br />
weight, etc. The problem with this approach is that proxies<br />
may measure ability with error <strong>and</strong> thus introduce<br />
additional bias (see Section 1.3).<br />
3
2. Fixed Eect Method: Find a paired comparison. Examples<br />
may include a genetic twin or sibling with similar or<br />
identical ability. Consider two individuals <strong>and</strong> 0 :<br />
log log 0 = ( 0 + 1 + ) ( 0 + 1 0 + 0 )<br />
= 1 ( 0)+( 0)+( 0 )<br />
Note: if = 0,thenOLS performedonourfixedeect<br />
4
estimator is unbiased <strong>and</strong> consistent. If 6= 0,thenwe<br />
just get a dierent bias (see Section 1.2). Further, if is<br />
measured with error, we may exacerbate the bias in our<br />
fixed eect estimator (see Section 1.3).<br />
1.2 OLS vs. Fixed Eect (FE)<br />
In the OLS case with ability bias, we have:<br />
plim ( <br />
1 )= 1 +<br />
( )<br />
()<br />
(See derivation of Equation (2.2) for more background on the<br />
above derivation).<br />
5
We also impose:<br />
() = ( 0 )<br />
( ) = ( 0 0 )<br />
( 0 ) = ( 0 )<br />
With these assumptions, our fixed eect estimator is given by:<br />
plim <br />
1 = 1 + ( 0 ( 0 )+( 0 ))<br />
( 0 )<br />
= 1 + ( ) (0 )<br />
() ( 0 ) .<br />
Note that if ( 0 )=0 <strong>and</strong> ability is positively correlated<br />
with schooling, then the fixed eect estimator is upward biased.<br />
6
From the preceding, we see that the fixed eect estimator has<br />
more asymptotic bias if:<br />
( ) ( 0 )<br />
() ( 0 )<br />
( )<br />
<br />
()<br />
<br />
( )<br />
()<br />
(0 )<br />
( 0 ) .<br />
7
1.3 Measurement Error<br />
Say = + where is observed schooling. Our model<br />
now becomes:<br />
log = 0 + 1 + = 0 + 1 +( + 1 )<br />
<strong>and</strong> the fixed eect estimator gives:<br />
log log 0 = ( 0 + 1 + ) ( 0 + 1 0 + 0 )<br />
= 1 ( 0 )+( 0 )+ 1 ( 0 )<br />
Now we wish to examine which estimator (OLS or fixed eect),<br />
has more asymptotic bias given our measurement error problem.<br />
For the remaining arguments of this section, we assume:<br />
( | ) = ( 0 | ) = ( | 0 )=0<br />
so that the OLS estimator gives:<br />
8
plim <br />
1 = 1 + ( + 1 )<br />
( )<br />
= 1 + ( ) 1()<br />
.<br />
()+()<br />
The fixed eect estimator gives:<br />
plim <br />
1 = 1 +<br />
<br />
³<br />
´<br />
0 ( 0 )+ 1 ( 0 )<br />
( 0 )<br />
= 1 + (( 0 ) ( 0 )) 1 ( 0 )<br />
( 0 )+( 0 )<br />
= 1 + ( ) ( 0 ) 1 ()<br />
()+() ( 0 )<br />
.<br />
9
Under what conditions will the fixed eectbiasbegreater?<br />
From the above, we know that this will be true if <strong>and</strong> only if:<br />
( ) ( 0 ) 1 ()<br />
( ) 1()<br />
()+() ( 0 ) ()+()<br />
( 0 )(()+()) <br />
( 1 () ( )) ( 0 )<br />
( ) 1()<br />
()+()<br />
( 0 )<br />
( 0 ) .<br />
If this inequality holds, taking dierences can actually worsen<br />
the fit over OLS alone. Intuitively, we see that we have dierenced<br />
out the true component, , <strong>and</strong> compounded our measurement<br />
error problem with the fixed eect estimator.<br />
10
In the special case = 0 , the condition is<br />
1 ()<br />
()+() ( 0 ) ( ) 1()<br />
<br />
()+()<br />
11
2 Errors in Variables<br />
2.1 The Model<br />
Suppose that the equation for earnings is given by:<br />
= 1 1 + 2 2 + <br />
where ( | 1 2 )=0 0 .Alsodefine:<br />
1 = 1 + 1 <strong>and</strong> 2 = 2 + 2 <br />
12
Here, 1 <strong>and</strong> 2 are observed <strong>and</strong> measure 1 <strong>and</strong> 2 with<br />
error. We also impose that . So, our initial model<br />
can be equivalently re-written as:<br />
= 1 1 + 2 2 +( 1 1 2 2 ).<br />
Finally, by assumed independence of <strong>and</strong> , wewrite:<br />
= + .<br />
13
2.2 McCallum’s Problem<br />
Question: Is it better for estimation of 1 to include other variables<br />
measured with error? Suppose that 1 is not measured<br />
with error, in the sense that 1 =0 while 2 is measured with<br />
error. In 2.2.1 <strong>and</strong> 2.2.2 below, we consider both excluding<br />
<strong>and</strong> including 2 <strong>and</strong> investigate the asymptotic properties<br />
of both cases.<br />
2.2.1 Excluded 2<br />
The equation for earnings with omitted 2 is:<br />
= 1 1 +( + 2 2 )<br />
14
Therefore, by arguments similar to those in the appendix, we<br />
know:<br />
plim ˜ 1 = 1 + 12<br />
<br />
2 . (2.1)<br />
11<br />
Here, 12 is the covariance between the regressors, <strong>and</strong> 11 is<br />
thevarianceof 1 Before moving on to a more general model<br />
for the inclusion of 2 let us first consider the classical case<br />
for including both variables. Suppose<br />
¸ ¸<br />
<br />
<br />
= 11 0<br />
11 0<br />
0 =<br />
.<br />
22<br />
0 22<br />
We know that:<br />
plim ˆ = £ ( ) 1 ( ) ¤ (2.2)<br />
15
where the coecient <strong>and</strong> regressor vectors have been stacked<br />
appropriately (see Appendix for derivation). Note that represents<br />
the variance-covariance matrix of the measurement errors,<br />
<strong>and</strong> is the variance-covariance matrix of the regressors.<br />
Straightforward computations thus give:<br />
plim ˆ<br />
=<br />
=<br />
" <br />
11 + <br />
<br />
11 0<br />
0 22 + 22<br />
<br />
<br />
<br />
11<br />
0<br />
<br />
11 + 11<br />
<br />
22 <br />
0<br />
22 + 22<br />
¸1 <br />
<br />
11 0<br />
<br />
1<br />
¸<br />
<br />
2<br />
0 22<br />
¸# <br />
1<br />
2<br />
¸<br />
16
2.2.2 Included 2<br />
In McCallum’s problem we suppose that 12 =0 Further, as<br />
1 is not measured with error, 11 =0 Substituting this into<br />
equation 2.2 yields:<br />
¸1 ¸<br />
plim ˆ<br />
11 <br />
= <br />
12 0 0<br />
12 22 + 22 0 <br />
22<br />
With a little algebra, the above gives:<br />
<br />
<br />
μ <br />
plim ˆ<br />
12<br />
1 = 1 + 2<br />
<br />
22 <br />
11<br />
<br />
22 + 22 2 <br />
12<br />
<br />
μ μ<br />
11<br />
<br />
12<br />
22<br />
= 1 + 2<br />
11 22 (1 2 12)+ 22<br />
17
where 2 12 is simply the correlation coecient,<br />
we know that:<br />
0 2 12 1<br />
2 12<br />
11 22<br />
Further,<br />
so including 2 results in less asymptotic bias (inconsistency).<br />
(We get this result by comparing the above with the bias from<br />
excluding 2 in section 2.2.1, the result captured in equation<br />
(2.1)). So, we have justified the kitchen sink approach. This<br />
result generalizes to the multiple regressor case - 1 badly measured<br />
variable with good ones (Econometrica, 1972).<br />
18
2.3 General Case<br />
In the most general case, we have:<br />
plim ˆ = ( ) 1 <br />
<br />
11 + <br />
= 11 12 + ¸1 <br />
12 <br />
<br />
11 <br />
12 + 12 22 + 12<br />
22 12 22<br />
With a little algebra we find:<br />
¸ <br />
1<br />
2<br />
¸<br />
.<br />
det( )= 11 22 + 11 22+ 11 22 + 11 22 2<br />
122 12 12 2 12<br />
19
Therefore:<br />
plim ˆ = <br />
1<br />
det( )<br />
×<br />
<br />
<br />
11 12<br />
12 22<br />
Supposing 12 =0 we get:<br />
<br />
22 + 22 ( 12 + 12)<br />
( 12 + 12) 11 + 11<br />
¸ ¸<br />
1<br />
2<br />
¸<br />
det(˜ )=det( ) | <br />
<br />
12<br />
=0<br />
= 11 22 + 11 22 + 11 22 + 11 22 2 12<br />
20
<strong>and</strong> thus:<br />
plim ˆ = <br />
<br />
<br />
( 22 + 22) 11<br />
det(˜ )<br />
11 12<br />
det(˜ )<br />
12 22<br />
det(˜ )<br />
( 11 + 11) 22<br />
det(˜ )<br />
<br />
¸<br />
1<br />
2<br />
Note that if 2 12 0 OLS may not be downward biased for<br />
1 .If 2 =0 we get:<br />
plim ˆ 2 = 1 12 11<br />
det(˜ )<br />
so, if 2 were a race variable <strong>and</strong> blacks get lower quality<br />
schooling, (where schooling is measured by 1 ) then 12 0<br />
<strong>and</strong> hence ˆ 2 0 This would be a finding in support of labor<br />
market discrimination.<br />
21
2.4 The Kitchen Sink Revisited<br />
McCallum’s analysis suggests that one should toss in a variable<br />
measured with error if there is no measurement error in 1 <br />
But suppose that there is measurement error in 1 Is it still<br />
better to include the additional variable measured with error<br />
as a regressor? We proceed by imposing 2 =0.<br />
(i) Excluded X 2 . The equation for earnings with measurement<br />
error in 1 <strong>and</strong> excluded 2 is:<br />
= (1 + 1 ) 1 +( + 2 2 )<br />
= 1 1 +( + 2 2 + 1 1 )<br />
22
Therefore:<br />
μ <br />
plim ˜ <br />
<br />
1 = 1 11<br />
1<br />
11 + 11<br />
<br />
= 1<br />
<br />
1<br />
<br />
1+ 11<br />
μ <br />
11<br />
= 1<br />
11 + 11<br />
<br />
<br />
<br />
11<br />
(2.3)<br />
(ii) Included X 2 . From our analysis in the General Case<br />
(Section 2.3), we know that:<br />
μ <br />
plim ˆ<br />
(22 + <br />
1 = <br />
22) 11 2 12<br />
1 . (2.4)<br />
det(˜ )<br />
23
If 22 =0 so that 2 is not measured with error:<br />
μ<br />
<br />
plim ˆ 11 22 2 12<br />
1 = 1<br />
11 22 2 12 + <br />
Ã<br />
11 22<br />
1 2 12<br />
= 1 .<br />
1 2 12 + 11<br />
11<br />
!<br />
(2.5)<br />
Comparing eqn (2.4) <strong>and</strong> eqn (2.5), we see that adding the<br />
variable measured without error always exacerbates the bias.<br />
24
For, the bias in the excluded case will be smaller if:<br />
<br />
<br />
1<br />
<br />
1<br />
<br />
<br />
1+ <br />
1 2 12 <br />
1 <br />
11<br />
1 2 12 + <br />
11<br />
11 <br />
μ<br />
μ 11<br />
1 2 12 + 11<br />
1+ 11 ¡1 ¢<br />
<br />
2<br />
11 12<br />
11<br />
0 2 12<br />
11<br />
11<br />
<br />
whichisalwaysthecase,provided 2 12 0 (Notethatthe<br />
coecients on 1 for both the excluded <strong>and</strong> included case are<br />
less than one. So, the larger coecient is the one with less<br />
bias, as stated above.)<br />
25
Now suppose that 22 0 so that both variables are measured<br />
with error. Then:<br />
μ <br />
plim ˆ<br />
(22 + <br />
1 = <br />
22) 11 2 12<br />
1<br />
det(˜ )<br />
<br />
<br />
1+ 22<br />
2 12<br />
= 1<br />
<br />
22 <br />
<br />
1+ 11<br />
+ 11 22<br />
+ <br />
22<br />
2 12<br />
11 11 22 22<br />
Intuitively, adding measurement error in 2 can only worsen<br />
the bias, <strong>and</strong> thus exclusion should again be preferred to inclusion.<br />
Formally, including 2 givesmorebiasif<strong>and</strong>only<br />
26
if:<br />
<br />
1<br />
<br />
<br />
1+ 11<br />
11<br />
+ 11<br />
<br />
<br />
1+ 22<br />
22<br />
2 12<br />
<br />
<br />
1<br />
22<br />
+ 22<br />
2 12<br />
11 22 <br />
μ μ 22<br />
1+ 11<br />
1+ 22<br />
2 12<br />
11 22<br />
μ<br />
1+ 11<br />
11<br />
+ 11<br />
11<br />
22<br />
22<br />
+ 22<br />
22<br />
2 12<br />
<br />
<br />
<br />
<br />
<br />
<br />
1<br />
<br />
<br />
11<br />
1+ 11<br />
2 12<br />
11<br />
11<br />
0.<br />
27
Thus, provided 2 12 0 including 2 resultsinmorebias<br />
than excluding it. If 2 12 =0 the bias from including 2 is<br />
obviously seen to be:<br />
<br />
1<br />
<br />
<br />
1+ 22<br />
22<br />
1+ 11<br />
11<br />
+ 11<br />
11<br />
22<br />
22<br />
+ 22<br />
22<br />
<br />
<br />
= 1<br />
<br />
<br />
<br />
1+ 22<br />
μ<br />
22<br />
<br />
22<br />
<br />
= 1<br />
<br />
1<br />
<br />
<br />
1+ <br />
11<br />
11<br />
μ<br />
1+ 22<br />
1+ 11<br />
so that including <strong>and</strong> excluding 2 yields the same result.<br />
11<br />
<br />
<br />
<br />
<br />
28
Finally, from the General Case section, we have:<br />
plim ˆ 1 = 1 ( 22 + 22) 11 2 12 + 2 ( 12 22)<br />
.<br />
11 22 2 12 + 11 22 + 11 22 + 11 22<br />
L’Hôpital’s rule on the above shows that:<br />
11 lim<br />
³plim 1´<br />
ˆ<br />
³<br />
lim plim<br />
1´<br />
ˆ = 1 11 + 2 12<br />
<br />
22 11 + 11<br />
=0 <strong>and</strong><br />
=<br />
1 11<br />
11 + 11<br />
+ 2 12<br />
.<br />
11 + 11<br />
29
Appendix<br />
Derivation of Equation (2.2)<br />
We can write<br />
= +( 1 1 2 2 )<br />
where:<br />
= £ 1 2<br />
¤<br />
<strong>and</strong> =<br />
<br />
1<br />
2<br />
¸<br />
<br />
<strong>and</strong> 1 2 are × 1.<br />
30
So:<br />
³<br />
ˆ = 0 ´1 (<br />
0 )<br />
= +<br />
³ 0 ´1 ³<br />
´<br />
0 ( 1 1 2 2 )<br />
á<br />
<br />
0 ¢ ! 1<br />
= +<br />
<br />
μμ μ μ <br />
<br />
0 <br />
0 1 <br />
× <br />
1 <br />
0 2 <br />
<br />
2<br />
<br />
<br />
³<br />
+ <br />
³ 0 ´´1<br />
³ ³ ´<br />
× 0 <br />
³ 0 1´<br />
1 <br />
³ 0 2´<br />
2´<br />
31
¡<br />
<br />
0<br />
= <br />
¡ 0<br />
μ<br />
× <br />
= <br />
<br />
¡<br />
<br />
0<br />
×<br />
1 1<br />
2 1<br />
<br />
0<br />
1 1<br />
0<br />
1 1<br />
¢ ¡<br />
<br />
0<br />
¢ ¡<br />
<br />
0<br />
1 2<br />
2 2<br />
¢<br />
¢<br />
¸<br />
<br />
2 1 + <br />
1<br />
¢ ¡ ¢<br />
<br />
0<br />
¢ ¡ 1 2¢<br />
<br />
0<br />
¡ 0<br />
2 1 2 2<br />
¡ ¢ ¡<br />
<br />
0<br />
1 1 <br />
0<br />
¡ 0<br />
2 1<br />
¢<br />
<br />
¡<br />
<br />
0<br />
¢<br />
1 2<br />
¢<br />
2 2<br />
¸1<br />
¸ <br />
0<br />
1 2<br />
0<br />
2 2<br />
¸1<br />
¸ <br />
1<br />
2<br />
¸<br />
2<br />
<br />
32
=<br />
¡¡<br />
0<br />
¢ ¢ ¡¡ μ ( ) 1 1 + 0 0<br />
¢ ¢<br />
1 1 1 + 0 1 2<br />
¡¡ ¢ ¢ ¡¡<br />
0 2 + 0 0<br />
¢ ¢<br />
2 1 2 + 0 2 2<br />
¸<br />
1<br />
×<br />
2<br />
= ¡ ( ) 1 ( ) ¢ <br />
¸<br />
where the second-to-last step follows from the independence<br />
of <strong>and</strong> This type of argument is also used to derive the<br />
probability limit of the ’s in section 1.<br />
33
3 Sibling Models: Components of Variance<br />
Scheme<br />
Suppose that data on two brothers, say <strong>and</strong> is at our<br />
disposal Without loss of generality, we will consider how to<br />
estimate parameters of interest for person in what follows.<br />
We will begin by introducing a general model <strong>and</strong> then focus on<br />
the two-person case mentioned above. Consider the following<br />
triangular system:<br />
1 = 1<br />
2 = 12 1 + 2<br />
3 = 13 1 + 23 2 + 3<br />
34
Here, indexes the person in the group. We assume<br />
that <strong>and</strong> 0 <br />
are uncorrelated (i.e., uncorrelated across<br />
groups). Further, we suppose:<br />
= + <br />
= + ,<br />
for =1 2 3. We assume is uncorrelated across equations<br />
<strong>and</strong> across within the group, is i.i.d. across groups, <strong>and</strong><br />
is i.i.d. within groups <strong>and</strong> uncorrelated with .<br />
35
3.1 Estimation<br />
We specialize the above model into a two person framework <strong>and</strong><br />
propose a similar three equation system. Let 1 = early (preschool)<br />
test score, 2 = schooling (years), <strong>and</strong> 3 = earnings.<br />
It seems plausible to write the equation system<br />
1 = + 1<br />
2 = 2 + 2 <br />
3 = 23 2 + 3 + 3 <br />
where = ability. Regressing 3 on 2 clearly gives biased<br />
estimates of 23 as ( | 2 ) 6= 0 If 3 0 then OLS estimates<br />
of 23 are upward biased. One estimation approach is to use<br />
1 as a proxy for ability:<br />
3 = 23 2 + 3 ( 1 1 )+ 3 <br />
36
However, this results in a similar problem – regressing 3 on<br />
1 <strong>and</strong> 2 will give biased estimates as 1 is correlated with our<br />
residual. (i.e., 1 is an imperfect proxy).<br />
Solutions:<br />
Onesolutionistouse 1 as an instrument for 1 Why<br />
is this a valid IV ? From our construction of the model, we<br />
know that the are uncorrelated across equations <strong>and</strong> groups.<br />
Further, test scores are correlated across siblings. That is,<br />
( 1 1 ) 6= 0by our group structure.<br />
Another solution is possible if there exists an additional early<br />
reading on the same person:<br />
0 = 0 + 0 <br />
Then if 0 6=0 0 is a valid proxy for 1 <strong>and</strong> we can perform<br />
2SLS.<br />
37
3.2 Griliches <strong>and</strong> Chamberlain model<br />
Here we have a modified triangular system as follows:<br />
1 = 1 + 1<br />
2 = 12 1 + 2 + 2<br />
3 = 13 1 + 23 2 + 3 + 3<br />
where 1 = years schooling, 2 = late test score (SAT), <strong>and</strong><br />
3 = earnings. Notethattherearealternativemodelswith<br />
other dependent variables. For example, { 1 = schooling, 2 =<br />
early earnings, <strong>and</strong> 3 = late earnings}, <strong>and</strong> { 1 = schooling,<br />
2 = consumption, <strong>and</strong> 3 = earnings}. Getting the equation<br />
system into reduced form <strong>and</strong> expressing as matrix notation,<br />
we write<br />
= + ,<br />
38
where:<br />
<strong>and</strong>:<br />
=<br />
=<br />
<br />
<br />
1<br />
2<br />
=<br />
3<br />
<br />
<br />
1<br />
2<br />
=<br />
3<br />
<br />
1<br />
2 + 12 1<br />
3 + 13 1 + 23 ( 2 + 12 1 )<br />
<br />
1<br />
2 + 12 1<br />
3 + 13 1 + 23 ( 2 + 12 1 )<br />
Estimation. For estimation, we impose that 23 =0 In our<br />
second example of section 3.2, this would be equivalent to stating<br />
that there is no correlation between transient income <strong>and</strong><br />
consumption (permanent income hypothesis). In general, with<br />
one factor, we need one more exclusion than that implied by<br />
triangularity.<br />
39
(i) 1 proxies .<br />
so that<br />
= 1 1<br />
1<br />
2 = 2<br />
1<br />
1 2<br />
1<br />
1 + 2 .<br />
We can then estimate 2<br />
1<br />
consistently by using 1<br />
as an instrument for 1 in the equation above.<br />
(ii) Get residuals from (i): = 2 2<br />
1<br />
1 .<br />
(iii). Use the residuals as an instrument for 1 in<br />
the 3 equation. is valid since it is both uncorrelated<br />
with <strong>and</strong> 3 <strong>and</strong> it is correlated with 1 :<br />
40
μ<br />
( 1 )= 1 2 <br />
2<br />
<br />
1<br />
μ<br />
1<br />
= 1 + 1 2 + 12 1 <br />
2 + 12 1<br />
1<br />
<br />
μ<br />
1<br />
= 1 + 1 2 <br />
2<br />
1 6= 0<br />
1<br />
if 1 6=0 <strong>and</strong>, 2 6=0 Thus we can estimate 13 .<br />
(iv). Interchange the role of 2 <strong>and</strong> 3 to estimate<br />
12 .<br />
(v). Form the residual (<strong>and</strong> recall that 13 is known<br />
<strong>and</strong> 23 =0)<br />
= 3 13 1 = 3 + 3 .<br />
41
(vi) Use 1 as a proxy for ability. Substituting this<br />
into gives:<br />
= 3<br />
1<br />
1 + 3<br />
1<br />
3 3<br />
1<br />
1 .<br />
(vii) Now use 1 as an instrument for 1 in the<br />
above to get an estimate of 3<br />
1<br />
.<br />
(viii) Interchange the role of 2 <strong>and</strong> 3 to estimate 2<br />
1<br />
.<br />
42
3.3 Triangular systems more generally<br />
Without loss of generality, suppose that 2 is excluded from the<br />
equation of our system. (We are supposing the existence<br />
of an extra exclusion than that implied by triangularity). We<br />
seek to estimate the parameters of the system in equation as<br />
well as equations before <strong>and</strong> after <br />
Equation t.<br />
i. Use 1 as a proxy for ability. Solving for <strong>and</strong><br />
substituting into the equation:<br />
= + <br />
43
We get:<br />
= <br />
1<br />
1 <br />
1<br />
1 + <br />
<strong>and</strong> we are considering =2 1 The ratio <br />
1<br />
can then<br />
be identified using 1 as an instrument for 1 <br />
ii. Form the residuals:<br />
= <br />
1<br />
1 =2 1<br />
Now we have 2 IV’s ( 2 3 1 ) for the<br />
2 independent variables in the equation (<br />
1 3 1 ) so we can consistently estimate the<br />
coecients in the equation.<br />
44
Equations before t.<br />
iii. Form:<br />
= 1 1 ··· 1 1<br />
We can use 1 ··· 1 <br />
to form 1 purged<br />
IV ’s <strong>and</strong> is used as a proxy for unobserved ability,<br />
. Inthisway,wecanestimatealloftheparameters<br />
in equations (Note the sequential<br />
order implicit in this triangular system. We must<br />
first estimate before this step can be made.)<br />
Example. Suppose 3 <strong>and</strong><br />
3 = 13 1 + 23 2 + 3 + 3 .<br />
45
Use = + as a proxy for . Substituting this into our<br />
3 equation yields:<br />
3 = 13 1 + 23 2 + μ<br />
3<br />
+ 3 <br />
3<br />
.<br />
<br />
Observe that 1 <strong>and</strong> 2 , are independent of our residual, but <br />
is not. We can use as an instrument for to estimate the<br />
parameters above. This obviously generalizes for all equations<br />
less than .<br />
46
Equations after t.<br />
iv. Assume identification for all equations through<br />
via an exclusion restriction in equation .<br />
Example. As an example, consider the following:<br />
Define:<br />
4 = 14 1 + 24 2 + 34 3 + 4 + 4<br />
2 2 12 1 3 3 13 1 23 2<br />
Solving for 1 <strong>and</strong> 2 <strong>and</strong> substituting into the equation for 4 <br />
we find:<br />
47
4 = 14 1 + 24 2 + 34 ( 3 + 13 1 + 23 2 )+ 4 + 4<br />
where:<br />
= ( 14 + 34 13 ) 1 +( 24 + 34 23 ) 2 + 34 3 + 4 + 4<br />
= ( 14 + 34 13 ) 1 +( 24 + 34 23 )(2 + 12 1 )<br />
+ 34 3 + 4 + 4<br />
= 14 1 + 24 2 + 34 3 + 4 + 4<br />
14 = 14 + 24 12 + 34 13<br />
24 = 24 + 23 34<br />
Using 1 as a proxy for <strong>and</strong> substituting we get:<br />
μ<br />
4 = 1 1 + 242 + 34 3 + 4 <br />
4<br />
1<br />
1<br />
48
where 1 = 14 + 4<br />
1<br />
We can then use 1 2 <strong>and</strong> 3 as<br />
instruments to get an estimate of 34 Define:<br />
˜ 4 = 4 34 3 = 14 1 + 24 2 + 4 + 4<br />
(Excluding 3 allows us to estimate the remaining parameters).<br />
Using 3 as a proxy for yields:<br />
4 = 14 1 + 24 2 + μ<br />
4<br />
3 + 4 <br />
4<br />
3 .<br />
3 3<br />
We can then estimate 14 <strong>and</strong> 24 by using 1 2 <strong>and</strong> 3 as<br />
an IV. We can continue estimating. For example, consider the<br />
5 equation:<br />
(i) Rewrite in terms of 1 2 3 <strong>and</strong> 4<br />
49
(ii) Use 1 to proxy .<br />
(iii) Use a cross-member IV for 1 in addition to<br />
=2 3 4 which gives our estimate of 45 <br />
(iv) Now form ˜ 5 = 5 45 4 <br />
(v) With 4 excluded, we can use purged IV ’s on<br />
˜ 5 as before.<br />
50
3.4 Comments<br />
1. One needs to check the rank order conditions<br />
for identification (requires imposing an exclusion<br />
restriction).<br />
2. Griliches <strong>and</strong> Chamberlain (IER, 1976) find a<br />
small ability bias - 3 decimal point dierence in<br />
schooling coecient.<br />
51
4 Twin Methods<br />
Basic Principle: Monozygotic or MZ (identical) twins are<br />
more similar than Dizygotic or DZ (fraternal) twins. The key<br />
assumption is that if environmental factors are the same for<br />
both types of twins, then we can estimate genetic components<br />
to outcomes.<br />
52
4.1 Univariate Twin Model<br />
Let = observed phenotypic variable, = unobserved genotype,<br />
<strong>and</strong> = environment. Further, suppose that we can<br />
write our model additively:<br />
= + <br />
<strong>and</strong> assume independence of <strong>and</strong> so that 2 = 2 + 2 .<br />
Now suppose that we have data on another individual:<br />
= + <br />
Then our phenotypic covariance is:<br />
( )= ( )+ ( )<br />
53
where we are imposing the assumption:<br />
( )=( )=0<br />
Defining st<strong>and</strong>ardized forms <strong>and</strong> some simplifying notation, let<br />
˜ <br />
˜ <br />
˜ <br />
2 2 <br />
2 <br />
<br />
2 2 <br />
2 <br />
Thus, ˜ =˜ +˜ which implies ˜ = ˜ + ˜ We can<br />
also derive the identity:<br />
2 + 2 = 2 <br />
2 <br />
+ 2 <br />
2 <br />
=1<br />
where the last step follows from our assumption of independence.<br />
Now we wish to consider the correlation between ob-<br />
54
served phenotypes of our two individuals:<br />
= ( )<br />
= (˜ + ˜ ˜ + ˜ )<br />
= 2 (˜ ˜ )<br />
+ 2 (˜ ˜ )<br />
(˜) (˜)<br />
= 2 + 2 <br />
say, with <strong>and</strong> defined as above. We assume that =1<br />
<strong>and</strong> that 1 Thatis,thegenotypicvariableisperfectly<br />
correlated among identical twins, but less than perfectly correlated<br />
among fraternal twins. Replacing this result into the<br />
above produces:<br />
= 2 + 2<br />
= 2 + 2<br />
55
Therefore:<br />
= (1 ) 2 +( ) 2<br />
= (1 ) 2 +( )(1 2 )<br />
where the last equality follows from our established identity.<br />
Solving for 2 , we find:<br />
2 = ( ) ( )<br />
(1 ) ( )<br />
The only known in the right h<strong>and</strong> side of the above equality is<br />
the expression ( ), which is simply the correlation<br />
coecient of the observed phenotypic variable. The remaining<br />
two expressions, (1 ) <strong>and</strong> ( ) can not be computed<br />
as they represent statistics on variables we don’t observe.<br />
56
One could impose = so that:<br />
2 = <br />
1 <br />
<br />
The expression is a measure of how closely the genetic<br />
variable is correlated across our two observations. One could<br />
then guess or estimate a value for this parameter to derive<br />
corresponding estimates of 2 the ratio of how much variance<br />
in the phenotypic variable is explained by variance in the genetic<br />
component. Other studies have attempted to include<br />
( ) 6= 0but this presents an identification problem. A<br />
typical value of the estimable portion of the above, ,<br />
is commonly reported in the literature to be 02.<br />
57
Web Appendix D<br />
Notes on Figure 2, Predictive Validities of IQ <strong>and</strong> Big Five Dimensions<br />
Leadership<br />
Associations between personality <strong>and</strong> IQ <strong>and</strong> leadership were taken from two meta-analyses<br />
conducted by the same research group (Judge, Bono, Ilies, <strong>and</strong> Gerhardt, 2002; Judge, Colbert,<br />
<strong>and</strong> Ilies, 2004). Leadership was defined jointly as “leader emergence,” the degree to which the<br />
individual is viewed as a leader by others, <strong>and</strong> “leader effectiveness,” performance in influencing<br />
<strong>and</strong> guiding the activities of a group. Typically, these assessments were made by subordinates,<br />
supervisors, peers, or observers. Studies relying on self-report assessments of leadership were<br />
not included.<br />
Estimated true score correlations between IQ <strong>and</strong> leadership were corrected for unreliability in<br />
the predictor <strong>and</strong> criterion, as well as for range restriction. Estimated true score correlations<br />
between personality <strong>and</strong> leadership were corrected for reliability in the predictor <strong>and</strong> criterion,<br />
but not for range restriction.<br />
Job Performance<br />
Associations between personality <strong>and</strong> job performance were taken from a meta-analysis (Barrick<br />
<strong>and</strong> Mount, 1991). Job performance was defined by three criteria: job proficiency (primarily<br />
assessed by performance ratings), training proficiency (primarily assessed by training<br />
performance ratings), <strong>and</strong> personnel data (including salary level, turnover, status change, <strong>and</strong><br />
tenure).<br />
The association between IQ <strong>and</strong> job performance was taken from (Hogan, 2005). This article did<br />
not state whether this correlation is observed or corrected. The much higher estimate of corrected<br />
validity is offered by Schmidt <strong>and</strong> Hunter (2004). Concerns about over-correction with respect to<br />
restriction on range <strong>and</strong> reliability have been raised by Hartigan <strong>and</strong> Wigdor (1984) with specific<br />
reference to estimating the effect of IQ on job performance.<br />
Longevity<br />
Associations between personality <strong>and</strong> longevity were taken from a review of 34 studies that were<br />
prospective in design <strong>and</strong> which controlled for demographic factors (Roberts, Kuncel, Shiner,<br />
Caspi, <strong>and</strong> Goldberg, in press). Estimated true score correlations were not provided.<br />
Years of Education<br />
Cross-sectional associations between personality <strong>and</strong> years of schooling were taken from a study<br />
(Goldberg, Sweeney, Merenda, <strong>and</strong> Hughes, 1998) using a large (N = 3629) sample of<br />
individuals representative of working adults in the U.S. in the year 2000. Estimated true score<br />
correlations were not provided.<br />
1
The association between IQ <strong>and</strong> years of schooling was taken from a review by an American<br />
Psychological Association (APA) taskforce (Neisser et al., 1996). This article did not state<br />
whether this correlation was observed or corrected.<br />
College Grades<br />
Associations between personality <strong>and</strong> college academic performance were taken from a metaanalysis<br />
of 23 studies (collective N = 5878) by O’Connor <strong>and</strong> Paunonen (in press). Most of the<br />
reviewed studies used as measures of academic performance GPA, but several also used course<br />
exam grades.<br />
The association between IQ <strong>and</strong> college GPA is from a review (Jensen, 1998). This article did<br />
not state whether this correlation is observed or corrected. A similar estimate (r = .5) is offered<br />
by Neisser et al. (1996) for the association between IQ <strong>and</strong> general academic performance.<br />
References<br />
Barrick, M.R. <strong>and</strong> Mount, M.K. (1991). The big five personality dimensions <strong>and</strong> job<br />
performance: A meta-analysis. Personnel Psychology, 44, 1-26.<br />
Goldberg, L. R., Sweeney, D., Merenda, P. F., <strong>and</strong> Hughes, J. E., Jr. (1998). Demographic<br />
variables <strong>and</strong> personality: The effects of gender, age, education, <strong>and</strong> ethnic/racial status<br />
on self-descriptions of personality attributes. <strong>Personality</strong> <strong>and</strong> Individual Differences,<br />
24(3), 393-403.<br />
Hartigan <strong>and</strong> Wigdor (1984).<br />
Hogan, R. (2005). In Defense of <strong>Personality</strong> Measurement: New Wine for Old Whiners. Human<br />
Performance, 18(4), 331-341.<br />
Jensen, A. R. (1998). The g Factor: The Science of Mental Ability. Westport, CT: Praeger.<br />
Judge, T. A., Bono, J. E., Ilies, R., <strong>and</strong> Gerhardt, M. W. (2002). <strong>Personality</strong> <strong>and</strong> leadership: A<br />
qualitative <strong>and</strong> quantitative review. Journal of Applied Psychology, 87(4), 765-780.<br />
Judge, T. A., Colbert, A. E., <strong>and</strong> Ilies, R. (2004). Intelligence <strong>and</strong> Leadership: A Quantitative<br />
Review <strong>and</strong> Test of Theoretical Propositions. Journal of Applied Psychology, 89(3), 542-<br />
552.Judge, T. A., <strong>and</strong> Hurst, C. (in press). Capitalizing on One's Advantages: Role of<br />
Core Self-Evaluations. Journal of Applied Psychology, 1-49.<br />
Neisser, U., Boodoo, G., Bouchard, T. J. J., Boykin, A. W., Brody, N., <strong>and</strong> Ceci, S. J. et al.<br />
(1996). Intelligence: Knowns <strong>and</strong> unknowns. American Psychologist, 51, 77-101.<br />
O'Connor, M. C., <strong>and</strong> Paunonen, S. V. (in press). Big Five personality predictors of postsecondary<br />
academic performance. <strong>Personality</strong> <strong>and</strong> Individual Differences, 1-42.<br />
Schmidt, F. L. <strong>and</strong> Hunter, J. (2004). General mental ability in the world of work: Occupational<br />
attainment <strong>and</strong> job performance. Journal of <strong>Personality</strong> <strong>and</strong> Social Psychology, 86(1),<br />
162-173.<br />
Roberts, B. W., Kuncel, N., R., Shiner, R., Caspi, A., <strong>and</strong> Goldberg, L. R. (in press). The Power<br />
of <strong>Personality</strong>: The Comparative Validity of <strong>Personality</strong> Traits, Socio-Economic Status,<br />
<strong>and</strong> Cognitive Ability for Predicting Important Life Outcomes. Perspectives on<br />
Psychological Science.<br />
2