
Create successful ePaper yourself
Turn your PDF publications into a flip-book with our unique Google optimized e-Paper software.
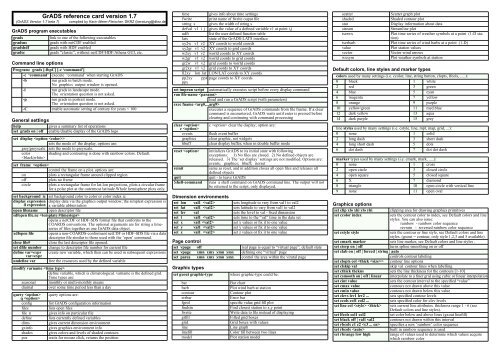
<strong>GrADS</strong> <strong>reference</strong> <strong>card</strong> <strong>version</strong> <strong>1.7</strong><br />
(<strong>GrADS</strong> Version <strong>1.7</strong> beta 7) compiled by Karin Meier-Fleischer, DKRZ (beratung@dkrz.de)<br />
<strong>GrADS</strong> program executables<br />
grads<br />
gradsnc<br />
gradshdf<br />
gradsc<br />
Command line options<br />
link to one of the following executables<br />
grads with netCDF enabled<br />
grads with HDF enabled<br />
grads “classic”, without netCDF/HDF/Athena GUI, etc.<br />
Program: grads [-lbpC] [-c ‘command’]<br />
-c ‘command’ execute ‘command’ when starting <strong>GrADS</strong><br />
-b run grads in batch mode.<br />
No graphics output window is opened.<br />
-l run grads in landscape mode.<br />
The orientation question is not asked.<br />
-p run grads in portrait mode.<br />
The orientation question is not asked.<br />
-C enable automatic setting of century for years < 100<br />
General settings<br />
help<br />
gives a summary list of operations<br />
set grads on | off enable/disable display of the <strong>GrADS</strong> logo<br />
set display <br />
sets the mode of the display. options are:<br />
grey|greyscale sets the mode to greyscale.<br />
color shading and contouring is done with rainbow colors. Default.<br />
<br />
set frame <br />
control the frame on a plot. options are:<br />
on<br />
plots a rectangular frame around clipped region<br />
off<br />
plots no frame<br />
circle plots a rectangular frame for lat-lon projections, plots a circular frame<br />
for a polar plot at the outermost latitude.Whole hemisphere plots only.<br />
set background ic set background color to color or color index ic<br />
display expression display data via the graphics output window; the simplest expression is<br />
d expression a variable abbreviation<br />
open filename open descriptor file<br />
sdfopen file.nc <br />
opens a netCDF or HDF-SDS format file that conforms to the<br />
COARDS conventions. The optional arguments are for string a timeseries<br />
of files together as one <strong>GrADS</strong> data object.<br />
xdfopen file opens a non-COARDS-conformant netCDF or HDF-SDS file via a data<br />
descriptor file similar to those used with the ‘open‘ command.<br />
close file# close the last descriptor file opened.<br />
set dfile number change to descriptor file number for current file<br />
define var=expr create new variable, which then can be used in subsequent expressions<br />
var=expr<br />
undefine var free the resources used by the defined variable<br />
modify varname <br />
define variable, which is climatological. varname is the defined grid.<br />
Time types are:<br />
seasonal monthly or multi-monthly means<br />
diurnal over some time period less than a day<br />
query <br />
q <br />
query options are:<br />
config list <strong>GrADS</strong> configuration information<br />
files lists open files<br />
file n gives info on particular file<br />
define lists currently defined variables<br />
dims gives current dimension environment<br />
gxinfo gives graphics environment info<br />
shades gives colors and levels of shaded contours<br />
pos<br />
waits for mouse click, returns the position<br />
time gives info about time settings<br />
fwrite print name of fwrite ouput file<br />
string s gives the width of string s<br />
defval v1 i j gives the value of a defined variable v1 at point i,j<br />
udft list the user defined function table<br />
lats<br />
state of the <strong>GrADS</strong>-LATS interface<br />
xy2w v1 v2 XY coords to world coords<br />
xy2gr v1 v2 XY coords to grid coords<br />
w2xy v1 v2 world coords to XY coords<br />
w2gr v1 v2 world coords to grid coords<br />
gr2w v1 v2 grid coords to world coords<br />
gr2xy v1 v2 grid coords to XY coords<br />
ll2xy lon lat LON/LAT coords to XY coords<br />
pp2xy ppx page coords to XY coords<br />
ppy<br />
set imprun script automatically executes script before every display command<br />
run file-name <br />
load and run a <strong>GrADS</strong> script (with parameters)<br />
exec fname <br />
executes a sequence of <strong>GrADS</strong> commands from file fname. If a clear<br />
command is encountered, <strong>GrADS</strong> waits until enter is pressed before<br />
clearing and continuing with command processing<br />
clear <br />
c <br />
events<br />
graphics<br />
hbuff<br />
reset <br />
reinit<br />
quit<br />
!shell-command<br />
Dimension environments<br />
set lon val1 sets longitude to vary from val1 to val2<br />
set lat val1 sets latitude to vary from val1 to val2<br />
set lev val sets the level to val - fixed dimension<br />
set t val1 sets time to the “val” time in the data set<br />
set x val1 set x values or fix it to one value<br />
set y val1 set y values or fix it to one value<br />
set z val1 set z values or fix it to one value<br />
Page control<br />
set vpage off real page is equal to “virtual page”; default state<br />
set vpage xmn xmx ymn ymx defining one “virtual” page<br />
set parea xmn xmx ymn ymx control the area within the virutal page<br />
Graphic types<br />
set gxout graphic-type<br />
bar<br />
barb<br />
contour<br />
errbar<br />
fgrid<br />
findstn<br />
fwrite<br />
grfill<br />
grid<br />
line<br />
linefill<br />
model<br />
c clear the display; option are:<br />
flush event buffer<br />
clear graphic, not widgets<br />
clear display buffer, when in double buffer mode<br />
initializes <strong>GrADS</strong> to its initial state with following<br />
exceptions: 1) No files are closed. 2) No defined objects are<br />
released. 3) The ‘set display’ settings are not modified. Options are:<br />
events; graphics; hbuff; norset<br />
same as reset, and in addition closes all open files and releases all<br />
defined objects<br />
quit - to leave <strong>GrADS</strong><br />
runs a shell command on <strong>GrADS</strong> command line. The output will not<br />
be returned to the script, only displayed.<br />
where graphic-type could be:<br />
Bar chart<br />
Plot wind barb at station<br />
Contour plot<br />
Error bar<br />
specific value grid fill plot<br />
Find closest station to x,y point<br />
Write data to file instead of displaying<br />
Filled grid boxes<br />
Grid boxes with values<br />
Line graph<br />
Color fill between two lines<br />
Plot station model<br />
scatter<br />
shaded<br />
stat<br />
stream<br />
tserwx<br />
tserbarb<br />
value<br />
vector<br />
wxsym<br />
Scatter graph plot<br />
Shaded contour plot<br />
Display information about data<br />
Streamline plot<br />
Plot time series of weather symbols at a point (1-D station)<br />
Plot time series of wind barbs at a point (1-D)<br />
Plot station values<br />
Vector wind arrows<br />
Plot weather symbols at station<br />
Default colors, line styles and marker types<br />
colors used by many settings (i.e. ccolor, line, string button, clopts, lfcols, .....):<br />
0 black 1 white<br />
2 red 3 green<br />
4 blue 5 cyan<br />
6 magenta 7 yellow<br />
8 orange 9 purple<br />
10 yellow/green 11 med.blue<br />
12 dark yellow 13 aqua<br />
14 dark purple 15 grey<br />
line styles used by many settings (i.e. cstyle, line, mpt, map, grid, ...):<br />
0 none 1 solid<br />
2 long dash 3 short dash<br />
4 long short dash 5 dots<br />
6 dot dash 7 dot dot dash<br />
marker types used by many settings (i.e. cmark, mark, .....):<br />
0 none 1 cross<br />
2 open circle 3 closed circle<br />
4 open square 5 closed square<br />
6 X 7 diamond<br />
8 triangle 10 open circle with vertical line<br />
9 none 11 open oval<br />
Graphics options<br />
set clip xlo xhi ylo yhi clipping area for drawing graphics primitives<br />
set ccolor index<br />
sets the contour color to index, see Default colors and line<br />
styles. You can also issue:<br />
rainbow - rainbow color sequence<br />
revrain - reversed rainbow color sequence<br />
set cstyle style<br />
sets the contour or line style, see Default colors and line<br />
styles. (gxout = contour, only style 1,2,3 and 5 available).<br />
set cmark marker sets line marker, see Default colors and line styles .<br />
set cterp on | off<br />
turns spline smoothing on or off<br />
set clab on | off | forced | string | auto<br />
controls contour labeling<br />
set clopts col contour line options<br />
set clskip val<br />
skip val contour lines when labelling<br />
set cthick thckns sets the line thickness for the contours [1-10]<br />
set csmooth on | off | linear interpolate to a finer grid using cubic or linear interpolation<br />
set cint value<br />
sets the contour interval to the specified “value”<br />
set cmax value<br />
contours not drawn above this value<br />
set cmin value<br />
contours not drawn below this value<br />
set clevs lev1 lev2 ...<br />
sets specified contour levels<br />
set ccols col1 col2 ...<br />
sets specified color for clev levels<br />
set line col sets current line attributes. thickness range 1 - 6 (see<br />
Default colors and line styles).<br />
set lfcols col1 col2<br />
set color below and above lines (gxout linefill)<br />
set black off | val1 val2 contours not drawn within this interval<br />
set rbcols c1 c2 specifies a new ‘rainbow’ color sequence<br />
set rbcols <br />
built in rainbow sequence is used<br />
set rbrange low high range of values used to determine which values acquire<br />
which rainbow color
set grid on | off | | horizontal | vertical<br />
draw grid lines using the specified options or not<br />
set bargap val<br />
sets the gap between bars in percent<br />
set barbase value | bottom | top bar rises from or falls from value<br />
set baropts filled | outline bar outlined or filled; default: filled<br />
set dignum number<br />
number of digits after the decimal place<br />
set digsize size<br />
size (in inches, or plotter units) of the numbers<br />
set arrlab on|off<br />
set arrow labeling on or off<br />
set arrscl size specifies arrow length scaling<br />
set arrowhead size<br />
specifies arrow head size<br />
set fgvals v1 c1 ... fgrid output type treats the grid values as rounded integers,<br />
and will shade a specified integer valued grid with the<br />
specified color.<br />
set zlog on | off<br />
sets log scaling of the Z dimension on or off<br />
set strmden value<br />
specifies the streamline density, where value is from 1 to<br />
10. Default: 5<br />
set stnopts plot the number in the slp location as a three digit number<br />
with only the last three digits of the whole number plotted<br />
set mdlopts noblank | blank | dig3 | nodig3<br />
plot the number of the model data as a three digit<br />
set stid on | off<br />
controls wether the station id is displayed next to the values<br />
or not<br />
set wxcols c1 c2 c3 c4 c5 c6 set colors for weather symbols c1 - c6<br />
Axis labeling/Annotation/labeling<br />
set xaxis start end specifies the axis is to be labeled<br />
set yaxis start end specifies the axis is to be labeled<br />
set xlevs lab1 lab2 ... specifies the label levels to plot for the X axis<br />
set ylevs lab1 lab2 ... specifies the label levels to plot for the Y axis<br />
set xlint interval<br />
specifies the label interval of the X axis<br />
set ylint interval<br />
specifies the label interval of the Y axis<br />
set xyrev on<br />
reverses the axes on a plot<br />
set xflip on<br />
flips the order of the horizontal axis<br />
set yflip on<br />
flips the order of the vertical axis<br />
set xlab on | off | auto | string controls and/or draws X axis label<br />
set ylab on | off | auto | string controls and/or draws Y axis label<br />
set xlabs lab1 | lab2 | .... abel the x axis with lab1, lab2, lab3, ....<br />
set ylabs lab1 | lab2 | .... label the y axis with lab1, lab2, lab3, ....<br />
draw xlab string<br />
draw x axis label<br />
draw ylab string<br />
draw y axis label<br />
set xlopts col controls X axis<br />
set ylopts col controls Y axis<br />
set xlpos offset side controls position of x axis labels. Where offset - in inches;<br />
side - b or t (bottom or top)<br />
set ylpos offset side controls position of y axis labels. Where offset - in inches;<br />
side - r or l (right or left)<br />
set zlog on | off | swap | undefine<br />
sets log scaling of the Z axis<br />
set annot col sets color and line thickness for the above 3 draw commands<br />
set vrange vlo vhi Set range for plotting 1-D or scatter plots; range of the variable<br />
values for y-axis scaling<br />
set vrange2 vlo vhi Set range for plotting 1-D or scatter plots; range of the variable<br />
values for x-axis scaling<br />
set missconn on | off lines will be connected across missing data<br />
draw title string<br />
draw title at top of graph<br />
Map projections/drawing<br />
set mproj proj sets current map projection. Keywords are:<br />
latlon Lat/lon projection with aspect ratio maintained. Default.<br />
scaled latlon projection where aspect ratio is not maintained.The plot fills the<br />
plotting area.<br />
nps north polar stereographic<br />
sps south polar stereographic<br />
robinson Robinson projection<br />
orthogr Orthographic projection<br />
mollweide Mollweide projection<br />
lambert Lambert conformal conic projection<br />
off<br />
same as scaled, but no map is drawn and lables are not interpreted as lat/<br />
lon labels<br />
set mpt type off | <br />
command to control map background behavior. type is the map type; it<br />
can be a number from 0 to 255, or it can be an asterick (*) to indicate this<br />
command applies to all the type values. The color can be set to -1, which<br />
indicates to <strong>GrADS</strong> to use the set map settings for this map type, rather<br />
than the settings specified by the set mpt command.<br />
set mpvals off | lnmn lnmx ltmn ltmx<br />
sets <strong>reference</strong> longitudes and latitudes for polar stereogr. plots<br />
set mpdset lowres | mres | hires | nmap<br />
mres and hires have state and country outlines. nmap covers only North<br />
America. Default:lowres.<br />
set map auto | color <br />
draws the map background using the requested line<br />
attributes or auto mode<br />
set mpdraw on | off<br />
if off, does not draw the map background<br />
set grid on | off | horizontal | vertical<br />
draw or do not draw lat/lon lines on polar plots using the specified color<br />
and linestyle<br />
set poli on | off selects whether you want political boundries drawn for the mres or hires<br />
map data sets. Default is on<br />
Graphic primitives<br />
draw line x1 y1 x2 y2 draws a line from x1, y1 to x2, y2 using current line drawing<br />
attributes<br />
draw rec xlo ylo xhi yhi draws an unfilled rectangle<br />
draw recf xlo ylo xhi yhi draws a filled rectangle<br />
draw mark marktype x y size<br />
draws a marker. Marker types (see Default colors and line styles).<br />
draw polyf x1 y1 x2 y2 ... xn yn<br />
draw a filled polyline, where xn=x1 and yn=y1<br />
draw wxsym symbol x y size <br />
Draws the specified wx symbol at the specified location<br />
String primitives<br />
set string col <br />
sets string drawing attributes. Justification:<br />
l - left; c - center; r - right; tl - top left; tc - center top;<br />
tr - right top; bl - bottom left; tc - center bottom; tr - right bott.<br />
Roation: 90 - counterclockwise, -90 - clockwise..<br />
set strsiz width sets the string character size<br />
draw string x y string draws the character string at the x,y position<br />
draw title string draw a title ‘string’ on top of the graph<br />
Color settings<br />
set rgb num red green blue defines new colors within <strong>GrADS</strong>, and assigns them to a new<br />
color number.color-number num must be a value between 16<br />
and 99 (0 to 15 are predefined)<br />
Font settings<br />
set font number change to font number [0-5]<br />
Widgets<br />
set button 1 bcol1 bcol2 bcol3 0 fcol1 fcol2 fcol3 thickness<br />
set button colors. 1 - “on” state; 0 - “off” state<br />
draw button number x y width height string<br />
draws a button on position x,y with the attributes<br />
redraw button number 0 | 1<br />
redraws button number; 1 - “on”; 0 - “off”<br />
set rband wn mode x1 y1 x2 y2<br />
rubber banding. wn = widget #; mode = box or line<br />
x1, y1 = lowest point in x/y page units<br />
x2, y2 = highest point in x/y page units<br />
draw dropmenu number x y width height text<br />
display a dropmenu similar to ‘draw button’ command widget number (0 to<br />
64); x and y are the center location for the ‘base’ of the dropmenu; width and<br />
height are the size of the ‘base’ of the dropmenu.<br />
Double buffering<br />
set dbuff on|off sets double buffer mode on or off<br />
swap<br />
swaps buffers, when double buffer mode is on<br />
Animation<br />
set looping on|off<br />
set loopdim x|y|z|t<br />
set loopincr incr<br />
Hardcopy output<br />
enable print fname enables the print command to the given file fname<br />
print<br />
copy the contents of current display into a file in a metacode format<br />
disable print close print output file<br />
outxwd file output the graphicw window to a file in the X windows dump format<br />
wi file.format output to a file with format (using ImageMagick), e.g. wi test.gif<br />
Create/Write a grid file<br />
set fwrite fname<br />
set gxout fwrite<br />
disable fwrite<br />
control animation; set animation on or off<br />
animate through x,y,z or t; default: t<br />
set looping increment<br />
output grid fname; if not set, fname=grads.fwrite<br />
enables grid file output<br />
close output grid file<br />
Mathematical Functions<br />
abs(expr) absolute value of result of expr. Operates on gridded and station data<br />
acos(expr) applies the cos -1 function to the result of expr<br />
asin(expr) applies the sin -1 function to the result of expr<br />
atan2(expr1,expr2) applies the tan -1 function to the result of the two expr, using tanθ = y/x<br />
cos(expr) takes the cosine of the expr<br />
exp(expr) performs the ex operation, where expr is x. gridded and station data<br />
gint(expr) general integral, same as ave except do not devide by the total area<br />
log(expr) takes the natural logarithm of expr<br />
log10(expr) takes the logarithm base 10 of the expr<br />
pow(expr1,expr2) raises the values of expr1 to the power of expr2<br />
sin(expr) takes the sine of the provided expr (in radians)<br />
sqrt(expr) takes the square root of the result of the expr<br />
tan(expr) takes the trigonometric tangent of the expr<br />
Averaging Functions<br />
ave(expr,dexpr1,dexpr2)<br />
generalized averaging function. expr is averaged through the dimension<br />
range specified by dim1 and dim2<br />
aave(expr,xdim1,xdim2,ydim1,ydim2)<br />
does area average. xdim1 and xdim2 must be for lon or x, ydim1 and<br />
ydim2 must be for lat or y (e.g. aave(t,lon=0,lon=180,lat=0,lat=90))<br />
mean(expr,dexpr1,dexpr2)<br />
same as ave, except that area weighting is disabled<br />
amean(expr,xdim1,xdim2,ydim1,ydim2)<br />
same as aave, except that area weighting is disabled<br />
vint(psexpr,expr,top) performs a mass-weighted vertical integral in mb pressure coordinates,<br />
where: exprexpression for quantity to be integrated psexpr<br />
expression yielding the surface pressure, in mb,which will be used to<br />
bound the integration on the bottom topconstant, giving the bounding<br />
top pressure, in mb. This cannot be provided as an expression<br />
Grid Functions<br />
const(expr,const) function allows you to set various parts of a grid to a constant<br />
maskout(expr,mask) whenever the mask values are less than zero, the values in expr<br />
are set to the missing data value<br />
skip(expr,skipx,skipy) sets alternating values of the expr to the missing data value.This<br />
function is used while displaying wind arrows or barbs to thin the<br />
number of arrows or barbs
Filtering Functions<br />
smth9(expr) performs a 9 point smoothing to the gridded result of expr<br />
Finite Difference Functions<br />
cdiff(expr,dim) performs a centered difference operation on expr in the direction specified<br />
by dim<br />
Variables<br />
complete specification for a variable name<br />
abbrev.file#(dimexpr,dimexpr,...)<br />
abbrev is the abbreviation for the variable as specified in the data descriptor file file#<br />
is the file number that contains this variable. The default initially is 1. dimexpr is a<br />
dimension expression that locally modifies the current dimension environment.<br />
Meteorological Functions<br />
tvrh2q(tvexpr,rhexpr) given virtual temperature and relative humidity, tvrh2q returns<br />
specific humidity, q, in g/g<br />
tvrh2t(tvexpr,rhexpr) given virtual temperature and relative humidity, tvrh2t returns the<br />
temperature in degrees Kelvin<br />
Special Purpose Functions<br />
tloop(expr) when time is varying dimension in the dimension environment, tloop function<br />
evaluates the expr at fixed times, then constructs the time series to obtain a<br />
final result that is the time varying<br />
Vector Functions<br />
hcurl(uexpr,vexpr)<br />
hdivg(expr1,expr2)<br />
mag(uexpr,vexpr)<br />
calculates the vertical component of the curl (i.e.vorticity) at each<br />
grid pointusing finite differencing on the grids provided<br />
calculates the horizontal divergence using the finite differencing<br />
performs the calculation: sqrt(uexpr*uexpr+vexpr*vexpr)<br />
Station Data Functions<br />
gr2stn(grid_expr,stn_expr) performs an interpolation from grid space back to station locations<br />
oacres(grid_expr,stn_expr)<br />
a Cressman objective analysis is performed on the station data<br />
to yield a gridded result representing the station data<br />
stnave(expr,dexpr1,dexpr2)<br />
takes an average of station data over time<br />
stnmin(expr,dexpr1,dexpr2)<br />
examines a time series of station data and returns the minimum<br />
value encountered for each station<br />
stnmax(expr,dexpr1,dexpr2)<br />
examines a time series of station data and returns the maximum<br />
value encountered for each station<br />
Create PostScript files<br />
Program: gxps [-c] [-r] [-d] [-i mfile] [-o ofile]<br />
converts the <strong>GrADS</strong> meta file into a PostScript file. Command line options:<br />
-c color on a white background (=old gxpscw)<br />
-r color on a black background (=old gxpsc)<br />
-d add ctrl-d to the end of the file, useful if printing on HP 1200C/PS printer<br />
-i mfile where mfile is the name of the input <strong>GrADS</strong> meta file<br />
-o ofile where ofile is the name of the output PostScript file<br />
Program: gxeps [-1][-2][-a | -l][-c][-r][-d][-L][-n][-s][-v] [-i mfile] [-o ofile]<br />
converts the <strong>GrADS</strong> meta file into a PostScript file. Command line options:<br />
-1 PostScript Level 1 output<br />
-2 PostScript Level 2 output<br />
-a DIN A4 paper size<br />
-c color on a white background<br />
-d add ctrl-d to the end of the file, useful if printing on HP 1200C/PS printer<br />
-l US letter paper size<br />
-L ask for a label to be printed on the plot<br />
-n ask for a note to include in postscript file header<br />
-r color on a black background<br />
-s add a file & time stamp<br />
-v verbose<br />
-i mfile where mfile is the name of the input <strong>GrADS</strong> meta file<br />
-o ofile where ofile is the name of the output PostScript file<br />
Create GIF files<br />
Program: gxgif [-i mfile] [-o ofile]<br />
converts the <strong>GrADS</strong> meta file into a GIF file. Command line options:<br />
-i mfile where mfile is the name of the input <strong>GrADS</strong> meta file<br />
-o ofile where ofile is the name of the output GIF file