to download - Dorney Park
to download - Dorney Park
to download - Dorney Park

Create successful ePaper yourself
Turn your PDF publications into a flip-book with our unique Google optimized e-Paper software.
Coaster Quest<br />
THE PHYSICS AND MATHEMATICS OF AMUSEMENT PARK RIDES<br />
Middle School<br />
© Copyrighted by Dr. Joseph S. Elias. This material<br />
is based upon work supported by the National Science<br />
Foundation under Grant No. 9986753.<br />
Any opinions, findings, and conclusions or recommendations expressed in this material are those of the author(s) and do not necessarily reflect the views of the National Science Foundation.
<strong>Dorney</strong> <strong>Park</strong>/Kutz<strong>to</strong>wn University<br />
Coaster Quest<br />
Middle School Edition<br />
Introduction<br />
Kutz<strong>to</strong>wn University of Pennsylvania and <strong>Dorney</strong> <strong>Park</strong> are delighted <strong>to</strong><br />
present <strong>to</strong> you one of the latest editions <strong>to</strong> our Coaster Quest series, The Middle<br />
School Interdisciplinary Science edition. A team of teachers from the Lehigh Valley<br />
developed the middle school edition.<br />
The foundation for the middle school series is science. However, in keeping<br />
with the essence of middle school philosophy, the activities are designed <strong>to</strong> be<br />
interdisciplinary. All learning events are documented in accordance with the<br />
Pennsylvania State Standards.<br />
Science and mathematics process skills are emphasized along with content<br />
and processes taken from PA State Standards in Reading, Writing, Speaking, and<br />
Listening. Your students will enjoy the thrill of the rides all while measuring,<br />
calculating, diagramming and writing.<br />
We give you and your students plenty <strong>to</strong> do on Coaster Quest Day. On the<br />
6 th of May, we have a pavilion waiting for you, our university students will be<br />
anxious <strong>to</strong> assist, and park personnel will have the park looking beautiful and fully<br />
operational. Please contact me elias@kutz<strong>to</strong>wn.edu for more information or visit<br />
our web page at: www.coasterquest.cc.<br />
Dr. Joseph S. Elias<br />
Professor of Science Education<br />
College of Education<br />
Kutz<strong>to</strong>wn University of Pennsylvania
Learning Goals and Objectives<br />
Cognitive Goals<br />
When the middle school Coaster Quest activities are completed, the student’s understanding<br />
of the following laws and concepts of physics will be greatly enhanced:<br />
a. Measurement of distance and time<br />
b. Dimensional analysis and Metric conversion<br />
c. Work, power, and energy<br />
d. Forces<br />
e. New<strong>to</strong>n’s Laws of Motion<br />
f. Rotational motion<br />
g. Conservation laws (momentum and energy)<br />
h. Friction<br />
The student will be able <strong>to</strong>:<br />
1. Measure the forces, speeds and accelerations of various rides.<br />
2. Measure the centripetal speeds, accelerations, and forces of various rides.<br />
3. Calculate the centripetal acceleration of a passenger in a circular motion<br />
ride by the use of a spring accelerometer.<br />
4. Display and analyze data in the form a graph or chart.<br />
5. Determine the forces acting on a passenger in circular motion rides.<br />
6. Determine the change in a passenger’s apparent weight as she or he<br />
moves in a vertical direction.<br />
7. Apply New<strong>to</strong>n’s Laws of Motion <strong>to</strong> explain the effects of forces on<br />
passengers on various rides.<br />
8. Utilize proper mathematical formulas <strong>to</strong> solve problems in appropriate units.<br />
9. Apply the principles of conservation of energy <strong>to</strong> determine the velocity and<br />
acceleration of an object after falling through a given vertical distance.<br />
10. Calculate the work done by friction on roller coasters.<br />
11. Design and execute his or her own experiment using proper format and<br />
procedure.<br />
Attitudes<br />
The student will:<br />
1. Be motivated <strong>to</strong> study the physical sciences by being challenged with an<br />
exciting and meaningful task that allows her or him <strong>to</strong> predict real life<br />
experiences accurately.<br />
2. Gain an appreciation of the physical laws involved in the design and<br />
engineering of the rides at an amusement park.
Middle School Coaster Quest<br />
TABLE OF CONTENTS<br />
AND<br />
LABORATORY OVERVIEW<br />
1. Accelerations in the <strong>Park</strong>- students will use<br />
accelerometers <strong>to</strong> measure the “g forces” for each<br />
assigned ride and graph their results. Students will use<br />
the data collected <strong>to</strong> calculate their highest and lowest<br />
apparent weight during the day at <strong>Dorney</strong> <strong>Park</strong>.<br />
2. Going in Circles- students will calculate the<br />
different rates of speed for each row of horses<br />
on the antique carousel (merry-go-round). After<br />
calculating the circular speed of each row, students will<br />
illustrate and analyze their data on a graph.<br />
3. Roller Coaster Races- students will calculate<br />
average and instantaneous speed for each roller<br />
coaster in the park, convert their results using<br />
dimensional analysis, and construct a bar graph <strong>to</strong><br />
illustrate their data.<br />
4. The Sea Dragon- students will be able <strong>to</strong><br />
identify the fac<strong>to</strong>rs that affect the “period of<br />
oscillation” of a pendulum ride at an amusement<br />
park.
Middle School Coaster Quest<br />
TABLE OF CONTENTS<br />
AND<br />
LABORATORY OVERVIEW<br />
5. Steel Force vs. Thunderhawk- students will measure the<br />
structural features of both ride, calculate distances of the<br />
slopes and predict which of the two coaster has the higher<br />
average speed.<br />
6. Student-Designed Experiment- students will<br />
design and implement their own science<br />
experiment based on the physics of a particular<br />
ride or set of rides in the park.
Introduction:<br />
Spring accelerometers measure acceleration by measuring forces.<br />
Each full space on the spring accelerometer will measure a force fac<strong>to</strong>r<br />
relative <strong>to</strong> the local equivalent acceleration of gravity (9.8 m/s/s). We<br />
use “g” <strong>to</strong> express the value of acceleration due <strong>to</strong> the force of gravity.<br />
When you are standing still, the local gravitational force will feel normal,<br />
so the spring accelerometer will read 1g. If you are on a ride and the<br />
accelerometer reads 1.5g, you will feel 1.5 times heavier than when you<br />
were at rest. On the other hand, if you get a reading of .5g, you will feel<br />
.5 lighter than normal. On some rides, you may feel two <strong>to</strong> three times<br />
heavier than normal, and this would correspond <strong>to</strong> g’s of two or three<br />
respectively.<br />
Objective:<br />
Many thrill rides at <strong>Dorney</strong> <strong>Park</strong> are exciting because riders “feel”<br />
heavier or lighter than normal due <strong>to</strong> the motion of a particular ride.<br />
These experiments will help students measure the acceleration of<br />
certain rides at <strong>Dorney</strong> <strong>Park</strong> and compare that measurement <strong>to</strong> the<br />
force of gravity.<br />
Procedure:<br />
1. For these experiments, the rider or riders of the group will need <strong>to</strong><br />
observe the highest (or lowest) force fac<strong>to</strong>r reading on various rides<br />
at <strong>Dorney</strong> <strong>Park</strong>. The readings will change as acceleration changes,<br />
but we are watching for the “extreme” force fac<strong>to</strong>rs in the <strong>Park</strong>.<br />
2. Use the spring accelerometer <strong>to</strong> collect this data for the Sea<br />
Dragon, Steel Force (2), Domina<strong>to</strong>r (2), and Talon.<br />
3. Refer <strong>to</strong> Chart I below and pay close attention <strong>to</strong> the information<br />
listed with the names of the rides. HINT: those are specific points on<br />
the ride that you should see the largest (or smallest) force fac<strong>to</strong>r<br />
reading.<br />
4. Record the data for trial one and trial two on Chart I and find the<br />
average force fac<strong>to</strong>r.<br />
5. Calculate your “apparent weight” for each of the rides listed. Use<br />
the force fac<strong>to</strong>rs and your “normal weight” (in pounds) <strong>to</strong> calculate<br />
how heavy or light you felt at that particular point on each ride.
After finding your apparent weight, record those calculations on<br />
Chart II.<br />
6. Answer the questions provided in the data analysis and conclusions<br />
section of the labora<strong>to</strong>ry.<br />
7. Complete the bar graph “Watching your Weight” using the<br />
information from Chart I. To simplify the graphing, round the<br />
average force fac<strong>to</strong>r <strong>to</strong> the closest .5g when recording data on<strong>to</strong> the<br />
graph.<br />
CHART I<br />
Sea Dragon<br />
Lowest point of<br />
the swing<br />
Steel Force (1)<br />
Bot<strong>to</strong>m of first<br />
hill<br />
Steel Force (2)<br />
Top of camel<br />
backs<br />
Talon<br />
Bot<strong>to</strong>m of first<br />
hill<br />
Domina<strong>to</strong>r (1)<br />
Going up<br />
TRIAL I<br />
FORCE FACTOR<br />
(g’s)<br />
TRIAL II<br />
FORCE FACTOR<br />
(g’s)<br />
AVERAGE<br />
FORCE FACTOR<br />
(g’s)<br />
Domina<strong>to</strong>r (2)<br />
Going down<br />
* To simplify, round the average force fac<strong>to</strong>r <strong>to</strong> the nearest .5 g.
CHART II<br />
Force Fac<strong>to</strong>r X Normal Weight = Apparent Weight<br />
Sea Dragon<br />
Lowest point of<br />
the swing<br />
FORCE FACTOR<br />
(g’s)<br />
NORMAL<br />
WEIGHT<br />
(lbs.)<br />
APPARENT<br />
WEIGHT<br />
(lbs.)<br />
Steel Force (1)<br />
Bot<strong>to</strong>m of first<br />
hill<br />
Steel Force (2)<br />
Top of camel<br />
backs<br />
Talon<br />
Bot<strong>to</strong>m of first<br />
hill<br />
Domina<strong>to</strong>r (1)<br />
Going up<br />
Domina<strong>to</strong>r (2)<br />
Going down<br />
Data Analysis:<br />
1. What was the ride that provided the highest g’s in the park? How<br />
about the lowest?<br />
Highest:<br />
Lowest:<br />
g’s<br />
g’s
2. Were you able <strong>to</strong> feel the difference between positive and negative<br />
force fac<strong>to</strong>rs? Describe how you felt.<br />
Conclusions:<br />
1. Using the information on chart II, What was the heaviest and<br />
lightest amount that you weighed during your day at <strong>Dorney</strong> <strong>Park</strong>?<br />
2. Sometimes the spring accelerometer didn’t show any change from<br />
normal (remained at the 1g mark) even though you were moving<br />
very fast. Explain how this is possible.<br />
3. Were there any extreme g forces you observed that were not<br />
recorded on the charts? Name the ride, the g’s, and the place that it<br />
was observed.
Negative Force Fac<strong>to</strong>r (g)<br />
Positive Force Fac<strong>to</strong>r (g)<br />
4.0 4.0<br />
3.5 3.5<br />
Positive Force Fac<strong>to</strong>r (g)<br />
3.0 3.0<br />
2.5 2.5<br />
2.0 2.0<br />
1.5 1.5<br />
1.0<br />
(9.8 m/s/s)<br />
Normal<br />
Sea Dragon<br />
Lowest part<br />
of swing<br />
Steel Force (1)<br />
Bot<strong>to</strong>m of first<br />
hill<br />
Steel Force (2)<br />
Top of camel<br />
backs<br />
Talon<br />
Bot<strong>to</strong>m of first<br />
hill<br />
Domina<strong>to</strong>r (1)<br />
Going up<br />
Domina<strong>to</strong>r (2)<br />
Going down<br />
1.0<br />
(9.8 m/s/s)<br />
Normal<br />
0.5 0.5<br />
Negative Force Fac<strong>to</strong>r (g)<br />
0 0<br />
-0.5 -0.5<br />
-1.0 -1.0<br />
-1.5 -1.5<br />
-2.0 -2.0<br />
*Use the data from Chart I <strong>to</strong> complete the bar graph above. To simplify the graphing, round your average force fac<strong>to</strong>r<br />
reading <strong>to</strong> the nearest 0.5 g.
Any shaded portion of this<br />
activity will be completed in the<br />
class following Coaster Quest!<br />
Objective: To find the rate of speed of all of the horses on the<br />
Antique Carousel (Merry-Go-Round).<br />
Materials: S<strong>to</strong>pwatch Data Calcula<strong>to</strong>r<br />
Pencil<br />
Graph Paper<br />
Observation: Watch the Antique Carousel for a short time.<br />
Which horses (outside, inside, or middle) appear <strong>to</strong> be<br />
going the fastest? _____________________<br />
Procedure:<br />
Step# 1 Use the s<strong>to</strong>pwatch <strong>to</strong> find the time that it takes a horse from each of<br />
the four rows <strong>to</strong> make one complete revolution. Use three trials for each row <strong>to</strong> be<br />
sure. Complete the chart below.<br />
1 st timing 2 nd timing 3 rd timing<br />
Average Time<br />
(seconds)<br />
Horse in the<br />
inside row.<br />
Horse in the<br />
second row.<br />
Horse in the<br />
third row.<br />
Horse in the<br />
outside row.<br />
Round your<br />
answers <strong>to</strong> the<br />
nearest second.
Step # 2 The horse’s speed is calculated using the formula<br />
Speed =<br />
Distance<br />
Time<br />
The distance in the formula is the circumference of the circular path<br />
in which it travels. Complete the following chart <strong>to</strong> calculate circumference of the<br />
path and the speed of the horses in each row.<br />
Horse<br />
Location<br />
Inside<br />
Row<br />
Second<br />
Row<br />
Third<br />
Row<br />
Outside<br />
Row<br />
Radius of<br />
Path<br />
5.8 m<br />
6.6 m<br />
7.3 m<br />
8.1 m<br />
Average<br />
Time<br />
(seconds)<br />
Circumference<br />
C = 2 x x R<br />
Speed<br />
(meters/sec)<br />
Speed<br />
(miles/hour)<br />
REMEMBER: You need <strong>to</strong> convert <strong>to</strong> the appropriate unit for you answers. Use the<br />
back of this page <strong>to</strong> make the conversion of speed <strong>to</strong> miles per hour.<br />
HINT: ?? m x 3600sec. x 1mile = ________ miles/hr.<br />
sec. 1hr. 1609m<br />
Questions:<br />
After completing the chart, how does the calculated speed of the horses compare <strong>to</strong><br />
which horse you thought was going fastest in your earlier observation?<br />
__________________________________________________________<br />
______________________________________________<br />
Which horse do you feel gives the very best ride, and why?
Going Further:<br />
Now it’s time <strong>to</strong> illustrate your data. Use the graph below <strong>to</strong> show the relationship<br />
between the length of the radius(x – axis) and the rate of speed(y – axis).<br />
y<br />
Observation:<br />
What kind of relationship<br />
do you see in the graph?<br />
________________<br />
x<br />
Step #3 Use a graphing calcula<strong>to</strong>r <strong>to</strong> find whether a straight line or a curve<br />
approximates the data shown on the graph. What’s the answer?<br />
________________________<br />
* This graph will be done in class!
Each of the coasters offers a different thrill ride for its passengers. Before you<br />
choose which coasters <strong>to</strong> ride, you might like <strong>to</strong> know what the average speeds are for<br />
each coaster. Remember, the average speed of a ride is determined by the distance<br />
the coaster travels and the time it takes the coaster <strong>to</strong> complete its trip <strong>to</strong> and from the<br />
station. Although each coaster has its own average speed, it is important <strong>to</strong> remember<br />
that the actual speed of a coaster changes constantly while the ride is in motion.<br />
Problem #1: Which roller coaster has the fastest average speed?<br />
Materials Needed: pencil/pen Data Sheet #1<br />
s<strong>to</strong>pwatch calcula<strong>to</strong>r<br />
Procedure:<br />
1. Use data sheet #1 (next page) <strong>to</strong> determine the distance traveled during each ride<br />
in feet. (Note: the distance traveled is the same as the length of the ride.) Record<br />
your answers in the correct column on the data sheet<br />
2. Visit the designated timing area for each roller coaster. Use the s<strong>to</strong>pwatch <strong>to</strong><br />
determine the length of time, in seconds, that it takes the coaster <strong>to</strong> complete its<br />
trip <strong>to</strong> and from the station. Remember, there are many fac<strong>to</strong>rs that may influence<br />
the time it takes for a roller coaster <strong>to</strong> complete its trip. Because of this, it is<br />
necessary for you <strong>to</strong> record the time for three separate trials for each roller coaster.<br />
You must then calculate the average time for each coaster. Record your answers on<br />
the data sheet.<br />
3. Using the average time found in step 2, calculate the speed of each ride in feet per<br />
second by using the formula;<br />
Speed = Distance / Time (ft/sec)<br />
Record your answers on the data sheet.<br />
4. Now, compute the speed of each coaster in miles per hour by using the following<br />
calculation;<br />
Distance of track in feet X 1 mile X 3600 seconds<br />
Average time of ride in seconds X 5280 feet X 1 hour<br />
= ____ miles/hr.<br />
5. Repeat the above calculation for each of your recorded times for each roller coaster.<br />
Conclusion:<br />
1. Which roller coaster has the fastest average speed? _____________________<br />
2. Which roller coaster has the slowest average speed? _____________________<br />
3. Were you surprised by any of your results? If so, explain below.
Name of Ride<br />
Distance<br />
traveled<br />
in feet<br />
Time of<br />
ride in<br />
seconds<br />
(trial 1)<br />
Time of<br />
ride in<br />
seconds<br />
(trial 2)<br />
Time of<br />
ride in<br />
seconds<br />
(trial 3)<br />
Average<br />
time of<br />
ride in<br />
seconds<br />
Average<br />
speed of<br />
ride<br />
(ft/s)<br />
Thunder Hawk<br />
2767 ft.<br />
Steel Force<br />
5600 ft.<br />
Talon<br />
3110 ft.<br />
Wild Mouse<br />
1204 ft.<br />
Hydra<br />
3198 ft.<br />
Name of Ride<br />
Average Speed of Ride<br />
(miles/hr.)<br />
Thunder Hawk<br />
Steel Force<br />
Talon<br />
Wild Mouse<br />
Hydra
Problem #2: Which roller coaster has the fastest instantaneous speed?<br />
Materials Needed: pencil/pen data Sheet #2<br />
s<strong>to</strong>pwatch<br />
colored pencils<br />
graph paper<br />
calcula<strong>to</strong>r<br />
Procedure:<br />
1. Use Coaster data sheet #2 (next page) <strong>to</strong> determine the length of the train, in feet,<br />
for each of the roller coasters. This number, in feet, will be used as the distance.<br />
2. Visit the designated timing area for each roller coaster and observe the trains as<br />
they travel through the ride.<br />
3. Determine which hill is tallest for each ride and locate a “marking point” at the<br />
bot<strong>to</strong>m of that hill. Use the s<strong>to</strong>pwatch <strong>to</strong> determine the length of time, in seconds,<br />
that it takes the train <strong>to</strong> pass this marker. Begin timing as the front of the train<br />
passes the marker and end timing as soon as the last car of the train passes.<br />
Remember that there are many fac<strong>to</strong>rs that may influence the speed of a roller<br />
coaster. Because of this, it is necessary for you <strong>to</strong> record the time for three<br />
separate trials for each roller coaster. You must then calculate the average time for<br />
each coaster. Record your answers on the data sheet.<br />
4. Using the average time found in step 3, calculate the instantaneous speed of each<br />
train as it passes the marker by using the formula:<br />
Speed = Distance / Time<br />
***Use the length of the train as your distance. Record your answers on the data<br />
sheet in feet per second.<br />
5. Now, compute the instantaneous speed of each coaster in miles per hour by using<br />
the following calculation:<br />
Length of train in ft. X 1 mile X 3600 sec.<br />
Average time <strong>to</strong> pass marker in sec. X 5280 ft. X 1 hr.<br />
= ____ miles/hr.<br />
6. Repeat the above calculation for each of your recorded times for each roller coaster.<br />
7. Use colored pencils <strong>to</strong> make a bar graph that displays the average speed versus the<br />
instantaneous speed for each roller coaster. * This will be done in class!!!<br />
Conclusion:<br />
1. Which roller coaster had the fastest instantaneous speed? ________________<br />
2. Which roller coaster had the slowest instantaneous speed? ________________<br />
3. Is it possible for a train <strong>to</strong> have the fastest instantaneous speed without having the<br />
fastest average speed? __________ Explain your answer in the space below.
Name of Ride<br />
Length<br />
of train<br />
in<br />
feet<br />
(distance)<br />
Time <strong>to</strong><br />
pass<br />
marker<br />
in<br />
seconds<br />
(trial 1)<br />
Time <strong>to</strong><br />
pass<br />
marker<br />
in<br />
seconds<br />
(trial 2)<br />
Time <strong>to</strong><br />
pass<br />
marker<br />
in<br />
seconds<br />
(trial 3)<br />
Average<br />
time <strong>to</strong><br />
pass<br />
marker<br />
in<br />
seconds<br />
instantaneous<br />
speed at<br />
marker<br />
(ft/s)<br />
Thunder Hawk<br />
36 ft.<br />
Steel Force<br />
65 ft.<br />
Talon<br />
35 ft.<br />
Wild Mouse<br />
6.5 ft.<br />
Hydra<br />
42 ft.<br />
Name of Ride<br />
Instantaneous speed at<br />
marker (miles/hr.)<br />
Thunder Hawk<br />
Steel Force<br />
Talon<br />
Wild Mouse<br />
Hydra
SPEED IN<br />
MILES PER<br />
HOUR<br />
99<br />
96<br />
93<br />
90<br />
87<br />
84<br />
81<br />
78<br />
75<br />
72<br />
69<br />
66<br />
63<br />
60<br />
57<br />
54<br />
51<br />
48<br />
45<br />
42<br />
39<br />
36<br />
30<br />
27<br />
24<br />
21<br />
18<br />
15<br />
12<br />
9<br />
6<br />
3<br />
0<br />
THUNDER<br />
HAWK<br />
Roller Coaster’s Average Speed vs. Instantaneous Speed<br />
A I A I A I A I A I A I<br />
LASER<br />
STEEL<br />
FORCE<br />
TALON<br />
WILD<br />
MOUSE<br />
ROLLER COASTER<br />
KEY<br />
* THIS WILL BE DONE IN CLASS!!!<br />
A - Average Speed<br />
I - Instantaneous Speed
The following activity is designed <strong>to</strong> illustrate and explain the concept<br />
of “period of oscillation” regarding the motion of pendulums. The Sea<br />
Dragon was introduced at <strong>Dorney</strong> <strong>Park</strong> in 1980, and is a ride that simulates<br />
the swing of a giant pendulum (over 10m high!). It will help us <strong>to</strong> learn<br />
more about the behavior of simple pendulums as they compare <strong>to</strong> the<br />
motion of the ride itself.<br />
Objective:<br />
The students will be able <strong>to</strong> determine the fac<strong>to</strong>rs that affect the period<br />
(time for one full swing) of a pendulum ride at an amusement park.<br />
Materials:<br />
S<strong>to</strong>pwatch<br />
Calcula<strong>to</strong>r<br />
Pencil or Pen<br />
Procedure:<br />
A. Observe the Sea Dragon and time the period of oscillation<br />
at three different points during the ride (beginning, middle,<br />
& end).<br />
B. Count the number of people that were on the ride for each<br />
trial<br />
C. Use the charts below <strong>to</strong> record your data for each part (I, II, &<br />
III) of the experiment.<br />
Hint: It will be helpful <strong>to</strong> first watch the Sea Dragon for a few<br />
minutes and count the number of swings it makes for a complete<br />
ride. This will better prepare you for timing the beginning, middle,<br />
and end of the ride.<br />
D. To collect the last piece of data, count the <strong>to</strong>tal number of<br />
swings, <strong>to</strong>tal time, and number of people for an entire Sea Dragon<br />
ride <strong>to</strong> calculate the average period of oscillation.<br />
E. Use the Part IV chart <strong>to</strong> record your data for two trials of an<br />
entire Sea Dragon ride (start <strong>to</strong> s<strong>to</strong>p).
Part I – Beginning of Ride<br />
TRIAL 1 TRIAL 2 TRIAL 3 AVERAGE<br />
Time of Period<br />
(Seconds)<br />
Number of<br />
Riders<br />
Part II – Middle of Ride (peak swings)<br />
TRIAL 1 TRIAL 2 TRIAL 3 AVERAGE<br />
Time of Period<br />
(Seconds)<br />
Number of<br />
Riders<br />
Part III – End of Ride<br />
TRIAL 1 TRIAL 2 TRIAL 3 AVERAGE<br />
Time of Period<br />
(Seconds)<br />
Number of<br />
Riders<br />
Part IV – Whole Ride (start <strong>to</strong> s<strong>to</strong>p)<br />
TOTAL # OF TOTAL TIME<br />
SWINGS (seconds)<br />
TRIAL 1<br />
TRIAL 2<br />
PERIOD<br />
(swings/seconds)<br />
Number of<br />
Riders<br />
Analyzing Data:<br />
1. How does the period of oscillation (time) change from the beginning,<br />
<strong>to</strong> the middle, <strong>to</strong> the end of the ride?<br />
_______________________________________________________________________________<br />
_______________________________________________________________________________<br />
_______________________________________________________________________________<br />
_______________________________________________________________________________
2. How did the weight of the pendulum (#of riders in the boat) affect<br />
the period of oscillation for each part of the experiment?<br />
________________________________________________________<br />
________________________________________________________<br />
________________________________________________________<br />
3. How did the calculation of the “period” in part IV compare <strong>to</strong><br />
what was calculated for the “period” in parts I, II, and III?<br />
________________________________________________________<br />
________________________________________________________<br />
________________________________________________________<br />
________________________________________________________<br />
Conclusions:<br />
1. When is the Sea Dragon acting most like a pendulum made with a<br />
string and washer? In the beginning, the middle, or the end of the<br />
ride? Explain your answer.<br />
_____________________________________________________________<br />
_____________________________________________________________<br />
_____________________________________________________________<br />
____________________________<br />
_<br />
2. Is the Sea Dragon a simple pendulum? Why or why not?<br />
________________________________________________________<br />
________________________________________________________<br />
________________________________________________________<br />
__________________________<br />
__________________________<br />
3. Describe the motion of the boat in terms of energy conversion. Be<br />
sure <strong>to</strong> use the terms “potential” and “kinetic” in your description.<br />
________________________________________________________<br />
________________________________________________________<br />
________________________________________________________<br />
_______________________________
Steel Force vs. Thunderhawk<br />
Information Sheet<br />
Topics:<br />
estimation (structure estimation)<br />
fractions/proportions<br />
Pythagorean Theorem<br />
unit conversion<br />
speed formula<br />
Objectives: <strong>to</strong> use structure estimation and the Pythagorean Theorem <strong>to</strong> determine<br />
the length a roller coaster traveled.<br />
<strong>to</strong> estimate the average time the roller coaster <strong>to</strong>ok <strong>to</strong> travel the distance<br />
<strong>to</strong> calculate the average speed of a roller coaster<br />
<strong>to</strong> use unit conversion <strong>to</strong> convert feet per second <strong>to</strong> miles per hour<br />
Equipment: calcula<strong>to</strong>r<br />
s<strong>to</strong>p watch<br />
pencil<br />
activity sheet<br />
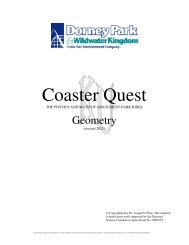
Notes <strong>to</strong> the teacher:<br />
Students will need <strong>to</strong> estimate the length of the initial hill for the Steel<br />
Force and Thunderhawk roller coasters. In order <strong>to</strong> determine the<br />
distances students will use structure estimation and the Pythagorean<br />
Theorem.<br />
Structure estimation will allow students <strong>to</strong> find the height of the roller<br />
coasters using support structures and proportions rather than geometry.<br />
Students will start by determining the height of the first support structure,<br />
relative <strong>to</strong> their height and turn this in<strong>to</strong> a fraction. Then count the number<br />
of support structures from the ground <strong>to</strong> the peak of the roller coaster.<br />
Using multiplication and proportions, students can determine the height of<br />
the peak of the hill.<br />
8.5 structure<br />
units <strong>to</strong> the<br />
peak<br />
5 ft. tall<br />
student<br />
Approximately<br />
6/10 of structure<br />
unit<br />
Special thanks <strong>to</strong> Sara Bechtel, Ken Eicheldinger and Angela Xander
Steel Force vs. Thunderhawk<br />
Which coaster has a faster average speed on its initial hill?<br />
Procedure:<br />
1. Estimate the height of the initial hill of Steel Force. Use structure estimation <strong>to</strong><br />
measure the peak. Note: the best place <strong>to</strong> estimate the height of one section of<br />
Steel Force is located in front of the Thunder Creek Speedway ride (see image 1).<br />
Do this first! To estimate the base of Steel Force and the measurements for<br />
Thunderhawk, proceed <strong>to</strong> the largest hills for both roller coasters. The hills are next<br />
<strong>to</strong> each other. Show your work.<br />
Height<br />
Peak<br />
Height of one structure unit of Steel Force<br />
__________.<br />
Find the height of the peak of the hill on Steel<br />
Force _________.<br />
Bot<strong>to</strong>m<br />
One structure<br />
unit<br />
Base<br />
Image 1. Just outside of<br />
Thunder Creek Speedway<br />
2. Estimate the height of the initial hill of<br />
Thunderhawk. The best place is just inside the<br />
entrance <strong>to</strong> the Thunderhawk ride (see image 2.)<br />
Example of one<br />
structure unit<br />
Height of one structure unit of<br />
Thunderhawk __________.<br />
Find the height of the peak of the hill on<br />
Thunderhawk _________.<br />
Image 2. Entrance<br />
<strong>to</strong> Thunderhawk<br />
Special thanks <strong>to</strong> Sara Bechtel, Ken Eicheldinger and Angela Xander
Steel Force vs. Thunderhawk<br />
3. Find the base length of the Steel Force Hill by stepping. One large step is<br />
approximately 1 yard or 3 feet (measure one stride <strong>to</strong> make sure it is approximately<br />
1 yard). The best place <strong>to</strong> start is at the entrance of the ride Scrambler. Notice the<br />
red dot on the last pillar at the bot<strong>to</strong>m of the hill, just before the track enters the<br />
tunnel. This is your starting point. Using large steps, step off the distance from that<br />
point <strong>to</strong> the point just even with the peak of the initial hill for Steel Force.<br />
Estimated length of the base of the hill on Steel Force _________.<br />
4. Find the base length of the Thunderhawk initial hill. The stepping method can not<br />
be used <strong>to</strong> determine the length of the base (the base of the hill is blocked by<br />
fencing).<br />
Length of one structure unit of Thunderhawk __________.<br />
Estimated length of the base of the hill on Thunderhawk _________.<br />
5. Use the Pythagorean Theorem <strong>to</strong> calculate the approximate hill distance of each<br />
hill. Show your work.<br />
base 2 + height 2 = hill distance 2<br />
Approximate hill<br />
distance<br />
Height<br />
Hill distance of Steel Force__________.<br />
Hill distance of Thunderhawk __________.<br />
Base<br />
6. Time each of the roller coasters from the peak of the hill <strong>to</strong> the bot<strong>to</strong>m of the hill.<br />
Start the s<strong>to</strong>p watch as the last car passes the peak and as the last car passes the<br />
bot<strong>to</strong>m. Perform three trials for each coaster entering the data in<strong>to</strong> the table below.<br />
Special thanks <strong>to</strong> Sara Bechtel, Ken Eicheldinger and Angela Xander
Steel Force vs. Thunderhawk<br />
7. Calculate the average speed of each of the coasters down the initial hill. First<br />
calculate the average time of the three time trials for each coaster, then use the<br />
speed formula (s = d/t). Enter the data in the table below. Show your work.<br />
8. Convert the feet per second estimation <strong>to</strong> a miles per hour estimation. Hint: there<br />
are 5,280 feet in a mile and 3600 seconds in an hour.<br />
Coaster<br />
Steel<br />
Force<br />
Thunder<br />
Hawk<br />
Time<br />
trial<br />
1<br />
Time<br />
trial<br />
2<br />
Time<br />
trial<br />
3<br />
Average<br />
time in<br />
seconds (s)<br />
Distance<br />
of hill in<br />
feet (ft)<br />
Speed in<br />
feet per<br />
second,<br />
fps<br />
Speed in<br />
miles per<br />
hour, mph<br />
Which Coaster has the faster average speed? __________<br />
Round<br />
your<br />
answers <strong>to</strong><br />
the<br />
nearest<br />
10 th<br />
Special thanks <strong>to</strong> Sara Bechtel, Ken Eicheldinger and Angela Xander
PART ONE<br />
It’s your turn now! Pick any ride in the amusement park and design an<br />
experiment or set of experiments for that ride. You may work by yourself or with a<br />
partner <strong>to</strong> complete this activity. Include the list of equipment/materials needed <strong>to</strong><br />
perform your experiment, a detailed procedure, and follow-up questions (similar <strong>to</strong> lab<br />
manual questions) related <strong>to</strong> the physics of the ride.<br />
Grading will be based on:<br />
1. Scientific process and format<br />
2. Creativity <br />
3. Practicality (Can it be performed on the ride? Consider such things as size of<br />
equipment and safety fac<strong>to</strong>rs.)<br />
The FORMAT should be:<br />
‣ Name/names<br />
‣ Team/section<br />
‣ Title (ride choice)<br />
‣ Purpose<br />
‣ Equipment/materials<br />
‣ Procedure- step by step<br />
‣ Data -Tables/charts/graphs<br />
‣ Equations (if necessary)<br />
‣ Questions <strong>to</strong> consider<br />
PART TWO<br />
Now that you have proposed a labora<strong>to</strong>ry activity, you must actually execute the<br />
lab. Use the attached sheets of paper <strong>to</strong> write your lab and record your data. You may<br />
wish <strong>to</strong> take measurements several times and average your answers in order <strong>to</strong> reduce<br />
your error. Be sure <strong>to</strong> use appropriate data tables for recording your data, show any<br />
equations used, draw graphs where applicable, and answer the questions you’ve<br />
proposed.<br />
Next, find another partner/group <strong>to</strong> read through your experiment. You will then<br />
return the favor and read through their experiment. Be sure <strong>to</strong> indicate who critiqued<br />
your experiment at the end of the labora<strong>to</strong>ry. Check the procedure, data, the units<br />
used for the calculations, and carefully read through the questions on your partner’s<br />
lab. Trading lab reports like this will help you <strong>to</strong> catch any major errors you may have<br />
made in the set-up or procedure of the experiment.<br />
Remember: This is a “rough” draft. You can make another copy at home when you<br />
have more time (and a comfortable place) <strong>to</strong> make a final draft!
Coaster Quest<br />
Middle School<br />
Science and Technology Standards<br />
Academic<br />
Standard<br />
(Area)<br />
Unifying Themes<br />
Standard<br />
Category<br />
3.1.4 A<br />
3.1.4 B<br />
3.1.4 D<br />
3.1.10 C<br />
3.1.10 D<br />
3.1.10 E<br />
3.1.12 C<br />
Standard<br />
Statement<br />
Know that<br />
natural and<br />
human-made<br />
objects are made<br />
up of parts.<br />
Know models as<br />
useful<br />
simplifications<br />
of objects or<br />
processes.<br />
Know that scale<br />
is an important<br />
attribute of<br />
natural and<br />
human made<br />
objects, events<br />
and phenomena.<br />
Apply patterns<br />
as repeated<br />
processes or<br />
recurring<br />
elements in<br />
science and<br />
technology.<br />
Apply scale as a<br />
way of relating<br />
concepts and<br />
ideas <strong>to</strong> one<br />
another by some<br />
measure.<br />
Describe<br />
patterns of<br />
change in<br />
nature, physical<br />
and man made<br />
systems.<br />
Assess and<br />
apply patterns in<br />
science and<br />
technology.<br />
Content<br />
Descrip<strong>to</strong>rs<br />
(benchmarks)<br />
Identify system parts that are natural<br />
and human-made (e.g., ball point pen,<br />
simple electrical circuits, plant<br />
ana<strong>to</strong>my).<br />
Identify and apply models as <strong>to</strong>ols for<br />
prediction and insight.<br />
Explain the importance of scale in<br />
producing models and apply it <strong>to</strong> a<br />
model.<br />
Examine and describe physical<br />
patterns in motion.<br />
Convert one scale <strong>to</strong> another.<br />
Describe how fundamental science<br />
and technology concepts are used <strong>to</strong><br />
solve practical problems<br />
Compare and contrast structure and<br />
function relationships as they relate <strong>to</strong><br />
patterns.<br />
Assess patterns in nature using<br />
mathematical formulas.<br />
Performance<br />
Tasks and Associated<br />
Learning Activities<br />
Going in Circles<br />
The Sea Dragon<br />
The Sea Dragon<br />
Going in Circles<br />
Acceleration in the <strong>Park</strong><br />
Acceleration in the <strong>Park</strong><br />
Going in Circles<br />
Acceleration in the <strong>Park</strong><br />
3.1.12 D<br />
Evaluate change<br />
in nature,<br />
physical systems<br />
and man made<br />
systems.<br />
Evaluate fundamental science and<br />
technology concepts and their<br />
development over time<br />
Acceleration in the <strong>Park</strong>
Coaster Quest<br />
Middle School<br />
Science and Technology Standards<br />
Academic<br />
Standard<br />
(Area)<br />
Inquiry and Design<br />
Standard<br />
Category<br />
Standard<br />
Statement<br />
3.2.4 B Describe<br />
objects in the<br />
world using the<br />
five senses.<br />
3.2.7 B<br />
3.2.7 C<br />
3.2.10 A<br />
3.2.10 B<br />
Apply process<br />
knowledge <strong>to</strong><br />
make and<br />
interpret<br />
observations.<br />
Identify and<br />
use the<br />
elements of<br />
scientific<br />
inquiry <strong>to</strong> solve<br />
problems.<br />
Apply<br />
knowledge and<br />
understanding<br />
about the<br />
nature of<br />
scientific and<br />
technological<br />
knowledge.<br />
Apply process<br />
knowledge and<br />
organize<br />
scientific and<br />
technological<br />
phenomena in<br />
varied ways.<br />
Content<br />
Descrip<strong>to</strong>rs<br />
(benchmarks)<br />
Use observations <strong>to</strong> develop a<br />
descriptive vocabulary.<br />
Describe relationships by making<br />
inferences and predictions.<br />
Communicate, use space / time<br />
relationships, define operationally,<br />
raise questions, formulate hypotheses,<br />
test and experiment,<br />
Interpret data, formulate models,<br />
design models, and produce solutions.<br />
Generate questions about objects,<br />
organisms and/or events that can be<br />
answered through scientific<br />
investigations.<br />
Evaluate the appropriateness of<br />
questions.<br />
Design an investigation with limited<br />
variables <strong>to</strong> investigate a question.<br />
Conduct a two-part experiment.<br />
Judge the significance of<br />
experimental information in<br />
answering the question.<br />
Know that science is limited <strong>to</strong> the<br />
study of observable aspects of the<br />
world and the universe.<br />
Integrate new information in<strong>to</strong><br />
existing theories and explain implied<br />
results.<br />
Describe materials using precise<br />
quantitative and qualitative skills<br />
based on observations.<br />
Develop appropriate scientific<br />
experiments: raising questions,<br />
formulating hypotheses, testing,<br />
controlled experiments, recognizing<br />
variables, manipulating variables,<br />
interpreting data, and producing<br />
solutions.<br />
Use process skills <strong>to</strong> make inferences<br />
and predictions using collected<br />
information and <strong>to</strong> communicate,<br />
using space / time relationships,<br />
defining operationally.<br />
Performance<br />
Tasks and Associated<br />
Learning Activities<br />
The Sea Dragon<br />
Going in Circles<br />
The Sea Dragon<br />
Roller Coaster Races<br />
Steel Force vs, Thunderhawk<br />
Roller Coaster Races<br />
Steel Force vs, Thunderhawk<br />
Going in Circles<br />
Student Designed Experiment<br />
Student Designed Experiment<br />
Student Designed Experiment<br />
Student Designed Experiment
Academic<br />
Standard<br />
(Area)<br />
Physical Science, Chemistry and Physics<br />
Standard<br />
Category<br />
3.2.10 C<br />
3.2.10 D<br />
3.2.12 A<br />
3.2.12 B<br />
3.4.4 C<br />
3.4.7 C<br />
3.4.10 C<br />
3.4.12 C<br />
Coaster Quest<br />
Middle School<br />
Science and Technology Standards<br />
Standard<br />
Statement<br />
Apply the<br />
elements of<br />
scientific<br />
inquiry <strong>to</strong> solve<br />
problems.<br />
Identify and<br />
apply the<br />
technological<br />
design process<br />
<strong>to</strong> solve<br />
problems.<br />
Evaluate the<br />
nature of<br />
scientific and<br />
technological<br />
knowledge.<br />
Evaluate<br />
experimental<br />
information for<br />
appropriateness<br />
and adherence<br />
<strong>to</strong> relevant<br />
science<br />
processes.<br />
Observe and<br />
describe<br />
different types<br />
of force and<br />
motion.<br />
Identify and<br />
explain the<br />
principles of<br />
force and<br />
motion<br />
Distinguish<br />
among the<br />
principles of<br />
force and<br />
motion.<br />
Apply the<br />
principles of<br />
motion and<br />
force.<br />
Content<br />
Descrip<strong>to</strong>rs<br />
(benchmarks)<br />
Generate questions about objects,<br />
organisms and/or events that can be<br />
answered through scientific<br />
investigations.<br />
Examine the problem; rank all<br />
necessary information and all<br />
questions that must be answered.<br />
Know and use the ongoing scientific<br />
processes <strong>to</strong> continually improve and<br />
better understand how things work.<br />
Judge that conclusions are consistent<br />
and logical with experimental<br />
conditions.<br />
Describe the position of an object by<br />
locating it relative <strong>to</strong> another object or<br />
the background (e.g., geographic<br />
direction, left, up).<br />
Describe various types of motions.<br />
Recognize forces that attract or repel<br />
other objects and demonstrate them.<br />
Describe the motion of an object<br />
based on its position, direction and<br />
speed.<br />
Describe and measure the motion of<br />
sound, light and other objects.<br />
Analyze the principles of translational<br />
motion, velocity and acceleration as<br />
they relate <strong>to</strong> free fall and projectile<br />
motion.<br />
Performance<br />
Tasks and Associated<br />
Learning Activities<br />
Acceleration in the <strong>Park</strong><br />
Student Designed Experiment<br />
Acceleration in the <strong>Park</strong><br />
Acceleration in the <strong>Park</strong><br />
Roller Coaster Races<br />
Steel Force vs, Thunderhawk<br />
Going in Circles<br />
Roller Coaster Races<br />
Steel Force vs, Thunderhawk<br />
Roller Coaster Races<br />
Steel Force vs, Thunderhawk<br />
Roller Coaster Races<br />
Acceleration in the <strong>Park</strong><br />
Student Designed Experiment
Academic<br />
Standard<br />
(Area)<br />
Technological Devices<br />
Scientific Endeavors<br />
Standard<br />
Category<br />
3.7.7 A<br />
3.7.7 B<br />
3.7.10 A<br />
3.7.12 B<br />
3.8.12 B<br />
Coaster Quest<br />
Middle School<br />
Science and Technology Standards<br />
Standard<br />
Statement<br />
Describe the<br />
safe and<br />
appropriate use<br />
of <strong>to</strong>ols,<br />
materials and<br />
techniques <strong>to</strong><br />
answer<br />
questions and<br />
solve<br />
problems.<br />
Use<br />
appropriate<br />
instruments<br />
and apparatus<br />
<strong>to</strong> study<br />
materials.<br />
Identify and<br />
safely use a<br />
variety of<br />
<strong>to</strong>ols, basic<br />
machines,<br />
materials and<br />
techniques <strong>to</strong><br />
solve problems<br />
and answer<br />
questions.<br />
Evaluate<br />
appropriate<br />
instruments<br />
and apparatus<br />
<strong>to</strong> accurately<br />
measure<br />
materials and<br />
processes.<br />
Apply the use<br />
of ingenuity<br />
and<br />
technological<br />
resources <strong>to</strong><br />
solve specific<br />
societal needs<br />
and improve<br />
the quality of<br />
life.<br />
Content<br />
Descrip<strong>to</strong>rs<br />
(benchmarks)<br />
Identify uses of <strong>to</strong>ols, machines,<br />
materials, information, people,<br />
money, energy and time that meet<br />
specific design criteria.<br />
Select appropriate instruments <strong>to</strong><br />
measure the size, weight, shape and<br />
temperature of living and non-living<br />
objects.<br />
Apply advanced <strong>to</strong>ol and equipment<br />
manipulation techniques <strong>to</strong> solve<br />
problems.<br />
Apply and evaluate the use of<br />
appropriate instruments <strong>to</strong> accurately<br />
measure scientific and technologic<br />
phenomena within the error limits of<br />
the equipment.<br />
Apply appropriate <strong>to</strong>ols, materials<br />
and processes <strong>to</strong> solve complex<br />
problems.<br />
Performance<br />
Tasks and Associated<br />
Learning Activities<br />
Going in Circles<br />
Going in Circles<br />
Acceleration in the <strong>Park</strong><br />
Steel Force vs, Thunderhawk<br />
Student Designed Experiment<br />
Acceleration in the <strong>Park</strong><br />
Steel Force vs, Thunderhawk
Coaster Quest<br />
Middle School<br />
Mathematics Standards<br />
Academic<br />
Standard<br />
Standard<br />
Category<br />
2.1.3 A<br />
2.1.3 J<br />
Standard<br />
Statement<br />
Count using whole numbers (<strong>to</strong> 10,000) and<br />
by 2’s, 3’s, 5’s, 10’s, 25’s and 100’s.<br />
Estimate, approximate, round or use<br />
exact numbers as appropriate.<br />
Performance<br />
Tasks and Associated<br />
Learning Activities<br />
Going In Circles<br />
Numbers, Number<br />
Systems and Number<br />
Relationships<br />
.<br />
2.1.5 C<br />
2.1.8 G<br />
Demonstrate that mathematical<br />
operations can represent a variety of<br />
problem situations<br />
Use the inverse relationships between<br />
addition, subtraction, multiplication, division,<br />
exponentiation and root extraction <strong>to</strong><br />
determine unknown quantities in equations.<br />
Acceleration in the <strong>Park</strong><br />
Steel Force vs, Thunderhawk<br />
Acceleration in the <strong>Park</strong><br />
Steel Force vs, Thunderhawk<br />
2.2.3 E<br />
Use estimation skills <strong>to</strong> arrive at<br />
conclusions.<br />
Going in Circles<br />
Computation and<br />
Estimation<br />
2.2.3 F<br />
2.2.5 B<br />
Determine the reasonableness of<br />
calculated answers.<br />
Develop and apply algorithms <strong>to</strong> solve<br />
word problems that involve addition,<br />
subtraction, and/or multiplication with<br />
decimals with and without regrouping.<br />
2.2.5 D Demonstrate the ability <strong>to</strong> round numbers.<br />
2.2.5 E<br />
2.2.8 B<br />
2.2.8 E<br />
Determine through estimations the<br />
reasonableness of answers <strong>to</strong><br />
problems involving addition,<br />
subtraction, multiplication and<br />
division of whole numbers.<br />
Add, subtract, multiply and divide<br />
different kinds and forms of rational<br />
numbers including integers, decimal<br />
fractions, percents and proper and<br />
improper fractions.<br />
Determine the appropriateness of<br />
overestimating or underestimating in<br />
computation.<br />
Roller Coaster Races<br />
Going in Circles<br />
Steel Force vs, Thunderhawk<br />
Acceleration in the <strong>Park</strong><br />
The Sea Dragon<br />
Acceleration in the <strong>Park</strong><br />
2.2.11 A<br />
Develop and use computation<br />
concepts, operations and procedures<br />
with real numbers in problem-solving<br />
situations.<br />
Roller Coaster Races
Coaster Quest<br />
Middle School<br />
Mathematics Standards<br />
Academic<br />
Standard<br />
Standard<br />
Category<br />
2.2.11 E<br />
Standard<br />
Statement<br />
Recognize that the degree of precision<br />
needed in calculating a number<br />
depends on how the results will be<br />
used and the instruments used <strong>to</strong><br />
generate the measure.<br />
Performance<br />
Tasks and Associated<br />
Learning Activities<br />
2.3.3 A<br />
Compare measurable characteristics of<br />
different objects on the same<br />
dimensions (e.g., time, temperature,<br />
area, length, weight, capacity,<br />
perimeter).<br />
Going in Circles<br />
2.3.3 C<br />
Determine and compare elapsed times.<br />
Measurement and<br />
Estimation<br />
2.3.5 A<br />
2.3.8 A<br />
2.3.8 B<br />
2.3.8 D<br />
Select and use appropriate instruments<br />
and units for measuring quantities<br />
(e.g., perimeter, volume, area, weight,<br />
time, temperature).<br />
Develop formulas and procedures for<br />
determining measurements (e.g., area,<br />
volume, distance).<br />
Solve rate problems (e.g., rate time<br />
= distance, principal interest rate =<br />
interest).<br />
Estimate, use and describe measures<br />
of distance, rate, perimeter, area,<br />
volume, weight, mass and angles.<br />
The Sea Dragon<br />
Acceleration in the <strong>Park</strong><br />
Acceleration in the <strong>Park</strong><br />
Roller Coaster Races<br />
Going in Circles<br />
Acceleration in the <strong>Park</strong><br />
2.3.11 A<br />
Select and use appropriate units and<br />
<strong>to</strong>ols <strong>to</strong> measure <strong>to</strong> the degree of<br />
accuracy required in particular<br />
measurement situations.<br />
Roller Coaster Races<br />
2.4.3 A<br />
Make, check and verify predictions<br />
about the quantity, size and shape of<br />
objects and groups of objects.<br />
Going In Circles<br />
Mathematical Reasoning<br />
and Connections<br />
2.4.8 B<br />
2.4.11 E<br />
Combine numeric relationships <strong>to</strong><br />
arrive at a conclusion.<br />
Demonstrate mathematical solutions<br />
<strong>to</strong> problems (e.g., in the physical<br />
sciences).<br />
Acceleration in the <strong>Park</strong><br />
Acceleration in the <strong>Park</strong><br />
Roller Coaster Races
Coaster Quest<br />
Middle School<br />
Mathematics Standards<br />
Academic<br />
Standard<br />
Mathematical Problem<br />
Solving and<br />
Communication<br />
Standard<br />
Category<br />
2.5.3 C<br />
2.5.5 B<br />
Standard<br />
Statement<br />
Select and use an appropriate method,<br />
materials and strategy <strong>to</strong> solve<br />
problems, including mental<br />
mathematics, paper and pencil and<br />
concrete objects.<br />
Use appropriate mathematical terms,<br />
vocabulary, language symbols and<br />
graphs <strong>to</strong> explain clearly and logically<br />
solutions <strong>to</strong> problems.<br />
Performance<br />
Tasks and Associated<br />
Learning Activities<br />
Going In Circles<br />
Acceleration in the <strong>Park</strong><br />
2.5.8 A<br />
Invent, select, use and justify the appropriate<br />
methods, materials and strategies <strong>to</strong> solve<br />
problems.<br />
2.6.3 A<br />
2.6.5 A<br />
2.6.5 B<br />
Gather, organize and display data<br />
using pictures, tallies, charts, bar<br />
graphs and pic<strong>to</strong>graphs.<br />
Organize and display data using pictures,<br />
tallies, tables, charts, bar graphs and circle<br />
graphs.<br />
Describe data sets using mean,<br />
median, mode and range.<br />
Acceleration in the <strong>Park</strong><br />
Going In Circles<br />
Acceleration in the <strong>Park</strong><br />
Going in Circles<br />
Roller Coaster Races<br />
The Sea Dragon<br />
The Sea Dragon<br />
Statistics and Data<br />
Analysis<br />
2.6.5 D<br />
2.6.5 E<br />
Predict the likely number of times a condition<br />
will occur based on analyzed data.<br />
Construct and defend simple<br />
conclusions based on data.<br />
Going in Circles<br />
Going in Circles<br />
The Sea Dragon<br />
2.6.8 F<br />
Use scientific and graphing<br />
calcula<strong>to</strong>rs and computer spreadsheets<br />
<strong>to</strong> organize and analyze data.<br />
Acceleration in the <strong>Park</strong><br />
Going in Circles<br />
Steel Force vs, Thunderhawk<br />
2.6.11 B<br />
Use appropriate technology <strong>to</strong><br />
organize and analyze data taken from<br />
the local community.<br />
Probability and<br />
Predictions<br />
2.7.3 C<br />
2.7.8 B<br />
List or graph the possible results of an<br />
experiment.<br />
Present the results of an experiment<br />
using visual representations (e.g.,<br />
tables, charts, graphs).<br />
Going In Circles
Coaster Quest<br />
Middle School<br />
Mathematics Standards<br />
Academic<br />
Standard<br />
Algebra and Functions<br />
Standard<br />
Category<br />
2.7.8 E<br />
2.8.3 G<br />
2.8.8 E<br />
Standard<br />
Statement<br />
Make valid inferences, predictions and<br />
arguments based on probability.<br />
Use a table or a chart <strong>to</strong> display<br />
information.<br />
Select and use a strategy <strong>to</strong> solve an equation<br />
or inequality, explain the solution and check<br />
the solution for accuracy.<br />
Performance<br />
Tasks and Associated<br />
Learning Activities<br />
Acceleration in the <strong>Park</strong>