Create successful ePaper yourself
Turn your PDF publications into a flip-book with our unique Google optimized e-Paper software.
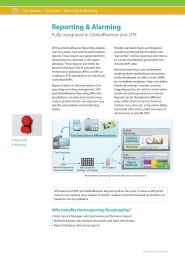
Diagnosis Tools<br />
Keep the overview or go into details!<br />
Service Alarm Map<br />
The Service Alarm Map is used to visualize<br />
mobile network services that target<br />
a speci� c service area. Alarms that are<br />
generated by the failure or degraded<br />
performance of services can be linked<br />
to a speci� c network element within the<br />
operator’s infrastructure.<br />
This function is implemented by careful<br />
correlation between the speci� c elements<br />
used within a test case execution and the<br />
overall network topology which has supported<br />
the test scenario that generated<br />
the alarms.<br />
Layer 3 Tracing<br />
Deeper insight into message � ow with Layer 3 tracing<br />
<strong>Keynote</strong> <strong>SIGOS</strong> o� ers <strong>SIGOS</strong> o� ers Layer<br />
3 tracing for 2G, 3G and LTE which is very<br />
important for telecommunication network<br />
testing. The primary goal is to get a<br />
deeper insight into the message � ow and<br />
the protocol data exchanged between<br />
mobile station and network.<br />
On Qualcomm-based mobile probes<br />
<strong>Keynote</strong> <strong>SIGOS</strong> records traces of the Layer<br />
3 Non-Access Stratum (NAS) signalling<br />
messages sent and received by the mobile.<br />
The information contained in these traces<br />
is vital for monitoring and trouble-<br />
www.keynote-sigos.com<br />
Test Systems > Test Tools > Diagnosis Tools<br />
An example could be a WAP test initiated<br />
from a wireless interface located at latitude<br />
(x), longitude (y). The topology for this scenario<br />
would use speci� c BTS/node B, BSC/<br />
RNC infrastructure, assigned to an MSC/<br />
SGSN � nally reaching a speci� c content<br />
portal.<br />
Each piece of network information and<br />
trace is processed to provide signi� cant<br />
data on the actual network performance<br />
and functionality, � nally the data is combined<br />
to give a total service area view.<br />
SERVICE View<br />
With Service view you get<br />
an easy high level overview<br />
about the status of the whole<br />
network.<br />
DETAILS View<br />
The Details view is accessed via<br />
single network elements of the<br />
Service view. It shows exactly<br />
which test case leads when to<br />
which failures.<br />
shooting the communication between<br />
mobile station and core network.<br />
Optionally, the NAS traces are supplemented<br />
with traces of Radio Resource<br />
Control (RRC) signalling messages<br />
exchanged between the mobile and the<br />
radio access network. These RRC<br />
traces provide valuable additional<br />
information, facilitating monitoring and<br />
troubleshooting of the Access Stratum<br />
(AS) as well.<br />
For 2G and LTE, Non-Access Stratum (NAS)<br />
Layer 3 tracing is supported.<br />
Service Alarm Map<br />
3G Layer 3 Tracing<br />
53