EPRI TR-111880-NP, "Piping System Failure Rates and ... - NRC
EPRI TR-111880-NP, "Piping System Failure Rates and ... - NRC
EPRI TR-111880-NP, "Piping System Failure Rates and ... - NRC

You also want an ePaper? Increase the reach of your titles
YUMPU automatically turns print PDFs into web optimized ePapers that Google loves.
REQUEST FOR APPROVAL OF ALTERNATE<br />
RISK-INFORMED INSERVICE INSPECTION (RI-ISI)<br />
REQUIREMENTS (ADDITIONAL INFORMATION)<br />
Attachment B<br />
Non-Proprietary Report<br />
<strong>EPRI</strong> <strong>TR</strong>-<strong>111880</strong>-<strong>NP</strong>, "<strong>Piping</strong> <strong>System</strong> <strong>Failure</strong> <strong>Rates</strong> <strong>and</strong> Rupture<br />
Frequencies for Use In Risk-Informed In-service Inspection<br />
Applications, " Final Report, September 1999
<strong>Piping</strong> <strong>System</strong> <strong>Failure</strong> <strong>Rates</strong> <strong>and</strong> Rupture<br />
Frequencies for Using Risk Informed In-<br />
Service Inspection Applications<br />
<strong>TR</strong>- 1 1 1880-<strong>NP</strong><br />
Final Report
<strong>Piping</strong> <strong>System</strong> <strong>Failure</strong> <strong>Rates</strong> <strong>and</strong><br />
Rupture Frequencies for Using Risk<br />
Informed In-Service Inspection<br />
Applications<br />
<strong>TR</strong>-<strong>111880</strong>-<strong>NP</strong><br />
Final Report, November 2000<br />
<strong>EPRI</strong> Project Manager<br />
J. Mitman<br />
<strong>EPRI</strong> 3412 Hillview Avenue. Palo Alto, California 94304 PO Box 10412. Palo Alto, CaMomia 94303 USA<br />
800.313.3774 650.855.2121 askepri@epri.com www.epri.com
DISCLAIMER OF WARRANTIES AND LIMITATION OF LIABILITIES<br />
THlS DOCUMENT WAS PREPARED BY THE ORGANIZATION(S) NAMED BELOW AS AN<br />
ACCOUNT OF WORK SPONSORED OR COSPONSORED BY THE ELEC<strong>TR</strong>IC POWER RESEARCH<br />
INSTITUTE, INC. (<strong>EPRI</strong>). NEITHER <strong>EPRI</strong>, ANY MEMBER OF <strong>EPRI</strong>, ANY COSPONSOR, THE<br />
ORGANIZATION(S) BELOW, NOR ANY PERSON ACTING ON BEHALF OF ANY OF THEM:<br />
(A) MAKES ANY WARRANTY OR REPRESENTATION WHATSOEVER, EXPRESS OR IMPLIED, (I)<br />
WlTH RESPECT TO THE USE OF ANY INFORMATION, APPARATUS, METHOD, PROCESS, OR<br />
SIMILAR ITEM DISCLOSED IN THlS DOCUMENT, INCLUDING MERCHANTABILITY AND FITNESS<br />
FOR A PARTICULAR PURPOSE, OR (11) THAT SUCH USE DOES NOT INFRINGE ON OR<br />
INTERFERE WlTH PRIVATELY OWNED RIGHTS, INCLUDING ANY PARTY'S INTELLECTUAL<br />
PROPERTY, OR (Ill) THAT THlS DOCUMENT IS SUITABLE TO ANY PARTICULAR USER'S<br />
CIRCUMSTANCE; OR<br />
(B) ASSUMES RESPONSIBILITY FOR ANY DAMAGES OR OTHER LIABILITY WHATSOEVER<br />
(INCLUDING ANY CONSEQUENTIAL DAMAGES, EVEN IF <strong>EPRI</strong> OR ANY <strong>EPRI</strong> REPRESENTATIVE<br />
HAS BEEN ADVISED OF THE POSSIBILITY OF SUCH DAMAGES) RESULTING FROM YOUR<br />
SELECTION OR USE OF THlS DOCUMENT OR ANY INFORMATION, APPARATUS, METHOD,<br />
PROCESS, OR SIMILAR ITEM DISCLOSED IN THlS DOCUMENT.<br />
ORGANIZATION(S) THAT PREPARED THlS DOCUMENT<br />
ERIN ENGINEERING & RESEARCH, INC.<br />
ORDERING INFORMATION<br />
Requests for copies of this report should be directed to the <strong>EPRI</strong> Distribution Center, 207 Coggins<br />
Drive, P.O. Box 23205, Pleasant Hill, CA 94523, (800) 313-3774.<br />
Electric Power Research Institute <strong>and</strong> <strong>EPRI</strong> are registered service marks of the Electric Power<br />
Research Institute, Inc. <strong>EPRI</strong>. POWERING PROGRESS is a service mark of the Electric Power<br />
Research Institute, Inc.<br />
Copyright Q 2000 Electric Power Research Institute, Inc. All rights resewed.
CITATIONS<br />
This report was prepared by<br />
ERIN Engineering & Research, Inc.<br />
Suite 180<br />
2 1 1 1 Palomar Airport Rd.<br />
Carlsbad. California 92009- 14 19<br />
Principal Investigators<br />
K. Fleming<br />
T. Mikschl<br />
D.Bidwel1<br />
J. Read<br />
B. Wiedemeier<br />
This report describes research sponsored by <strong>EPRI</strong>.<br />
The report is a corporate document that should be cited in the literature in the following manner:<br />
<strong>Piping</strong> <strong>System</strong> <strong>Failure</strong> <strong>Rates</strong> <strong>and</strong> Rupture Frequencies for Use In Risk Infomed In-service<br />
Inspection Applications: <strong>TR</strong>-<strong>111880</strong>-<strong>NP</strong>, <strong>EPRI</strong>, Palo Alto, CA: 2000. 1001044.
REPORT SUMMARY<br />
One current application of probabilistic safety assessment (PSA) in the nuclear industry is risk<br />
informed in-service inspection (RI-ISI) of piping systems. EPFU has developed an approach to<br />
RI-IS1 that has been implemented in full plant pilot studies <strong>and</strong> in applications of American<br />
Society of Mechanical Engineers (ASME) Code Case N-560. This approach uses insights from<br />
service experience to evaluate pipe failure potential based on a systematic search for damage<br />
mechanisms. This is a non proprietary version of <strong>TR</strong>-<strong>111880</strong>.<br />
Background<br />
In a previous project, an independent review was performed on the <strong>EPRI</strong> RI-IS1 method. That<br />
review called for strengthening the technical basis for assessing pipe failure potential in RI-IS1<br />
applications. It also called for confirmation that implementing the <strong>EPRI</strong> method would result in<br />
an acceptable change in risk. In response to this review, <strong>EPRI</strong> incorporated a project into its<br />
research program to enhance use of service experience for RI-ISI. This report presents current<br />
results of that research.<br />
Objectives<br />
To support RI-IS1 applications by enhancing capabilities of piping reliability assessments.<br />
To develop piping reliability models <strong>and</strong> supporting data that will be accountable to service<br />
experience.<br />
To create models <strong>and</strong> data that help confirm that changes to piping inspection programs can be<br />
made that enhance inspection effectiveness.<br />
To develop models <strong>and</strong> data that confirm changes to inspection programs have an acceptable<br />
impact on risk as measured by core damage frequency <strong>and</strong> large early release frequency.<br />
To provide models <strong>and</strong> databases that are easily useable by piping system <strong>and</strong> in-service<br />
inspection program engineers at nuclear power plants.<br />
To take into account uncertainties inherent in predictions of passive component reliability.<br />
To demonstrate the capabilities of the methods <strong>and</strong> databases that support updates to PSAs for<br />
sequences involving piping system failures.<br />
Approach<br />
The approach followed in developing piping system reliability models employs Markov models<br />
that permit time-dependent issues associated with aging processes to be addressed. In this<br />
application, the project team used Markov models to establish several discreet states of a piping<br />
system involving various levels of piping system degradation. Transitions associated with piping
failure, inspection, <strong>and</strong> repair processes were modeled explicitly. Relationships were established<br />
between time-dependent pipe rupture frequencies <strong>and</strong> observable parameters that describe the<br />
failure, inspection, <strong>and</strong> repair processes. To support application of the models, the team<br />
developed a piping reliability database grounded in the cumulative operating experience of light<br />
water reactor (LWR) piping systems. A companion report, <strong>EPRI</strong> <strong>TR</strong>-110161, covers data<br />
analysis methods, parameter estimation techniques, <strong>and</strong> an overview of the service experience<br />
data used. This current report provides a set of piping system failure rates <strong>and</strong> rupture<br />
frequencies generated from the methods described in <strong>EPRI</strong> <strong>TR</strong>- 1 101 6 1. The database permits the<br />
models to be applied to all four LWR reactor vendors, all existing piping systems, <strong>and</strong> all<br />
observed pipe failure mechanisms. Based on information collected for the <strong>EPRI</strong> ANO-2 pilot<br />
study, practical application of the resulting models <strong>and</strong> initial database was demonstrated on the<br />
Reactor Coolant <strong>System</strong> at the ANO-2 plant <strong>and</strong> is documented in <strong>TR</strong>- 1 10 16 1.<br />
Results<br />
This report's results demonstrate that careful analysis of service data with due regard to<br />
uncertainties can support order of magnitude estimates of pipe rupture frequencies <strong>and</strong> failure<br />
rates due to a wide set of failure mechanisms. In <strong>EPRI</strong> <strong>TR</strong>-I 10161, the first version of these data<br />
<strong>and</strong> models was used to evaluate potential risk impacts due to implementation of a risk informed<br />
inspection program.<br />
<strong>EPRI</strong> Perspective<br />
<strong>EPRI</strong> has performed ongoing research in piping system reliability. In addition, <strong>EPRI</strong> has long<br />
supported industry efforts to apply PSA technology in a variety of risk informed applications that<br />
help improve resource allocation <strong>and</strong> address safety <strong>and</strong> regulatory matters. This report provides<br />
important technical bases for <strong>EPRI</strong>'s approach to risk informed in-service inspection of piping<br />
systems. The report's data also should prove useful in bench-marking piping reliability<br />
assessments based on alternate approaches such as probabilistic fracture mechanics.<br />
Keywords<br />
RI-IS1<br />
Markov<br />
In-service inspection<br />
<strong>Failure</strong> rates
ABS<strong>TR</strong>ACT<br />
One of the current applications of probabilistic safety assessment in the nuclear industry is RI-<br />
ISI. <strong>EPRI</strong> has developed an approach to RI-IS1 that has been implemented in full plant pilot<br />
studies <strong>and</strong> in applications of ASME Code Case N-560. <strong>EPRI</strong> report <strong>TR</strong>- I 10161 provides<br />
important technical bases for this approach by establishing models <strong>and</strong> databases for piping<br />
system reliability assessment that utilize service experience from the first 2,000 reactor years of<br />
light water reactor (LWR) operating experience. The approach that was followed was to employ<br />
Markov reliability models that permit the role of inspections <strong>and</strong> the time dependent issues<br />
associated with aging processes to be addressed. Relationships are established between the time<br />
dependent pipe rupture frequencies <strong>and</strong> observable parameters that describe the failure,<br />
inspection <strong>and</strong> repair processes. A piping reliability database based on the cumulative operating<br />
experience of LWR piping systems was developed to support application of the models. <strong>Failure</strong><br />
rates <strong>and</strong> rupture frequencies derived from this database are presented in this report. This<br />
database permits the application to all four LWR reactor vendors, all existing piping systems <strong>and</strong><br />
all the observed pipe failure mechanisms. Practical application of the initial models <strong>and</strong><br />
databases was demonstrated in a companion report <strong>EPRI</strong> <strong>TR</strong>- 11016 1. This is a non proprietary<br />
version of <strong>TR</strong>- 1 11880.<br />
vii
CONTENTS<br />
1 IN<strong>TR</strong>ODUCTION ................................................................................................................. 1-1<br />
Background ........................................................................................................................ 1-1<br />
Objectives .......................................................................................................................... 1-2<br />
Technical Approach ............................................................................................................ 1-3<br />
Evolution of the EPRl Database for <strong>Piping</strong> <strong>System</strong>s ........................................................... 1-4<br />
SKI 96:20 Database Review <strong>and</strong> Screening ....................................................................... 1-6<br />
..................................................................................<br />
SKI 96:20 Database Enhancements 1-8<br />
2 DATA ANALYSIS FOR PIPING RELIABILITY .................................................................... 2-1<br />
Scope of the Analysis ......................................................................................................... 2-1<br />
Modeling Approach to Estimation of Pipe Rupture Frequencies ......................................... 2-2<br />
Time Dependent Pipe <strong>Failure</strong> <strong>Rates</strong> ................................................................................... 2-5<br />
Data Requirements <strong>and</strong> Sources to Support <strong>Failure</strong> Rate Estimates ............................... 2-9<br />
Sample <strong>Failure</strong> <strong>and</strong> Rupture Rate Calculations ................................................................. 2-19<br />
Model A: Sample Calculation ........................................................................................ 2-19<br />
Model A: <strong>Failure</strong> Frequency Calculation ................................................................... 2-20<br />
Model A: Rupture Given <strong>Failure</strong> Probability Calculation ........................................... 2-24<br />
Model A: Rupture Frequency Calculation ................................................................. 2-24<br />
Model B: Rupture Frequency Calculation ...................................................................... 2-26<br />
3 REFERENCES .................................................................................................................... 3-1<br />
A PIPE FAILURE RATE DIS<strong>TR</strong>IBUTIONS ............................................................................. A-1<br />
B BAYESIAN ANALYSIS RELIABILITY TOOL ..................................................................... B-1<br />
Introduction ........................................................................................................................ B-1<br />
Introduction to Bayes' Theorem .......................................................................................... B-1<br />
Application of Bayes' Theorem in BARFM .......................................................................... 8-2<br />
Software Use ...................................................................................................................... B-3
Batch Process Options ................................................................................................ B-13<br />
References ..... .. ...... .. .. ... ........... ... .... .. . ..... ... ... .. . .. . .. ... .. . .. ... . .... ...... . .. ... .. .. .. ..... .................... B-17
LIST OF FIGURES<br />
-<br />
-. . . .<br />
- -<br />
Figure 2-1 Number of Pipe <strong>Failure</strong>s by Year of Operation ....................................................... 2-6<br />
Figure 2-2 Plant Years in the Database by Year of Operation ................................................. 2-6<br />
Figure 2-3 <strong>Failure</strong> Rate per Year by Year of Operation .......................................................... 2-7<br />
Figure 2-4 Rupture Rate by Year of Operation for <strong>Failure</strong> Mechanism WH ............................. 2-8<br />
Figure 2-5 <strong>Failure</strong> Rate by Year of Operation for <strong>Failure</strong> Mechanism VF ................................ 2-9<br />
Figure 2-6 Bayesian Update: <strong>Failure</strong>s per Susceptible Weld Year Based on Lower<br />
Bound Estimate for Population Data ...............................................................................<br />
Figure 2-7 Bayesian Update: <strong>Failure</strong>s per Susceptible Weld Year Based on Best<br />
Estimate for Population Data ..........................................................................................<br />
Figure 2-8 Bayesian Update: <strong>Failure</strong>s per Susceptible Weld Year Based on Upper<br />
Bound Estimate for Population .......................................................................................<br />
2-22<br />
2-23<br />
2-24<br />
Figure 2-9 Sample <strong>Failure</strong> Frequency Distribution for Thermal Fatigue .................................. 2-24<br />
Figure 2-1 0 Bayesian Update: Thermal Fatigue Rupture Given <strong>Failure</strong> Probability ................ 2-26<br />
Figure 2-1 1 Sample Rupture Frequency Distribution for Thermal Fatigue .............................. 2-26<br />
Figure 2-12 Model A Calculation Example Summary ............................................................. 2-27<br />
Figure 2-13 Model B Sample Result: Ruptures per <strong>System</strong> Year ........................................... 2-28<br />
Figure B-1 BARFM Main Window ............................................................................................ B-4<br />
Figure 8-2 Time Based Frequency Calculation Input Screen .................................................. B-5<br />
Figure 6-3 Time Based Frequency Calculation Report Preview ........................................ B-6<br />
Figure B-4 Dem<strong>and</strong> Based Frequency Calculation Input Screen ............................................ B-8<br />
Figure B-5 Dem<strong>and</strong> Based Frequency Calculation Report Preview ........................................ B-9<br />
Figure B-6 Common Cause Beta Factor Input Screen ......................................................... B-10<br />
Figure B-7 Selecting Generic Beta Factor Priors from BART'S Database ............................. B-11<br />
Figure B-8 Beta Distribution Calculation Input Screen .......................................................... 8-12<br />
Figure B-9 Batch Calculation Input Screen ........................................................................... B-13<br />
Figure B-10 Indicating the Number of Calculations in the Batch Process ............................. B-15
LIST OF TABLES<br />
Table 1-1 Pipe <strong>Failure</strong> Database Sample Event Record ......................................................... 1-5<br />
Table 1-2 Summary of SKI 96:20 Database Revisions by <strong>Failure</strong> Mechanism for All Pipe<br />
Sizes ...............................................................................................................................<br />
Table 1-3 Summary of Service Experience From Revised Database Categorized by Pipe<br />
Size Range ..................................................................................................................... 1.10<br />
Table 2-1 <strong>System</strong> Groups <strong>and</strong> Associated Generic Plant <strong>System</strong>s ......................................... 2-2<br />
Table 2-2 Rupture Rate Models Used for Different <strong>Failure</strong> Mechanisms ................................. 2-4<br />
Table 2-3 Prior Probability Distributions for Bayesian Updates ............................................... 2-10<br />
Table 2-4 Summary of <strong>Failure</strong> Events for All Vendors <strong>and</strong> All Pipe Sizes ............................... 2-11<br />
Table 2-5 Summary of <strong>Failure</strong> Events for All Vendors <strong>and</strong> Pipe Size 2 2" in Diameter ........... 2-12<br />
Table 2-6 Years of Plant Operating Experience from the EPRl '97 Database ........................ 2-13<br />
Table 2-7 Average Number of <strong>System</strong>s per <strong>System</strong> Group .................................................... 2-13<br />
Table 2-8 Database Events for Large <strong>and</strong> Small <strong>Piping</strong> Groups ............................................. 2-15<br />
Table 2-9 Vendor Groupings Used in the Analysis of <strong>Failure</strong> <strong>Rates</strong> for Each <strong>System</strong> ............ 2-16<br />
Table 2-10 Grouping of Rupture Evidence Used in the Development of Rupture <strong>Rates</strong><br />
for Degradation Mechanisms ........................................................................................<br />
1-9<br />
-2-1 7<br />
Table 2-1 1 Priors Used for the Conditional Probability of Rupture .......................................... 2-19<br />
Table A-1 Summary of <strong>Failure</strong> Events for Combustion Engineering Plants ............................. A-3<br />
Table A-2 Summary of <strong>Failure</strong> Events for Westinghouse Plants ........................................ A-4<br />
Table A-3 Summary of <strong>Failure</strong> Events for Babcock <strong>and</strong> Wilcox Plants .................................... A-5<br />
Table A-4 Summary of <strong>Failure</strong> Events for General Electric Plants ........................................... A-6<br />
Table A-5 Estimated Number of Welds <strong>and</strong> Pipe Feet per <strong>System</strong> Group ............................... A-7<br />
Table A-6 <strong>Piping</strong> Element Susceptibility Fractions for PWR Plant <strong>System</strong> Groups .................. A-8<br />
Table A-7 <strong>Piping</strong> Element Susceptibility Fractions for BWR (GE) Plant <strong>System</strong> Groups ......... A-9<br />
Table A-8 Conditional Pipe <strong>Failure</strong> Rate Estimates for Combustion Engineering Plants ....... A-10<br />
Table A-9 Conditional Pipe <strong>Failure</strong> Rate Estimates for Westinghouse Plants ........................ A-11<br />
Table A-1 0 Conditional Pipe <strong>Failure</strong> Rate Estimates for Babcock <strong>and</strong> Wilcox Plants ............ A-12<br />
Table A-1 1 Conditional Pipe <strong>Failure</strong> Rate Estimates for General Electric Plants ................... A-13<br />
Table A-12 Unconditional Pipe <strong>Failure</strong> Rate Estimates for Combustion Engineering<br />
Plants ............................................................................................................................ A-14<br />
Table A-1 3 Unconditional Pipe <strong>Failure</strong> Rate Estimates for Westinghouse Plants .................. A-15<br />
Table A-14 Unconditional Pipe <strong>Failure</strong> Rate Estimates for Babcock <strong>and</strong> Wilcox Plants ......... A-16<br />
. .<br />
...<br />
Xlll
Table A-1 5 Unconditional Pipe <strong>Failure</strong> Rate Estimates for General Electric Plants ............... A-1 7<br />
Table A-1 6 Unconditional Rupture <strong>Rates</strong> per <strong>System</strong> Group Year for Combustion<br />
Engineering Plants ........................................................................................................ A-18<br />
Table A-1 7 Unconditional Rupture <strong>Rates</strong> per <strong>System</strong> Group Year for Westinghouse<br />
Plants ............................................................................................................................ A-19<br />
Table A-1 8 Unconditional Rupture <strong>Rates</strong> per <strong>System</strong> Group Year for Babcock <strong>and</strong><br />
Wilcox Plants .................................................................................................................<br />
Table A-1 9 Unconditional Rupture <strong>Rates</strong> per <strong>System</strong> Group Year for General Electric<br />
Plants ............................................................................................................................ A-21<br />
Table A-20 Pipe <strong>Failure</strong> <strong>Rates</strong> for Combustion Engineering Reactor Coolant <strong>System</strong><br />
(RCS)............................................................................................................................ A-22<br />
Table A-21 Pipe <strong>Failure</strong> <strong>Rates</strong> for Combustion Engineering Safety Injection <strong>and</strong><br />
Recirculation <strong>System</strong>s (SIR) .......................................................................................... A-23<br />
Table A-22 Pipe <strong>Failure</strong> <strong>Rates</strong> for Combustion Engineering Containment Spray <strong>System</strong><br />
(CS ) .............................................................................................................................. A-24<br />
Table A-23 Pipe <strong>Failure</strong> <strong>Rates</strong> for Combustion Engineering Reactor Auxiliary <strong>System</strong><br />
(RAS) ............................................................................................................................ A-25<br />
Table A-24 Pipe <strong>Failure</strong> <strong>Rates</strong> for Combustion Engineering Service Water <strong>System</strong><br />
(AUXC) .......................................................................................................................... A-26<br />
Table A-25 Pipe <strong>Failure</strong> <strong>Rates</strong> for Combustion Engineering Feedwater <strong>and</strong> Condensate<br />
<strong>System</strong>s (NVS) ............................................................................................................. A-27<br />
Table A-26 Pipe <strong>Failure</strong> <strong>Rates</strong> for Combustion Engineering Main Steam <strong>and</strong> Turbine<br />
<strong>System</strong>s (ST) ................................................................................................................ A-28<br />
Table A-27 Pipe <strong>Failure</strong> <strong>Rates</strong> for Combustion Engineering Fire Protection <strong>System</strong><br />
(FPS) ............................................................................................................................. A-29<br />
Table A-28 Pipe <strong>Failure</strong> <strong>Rates</strong> for Westinghouse Reactor Coolant <strong>System</strong> (RCS)................<br />
A-30<br />
Table A-29 Pipe <strong>Failure</strong> <strong>Rates</strong> for Westinghouse Safety Injection <strong>and</strong> Recirculation<br />
<strong>System</strong>s (SIR)............................................................................................................... A-31<br />
Table A-30 Pipe <strong>Failure</strong> <strong>Rates</strong> for Westinghouse Containment Spray <strong>System</strong> (CS)..............<br />
A-32<br />
Table A-31 Pipe <strong>Failure</strong> <strong>Rates</strong> for Westinghouse Reactor Auxiliary <strong>System</strong>s (RAS).............<br />
A-33<br />
Table A-32 Pipe <strong>Failure</strong> <strong>Rates</strong> for Westinghouse Service Water <strong>System</strong> (AUXC).................<br />
A-34<br />
Table A-33 Pipe <strong>Failure</strong> <strong>Rates</strong> for Westinghouse Feedwater <strong>and</strong> Condensate <strong>System</strong>s<br />
(FWC) ........................................................................................................................... A-35<br />
Table A-34 Pipe <strong>Failure</strong> <strong>Rates</strong> for Westinghouse Main Steam <strong>and</strong> Turbine <strong>System</strong>s (ST)....<br />
A-36<br />
Table A-35 Pipe <strong>Failure</strong> <strong>Rates</strong> for Westinghouse Fire Protection <strong>System</strong> (FPS) A-37<br />
...................<br />
......<br />
Table A-36 Pipe <strong>Failure</strong> <strong>Rates</strong> for Babcock <strong>and</strong> Wilcox Reactor Coolant <strong>System</strong> (RCS) A-38<br />
Table A-37 Pipe <strong>Failure</strong> <strong>Rates</strong> for Babcock <strong>and</strong> Wilcox Safety Injection <strong>and</strong> Recirculation<br />
<strong>System</strong>s (SIR)............................................................................................................... A-39<br />
Table A-38 Pipe <strong>Failure</strong> <strong>Rates</strong> for Babcock <strong>and</strong> Wilcox Containment Spray <strong>System</strong> (CS) .... A-40<br />
Table A-39 Pipe <strong>Failure</strong> <strong>Rates</strong> for Babcock <strong>and</strong> Wilcox Reactor Auxiliary <strong>System</strong>s (RAS)....<br />
A-41<br />
Table A-40 Pipe <strong>Failure</strong> <strong>Rates</strong> for Babcock <strong>and</strong> Wilcox Service Water <strong>System</strong> (AUXC) ....... A-42<br />
A-20<br />
xiv
Table A-41 Pipe <strong>Failure</strong> <strong>Rates</strong> for Babcock <strong>and</strong> Wilcox Feedwater <strong>and</strong> Condensate<br />
<strong>System</strong>s (FWC) A-43<br />
.............................................................................................................<br />
Table A-42 Pipe <strong>Failure</strong> <strong>Rates</strong> for Babcock <strong>and</strong> Wilcox Main Steam <strong>and</strong> Turbine<br />
<strong>System</strong>s (ST) A-44<br />
................................................................................................................<br />
Table A-43 Pipe <strong>Failure</strong> <strong>Rates</strong> for Babcock <strong>and</strong> Wilcox Fire Protection <strong>System</strong> (FPS).......... A-45<br />
Table A-44 Pipe <strong>Failure</strong> <strong>Rates</strong> for General Electric Reactor Coolant <strong>System</strong> (RCS).............<br />
A-46<br />
Table A-45 Pipe <strong>Failure</strong> <strong>Rates</strong> for General Electric Safety Injection <strong>and</strong> Recirculation<br />
<strong>System</strong>s (SIR)...............................................................................................................<br />
A-47<br />
Table A-46 Pipe <strong>Failure</strong> <strong>Rates</strong> for General Electric Containment Spray <strong>System</strong> (CS)...........<br />
A-48<br />
Table A-47 Pipe <strong>Failure</strong> <strong>Rates</strong> for General Electric Reactor Auxiliary <strong>System</strong>s (RAS) .......... A-49<br />
Table A-48 Pipe <strong>Failure</strong> <strong>Rates</strong> for General Electric Service Water <strong>System</strong> (AUXC) .............. A-50<br />
Table A-49 Pipe <strong>Failure</strong> <strong>Rates</strong> for General Electric Feedwater <strong>and</strong> Condensate <strong>System</strong>s<br />
A-51<br />
(FWC) ...........................................................................................................................<br />
Table A-50 Pipe <strong>Failure</strong> <strong>Rates</strong> for General Electric Main Steam <strong>and</strong> Turbine <strong>System</strong>s<br />
(ST) ...............................................................................................................................<br />
A-52<br />
Table A-51 Pipe <strong>Failure</strong> <strong>Rates</strong> for General Electric Fire Protection <strong>System</strong> (FPS) ................ A-53<br />
.............................................................................<br />
Table B-1 BARFM Database File Structure B-7<br />
Table B-2 Sample User Supplied Input File for Batch Processing ........................................ B-16
IN<strong>TR</strong>ODUCTION<br />
Background<br />
The purpose of this report is to document the development <strong>and</strong> application of new reliability<br />
models <strong>and</strong> supporting databases to estimate the frequencies of piping failures in nuclear power<br />
plants. These models were developed as part of an effort to implement RI-IS1 strategies for<br />
piping systems.<br />
For the past several years, <strong>EPRI</strong> has been developing a risk informed approach to optimize<br />
programs in which piping systems are inspected in accordance with Section XI of the ASME<br />
code. The goal of the RI-IS1 program is to optimize the resources for inspection of piping<br />
systems in a manner that will maintain the risks of pipe ruptures at acceptably low levels while<br />
minimizing inspection costs <strong>and</strong> personnel radiation exposures associated with the performance<br />
of these inspections. As with other risk informed applications, the intent is to reallocate resources<br />
away from areas with marginal safety impact to areas that have a greater potential for effecting<br />
risk.<br />
The existing requirements for inspections of safety related piping systems are derived from the<br />
ASME code Section XI <strong>and</strong> augmented inspection programs. These programs have been added<br />
to address failure mechanisms that were not envisioned in Section XI but yet have been<br />
experienced. Examples include flow accelerated corrosion (FAC) <strong>and</strong> intergranular chloride<br />
stress corrosion cracking (IGSCC). The technical approach to RI-IS1 adopted by <strong>EPRI</strong> is to take<br />
advantage of insights from service experience from over 2,000 reactor years of commercial LWR<br />
piping systems [I, 21. This experience includes documented evidence of more than 1,500 piping<br />
system failures including about 100 that were severe enough to be classified as ruptures with<br />
leak flows in excess of 50 gpm, with the remaining failures involving smaller leak rates. This<br />
study found that essentially all the leaks <strong>and</strong> ruptures that have occurred in this experience are<br />
the result of a well defined set of failure mechanisms, whose causative factors are known. These<br />
failure mechanisms include various combinations of degradation mechanisms such as FAC <strong>and</strong><br />
IGSCC, as well as mechanisms induced by normal <strong>and</strong> transient loading conditions such as<br />
vibration fatigue, water hammer <strong>and</strong> over-pressurization transients.<br />
There are important technical issues in RI-IS1 related to the question of how to estimate the<br />
frequency <strong>and</strong> risk impacts of pipe failures, especially pipe ruptures. It is unclear how current<br />
inspection programs <strong>and</strong> leak detection programs have influenced the observed frequency of pipe<br />
ruptures, or whether such pipe failures have occurred in spite of such inspection programs. There<br />
is a growing concern that current inspection programs are geared to locations <strong>and</strong> failure<br />
mechanisms that generally do not occur or only occur rarely, while other failures occur in
Introduction<br />
locations by failure mechanisms not accounted for in the current inspection programs. A related<br />
concern is derived from the insight that for a non-destructive examination to assure a high degree<br />
of reliability, the inspection must be geared to look for specific degradation mechanisms. A goal<br />
of this program is to feedback insights from the current inspection program to effect an<br />
inspection for cause approach. Such an approach should be more effective in reducing failure<br />
<strong>and</strong> rupture frequencies in those locations that are selected in a risk informed process for<br />
inspections. At the same time, costs <strong>and</strong> personnel exposures can be reduced as locations with<br />
minimal safety importance are eliminated from the inspection program.<br />
The application of probabilistic safety assessment (PSA) technology in this approach has two<br />
important roles. The first is to assess the risk impacts of piping failure modes on a segment by<br />
segment basis to underst<strong>and</strong> the relationship between where <strong>and</strong> how inspections are currently<br />
carried out <strong>and</strong> the risk of pipe failures in these segments. The second role is to better underst<strong>and</strong><br />
the risk impacts of the proposed changes to the inspection program. It is necessary to assess these<br />
changes to assure that any risk increases that may result from reduced inspections in some pipe<br />
segments are offset by appropriate risk reductions from increased <strong>and</strong> enhanced inspections in<br />
more risk sensitive segments. It is this second role of PSA that is supported by the work<br />
presented in this report, <strong>and</strong> a companion report <strong>EPRI</strong> <strong>TR</strong>- 1 10161 [3].<br />
Objectives<br />
The primary objectives of this report <strong>and</strong> its companion report <strong>EPRI</strong> <strong>TR</strong>- 1 1016 1 [3] are to:<br />
Develop methods that provide realistic estimates of pipe failure frequencies for all systems<br />
within the scope of RI-IS1 programs for piping systems.<br />
Develop a piping reliability database that can be used with these methods to ensure that<br />
piping reliability estimates obtained from models will be well anchored <strong>and</strong> benchmarked<br />
against the results of service experience.<br />
Account for service experience with pipe failures including flaws, leaks <strong>and</strong> ruptures from<br />
the first 2,000 reactor years of U.S. commercial LWR experience through 1995.<br />
Explicitly model the impacts of inspections for flaws <strong>and</strong> leaks in piping systems so that<br />
changes in pipe failure frequencies due to changes in inspection <strong>and</strong> leak detection strategies<br />
can be determined.<br />
Support the capability for plant specific estimation of pipe failure rates when adequate data<br />
are available.<br />
Account for uncertainties in the pipe rupture frequency estimates.<br />
Ensure that all assumptions are clearly documented to effect independent review.<br />
Account for the "leak before break" characteristic of applicable failure mechanisms when<br />
appropriate.<br />
Provide a set of tools that can be easily applied by utility engineers in current <strong>and</strong> future RI-<br />
IS1 projects <strong>and</strong> any application to estimate rupture frequencies; <strong>and</strong>, provide guidance to<br />
optimize inspection programs.
While a great deal of work has been done by other authors to contribute to our current<br />
capabilities to estimate pipe failure frequencies, none of the existing available methods has really<br />
met all the above objectives.<br />
Technical Approach<br />
There are several different approaches that have been applied to estimate pipe failure<br />
frequencies. The most straightforward approach is to simply obtain statistical estimates of pipe<br />
element failure rates. This is the most common approach to this problem [4, 5,6]. The primary<br />
limitation of a statistical approach is that past historical data reflects some indeterminate impact<br />
of previous inspection programs. In order to propose changes to these programs, such changes<br />
may render the previous failure rate estimates invalid.<br />
A second approach is to make use of probabilistic fracture mechanics models to predict crack<br />
initiation <strong>and</strong> growth from existing flaws. To date, pipe rupture frequencies estimated with this<br />
approach have not been fully reconciled against service experience. Moreover, the technology to<br />
perform the necessary computations <strong>and</strong> the requisite input data are generally not available to<br />
utility piping engineers. Conversely, new models based on service experience will be useful as a<br />
benchmark to help validate current efforts to refine fracture mechanics based approaches.<br />
During a recent project [7] to review the <strong>EPRI</strong> RI-IS1 methodology [8], an idea emerged to<br />
utilize an established reliability modeling technique, known as Markov modeling, for a piping<br />
reliability assessment. The objective of this approach is to explicitly model the interactions<br />
between failure mechanisms that produce failures, <strong>and</strong> the inspection, detection <strong>and</strong> repair<br />
strategies that can reduce the probability that failures occur, or the probability that failures will<br />
progress to ruptures before being repaired. This Markov modeling technique starts with a<br />
representation of a "system" in a set of discrete <strong>and</strong> mutually exclusive states. At any instant in<br />
time, the system is permitted to change state in accordance with whatever competing processes<br />
are appropriate for that plant state. In this application of the Markov model, the states refer to<br />
various degrees of piping system degradation, i.e., the existence of flaws, leaks or ruptures. The<br />
processes that can create a state change are the failure mechanisms operating on the pipe <strong>and</strong> the<br />
processes of inspecting or detecting flaws <strong>and</strong> leaks, <strong>and</strong> repair of damage prior to the<br />
progression of the failure mechanism to rupture.<br />
This idea was evaluated <strong>and</strong> determined to be capable of meeting all the objectives outlined in<br />
the previous section. Importantly, the task of estimating the model parameters was found to be<br />
straightforward <strong>and</strong> feasible. With this information, it was decided to launch a project to<br />
demonstrate the capabilities of this approach <strong>and</strong> to develop a piping reliability database that can<br />
be used to support its application. In the database development effort, the project took advantage<br />
of the multidisciplinary team that <strong>EPRI</strong> formed to work on the RI-IS1 project. This team was<br />
comprised of experts in piping degradation mechanisms, NDE inspection techniques,<br />
probabilistic safety assessment <strong>and</strong> reliability model development, <strong>and</strong> reliability database<br />
development. This team examined a number of issues confronted in previous piping reliability<br />
studies such as the need for an integrated approach for treating degradation mechanisms that act<br />
on welds, those that act on piping base metal, <strong>and</strong> those that act on entire systems <strong>and</strong><br />
subsystems in imposing severe pipe loading conditions. Additional issues that were addressed
include consideration of leak before break characteristics of certain pipe failure mechanisms, <strong>and</strong><br />
how to specialize a piping analysis to make it plant <strong>and</strong> system specific.<br />
A final issue addressed in this project is the use of the reliability assessment tools, the supporting<br />
piping reliability database, <strong>and</strong> the results of an application of RI-IS1 to perform a risk evaluation<br />
of the impacts of changes to the inspection program. To prove the usefulness of the results of this<br />
project, an evaluation was performed of the Reactor Coolant <strong>System</strong> (RCS) at ANO-2. This<br />
evaluation provided useful insights in refining the <strong>EPRI</strong> approach to RI-ISI.<br />
The results of this project are presented in the rest of this report <strong>and</strong> in a companion report <strong>EPRI</strong><br />
<strong>TR</strong>- I 101 61. The purpose of this document is to provide an assessment of the frequency of the<br />
major piping <strong>and</strong> weld damage mechanisms at U.S. nuclear power plants. The assessment of<br />
these mechanisms was utilized in <strong>EPRI</strong> <strong>TR</strong>-110161 [3] which was published in December 1998.<br />
The final report incorporated comments <strong>and</strong> ideas that stemmed from industry discussion <strong>and</strong> use<br />
of the draft version of that document. The intent of this report is to 1) provide additional<br />
information not published in the companion report, <strong>EPRI</strong> <strong>TR</strong>-110161, 2) incorporate industry<br />
suggestions to better characterize <strong>and</strong> analyze the failure mechanisms, <strong>and</strong> 3) perform<br />
enhancements to the database.<br />
This document is organized into two sections. Section 1 reviews the changes that were made to<br />
the Swedish Nuclear Power Inspectorate (SKI) database described in SKI Report 9620 [I] that<br />
eventually resulted in what is now called the <strong>EPRI</strong> '97 database. Section 2 presents in detail the<br />
methodology used to calculate the pipe failure <strong>and</strong> rupture rates for various failure mechanisms,<br />
including an example. Appendix A presents the complete set of results for all the mechanisms,<br />
systems, <strong>and</strong> reactor vendors. Finally, Appendix B describes the software that was used to<br />
perform the Bayesian updating.<br />
Application of the initial failure rates <strong>and</strong> rupture frequency estimates that are updated <strong>and</strong><br />
presented in this report is provided in <strong>EPRI</strong> <strong>TR</strong>- 1 101 6 1 [3]. In this application, the risk impacts<br />
of implementing the <strong>EPRI</strong> RI-IS1 program in one of the pilot plant projects are examined.<br />
An independent technical review of this work was performed by the University of Maryl<strong>and</strong>.<br />
This review covered the methods that were developed for piping system reliability <strong>and</strong> for<br />
estimating parameters of these models that describe pipe failure mechanisms, inspections <strong>and</strong><br />
leak detection processes, <strong>and</strong> repair of pipes prior to occurrence of pipe rupture. The capability<br />
of the existing data to support estimation of the parameters of these new reliability models was<br />
also in the scope of the review. As a result of this review, which is documented in Appendix A of<br />
<strong>EPRI</strong> <strong>TR</strong>- 1 10 16 1, enhancements to the piping reliability models are proposed, the technical<br />
validity of the work was affirmed, <strong>and</strong> the reasonableness of the assumptions made were<br />
corroborated.<br />
Evolution of the <strong>EPRI</strong> Database for <strong>Piping</strong> <strong>System</strong>s<br />
One of the cornerstones of the <strong>EPRI</strong> RI-IS1 methodology is the use of service experience to<br />
estimate the frequency of pipe ruptures. With over 2,000 reactor years of operating experience<br />
for the U.S. commercial nuclear plants alone, there is sufficient data available to develop pipe
SKI 96:20 Database Review <strong>and</strong> Screening<br />
A brief review of the SKI 9620 database with which we started revealed a number of issues that<br />
needed to be addressed before the development of statistical information that could be used to<br />
suppn jiping reliability evaluations. These issues included:<br />
Leaks <strong>and</strong> ruptures events of components other than pipes<br />
Events that occurred before commercial operation or after the final plant shutdown before<br />
decommissioning<br />
Events involving pipe failures with a working fluid other than water or steam<br />
Events involving small instrument lines that are not of interest in RI-IS1 applications<br />
Events in which the cause of the failure was not clearly defined or listed as "unknown"<br />
Possible errors or discrepancies in one or more of the database fields<br />
A brief discussion of what was done to address each of these issues that resulted in changes to<br />
the original database is presented below.<br />
Non-<strong>Piping</strong> Events. A brief comment is entered for each event in the SKI 9620 database. A<br />
review of these comments revealed that many of the events in the database involved the failure<br />
of components other than piping. Although these events may provide valuable information<br />
related to the frequency of leaks <strong>and</strong> ruptures in water <strong>and</strong> steam systems in general, they are not<br />
applicable to the assessment of pipe failures. Also, these components are not within the scope of<br />
ASME Section XI or EPFU RI-IS1 programs. Therefore, these "non-piping" events were screened<br />
from this analysis. Some examples of these non-piping components are: tubing, hoses, gaskets,<br />
nipples, valves <strong>and</strong> heat exchangers, among others. Care was taken not to delete events involving<br />
the failure of a weld connection between a pipe segment <strong>and</strong> some other component such as a<br />
valve or pump. A total of 245 events were screened out of the failure rate analysis based on the<br />
"non-piping" criteria. To preserve the completeness of the database, no records were deleted,<br />
only modified so that filters could be applied for the purpose of statistical failure rate<br />
development.<br />
Screening Based on Year of Phnt Operation. The SKI 96:20 database included events that<br />
occurred as much as seven years prior to initial criticality, <strong>and</strong> events that occurred several years<br />
after a plant was permanently shutdown. To ensure consistency in the data, only operating<br />
experience within one year prior to initial criticality, <strong>and</strong> before the permanent shutdown of<br />
plant, was used. There were 14 failure events in the SKI 9690 database that occurred prior to<br />
one year before initial criticality, <strong>and</strong> 7 events that occurred after the plant had been shutdown.<br />
These events were screened from the database.<br />
Include Water <strong>and</strong> Steam <strong>Piping</strong> Only. The <strong>EPRI</strong> FU-IS1 pipe failure analysis is for water <strong>and</strong><br />
steam system piping only. Several failures in the SKI 96:20 database involve instrument air<br />
piping or fuel lines. There were 13 failure events of this type in the SKI 96:20 database screened<br />
from the analysis.
Introduction<br />
RCS Leaks with Unknown <strong>Failure</strong> Mechanisms. The SKI 9620 database included a failure<br />
mechanism category for pipe failures caused by unknown ("UNK") causes. In the process of<br />
performing the AN0 2 pilot project [9], analysts were able to identify the failure mechanism for<br />
seven reactor coolant system leaks at Combustion Engineering plants (previously considered<br />
unknown) by communication with plant personnel. Four of these events were classified as<br />
primary water stress corrosion cracking (SC) <strong>and</strong> three as vibrational fatigue (VF). The exercise<br />
of researching the subset of failure events classified as failure mechanism "unknown" validates<br />
that there are very few if any pipe failures where the failure mechanism is unknown. In most<br />
cases, the failure mechanism is not specifically reported, <strong>and</strong> the documentation of the event is<br />
not detailed enough to identify the failure mechanism. The failure mechanism "UNK in the SKI<br />
9620 database is replaced by unreported cause ("UNR) in the <strong>EPRI</strong> '97 database. These failure<br />
events are not screened from the analysis.<br />
Review of Rupture Events. After applying the screening criteria described above, there remained<br />
87 rupture events in the database. A preliminary reference search secured copies of the SKI cited<br />
reference for 72 of these ruptures. Unfortunately 10 of these references either did not correspond<br />
to the listed event or did not contain enough information to properly classify the event.<br />
The review of the references did lead to some enhancements to the database. A number of<br />
changes <strong>and</strong> corrections to the database were made. These changes included: reclassifying<br />
several rupture (>50 gpm) events as leak ( 40 gpm) events (4), screening some events as nonpiping<br />
events (13), <strong>and</strong> correcting the date of occurrence or system classification for a number of<br />
events. One rupture event was listed twice in the database; therefore, the duplicate was deleted.<br />
An additional comment field was added to document any changes made to the original SKI data.<br />
SKI 96:20 Database Enhancements<br />
A number of additional changes have been made to the events database. One change is the result<br />
of a concern that the D&C events, on closer inspection, might actually be other failure<br />
mechanisms with a misidentified root cause. Consequently, as many of the primary sources of<br />
the events were located <strong>and</strong> reviewed. Of the original 76 failures attributed to D&C, 56 had a<br />
reference listed. Of the 56 with a known reference, 49 were obtained <strong>and</strong> reviewed. As a result of<br />
this effort, only 12 events were reclassified. Two events were re-categorized as corrosion, one<br />
was re-categorized as dynamic-design loading (DDL), <strong>and</strong> one DDL event was re-categorized as<br />
unknown. The remaining eight events were non-piping component failures such as gaskets or<br />
valves <strong>and</strong> were screened form the analysis. This review confirms that the categorization of the<br />
A review of the rupture events in the system group AUXC was also performed. All of the events<br />
were confirmed as appropriately classified except one event. This event was moved to the leak<br />
category from the rupture category. The root cause remains unreported.<br />
Summary of Changes. The following table summarizes in a global sense the impact of the<br />
review changes on the original SKI 9620 database.
Data Analwis for <strong>Piping</strong> Rclinbilih<br />
Markov model presented in Reference [3], a material flaw must develop in the piping before a<br />
leak or rupture can occur. Therefore, detection <strong>and</strong> repair of flaws will influence the likelihood<br />
of leak <strong>and</strong> rupture events. Non-destructive examinations (NDE) of piping are performed on a<br />
per weld or foot of pipe basis; therefore, it is appropriate to assess the influence of the inspection<br />
program on the pipe rupture frequency at the same elemental level. Another feature exhibited by<br />
these mechanisms is the strong "leak before break" characteristic demonstrated in the service<br />
experience data (i.e., the observed frequency of leak type failure modes is much greater than the<br />
rupture type failure mode).<br />
The pipe rupture frequencies for the degradation mechanisms discussed above are expressed in<br />
terms of the product of a pipe failure frequency <strong>and</strong> a conditional probability of pipe rupture<br />
given failure. The calculation of the rupture rate, therefore, requires estimates of the failure (i.e.,<br />
leak or rupture) frequency <strong>and</strong> the conditional probability of rupture given failure. This model,<br />
referred to as Model A in Table 2-2, has a number of benefits. The failure frequency that is<br />
calculated through the application of this model can be used to estimate the transition state from<br />
the flaw state to the leak state in the Markov model presented in Reference [3]. This model also<br />
takes advantage of the relative abundance of pipe leak events in the experience database, as<br />
compared to the number of rupture events. Rupture rates are calculated for each combination of<br />
reactor vendor, system group, <strong>and</strong> failure mechanism as discussed below. <strong>Failure</strong> events, which<br />
are well represented in the experience database (i.e., over 1,100 events), are collected for specific<br />
vendor <strong>and</strong> system group combinations to estimate the failure frequency for each failure<br />
mechanism. The conditional probability of rupture given failure is estimated based on the<br />
number of rupture <strong>and</strong> failure events grouped as discussed below. This assumes that the rupture<br />
given failure probability for a given degradation mechanism is not dependent on the vendor but<br />
the system.<br />
Table 2-2 provides a summary of the different models used to estimate failure rates in the <strong>EPRI</strong><br />
RI-IS1 program for each failure mechanism. The failure mechanisms are grouped into two<br />
classes. The degradation mechanisms share the characteristic of requiring the occurrence of a<br />
flaw prior to the occurrence of a leak or a rupture, <strong>and</strong> they are amenable to inservice inspection<br />
programs. The design <strong>and</strong> construction defects (D&C) failure mechanism was included in the<br />
degradation mechanism class due to similarities to other degradation mechanisms. The great<br />
majority of the D&C failure events in the database were attributed to weld flaws introduced<br />
through fabrication errors. Although these fabrication defects would not be specifically targeted<br />
by an inspection program, inspections for other degradation mechanisms provide the opportunity<br />
to detect the D&C flaws, thereby making D&C failures amenable to in-service inspection (ISI).
Data Analysis for <strong>Piping</strong> Reliabiliry<br />
Two additional failure mechanisms are listed in Table 2-2. Vibration fatigue (VF) failures are<br />
caused by loading conditions, <strong>and</strong> are not amenable to IS1 in the sense that inspection for flaws<br />
will not impact the leak or rupture rate. But VF does exhibit a strong "leak before break<br />
characteristic" in the failure events database. Therefore, Model A is used to estimate the rupture<br />
rate for VF in units of ruptures per system year. The unreported cause failure mechanism is by<br />
definition difficult to classify <strong>and</strong> has been included under failure mechanism class "Other."<br />
Both Model A <strong>and</strong> Model B use a Bayesian approach to estimate failure <strong>and</strong> rupture frequencies<br />
based on the prior state of knowledge <strong>and</strong> the evidence contained in the failure event database.<br />
This approach generates an uncertainty distribution for each of the rupture rates quantified. A<br />
summary of the data collection done to support the rupture rate calculations is presented in the<br />
section entitled Data Requirements <strong>and</strong> sources to support failure rate estimates.<br />
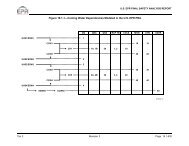
Time Dependent Pipe <strong>Failure</strong> <strong>Rates</strong><br />
Before failure rates <strong>and</strong> rupture rates were calculated, the events database was reviewed for the<br />
presence of time trends in the failure rates for each of the failure mechanisms. This was done<br />
because it was postulated that the behavior of one or more of the mechanisms might be<br />
correlated to the age of the plant.<br />
The pipe failure event database was reviewed to identify trends in event frequencies correlated to<br />
the length of time the plant had been in service. Figure 2-1 shows the distribution of all pipe<br />
failure events by year of operation. Year 1 of operation is assumed to begin with the initial<br />
criticality date of the plant. This initial view of the data clearly shows a reduced number of<br />
failures as the plant operating time increases, but this perception is skewed by the relative<br />
abundance of data for plants in the early years of operation. Figure 2-2 shows the number of<br />
plant years of experience in the database for each operating year. This chart shows the lack of<br />
experience for plants that have been operating for more than 20 to 25 years. For example, only<br />
1.7% (35 years) of the total experience base comes from plants operating 25 years or longer.<br />
Figure 2-3 presents the pipe failure rate per year, by year of plant operation. These failure rates<br />
are calculated as the number of failure events divided by the number of years of experience.<br />
Based on qualitative arguments, such as the effects of "break-in" periods on equipment<br />
reliability, <strong>and</strong> the apparent decrease in annual failure rates with increasing plants maturity as<br />
shown in Figure 2-3, a more detailed review of the failure event database was performed. Clear<br />
trends in the failure rates would justify partitioning the data <strong>and</strong> developing failure rates<br />
dependent on two or more ranges of operational years.
Data At~alwis for <strong>Piping</strong> Reliability<br />
The fraction of elements (i.e., welds <strong>and</strong> feet of pipe) susceptible to each degradation<br />
ntechanism for each system. <strong>Failure</strong> rates are calculated on a susceptible element basis.<br />
Therefore, in addition to the number of element years represented in the <strong>EPRI</strong> '97 database,<br />
the fraction of those elements susceptible to each degradation mechanism must be estimated.<br />
These susceptibility fractions were estimated as part of the <strong>EPRI</strong> RI-IS1 pilot application<br />
studies performed at Arkansas Nuclear One (ANO) [9] <strong>and</strong> James A. Fitzpatrick (JAF) [12]<br />
sites. The estimates from these pilot studies, along with expert opinion were the information<br />
sources used in this analysis. Susceptibility fractions for PWR plants based on the AN0 data,<br />
<strong>and</strong> those for BWR plants based on the JAF data, are presented in Appendix A, Table A-6.<br />
For both Models A <strong>and</strong> B, a Bayesian update procedure is used to include uncertainties<br />
associated with the available data sources in the resultant failure rates. The primary sources of<br />
uncertainty in this data are:<br />
Possible omissions of failure events, or incorrect <strong>and</strong> incomplete information in source<br />
reports such as the Licensee Event Reports or other reports used to develop the pipe failure<br />
database.<br />
Lack of precise estimates of the quantities of piping materials including lengths of pipe,<br />
numbers of welds in system groups for various plant types, <strong>and</strong> the fractions of these pipe<br />
elements that are susceptible to different damage mechanisms.<br />
Lack of precise recorded information on the amount of time different piping systems have<br />
spent in maintenance or in different plant operating modes.<br />
Statistical uncertainty due to the sparse data <strong>and</strong> the use of prior experience to predict the<br />
outcome of future periods of operation. It is assumed that the prior experience is<br />
representative of the population of all past <strong>and</strong> future pipe experience.<br />
Uncertainties introduced by modeling assumptions such as the constancy of failure rates<br />
during various time intervals of data collection.<br />
Uncertainties represented in the prior state of knowledge before service data from LWR<br />
experience were collected.<br />
Enhancements to the Methodology<br />
Several changes from the methodology presented in Reference 1 have been made to improve the<br />
results. One of the major changes to the analysis is the exclusion of piping less than two inches<br />
in diameter. <strong>Piping</strong> of this size is excluded from the analysis for several reasons. First, the major<br />
audience for this document is expected to be those performing inservice inspections, which are<br />
limited to large bore piping. Consequently, the addition of small bore piping data to the analyses<br />
provides unnecessary additional data which may, at worst, skew the results for the majority of<br />
the users who are concerned with inservice inspections of large bore piping. Secondly, because<br />
inservice inspections are not performed on small bore piping, there is no current failure<br />
mechanism specific susceptibility data for piping of this size. Without susceptibility data,<br />
conditional failure rates cannot be calculated with confidence. Thirdly, there is evidence that<br />
small bore piping does indeed behave differently than the larger piping. The database has nearly<br />
as many events for piping less than two inches in diameter as it has for all piping sizes greater
Data Ana(vsis for- <strong>Piping</strong> Reliability<br />
sufficient evidence to support separate analyses for E/C <strong>and</strong> SC. D&C remains separate because<br />
there is significantly more evidence than is found for either COR, E-C, or TF. VFI <strong>and</strong> VF2<br />
remain separate because they are dynamic loading mechanisms that have no place being grouped<br />
with degradation mechanisms.<br />
Grouping of the event data was also done with respect to the calculation of rupture rates for those<br />
failure mechanisms that employ Model B, where the rupture rate is calculated directly from the<br />
rupture events. These failure mechanisms include WHI, WH2, OVP, FP, DDL, HE, <strong>and</strong> UNR.<br />
For the Reactor Coolant <strong>and</strong> Safety Injection Recirculation system groups, no event grouping<br />
was done. For all other system groups, the events were divided into two groups, PWR events <strong>and</strong><br />
BWR events.<br />
Another change that was instituted is, again, based on the desire to avoid drawing conclusions<br />
based on the use of sparse amounts of data. CF has had no ruptures <strong>and</strong> only five failures in the<br />
entire service experience of U.S. nuclear plants. Because of this observation <strong>and</strong> the similarity<br />
CF has with TF, it was decided to merge the two mechanisms.<br />
It was also decided to divide D&C into two groups: D&C <strong>and</strong> dynamic design loads (DDL). The<br />
events classified as D&C are caused by weld fabrication flaws <strong>and</strong> behave as other degradation<br />
mechanisms. The DDL group represents a class of construction errors that present themselves<br />
like the other dynamic loading mechanisms (e.g. FP, OVP, or WH). The database evidence<br />
suggests the same: two rupture events out of six total failures. That is, the probability of rupture<br />
given failure is significantly higher than for the degradation mechanisms.<br />
A last change that was incorporated is the addition of a new generic prior for the conditional<br />
probability of rupture calculation. See Table 2-3. E-C, COR, SC, <strong>and</strong> TF use a prior beta<br />
distribution with a mean of 0.1. This particular beta distribution was chosen because of the<br />
sparseness of data. The use of the flat prior beta distribution (mean of 0.5) as used for WC, D&C,<br />
<strong>and</strong> VF would yield conditional probabilities of ruptures that are too conservative <strong>and</strong> that do not<br />
match our engineering underst<strong>and</strong>ing of the mechanisms. For the mechanisms WC, D&C, <strong>and</strong><br />
VF, the flat prior allows the evidence to shape the resultant distribution <strong>and</strong> not vice versa.
Data Analysis for <strong>Piping</strong> Reliabiliv<br />
Figure 2-6<br />
Bayesian Update: <strong>Failure</strong>s per Susceptible Weld Year Based on Lower Bound Estimate for<br />
Population Data
Data Analysis for <strong>Piping</strong> Rcliabili~<br />
Figure 2-7<br />
Bayesian Update: <strong>Failure</strong>s per Susceptible Weld Year Based on Best Estimate for<br />
Population Data
Dam A~ialysis for <strong>Piping</strong> Reliabiliq<br />
Figure 2-8<br />
Bayesian Update: <strong>Failure</strong>s per Susceptible Weld Year Based on Upper Bound Estimate for<br />
Population<br />
Figure 2-9<br />
Sample <strong>Failure</strong> Frequency Distribution for Thermal Fatigue
This Monte Carlo merge technique is used in the failure frequency development for all failure<br />
mechanisms that are calculated on a susceptible weld or foot of pipe basis.<br />
For those rupture frequencies calculated via Model A, the failure frequency must be multiplied<br />
by the conditional probability of rupture given failure to obtain the rupture frequency.<br />
Model A: Rupture Given <strong>Failure</strong> Probability Calculation<br />
The rupture given failure probability for a specific failure mechanism, in the case of this example<br />
thermal fatigue for a RCS of a CE plant, is also calculated using Bayesian analysis. The prior<br />
distribution used for COR, E-C, SC, <strong>and</strong> TF failure mechanisms is a non-informative Beta<br />
distribution with parameters A equal to one <strong>and</strong> B equal to nine. This is a distribution ranging<br />
from 0.0 to 1.0 with a mean value of 0.1. The evidence from the failure events database needed<br />
to perform the update can be found in Table 2-5, the summary of failure events for all vendors<br />
(add together the failures for RCS <strong>and</strong> SIR for mechanisms COR, E-C, <strong>and</strong> TF). For thermal<br />
fatigue, the database contained eight failures of which none are classified as a rupture event.<br />
The Beta distribution is a conjugate function; therefore, the parameters A <strong>and</strong> B of the updated<br />
distribution can be calculated directly based on the evidence via the following equations:<br />
A (posterior) = A (prior) + (# of Rupture Events)<br />
B (posterior) = B (prior) + (# of <strong>Failure</strong> Events) - (# of Rupture Events)<br />
Therefore, the posterior distribution, representing the conditional probability of rupture given<br />
failure for the thermal fatigue failure mechanism, is represented by a Beta distribution with<br />
parameters A <strong>and</strong> B equal to 1 <strong>and</strong> 17, respectively. The BARFM software tool can be used to<br />
show the prior distribution <strong>and</strong> the resultant rupture given failure distribution. This result is<br />
presented in Figure 2- 10.<br />
Model A: Rupture Frequency Calculation<br />
The frequency of rupture per year for welds susceptible to thermal fatigue in CE RCS, is<br />
calculated as the product of the failure frequency distribution (Figure 2-9) <strong>and</strong> the probability of<br />
rupture given failure distribution (Figure 2-10). This product is calculated using the Crystal Ball<br />
software. The failure frequency is input as a lognormal distribution, preserving the mean value<br />
<strong>and</strong> the ratio of the 95 percentile <strong>and</strong> the 50 percentile. The rupture given failure probability is<br />
input as a Beta distribution with parameters A <strong>and</strong> B calculated as described in the previous<br />
section. The resultant distribution for the rupture frequency due to TF in CE RCS is presented in<br />
Figure 2- 1 1.
Data Analysis for <strong>Piping</strong> Rcliabiliv<br />
Figure 2-10<br />
Bayesian Update: Thermal Fatigue Rupture Given <strong>Failure</strong> Probability<br />
Figure 2-1 1<br />
Sample Rupture Frequency Distribution for Thermal Fatigue
Data Analysis for- <strong>Piping</strong> Reliability<br />
event data identified a trend in the occurrence of water hammer failure events that warranted the<br />
separation of the events into two categories. Category WHl represents water hammer failures<br />
that occurred in the time period from one year prior to the plant's initial criticality, to three years<br />
following initial criticality. Category WH2 represents the period of operation including the<br />
fourth year of operation following initial criticality <strong>and</strong> beyond. For this example, the rupture<br />
rate is calculated for category WH2. Table A-4 in Appendix A shows that there was one water<br />
hammer (category WH2) rupture event in an AUXC system of a GE plant. The number of<br />
system years in the <strong>EPRI</strong> '97 database associated with AUXC systems of GE plants can be<br />
determined from Tables 2-6 <strong>and</strong> 2-7. Table 2-6 indicates that the database contains 607 GE plant<br />
years of data, for years of operation four <strong>and</strong> older. To determine the total system years of data,<br />
the number of plant years must be multiplied by the number of systems or sub-systems contained<br />
in <strong>System</strong> Group AUXC. Table 2-7 lists the assumed number of systems contained in each<br />
system group. <strong>System</strong> Group AUXC is assumed to represent a single system, therefore, the total<br />
system years is equal to the years of plant operating experience (i.e., 607 years). Given the prior<br />
distribution for ruptures per system year <strong>and</strong> the experience of I rupture in 607 years, the update<br />
can be performed to calculate the water hammer (WH2) rupture frequency per system year for<br />
GE AUXC systems. Figure 2- 13 presents the results of this Bayesian update.<br />
Figure 2-13<br />
Model B Sample Result: Ruptures per <strong>System</strong> Year
REFERENCES<br />
1. Bush, S. H., et al. <strong>Piping</strong> <strong>Failure</strong>s in the United States Nuclear Power Plants: 1961-1995, SKI<br />
Report 96:20, January, 1996.<br />
2. Gosselin, Stephen R. <strong>and</strong> Karl N. Fleming. Evaluation of Pipe <strong>Failure</strong> Potential Via<br />
Degradation Mechanism Assessment, Proceedings of ICONE 5,5th International Conference<br />
on Nuclear Engineering, May 26-30, 1997, Nice, France.<br />
3. <strong>Piping</strong> <strong>System</strong> Reliability <strong>and</strong> <strong>Failure</strong> Rate Estimation Models for Use in Risk-Informed In-<br />
Service Inspection Applications, <strong>EPRI</strong> <strong>TR</strong>-110161, Palo Alto, CA, 1998.<br />
4. Thomas, H. M. Pipe <strong>and</strong> Vessel <strong>Failure</strong> Probability, Reliability Engineering, Vol. 2, 1981 pp.<br />
83-124.<br />
5. <strong>Piping</strong> <strong>Failure</strong>s in U.S. Commercial Nuclear Power Plants, <strong>EPRI</strong> Report <strong>TR</strong>-102266, Palo<br />
Alto, CA, 1993.<br />
6. <strong>Piping</strong> <strong>Failure</strong>s in U.S. Commercial Nuclear Power Plants, <strong>EPRI</strong> Interim Report <strong>TR</strong>-100380,<br />
Palo Alto, CA, 1992.<br />
7. Fleming, et al. Independent Review <strong>EPRI</strong> Risk Informed In-Service Inspection Procedure,"<br />
published by ERIN Engineering <strong>and</strong> Research, Inc. for <strong>EPRI</strong>, July, 1996.<br />
8. Risk-Informed Inservice Inspection Evaluation Procedures, <strong>EPRI</strong> <strong>TR</strong>-106706, Palo Alto, CA,<br />
1996.<br />
9. Application of <strong>EPRI</strong> Risk-Informed Inservice Inspection Guidelines to CE Plants,, <strong>EPRI</strong> <strong>TR</strong>-<br />
10753 1-Vl, Palo Alto, CA, 1997.<br />
10. Water Hammer Prevention, Mitigation, <strong>and</strong> Accommodation - Volume 1: Plant Water<br />
Hammer Experience, <strong>EPRI</strong> <strong>NP</strong>-6766, Palo Alto, CA, 1992.<br />
11. Wright, R. E., et al. Pipe Break Frequency Estimation for Nuclear Power Plants,<br />
NUREGICR-4407, EG&G Idaho, Inc., May, 1987.<br />
12. Application of <strong>EPRI</strong> Risk-Informed Inservice Inspection Evaluation Procedure, <strong>EPRI</strong><br />
<strong>TR</strong>-107530-V1, Palo Alto, CA, 1997.
PIPE FAILURE RATE DIS<strong>TR</strong>IBUTIONS<br />
Section 2 of this report documents the calculation of the piping reliability failure rates <strong>and</strong> the<br />
mean value results of the calculations are presented in this appendix. Associated with each mean<br />
value is an underlying probability distribution. This appendix also provides the parameters<br />
associated with each of the resultant probability distributions.<br />
The evidence of leaks <strong>and</strong> ruptures for each system by reactor vendor is presented in Tables A- 1<br />
through A-4, one for each vendor. This is the information used to support the failure rate <strong>and</strong><br />
conditional probability of rupture given failure (for Model A) calculations. It is also used for the<br />
direct rupture rate calculations used in Model B.<br />
Table A-5 presents the best estimate weld count <strong>and</strong> piping feet count per system. These values<br />
are used in developing "success" data to support the Bayesian updates for failure rates.<br />
The susceptibility fractions for welds <strong>and</strong> pipe feet for each of the failure mechanisms is found in<br />
Tables A-6 <strong>and</strong> A-7. Table A-6 is the set of values for pressurized water reactors, <strong>and</strong> Table A-7<br />
is for boiling water reactors. These values are used to develop failure rates that are conditioned<br />
on the suspected presence of the failure mechanism. The conditional pipe failure rates, that make<br />
use of the susceptibility fractions, are found in Tables A-8 through A- 1 1. These tables are<br />
specific to each vendor type: Combustion Engineering, Westinghouse, Babcock <strong>and</strong> Wilcox, <strong>and</strong><br />
General Electric.<br />
Similarly, Tables A- 12 through A- 15 are the unconditional pipe failure rates for each of the four<br />
reactor vendors: Combustion Engineering, Westinghouse, Babcock <strong>and</strong> Wilcox, <strong>and</strong> General<br />
Electric, respectively. The unconditional pipe failures are not preconditioned on the suspected<br />
presence of the failure mechanism. The susceptibility fractions are not used in the calculations.<br />
The unconditional pipe rupture rates are presented in Tables A-16 through A-19. Again, the four<br />
tables correspond to each of the reactor vendors: Combustion Engineering, Westinghouse,<br />
Babcock <strong>and</strong> Wilcox, <strong>and</strong> General Electric. The unconditional pipe rupture rates are not<br />
conditioned upon the number of welds or systems modeled in the system group.<br />
Tables A-20 through A-5 1 present the pipe failure rate distributions quantified to support the<br />
<strong>EPRI</strong> RI-IS1 program. Each table presents the failure rate distributions associated with a specific<br />
vendor <strong>and</strong> system group combination. For example, Table A-20 presents the results for Reactor<br />
Coolant <strong>System</strong> Group (RCS) of Combustion Engineering plants. Each of these 32 tables are<br />
very similar in format, <strong>and</strong> this general format is discussed in the following paragraphs.
Pipe Fcrilure Rare Distributiorts<br />
Tables A-20 through A-27 present the piping reliability distributions for Combustion<br />
Engineering plants, one table for each system group. Tables A-28 through A-35 are applicable to<br />
Westinghouse plants, Tables A-36 through A-43 are for Babcock <strong>and</strong> Wilcox plants, <strong>and</strong> Tables<br />
A-44 through A-5 1 provide the failure frequency distributions for General Electric plants.<br />
Pipe rupture distributions are presented for each of the 13 failure mechanisms identified in<br />
Section 2. Section 2 presents two models, Model A <strong>and</strong> Model B, for calculating the pipe rupture<br />
rates dependent on the failure mechanism. Model A calculates the rupture rate as a function of<br />
the failure frequency <strong>and</strong> the rupture given failure probability. Uncertainty parameters are<br />
presented for the failure frequency <strong>and</strong> the probability of rupture given failure, as well as for the<br />
resultant rupture frequency for failure mechanisms that employ Model A.<br />
The units of the failure rates are also dependent on the failure mechanism. Frequency units of per<br />
susceptible weld year or per susceptible pipe foot year are, as indicated, conditional on the<br />
susceptibility of the piping element to the failure mechanism. Those failure rates presented in<br />
units of per system year are not conditioned on the presence of the associated damage<br />
mechanism.<br />
The uncertainty results (i.e., mean value, 5', 50' <strong>and</strong> 95" percentiles) presented for the failure<br />
<strong>and</strong> rupture frequencies were calculated as described in Section 2. Log-normal distribution<br />
parameters (mean <strong>and</strong> range factor) are provided for each of the failure <strong>and</strong> rupture distributions.<br />
The log-normal function, with the parameters supplied, provide a reasonable approximation to<br />
the results of the uncertainty analysis. The mean value <strong>and</strong> the ratio of the 95h <strong>and</strong> 50' percentile<br />
are preserved by the log-normal distribution defined for each failure frequency.<br />
The rupture given failure probabilities are calculated as the result of a Bayesian update, where<br />
the prior distribution is assumed to be a Beta distribution. The Beta distribution is a conjugate<br />
function, where the Bayesian update of a Beta prior distribution produces a Beta posterior<br />
distribution. Therefore, the Beta parameters provided in Tables A-20 through A-5 1 can be used<br />
to directly reproduce the uncertainty results for the corresponding rupture given failure<br />
probabilities.<br />
In summary, the following definitions should be considered when reviewing or making use of<br />
the tables presented in this appendix:<br />
Leaks are defined as the passage of fluid through a flaw in a pipe or weld with a flow rate<br />
less than 50 gpm.<br />
A rupture is a leak with a flow rate greater than 50 gpm.<br />
0 A failure is a leak or a rupture.<br />
<strong>System</strong> group definitions can be found in Table 2-1.<br />
<strong>Failure</strong> rates <strong>and</strong> rupture rates for mechanisms VFl <strong>and</strong> WHl are based on data within three<br />
years of initial criticality. Hence, these values should be used by plants with less than three<br />
years of operating experience.
Bayesian Analysis Reliabilih Tool<br />
where<br />
P(x~E,E,) I Probability of x being the true value of an unknown quantity in light of the new<br />
evidence E <strong>and</strong> the prior body of knowledge E,<br />
L(Elx. E,) = likelihood of observing the new evidence E, assuming that the true value of the<br />
unknown quantity is x<br />
P(xlE,) = probability of x being the true value of the unkown quantity based on the state of<br />
knowledge, E,, available prior to receiving the evidence E<br />
Finally, the coefficient of equation B. 1 is the normalizing factor required to ensure the<br />
probability sums to 1 .O:<br />
Bayes* Theorem is directly applicable to the process of developing application specific data. In<br />
an engineering sense, the initial state of knowledge captured by the generic prior, is the expected<br />
performance of the component as viewed from the perspective of the industry. The generic prior<br />
is an opinion (i.e., engineering judgment) of the performance of the component in question<br />
without the prejudice of the application specific information. It is important to reinforce this<br />
point: the development of the generic prior is not to be polluted by the evidence gathered to<br />
perform the update. If the evidence taints the development of the prior, then the evidence will<br />
reinforce the evidence, overemphasizing <strong>and</strong> unnaturally reinforcing the data. Bayesian updating<br />
is then a quantitative customization of the generic value to make it useful to a specific<br />
application.<br />
Application of Bayes' Theorem in BARFM<br />
BARFM allows the user to update generic prior probability distributions with new evidence,<br />
generating an updated, application specific, posterior distribution. BARFM can generate a report<br />
that includes a graphical display of both the prior <strong>and</strong> posterior probability distributions, as well<br />
as a summary of the input data, <strong>and</strong> key parameters of the posterior distribution. The prior <strong>and</strong><br />
posterior distributions are also available in tabular format. This section discusses how BARTM<br />
performs these functions by making use of Bayes' Theorem.<br />
For the time based <strong>and</strong> dem<strong>and</strong> based Bayes analyses, the user provides a prior distribution in the<br />
form of a lognormal distribution, as well as two values representing the evidence. Other forms of<br />
prior distributions are not supported except for beta distributions. The Beta Distribution module<br />
must be used to process prior distributions that are in the form of a beta distribution. The<br />
following steps are then performed by BARFM after the required input has been supplied.<br />
1. Assume input (prior) distribution is lognormal for time based <strong>and</strong> dem<strong>and</strong> based calculations<br />
or assume a beta distribution for the beta distribution update.
Baycsion Annlwis Reliability Tool<br />
2. Determine the endpoints of the prior: values corresponding to the cumulative probability of<br />
I .OE-6 ( 1 -9.99999E- 1 ) to 9.99999E- 1 for a lognormal or beta distribution.<br />
3. Discretize the distribution over this range by evaluating 100 point per decade. This step<br />
ensures that distributions with long tails get adequate representation.<br />
4. Determine the cumulative probability between each point calculated in 3).<br />
5. Determine the likelihood of the each point 4) in light of the evidence provided as input. The<br />
binomial likelihood function is used for dem<strong>and</strong> based failure rate calculations <strong>and</strong> the<br />
Poisson likelihood function is used for r<strong>and</strong>om (time) based failures. The beta distribution<br />
update does not make use of a likelihood function.<br />
6. Take the product of 4) <strong>and</strong> 5) point by point (cell by cell).<br />
7. Normalize 6) from the sum of the results from 4).<br />
8. Correct each value in 6) by the normalization factor from 7). This step is essential because<br />
we are not integrating over the entire curve, so the total probability from 3) does not sum to<br />
1 .o.<br />
9. Calculate the statistics.<br />
Software Use<br />
BARTM consists of five Microsoft EXCEL spreadsheet files. To use BARTM, the user must<br />
open the file BART.XLS using EXCEL. The screen presented in Figure B- 1 appears when<br />
BARFM is first started. The opening screen has a choice of seven buttons representing the four<br />
Bayesian analysis options, as well as three batch processing options available to the user. The<br />
various options are described in the following paragraphs.
Bayesian Analysis Reliabilih Tool<br />
Figure 8-3<br />
Time Based Frequency Calculation Report Preview<br />
There are several other buttons on this input sheet. The second button after the Calculate button<br />
is the Print Bayes Update Report. This button sends the calculation report to the printer. The<br />
Calculate button must be depressed before the report can be sent to the printer. Occasionally, the<br />
user may like to customize the axes of the BARFM output graph. By clicking on Format X-Axis<br />
or Format Y-Axis, either or both of the scales <strong>and</strong> titles can be changed. If selected, the user is<br />
prompted to enter a new minimum value, maximum value, <strong>and</strong> title. None of the values are<br />
required, <strong>and</strong> the user can quit at any time.<br />
The last button is Save Results to Database. Once selected, the key attributes of the resultant<br />
distribution are sent to a file called Database.xls. The purpose of the database is to provide an<br />
easy interface with CAFTA, <strong>and</strong> as a means to store results as the users data is systematically<br />
processed by BARFM. The BARFM database is depicted in Table B- 1. The mean <strong>and</strong> error<br />
factor for lognormal results are entered in columns called Rate <strong>and</strong> Pm2 (EF), respectively. If<br />
the Bayes result is a Beta distribution, then the Parm (EF) column is filled in with an N/A.<br />
Variable name, units, description, <strong>and</strong> data source are extracted from the BARTM input screen.<br />
The type of distribution is captured in the Dist column, where an " M denotes a lognormal<br />
distribution. Columns Common <strong>and</strong> Parml are currently not used. Lastly, column QA date <strong>and</strong><br />
time stamps the addition of the new variable to the database.
-<br />
Bayesian Analysis Reliabilie Tool<br />
Figure 6-5<br />
Dem<strong>and</strong> Based Frequency Calculation Report Preview<br />
Note: because BARTM uses the EXCEL binomial function, the range of input parameters that<br />
BARFM can process is limited by EXCEL.<br />
The Dem<strong>and</strong> Based <strong>Failure</strong> <strong>Rates</strong> <strong>and</strong> Frequencies input screen contains the same buttons as<br />
those described in Time Based <strong>Failure</strong> <strong>Rates</strong> <strong>and</strong> Frequencies.<br />
Common Cause Beta Factor. This option is specialized to the update of common cause failure<br />
beta parameters used in the Multiple Greek Letter (MGL) methodology. Although the MGL<br />
methodology can employ parameters beyond the beta factor (i.e., gamma, delta, epsilon, etc.) this<br />
feature in BARFM targets the beta factor. The beta factor is also considered the most important<br />
of the MGL factors. The savvy BARFM user can tackle other MGL factors, but it is not<br />
considered a fundamental feature in BARTM. Figure B-6 shows the initial screen for Common<br />
Cause Beta Factor module.
Bayesian Analysis Reliabilip Tool<br />
The input screen is divided into basically three parts. The top part includes options for saving<br />
results, canceling, calculating, <strong>and</strong> opening the screen for inputting data for calculations six<br />
through ten. The center part of the screen is where the input data is entered including fields for:<br />
variable name, description, units, mean <strong>and</strong> range factor (or error factor) of the prior, <strong>and</strong> failure<br />
<strong>and</strong> dem<strong>and</strong> evidence. The only required data is the variable name (if the results are to be saved),<br />
mean, range factor, failures <strong>and</strong> dem<strong>and</strong>s. This same nomenclature (i.e., failures <strong>and</strong> dem<strong>and</strong>s) is<br />
used for both time based <strong>and</strong> dem<strong>and</strong> based calculations. At this time, BARTTM can only<br />
accommodate lognormal prior distributions described by a mean <strong>and</strong> a range factor. The lower<br />
part of the screen is where BARTM fills in the results of the calculations. BARFM provides the<br />
51h, 5oth, <strong>and</strong> 95Lh percentiles of the resultant distribution.<br />
If the "Save Results" button is chosen, BARTM will save the results of the calculation to a<br />
separate EXCEL file with name provided as the variable name. A variable name is required, <strong>and</strong><br />
a calculation must have been performed in order to save the correct results.<br />
Method 2<br />
The second method of performing batch Bayesian analyses is to choose the "Process File"<br />
option. In this option, the user provides all of the necessary information in a file with a specific<br />
structure. With this option, the number of calculations the user is limited to is simply the number<br />
of rows in an EXCEL spreadsheet minus two rows for column headings: 16382. Table B-1<br />
shows the structure necessary in a user supplied input file. The column headings are not used by<br />
BARTM, but BARTM expects the associated information in each of the columns. In addition,<br />
BARTM automatically ignores the first two rows <strong>and</strong> begins processing on the third row.<br />
Calculations are performed from the third row <strong>and</strong> down.<br />
When the "Process File" option is selected, BARTM asks whether the input file is already open.<br />
If the user selects the radio button corresponding to Yes, BARTM then prompts the user to<br />
indicate how many calculations are to be performed. This window is shown in Figure B-10.
Bnysiarl A~lalwis Reliability Tool<br />
References<br />
1. B 1 . Martz, H., <strong>and</strong> R. A. Waller. Bayesian Reliability Analysis, John Wiley & Sons, 1982.<br />
2. B2. Tribus, M. Rational Descriptions Decisions <strong>and</strong> Designs, Pergamon Press, 1969.<br />
3. B.3 F. M. Marshall <strong>and</strong> D. M. Rasmuson, Common-Cause <strong>Failure</strong> Data Collection <strong>and</strong><br />
Analysis <strong>System</strong> Volume 6 - Common-Cause <strong>Failure</strong> Parameter Estimations, INEL-94/0064,<br />
December 1 995.
Target:<br />
Nuclear Power<br />
About EPRl<br />
EPRl creates science <strong>and</strong> technology solutions for<br />
the global energy <strong>and</strong> energy services industry. U.S.<br />
electric utilities established the Electric Power<br />
Research lnstitute in 1973 as a nonprofit research<br />
consortium for the benefit of utility members, their<br />
customers, <strong>and</strong> society. Now known simply as <strong>EPRI</strong>,<br />
the company provides a wide range of innovative<br />
products <strong>and</strong> services to more than I000 energyrelated<br />
organizations in 40 countries. EPRl's<br />
multidisciplinary team of scientists <strong>and</strong> engineers<br />
draws on a worldwide network of technical <strong>and</strong><br />
business expertise to help solve today's toughest<br />
energy <strong>and</strong> environmental problems.<br />
<strong>EPRI</strong>. Powering Progress<br />
O 2000 Electr~c Power Research Institute (<strong>EPRI</strong>). lnc.All righa<br />
reserved. Electr~c Power Research lnstitute <strong>and</strong> EPRl are registered<br />
servlce marks of the Electric Power Research Institute. lnc.<br />
<strong>EPRI</strong>. POWERING PROGRESS is a service mark of the Electr~c<br />
Power Research Institute, Inc.<br />
@ Pnnted on recycled paper In the United Stores ofAmerrco<br />
EPRl 34 12 Hillview Avenue. Palo Alto. California 94304 . PO Box 104 12, Palo Alto, California 94303 USA<br />
800.3 13.3774 . 6SO.8SS.2 12 1 . askepri@epri.com . www.epri.com