Determination of Water Vapor Transmission Rate for High ... - PQRI
Determination of Water Vapor Transmission Rate for High ... - PQRI
Determination of Water Vapor Transmission Rate for High ... - PQRI

Create successful ePaper yourself
Turn your PDF publications into a flip-book with our unique Google optimized e-Paper software.
<strong>Determination</strong> <strong>of</strong> <strong>Water</strong> <strong>Vapor</strong> <strong>Transmission</strong> <strong>Rate</strong> <strong>for</strong> <strong>High</strong><br />
Density Polyethylene Screw-cap Bottles<br />
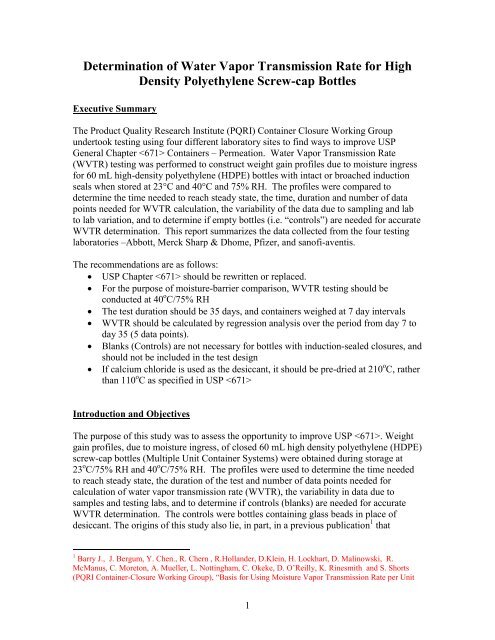
Executive Summary<br />
The Product Quality Research Institute (<strong>PQRI</strong>) Container Closure Working Group<br />
undertook testing using four different laboratory sites to find ways to improve USP<br />
General Chapter Containers – Permeation. <strong>Water</strong> <strong>Vapor</strong> <strong>Transmission</strong> <strong>Rate</strong><br />
(WVTR) testing was per<strong>for</strong>med to construct weight gain pr<strong>of</strong>iles due to moisture ingress<br />
<strong>for</strong> 60 mL high-density polyethylene (HDPE) bottles with intact or broached induction<br />
seals when stored at 23°C and 40°C and 75% RH. The pr<strong>of</strong>iles were compared to<br />
determine the time needed to reach steady state, the time, duration and number <strong>of</strong> data<br />
points needed <strong>for</strong> WVTR calculation, the variability <strong>of</strong> the data due to sampling and lab<br />
to lab variation, and to determine if empty bottles (i.e. “controls”) are needed <strong>for</strong> accurate<br />
WVTR determination. This report summarizes the data collected from the four testing<br />
laboratories –Abbott, Merck Sharp & Dhome, Pfizer, and san<strong>of</strong>i-aventis.<br />
The recommendations are as follows:<br />
USP Chapter should be rewritten or replaced.<br />
For the purpose <strong>of</strong> moisture-barrier comparison, WVTR testing should be<br />
conducted at 40 o C/75% RH<br />
The test duration should be 35 days, and containers weighed at 7 day intervals<br />
WVTR should be calculated by regression analysis over the period from day 7 to<br />
day 35 (5 data points).<br />
Blanks (Controls) are not necessary <strong>for</strong> bottles with induction-sealed closures, and<br />
should not be included in the test design<br />
If calcium chloride is used as the desiccant, it should be pre-dried at 210 o C, rather<br />
than 110 o C as specified in USP <br />
Introduction and Objectives<br />
The purpose <strong>of</strong> this study was to assess the opportunity to improve USP . Weight<br />
gain pr<strong>of</strong>iles, due to moisture ingress, <strong>of</strong> closed 60 mL high density polyethylene (HDPE)<br />
screw-cap bottles (Multiple Unit Container Systems) were obtained during storage at<br />
23 o C/75% RH and 40 o C/75% RH. The pr<strong>of</strong>iles were used to determine the time needed<br />
to reach steady state, the duration <strong>of</strong> the test and number <strong>of</strong> data points needed <strong>for</strong><br />
calculation <strong>of</strong> water vapor transmission rate (WVTR), the variability in data due to<br />
samples and testing labs, and to determine if controls (blanks) are needed <strong>for</strong> accurate<br />
WVTR determination. The controls were bottles containing glass beads in place <strong>of</strong><br />
desiccant. The origins <strong>of</strong> this study also lie, in part, in a previous publication 1 that<br />
1 Barry J., J. Bergum, Y. Chen., R. Chern , R.Hollander, D.Klein, H. Lockhart, D. Malinowski, R.<br />
McManus, C. Moreton, A. Mueller, L. Nottingham, C. Okeke, D. O’Reilly, K. Rinesmith and S. Shorts<br />
(<strong>PQRI</strong> Container-Closure Working Group), “Basis <strong>for</strong> Using Moisture <strong>Vapor</strong> <strong>Transmission</strong> <strong>Rate</strong> per Unit<br />
1
provided a theoretical basis <strong>for</strong> using WVTR per unit dose as a means to compare<br />
different container-closure systems.<br />
Materials and Methods<br />
The bottles used were 60mL HDPE with 28mm double lead semi interrupted threads.<br />
The HDPE resin was Phillips Marlex 5502 BN. The bottles were manufactured by<br />
Rexam. The closures used were 28mm diameter polypropylene (PP) with Squeeze and<br />
Turn child-resistant feature. The PP resin was Phillips-Sumika HLN 120-01. The closures<br />
were manufactured by Rexam. The cap liners were supplied by Selig with FS 1-7 innerseal<br />
and C25P liner. The materials <strong>of</strong> construction <strong>for</strong> the inner-seal and liner were<br />
0.0015” medium density polyethylene (MDPE)/0.001” Al foil/Heat Tac Wax/0.005”<br />
Paper/0.030” Polyolefin Foam.<br />
The bottles were uniquely identified, then filled with an appropriate amount <strong>of</strong> anhydrous<br />
calcium chloride desiccant and induction-sealed in accordance with USP . See<br />
Appendix A <strong>for</strong> details about selection <strong>of</strong> desiccant. The containers were all filled and<br />
sealed at the same time at one site (Pfizer). For details <strong>of</strong> sample preparation, see the<br />
protocol in Appendix B. The seals <strong>of</strong> a designated number <strong>of</strong> these bottles were then<br />
broached and the bottles re-capped according to the procedure prescribed in USP .<br />
On receipt at the testing laboratory, the seals <strong>of</strong> a designated number <strong>of</strong> these bottles were<br />
then broached and the bottles re-capped according to the procedure prescribed in USP<br />
. The broached seals were prepared as follows: The cap <strong>of</strong> the induction sealed<br />
bottle was removed, and the seal was cut around the inner circumference <strong>of</strong> the mouth<br />
with a sharp razor blade. The cut-out material was removed, taking care to leave a flat,<br />
unbroken area <strong>of</strong> inner-seal on the land <strong>of</strong> the bottle finish. The caps were then reapplied<br />
to the bottles in accordance with the procedure in USP . The details <strong>of</strong> the<br />
broaching procedure are given in Appendix C.<br />
Subsequently, both the intact and broached bottles were stored in environmental<br />
chambers controlled at 40±2°C/75±5%RH or 23±2°C/75±3%RH at the four sites:<br />
Abbott (AB), Merck Sharp & Dhome (MK), Pfizer (PF) and san<strong>of</strong>i-aventis (SA).<br />
A testing protocol was developed that required each laboratory to per<strong>for</strong>m WVTR tests as<br />
follows:<br />
1) 15 Broached bottles with desiccant, 10 control samples without desiccant stored at<br />
40±2°C/75±5%RH and weighed at 7 day intervals <strong>for</strong> 49 days.<br />
2) 15 Broached bottles with desiccant, 10 control samples without desiccant stored at<br />
23±2°C/75±3%RH and weighed at 7 day intervals <strong>for</strong> 49 days.<br />
Product in the Evaluation <strong>of</strong> Moisture-Barrier Equivalence <strong>of</strong> Primary Packages <strong>for</strong> Solid Oral Dosage<br />
Forms”, Pharmacopeial Forum (2005) 31(1) Jan-Feb, 226-269<br />
2
3) 15 Intact bottles with desiccant, 10 control samples without desiccant stored at<br />
40±2°C/75±5%RH and weighed at 14 day intervals <strong>for</strong> 98 days.<br />
4) 15 Intact bottles with desiccant, 10 control samples without desiccant stored at<br />
23±2°C/75±3%RH and weighed at 14 day intervals <strong>for</strong> 98 days.<br />
The weight gain <strong>of</strong> each sample was measured and recorded according to the procedure<br />
given in the protocol. The average rate <strong>of</strong> water vapor permeation (WVTR) in mg per<br />
day per bottle was calculated according to the protocol.<br />
Results/Discussion<br />
Weight Gain Pr<strong>of</strong>iles<br />
Figures 1 and 2 show the mean weight gain (mg/bottle) pr<strong>of</strong>ile (average <strong>of</strong> 15 bottles<br />
with desiccant, or 10 control bottles) <strong>for</strong> broached bottles over the testing period <strong>for</strong> each<br />
laboratory. As can be seen in the pr<strong>of</strong>ile plots, there is no apparent induction period, and<br />
the weight gain pr<strong>of</strong>iles are linear over the testing interval. The broached bottles<br />
containing desiccant showed an increase in weight over time, with a higher rate <strong>for</strong> the<br />
higher temperature condition, which was expected. The controls show very little change<br />
over time.<br />
Broached with Desiccant<br />
Figure 1<br />
40 o C/75%RH<br />
3
Figure 2<br />
25 o C/75%RH<br />
Figures 3 and 4 show the mean weight gain (mg/bottle) pr<strong>of</strong>ile (average <strong>of</strong> 15 bottles<br />
with desiccant or 10 control bottles) <strong>for</strong> intact bottles over the testing period <strong>for</strong> each lab.<br />
As can be seen in the pr<strong>of</strong>ile plots, there is no apparent induction period and the weight<br />
gain pr<strong>of</strong>iles are linear over the testing interval. The intact bottles containing desiccant<br />
show an increase in weight over time at the higher temperature, but very little increase at<br />
the lower temperature. The controls show very little change over time.<br />
4
Intact with Desiccant<br />
Figure 3<br />
40 o C/75%RH<br />
Figure 4<br />
25 o C/75%RH<br />
Slopes compared <strong>for</strong> value and variability<br />
A linear regression was fitted to the results <strong>for</strong> each container. The slopes (WVTR’s) are<br />
plotted in Figures 5 and 6 <strong>for</strong> broached and intact bottles, respectively. The four labs<br />
show similar patterns within each temperature. . The containers having intact seals have<br />
smaller slopes and less variation than those having broached seals. Slopes <strong>for</strong> broached<br />
5
and intact seals are plotted to the same scale in Figure 7, emphasizing the difference in<br />
variability between broached and intact seals.<br />
Figure 5<br />
Slopes (mg/day)<br />
Broached<br />
15<br />
Slope, mg/day<br />
10<br />
5<br />
0<br />
Broached -<br />
23C/75%RH - AB<br />
Broached -<br />
23C/75%RH - MK<br />
Broached -<br />
23C/75%RH - Pf<br />
Broached -<br />
23C/75%RH - SA<br />
Broached -<br />
40C/75%RH - AB<br />
Broached -<br />
40C/75%RH - MK<br />
Broached -<br />
40C/75%RH - Pf<br />
Broached -<br />
40C/75%RH - SA<br />
Seal/Conditions/Site<br />
6
Figure 6<br />
Slopes (mg/day)<br />
Intact<br />
1.5<br />
Slope, mg/day<br />
1<br />
0.5<br />
0<br />
Intact - 23C/<br />
75%RH - AB<br />
Intact - 23C/<br />
75%RH - MK<br />
Intact - 23C/<br />
75%RH - Pf<br />
Intact - 23C/<br />
75%RH - SA<br />
Intact - 40C/<br />
75%RH - AB<br />
Intact - 40C/<br />
75%RH - MK<br />
Intact - 40C/<br />
75%RH - Pf<br />
Intact - 40C/<br />
75%RH - SA<br />
Seal/Conditions/Site<br />
7
Figure 7<br />
Slopes (mg/day)<br />
Broached and Intact<br />
Slope Summary<br />
Tables 1 and 2 summarize the slopes <strong>for</strong> the broached and intact bottles. Included in<br />
these tables is the number <strong>of</strong> containers (N) in the analysis and the minimum and<br />
maximum slope across the N containers. The mean, standard deviation, and RSD<br />
(relative standard deviation) can be used to evaluate differences between sites as well as<br />
variability <strong>of</strong> the slopes. The p-value indicates whether or not the slope is significantly<br />
different from zero, i.e. a statistically significant result (p < 0.05) indicates that the slope<br />
was significantly different from zero. All slopes were significantly different from zero<br />
except one (controls at Pf at the higher temperature condition).<br />
For the broached bottles (Table 1), note that the mean rate at 40/75 is similar across all<br />
laboratories (about 7 to 9.5 mg/day). The variability <strong>of</strong> the rates is much less at the lower<br />
temperature with respect to standard deviation but about the same with respect to RSD.<br />
See discussion <strong>of</strong> outliers below. Adjusting <strong>for</strong> the controls has little effect on the rate<br />
since the control slopes were so close to zero.<br />
8
With<br />
Desiccant<br />
Control<br />
Table 1<br />
Slope Summary<br />
Broached<br />
Mean<br />
Slope<br />
(mg/day)<br />
Min<br />
Slope<br />
(mg/day)<br />
Max<br />
Slope<br />
(mg/day)<br />
Std Dev<br />
Condition Site N<br />
(mg/day) RSD(%) P-value<br />
40C/75%RH MK 15 7.22 0.733 10.162 < 0.0001 5.523 8.290<br />
Pf 15 7.17 0.668 9.314 < 0.0001 5.982 8.679<br />
SA 15 8.28 1.549 18.701 < 0.0001 5.215 10.985<br />
AB 15 9.40 1.530 16.270 < 0.0001 4.934 11.445<br />
23C/75%RH MK 15 2.65 0.809 30.496 < 0.0001 1.519 5.219<br />
Pf 15 1.92 0.262 13.664 < 0.0001 1.508 2.446<br />
SA 15 2.40 0.326 13.571 < 0.0001 1.853 2.949<br />
AB 15 2.74 0.338 12.332 < 0.0001 2.248 3.604<br />
40C/75%RH MK 10 0.04 0.007 < 0.0001 0.028 0.047<br />
Pf 10 0.00 0.011 0.93 -0.019 0.016<br />
SA 10 0.05 0.007 < 0.0001 0.038 0.060<br />
AB 10 0.11 0.002 < 0.0001 0.109 0.116<br />
23C/75%RH MK 10 0.03 0.009 < 0.0001 0.007 0.036<br />
Pf 10 0.03 0.005 < 0.0001 0.019 0.036<br />
SA 10 0.02 0.002 < 0.0001 0.019 0.025<br />
AB 10 0.06 0.003 < 0.0001 0.056 0.066<br />
For the intact bottles (Table 2), the mean rate is similar across all laboratories within each<br />
temperature. The variability <strong>of</strong> the rates is much less at the lower temperature with<br />
respect to standard deviation but more similar with respect to RSD. Since the slopes are<br />
much smaller <strong>for</strong> the intact bottles with desiccant than the broached bottles, adjusting <strong>for</strong><br />
the controls has more <strong>of</strong> an effect.<br />
9
With<br />
Desiccant<br />
Control<br />
Table 2<br />
Slope Summary<br />
Intact<br />
Mean<br />
Slope<br />
(mg/day)<br />
Test<br />
Slope = 0<br />
P-value<br />
Min<br />
Slope<br />
(mg/day)<br />
Max<br />
Slope<br />
(mg/day)<br />
Std Dev<br />
Condition Site N<br />
(mg/day) RSD(%)<br />
40C/75%RH MK 15 1.18 0.026 2.170 < 0.0001 1.154 1.235<br />
Pf 15 1.19 0.022 1.820 < 0.0001 1.158 1.245<br />
SA 15 1.25 0.062 5.002 < 0.0001 1.210 1.460<br />
AB 15 1.23 0.018 1.470 < 0.0001 1.210 1.285<br />
23C/75%RH MK 15 0.29 0.006 2.122 < 0.0001 0.276 0.297<br />
Pf 15 0.27 0.007 2.752 < 0.0001 0.257 0.283<br />
SA 15 0.28 0.006 2.122 < 0.0001 0.273 0.298<br />
AB 15 0.27 0.005 1.660 < 0.0001 0.264 0.281<br />
40C/75%RH MK 10 -0.01 0.002 < 0.0001 -0.012 -0.007<br />
Pf 10 -0.02 0.005 < 0.0001 -0.031 -0.016<br />
SA 10 0.02 0.004 < 0.0001 0.018 0.028<br />
AB 10 0.02 0.005 < 0.0001 0.010 0.030<br />
23C/75%RH MK 10 0.02 0.001 < 0.0001 0.023 0.025<br />
Pf 10 0.02 0.002 < 0.0001 0.015 0.023<br />
SA 10 0.01 0.004 < 0.0001 0.006 0.021<br />
AB 10 0.01 0.002 < 0.0001 0.010 0.016<br />
Outliers<br />
In three cases, the data appeared to be influenced by outliers. A discussion <strong>of</strong> those three<br />
situations follows:<br />
From Table 1 and Figure 5:<br />
Broached MK at 23/75, 30% RSD result: Container 4 had a slope <strong>of</strong> 5.22 mg/day. The<br />
other 14 slopes ranged from 1.52 to 3.07 mg/day. The Dixon outlier test indicates that<br />
the 5.22 is an extreme value (p-value < 0.001) assuming that the slopes are normally<br />
distributed. By leaving this point out, the MK mean, std dev, and RSD are 2.47, 0.40,<br />
and 16.3, respectively. The RSD calculated by omitting the outlier is in good agreement<br />
with the other site RSD’s.<br />
From Table 1 and Figure 5:<br />
Broached AB at 40/75, 16% RSD result: Container 2 had a slope <strong>of</strong> 4.93 mg/day. The<br />
other 14 slopes ranged from 8.38 to 11.44 mg/day. The Dixon outlier test indicates that<br />
the 4.93 is an extreme value (p-value < 0.005) assuming that the slopes are normally<br />
distributed. By leaving this point out, the AB mean, std dev, and RSD are 9.72, 0.94, and<br />
9.62, respectively.<br />
From Table 2 and Figure 6:<br />
Intact SA at 40/75, 5% RSD result: Container 6 had a slope <strong>of</strong> 1.46 mg/day. The other<br />
14 slopes ranged from 1.21 to 1.28 mg/day. The Dixon outlier test indicates that the 1.46<br />
10
is an extreme value (p-value < 0.001) assuming that the slopes are normally distributed.<br />
By leaving this point out, the SA mean, std dev, and RSD are 1.23, 0.02, and 1.72,<br />
respectively. The RSD calculated by omitting the outlier is in good agreement with the<br />
other site RSD’s.<br />
Nine Day Study<br />
Since there was no apparent delay to reach steady state, Pfizer per<strong>for</strong>med a 9 day study in<br />
both broached and intact bottles as well as controls. They used 15 test bottles and 10<br />
controls, treated in the same way as the main study. The mean weights are given in<br />
figures 8-9 & 10-11 <strong>for</strong> broached and intact containers, respectively. For broached seals<br />
stored at 40 o C/75%RH, there is no apparent induction period in the 9 day study. There is<br />
a short period <strong>of</strong> high slope during the first time period (day 0 to day 1) <strong>for</strong> the broached<br />
seals stored at 23 o C/75%RH. For the intact seals, there is an extensive period <strong>of</strong> irregular<br />
behavior <strong>for</strong> the first six days <strong>of</strong> the 9 day study. Figures 10 and 11 show discontinuities<br />
and wide slope variation in the data <strong>for</strong> the whole six day period. For this nine day<br />
period, the per<strong>for</strong>mance is widely different among the four tests and irregular within two<br />
<strong>of</strong> them. This appears to be an induction period that was not evident in the main study.<br />
Figure 8 Figure 9<br />
Broached<br />
Broached<br />
40±2°C/75±5%RH<br />
23±2°C/75±3%RH<br />
46.52<br />
46.01<br />
46.51<br />
Mean(Weight)<br />
46.5<br />
46.49<br />
46.48<br />
Mean(Weight)<br />
46<br />
46.47<br />
45.99<br />
46.46<br />
-1 0 1 2 3 4 5 6 7 8 9<br />
Time<br />
-1 0 1 2 3 4 5 6 7 8 9<br />
Time<br />
11
Figure 10 Figure 11<br />
Intact<br />
Intact<br />
40±2°C/75±5%RH<br />
23±2°C/75±3%RH<br />
45.83<br />
45.988<br />
45.8275<br />
45.987<br />
Mean(Weight)<br />
45.825<br />
45.8225<br />
45.82<br />
Mean(Weight)<br />
45.986<br />
45.985<br />
45.984<br />
45.8175<br />
45.983<br />
45.815<br />
-1 0 1 2 3 4 5 6 7 8 9<br />
45.982<br />
-1 0 1 2 3 4 5 6 7 8 9<br />
Time<br />
Time<br />
Impact <strong>of</strong> Controls on Slopes<br />
Tables 3 and 4 compare the mean slopes (WVTRs) <strong>for</strong> broached and intact containers at<br />
the two test conditions. In both tables, the overall slopes adjusted <strong>for</strong> controls at both<br />
conditions are 94 % or better <strong>of</strong> the slopes <strong>for</strong> desiccant filled bottles WVTRs obtained<br />
<strong>for</strong> desiccant filled bottles alone are slightly higher than WVTRs obtained when controls<br />
are subtracted as specified in USP .<br />
Table 3<br />
Mean Slopes (mg/day) <strong>for</strong> Broached Seal<br />
40C/75%RH<br />
23C/75%RH<br />
Adjusted<br />
<strong>for</strong> Ratio<br />
Adjusted<br />
<strong>for</strong> Ratio<br />
Site Desiccant Control (%) Desiccant Control (%)<br />
MK 7.216 7.176 99.4 2.653 2.626 99.0<br />
Pf 7.173 7.173 100.0 1.917 1.892 98.7<br />
SA 8.283 8.233 99.4 2.399 2.377 99.1<br />
AB 9.403 9.291 98.8 2.739 2.679 97.8<br />
Overall 99.4 Overall 98.6<br />
* Ratio = Adjusted <strong>for</strong> Control slope as a percent <strong>of</strong> Desiccant slope<br />
12
Table 4<br />
Mean Slopes (mg/day) <strong>for</strong> Intact Seal<br />
Intact 40C/75%RH 23C/75%RH<br />
Adjusted<br />
<strong>for</strong><br />
Adjusted<br />
<strong>for</strong><br />
Site Desiccant Control Ratio* Desiccant Control Ratio*<br />
MK 1.179 1.188 100.8 0.286 0.262 91.6<br />
Pf 1.186 1.208 101.9 0.271 0.252 93.0<br />
SA 1.246 1.223 98.2 0.280 0.269 96.1<br />
AB 1.230 1.208 98.2 0.275 0.263 95.6<br />
Overall 99.7 Overall 94.1<br />
* Ratio = Adjusted <strong>for</strong> Control slope as a percent <strong>of</strong> Desiccant slope<br />
Comparison <strong>of</strong> RSDs; Effect <strong>of</strong> Temperature on Variation<br />
Table 5 compares the RSD’s <strong>for</strong> broached and intact containers with desiccant at the two<br />
storage conditions. Considering the effect <strong>of</strong> outliers discussed above, the variation <strong>for</strong><br />
broached containers at 40 o C/75%RH (mean =15.9) is slightly higher than at<br />
23 o C/75%RH (mean=13.9). Otherwise, the variations are similar, and there is little<br />
difference in RSDs between the two conditions.<br />
* RSD without outlier in parentheses<br />
Table 5<br />
RSD (%)*<br />
40C/75%RH 23C/75%RH<br />
Site Broached Intact Broached Intact<br />
MK 10.16 2.17 30.50 2.12<br />
(16.33)<br />
Pf 9.31 1.82 13.66 2.75<br />
SA 18.70 5.00 13.57 2.12<br />
(1.72)<br />
AB 16.27<br />
(9.62)<br />
1.47 12.33 1.66<br />
Variation Between Sites, Runs and Containers<br />
Table 6 is an analysis <strong>of</strong> the RSDs. It breaks the overall RSD into two components; the<br />
variation associated with ‘Between Sites and Runs’ and that associated with ‘Between<br />
Containers’. The least variation occurs when intact and broached containers are tested at<br />
40 o C/75%RH, using regression analysis over all five data points. Using initial point to 14<br />
days shows similar mean WVTRs, but in most analyses the variation is larger <strong>for</strong> the<br />
initial to day 14 calculation than using regression. The RSDs <strong>for</strong> WVTR calculated using<br />
the data from initial to day 14 at 23 o C/75%RH are very large .<br />
13
Table 6<br />
Comparison <strong>of</strong> Type, Condition, and Slope Method Using RSD<br />
Type Condition Slope Method<br />
Mean<br />
Slope<br />
(mg/day)<br />
RSD(%)<br />
Between<br />
Sites&Runs<br />
RSD(%)<br />
Between<br />
Containers<br />
RSD(%)<br />
Total<br />
Broached 23C/75%RH Initial - Day 14 2.44 16.44 23.92 29.02<br />
Regression 1<br />
(all) 2.43 14.31 19.99 24.58<br />
Regression 2<br />
(wo Initial) 2.42 14.06 19.40 23.96<br />
Regression 3 2.42 13.50 19.93 24.07<br />
40C/75%RH Initial - Day 14 7.12 17.56 17.43 24.74<br />
Regression 1<br />
(all) 8.02 12.59 14.92 19.52<br />
Regression 2<br />
(wo Initial) 8.18 11.96 14.52 18.82<br />
Regression 3 8.14 10.89 14.99 18.53<br />
Intact 23C/75%RH Initial - Day 14 0.36 44.36 5.97 44.76<br />
Regression 1<br />
(all) 0.28 2.35 2.18 3.20<br />
Regression 2<br />
(wo Initial) 0.27 4.15 2.34 4.77<br />
40C/75%RH Initial - Day 14 1.28 15.59 3.47 15.97<br />
Regression 1<br />
(all) 1.21 2.63 3.02 4.00<br />
Regression 2<br />
(wo Initial) 1.21 2.72 3.39 4.34<br />
Notes: (1) Initial-Day 14 is day point 0 and day point 14. (2) Regression 1 is regression<br />
over days 0 to 42 or 49. (3) Regression 2 is regression over days 7 to 42 or 49. (3)<br />
Regression 3 is regression on days 7, 14, 21, 28, and 35; not much different from using<br />
42 or 49 days.<br />
Conclusions<br />
There was no apparent induction period in the main study; steady state appears to<br />
have occurred by the 7 day time point.<br />
The 9 day study showed irregularity and variable behavior during the first 6 days,<br />
suggesting instability during this period which did not appear in the test as<br />
specified by USP Chapter .<br />
Weight gain was linear over time at steady state; WVTR is constant.<br />
Smaller variability occurred when WVTR was calculated by regression rather<br />
than using the two- point calculation <strong>of</strong> USP .<br />
Mean WVTR rates and container variability were similar between labs within<br />
each <strong>of</strong> the testing conditions.<br />
The higher temperature resulted in higher WVTR rates. RSD’s were similar<br />
between the two temperatures.<br />
Controls (blanks) had statistically significant but small positive slopes. In this<br />
study, the controls had little effect on the WVTR rates <strong>for</strong> the broached bottles.<br />
14
Controls had a greater effect on the intact bottle because <strong>of</strong> the smaller intact<br />
WVTR rates.<br />
Controls are not necessary (see Table 3).<br />
Anhydrous calcium chloride should be pre-dried at 210 o C, not 110 o C as is<br />
currently specified in USP (see Appendix).<br />
Recommendations<br />
USP Chapter should be rewritten or replaced.<br />
For the purpose <strong>of</strong> moisture-barrier comparison, WVTR testing should be<br />
conducted at 40 o C/75% RH. This is an ICH accelerated condition.<br />
The test duration should be 35 days, and containers weighed at 7 day intervals<br />
WVTR should be calculated by regression analysis over the period from day 7 to<br />
day 35.<br />
Blanks (Controls) are not necessary, so they should not be included in the test<br />
design<br />
If calcium chloride is used as the desiccant, it should be pre-dried at 210 o C<br />
Appendix A<br />
Selection <strong>of</strong> desiccant <strong>for</strong> bottle WVTR study<br />
Anhydrous calcium chloride is used as a desiccant <strong>for</strong> measuring the WVTR <strong>of</strong> HDPE<br />
bottles. This desiccant is specified in USP with a requirement that the desiccant be<br />
activated at 110°C prior to use. The amount <strong>of</strong> the desiccant to use is also specified in<br />
USP, depending on container sizes. The purpose <strong>of</strong> using desiccant is to provide a<br />
sink condition; hence a constant driving <strong>for</strong>ce <strong>of</strong> water vapor pressure over the course <strong>of</strong><br />
study at constant temperature and external humidity. For the current study, a sink<br />
condition is defined as an internal relative humidity that does not exceed 5% over the<br />
time course <strong>of</strong> study. To assure this criterion is met, the following procedures were<br />
carried out to determine the suitable amount <strong>of</strong> the desiccant to use:<br />
1. A literature search was conducted <strong>for</strong> in<strong>for</strong>mation on the properties <strong>of</strong> anhydrous<br />
chloride, including moisture sorption isotherms<br />
2. The cumulative amount <strong>of</strong> water vapor that will permeate into the container<br />
during the study was estimated.<br />
3. The desiccant isotherm was linked with the estimated bottle WVTR to verify that<br />
the criterion <strong>of</strong> not more than 5% RH is met.<br />
15
Data in the literature shows that the relative humidity in air dried by anhydrous calcium<br />
chloride is 1.6% at 25°C i . Literature also indicates that calcium chloride can exist in<br />
multiple hydrates, and that the hexahydrate loses water at 200°C ii . This in<strong>for</strong>mation on<br />
hydrates shows that the activation temperature must be higher than 200°C if the desiccant<br />
has been previous exposed to humidity and <strong>for</strong>med hexahydrate. The history <strong>of</strong> the<br />
desiccant must be considered because during shipping, storage, and use the anhydrous<br />
calcium chloride may be exposed to moisture at some points, hence care must be taken to<br />
activate the material properly be<strong>for</strong>e use.<br />
A preliminary experiment was conducted by a member laboratory to select the activation<br />
temperature <strong>for</strong> anhydrous calcium chloride after the material was equilibrated at<br />
6.4%RH at room temperature. Activation was conducted by heating at 110°C and 210°C.<br />
Results showed that loss on drying was 0.5% and 4.5% by activation at 110°C and<br />
210°C, respectively. These results showed that activation <strong>of</strong> anhydrous calcium chloride<br />
at 210°C is necessary to fully activate the desiccant even if the material has been exposed<br />
to an environment <strong>of</strong> extremely low humidity.<br />
To estimate the quantity <strong>of</strong> anhydrous calcium chloride needed to maintain a sink<br />
condition <strong>for</strong> study, the desiccant moisture capacity was linked to the estimated quantity<br />
<strong>of</strong> moisture ingress during the study. The moisture capacity <strong>of</strong> the desiccant activated at<br />
210°C is about 2% at 5%RH. The WVTR <strong>of</strong> the intact 60 mL bottle was estimated to be<br />
0.2mg/day at 23°C/75%RH, and 0.9mg/day at 40°C/75%RH. Total ingression <strong>of</strong><br />
moisture over 98 days is 19.6mg and 88mg under the two study conditions. It can be<br />
calculated that about 5g <strong>of</strong> fully activated anhydrous calcium chloride is needed to absorb<br />
88 mg <strong>of</strong> the moisture penetrating the container to result in an internal relative humidity<br />
<strong>of</strong> about 5%. In the current study, 30 g <strong>of</strong> fully activated anhydrous calcium chloride was<br />
used <strong>for</strong> the 60 mL bottle. This amount <strong>of</strong> desiccant ensured that a sink condition <strong>of</strong><br />
ii. S. Budavari, M.J. O’Neil, A. Smith, P.E. Hekelman. The Merck Index, 11 th Ed. Merck & Co., Inc.,<br />
Rahway, N.J., 1989. p 252.<br />
iii. Y. Chen, Y. Li, <strong>Determination</strong> <strong>of</strong> water vapor transmission rate (WVTR) <strong>of</strong> HDPE bottles <strong>for</strong><br />
pharmaceutical products. Int. J. Pharm., 358 (2008) 137-143.<br />
Appendix B<br />
Sample Preparation and Handling<br />
Excerpted from <strong>PQRI</strong> Bottle WVTR Study Protocol, 5 September, 2006<br />
Sample Preparation at the Manufacturing Plant<br />
Desiccant<br />
o Desiccant should be taken from the original container and opened just prior to<br />
use. Place bulk desiccant in shallow container, taking care to exclude any fine<br />
powder. Dry at 210 degree Celsius <strong>for</strong> a minimum <strong>of</strong> one hour and cool in a glass<br />
desiccator <strong>for</strong> at least 30 minutes. The desiccator should be kept closed during<br />
packaging <strong>of</strong> the bottles. No desiccant should be exposed to the ambient<br />
environment unprotected <strong>for</strong> more than 10 min<br />
Bottles with Desiccant<br />
o To each <strong>of</strong> >240 bottles, add 30+-3.0 g <strong>of</strong> the desiccant. Immediately close the<br />
bottles with the S&T CR cap, manually without significant torque.<br />
o Using a calibrated instrument, close the bottles with the cap in accordance with<br />
the procedure described in USP . Activate the seal with the induction<br />
sealer. The induction seal must pass ASTM D3078-02 at 15 inches mercury (or<br />
equivalent) vacuum-dye leak test.<br />
o Mark each bottle sequentially 1-240<br />
Empty Bottles<br />
o Follow the same procedure as described above and prepare >160 induction-sealed<br />
bottles without any desiccant.<br />
o Instead <strong>of</strong> desiccant add glass glass beads per USP to the same volume as<br />
the desiccant<br />
o Mark each bottle sequentially 1-160<br />
Shipping <strong>of</strong> Sample to Testing Labs<br />
o Place at least 60 (e.g. 70) bottles containing desiccant and at least 40 (e.g. 50)<br />
empty bottles (with caps) in an appropriate container and FedEx them to the 4<br />
testing labs within 3 days.<br />
17
Sample Preparation and Weight Measurement at the Testing Labs<br />
Intact Bottles<br />
o Separate 60 bottles-with-desiccant into two equal parts, A & B mark them with<br />
non-erasable ink (e.g. A1, B2, etc.)<br />
o Measure and record the initial weight to the 4 th decimal point (0.1 mg) <strong>of</strong> each<br />
bottle in group A (30 in total). Place 15 group-A bottles each in the 40°C and<br />
23°C chambers, respectively. Measure and record the weight <strong>of</strong> each bottle every<br />
14 days <strong>for</strong> 98 days, to the 4 th (0.1 mg). Be<strong>for</strong>e each weighing, the bottles are<br />
removed from the chamber and allowed to equilibrate <strong>for</strong> ~30 min in the room<br />
(preferably with T/RH control to 75F (24°C)/40%RH or below) where the<br />
weighing takes place. Minimize the time-out-<strong>of</strong>-chamber to below 2 hrs.<br />
o Mark the 40 empty bottles with non-erasable ink as C1, C2, etc.<br />
o Place 10 empty bottles with intact seal in each <strong>of</strong> the environmental chambers at<br />
the same time when the desiccated bottles are placed (20 bottles in total).<br />
o Measure and record the weight <strong>of</strong> each <strong>of</strong> the empty bottles as <strong>for</strong> the desiccated<br />
bottles.<br />
Breached Bottles<br />
o Breach the seal <strong>of</strong> group-B bottles (30 in total) according to the attached<br />
procedure. Close these bottles with the cap according to the prescribed procedure<br />
(USP ).<br />
o Weigh and record the weight <strong>of</strong> each <strong>of</strong> the group-B bottles with breached seal to<br />
the 4 th decimal point (0.1 mg). Store 15 bottles each in the 23° and 40° chambers,<br />
respectively, as with the intact bottles. Measure and record the weight <strong>of</strong> each<br />
bottle to the 4 th decimal point (0.1 mg) every 7 days <strong>for</strong> 49 days. Be<strong>for</strong>e each<br />
weighing, the bottles are removed from the chamber and allowed to equilibrate<br />
<strong>for</strong> ~30 min in a room (preferably with T/RH control to 75F (24°C)/40%RH or<br />
below) where the weighing takes place.<br />
o Breach the seal <strong>of</strong> the remaining 20 empty bottles according to the prescribed<br />
procedure. Close these bottles with the cap according to the prescribed procedure<br />
(USP ).<br />
o Place 10 empty bottles with breached seal in each <strong>of</strong> the environmental chambers<br />
at the same time when the desiccated bottles are placed.<br />
o Measure and record the weight <strong>of</strong> each <strong>of</strong> the empty bottles as <strong>for</strong> the desiccated<br />
bottles.<br />
18
Appendix B<br />
Procedure <strong>for</strong> breaching the induction-seal and preparing the breached<br />
bottle samples<br />
Excerpted from <strong>PQRI</strong> Bottle WVTR Study Protocol, 5 September, 2006<br />
The induction inner-seal must be breached by testing laboratory in a consistent manner.<br />
The testing laboratory must puncture the seal using either a razor blade or a conical<br />
instrument, leaving a flat consistent inner-seal residue on the lip <strong>of</strong> the bottle. After<br />
breaching, the bottles must be closed and opened with caps <strong>for</strong> 30 times and re-torque at<br />
the end in accordance with the procedure described in USP , MULTIPLE-UNIT<br />
CONTAINERS FOR CAPSULES AND TABLETS.<br />
19