isostasy answers - Myweb @ CW Post
isostasy answers - Myweb @ CW Post
isostasy answers - Myweb @ CW Post

Create successful ePaper yourself
Turn your PDF publications into a flip-book with our unique Google optimized e-Paper software.
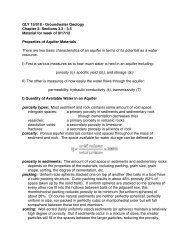
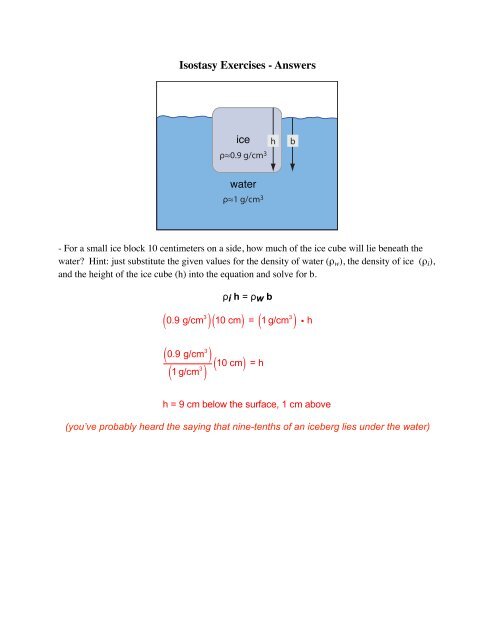
Isostasy Exercises - Answers<br />
ice<br />
ρ≈0.9 g/cm 3<br />
h<br />
b<br />
water<br />
ρ≈1 g/cm 3<br />
- For a small ice block 10 centimeters on a side, how much of the ice cube will lie beneath the<br />
water? Hint: just substitute the given values for the density of water (ρ w ), the density of ice (ρ i ),<br />
and the height of the ice cube (h) into the equation and solve for b.<br />
ρi h = ρw b<br />
( 0.9 g/cm 3<br />
) ( 10 cm) = ( 1 g/cm 3<br />
) i h<br />
( 0.9 g/cm 3<br />
)<br />
10 cm<br />
( 1 g/cm 3<br />
)<br />
( ) = h<br />
h = 9 cm below the surface, 1 cm above<br />
(you’ve probably heard the saying that nine-tenths of an iceberg lies under the water)
V.J. DiVenere - 2/13/12<br />
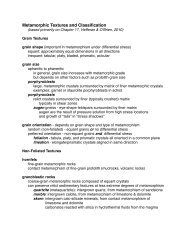
B) Now let's do the same thing but with rock. The Earth's solid mantle underlies the crust.<br />
Because of the extremely high temperatures and pressures in the mantle, the solid ultramafic<br />
peridotite rock that it is made of actually deforms very slowly in the ductile state (bends, folds,<br />
stretches, flows in the solid state). The mantle will be our “fluid” and take the place of the water<br />
in the example above. The crust is rigid and less dense than the mantle. In a real sense, the crust<br />
"floats" on the mantle. The crust will take the place of our ice cube in the previous example.<br />
The density of the continental crust (ρ c ) is about 2700 kg/m 3 (kilograms per cubic meter), the<br />
density of ocean crust (ρ o ) is 2900 kg/m 3 , and the density of the mantle (ρ m ) is 3300 kg/m 3 . The<br />
density of water is 1000 kg/m 3 (1 g/cm 3 ).<br />
“continental<br />
crust”<br />
thickness<br />
“mantle”<br />
- How much crust would sink down into the mantle and how much would remain above the<br />
surface of the mantle if a 35 km thick block of continental crust were resting on the mantle?<br />
ρc h = ρm b<br />
( 2700 kg/m 3<br />
) ( 35 km) = ( 3300 kg/m 3<br />
) i b<br />
( 2700 kg/m 3<br />
)<br />
35 km<br />
( 3300 kg/m 3<br />
)<br />
( ) = b<br />
b = 0.82 i ( 35 km) = 28.6 km below<br />
35 km - 28.6 km = 6.4 km above<br />
(that’s ~8 tenths below and 2 tenths above)
V.J. DiVenere - 2/13/12<br />
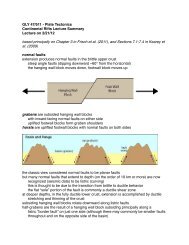
C) - Find the thickness of the mountain root (r in the figure below) and the elevation above the<br />
surrounding crust of the mountain block (e).<br />
The thick crust has the same density as normal continental crust and a thickness of 65 km (hm).<br />
The normal continental crust has a thickness of 35 km (hc). Densities were give in Part B,<br />
above. To compare the weights we only need to consider the densities & thicknesses as above<br />
because the length, width, and gravitational acceleration cancel out.<br />
(weight of thick crust) = (weight of normal crust) + (weight of mantle of thickness r)<br />
ρc hm = ρc hc + ρm r<br />
e<br />
thickened<br />
continental<br />
crust<br />
h m<br />
h c<br />
r<br />
mantle<br />
( 2700 kg/m 3<br />
) ( 65 km) = ( 2700 kg/m 3<br />
) ( 35 km) + ( 3300 kg/m 3<br />
) i r<br />
( 2700 kg/m 3<br />
) 65 km<br />
( ) − ( 2700 kg/m 3<br />
) ( 35 km)<br />
( 3300 kg/m 3<br />
)<br />
= r<br />
r = 24.5 km below bottom of normal crust<br />
e = 65 km - 35 km - 24.5 km = 5.5 km above top of normal crust
V.J. DiVenere - 2/13/12<br />
D) Now imagine that millions of years of weathering and erosion have removed 20 km from<br />
the top of the thickened crust.<br />
- How much will the crust rise up? (Consider how deep into the mantle the root of the mountain<br />
will be, r in the figure, for 65 km - 20 km = 45 km thick crust, compared to in part C)<br />
( 2700 kg/m 3<br />
) ( 45 km) = ( 2700 kg/m 3<br />
) ( 35 km) + ( 3300 kg/m 3<br />
) i r<br />
( 2700 kg/m 3<br />
) 45 km<br />
( ) − ( 2700 kg/m 3<br />
) ( 35 km)<br />
( 3300 kg/m 3<br />
)<br />
= r<br />
r = 8.2 km below bottom of normal crust<br />
so, mountain crust (bottom) isostatically rose up from 24.5 below to 8.2 km below<br />
24.5 km - 8.2 km = 16.3 km<br />
20 km erosion yielded 16.3 km uplift (or 0.82 * 20 km)<br />
- How high above the top of normal crust, e, in the figure, will the mountain now be?<br />
e = 45 km - 35 km - 8.2 km = 1.8 km above top of normal crust<br />
- How much lower are the mountains after the 20 km of erosion?<br />
old elevation - new elevation = 5.5 km - 1.8 km = 3.7 km<br />
so, 20 km of erosion only resulted in 3.7 km lowering of the mountains!<br />
(3.7 km lower = 0.18 * 20 km, complement of the 0.82 * 20 km uplift)<br />
- Surprised?<br />
Wow!
V.J. DiVenere - 2/13/12<br />
E) Optional - Extra Credit<br />
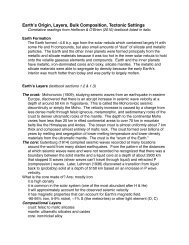
Now let's look at continental crust vs oceanic crust. Similar to B above, equalte the weight of a<br />
column through continental crust to the weight of a column through the oceanic crust and mantle<br />
to the depth of compensation (the base of the continental crust). The continental crust is 35 km<br />
thick, oceanic crust is 7 km thick, and the ocean depth is 4.5 km.<br />
- Calculate the excess depth of the continental crust below the bottom of the ocean crust and the<br />
height of the continent above sea level.<br />
ocean water<br />
continental<br />
crust<br />
ocean crust<br />
mantle<br />
ρcc hcc = ρw hw + ρoc hoc + ρm r<br />
( 2700 kg/m 3<br />
) ( 35 km) = ( 1000 kg/m 3<br />
) ( 4.5 km) + ( 2900 kg/m 3<br />
) ( 7 km) + ( 3300 kg/m 3<br />
) i r<br />
( 2700 kg/m 3<br />
) ( 35 km) − ( 1000 kg/m 3<br />
) ( 4.5 km) − ( 2900 kg/m 3<br />
) ( 7 km)<br />
( 3300 kg/m 3<br />
)<br />
= r<br />
r = 21.1 km below bottom of ocean crust<br />
e = 35 km - 4.5 km - 7 km - 21.1 km = 2.4 km above sea level<br />
- Compare the difference in elevation of the continents and sea floor calculated above with the<br />
hypsographic curve and bar graph of Fig. 1.2 in the textbook (Frisch et al., 2011) showing the<br />
distribution of elevations on the continents and depths in the ocean.<br />
the calculations are a little high for an average elevation, but in the right general<br />
ballpark, using as we did, rough figures for density, etc.