CoreSight Trace Memory Controller - Lauterbach
CoreSight Trace Memory Controller - Lauterbach
CoreSight Trace Memory Controller - Lauterbach

You also want an ePaper? Increase the reach of your titles
YUMPU automatically turns print PDFs into web optimized ePapers that Google loves.
1<br />
<strong>CoreSight</strong> <strong>Trace</strong> <strong>Memory</strong> <strong>Controller</strong><br />
The new <strong>CoreSight</strong> <strong>Trace</strong> <strong>Memory</strong> <strong>Controller</strong> provides<br />
SoC designers with more design options for the trace<br />
infrastructure. TRACE32 already has support for the<br />
fi rst designs which use the TMC.<br />
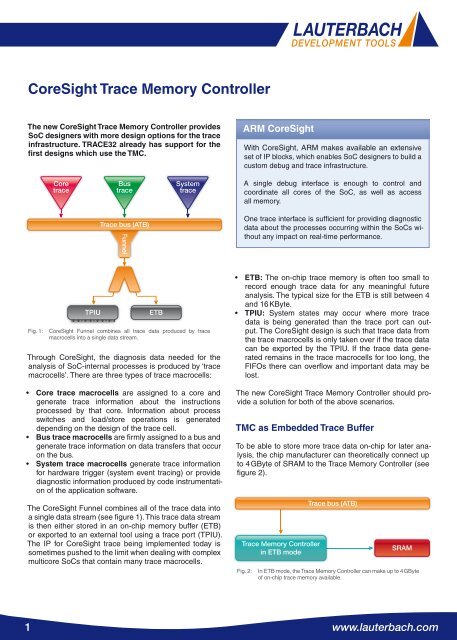
Core<br />
trace<br />
Bus<br />
trace<br />
<strong>Trace</strong> bus (ATB)<br />
Funnel<br />
TPIU ETB<br />
System<br />
trace<br />
Fig. 1: <strong>CoreSight</strong> Funnel combines all trace data produced by trace<br />
macrocells into a single data stream.<br />
Through <strong>CoreSight</strong>, the diagnosis data needed for the<br />
analysis of SoC-internal processes is produced by ‘trace<br />
macrocells’. There are three types of trace macrocells:<br />
• Core trace macrocells are assigned to a core and<br />
generate trace information about the instructions<br />
processed by that core. Information about process<br />
switches and load/store operations is generated<br />
depending on the design of the trace cell.<br />
• Bus trace macrocells are fi rmly assigned to a bus and<br />
generate trace information on data transfers that occur<br />
on the bus.<br />
• System trace macrocells generate trace information<br />
for hardware trigger (system event tracing) or provide<br />
diagnostic information produced by code instrumentation<br />
of the application software.<br />
The <strong>CoreSight</strong> Funnel combines all of the trace data into<br />
a single data stream (see fi gure 1). This trace data stream<br />
is then either stored in an on-chip memory buffer (ETB)<br />
or exported to an external tool using a trace port (TPIU).<br />
The IP for <strong>CoreSight</strong> trace being implemented today is<br />
sometimes pushed to the limit when dealing with complex<br />
multicore SoCs that contain many trace macrocells.<br />
ARM <strong>CoreSight</strong><br />
With <strong>CoreSight</strong>, ARM makes available an extensive<br />
set of IP blocks, which enables SoC designers to build a<br />
custom debug and trace infrastructure.<br />
A single debug interface is enough to control and<br />
coordinate all cores of the SoC, as well as access<br />
all memory.<br />
One trace interface is suffi cient for providing diagnostic<br />
data about the processes occurring within the SoCs without<br />
any impact on real-time performance.<br />
• ETB: The on-chip trace memory is often too small to<br />
record enough trace data for any meaningful future<br />
analysis. The typical size for the ETB is still between 4<br />
and 16 KByte.<br />
• TPIU: System states may occur where more trace<br />
data is being generated than the trace port can output.<br />
The <strong>CoreSight</strong> design is such that trace data from<br />
the trace macrocells is only taken over if the trace data<br />
can be exported by the TPIU. If the trace data generated<br />
remains in the trace macrocells for too long, the<br />
FIFOs there can overfl ow and important data may be<br />
lost.<br />
The new <strong>CoreSight</strong> <strong>Trace</strong> <strong>Memory</strong> <strong>Controller</strong> should provide<br />
a solution for both of the above scenarios.<br />
TMC as Embedded <strong>Trace</strong> Buffer<br />
To be able to store more trace data on-chip for later analysis,<br />
the chip manufacturer can theoretically connect up<br />
to 4 GByte of SRAM to the <strong>Trace</strong> <strong>Memory</strong> <strong>Controller</strong> (see<br />
fi gure 2).<br />
<strong>Trace</strong> <strong>Memory</strong> <strong>Controller</strong><br />
in ETB mode<br />
<strong>Trace</strong> bus (ATB)<br />
SRAM<br />
Fig. 2: In ETB mode, the <strong>Trace</strong> <strong>Memory</strong> <strong>Controller</strong> can make up to 4 GByte<br />
of on-chip trace memory available.<br />
www.lauterbach.com
2<br />
TMC as Embedded <strong>Trace</strong> FIFO<br />
Inspections of the trace data streams being exported by<br />
the TPIU have shown that the bandwidth of most trace<br />
ports is large enough for normal operation. Overload, and<br />
therefore loss of trace data, only happens when peaks<br />
occur.<br />
The <strong>Trace</strong> <strong>Memory</strong> <strong>Controller</strong> can be integrated into the<br />
trace infrastructure of the SoCs, so that the <strong>Trace</strong> <strong>Memory</strong><br />
<strong>Controller</strong> acts as an Embedded <strong>Trace</strong> FIFO and<br />
<strong>Trace</strong> <strong>Memory</strong> <strong>Controller</strong><br />
in FIFO mode<br />
TPIU<br />
<strong>Trace</strong> bus (ATB)<br />
cushions peaks in the load on the TPIU (see fi gure 3).<br />
This ETF is designed so that no trace data loss can occur.<br />
The size of the ETF can be freely defi ned from 512 Bytes<br />
to 4 GBytes.<br />
Both integrations of the <strong>Trace</strong> <strong>Memory</strong> <strong>Controller</strong> in the<br />
trace infrastructure depicted are simple examples. Of<br />
course, you can build the TMC IP block into the <strong>CoreSight</strong><br />
system in much more complex and fl exible ways.<br />
Modifi cations in TRACE32<br />
As you would expect, <strong>Lauterbach</strong> has to modify the TRA-<br />
CE32 software for the confi guration and handling of the<br />
<strong>Trace</strong> <strong>Memory</strong> <strong>Controller</strong>. This applies especially when the<br />
<strong>Trace</strong> <strong>Memory</strong> <strong>Controller</strong> is integrated in the SoC using<br />
new, previously unsupported ways. The TRACE32 user<br />
only needs to confi gure the basic address for the TMC.<br />
Then all the proven trace display and analysis features<br />
can be used as usual.<br />
TMC as Router to High-Speed Link<br />
SRAM<br />
Fig. 3: In FIFO mode, the <strong>Trace</strong> <strong>Memory</strong> <strong>Controller</strong> can cushion load<br />
peaks on the TPIU. By doing this, trace data loss can be avoided.<br />
The idea of moving away from dedicated trace ports has<br />
long been discussed within the embedded community.<br />
There are certainly several good arguments for this move.<br />
For the fi rst time <strong>CoreSight</strong> traces can now connect to a<br />
high-speed standard interface by using the <strong>Trace</strong> <strong>Memory</strong><br />
<strong>Trace</strong> <strong>Memory</strong> <strong>Controller</strong><br />
in Router mode<br />
AXI<br />
High-speed link<br />
(USB, Ethernet, ...)<br />
<strong>Controller</strong>. USB or Ethernet interfaces are common favorites,<br />
especially as they are available in many end products.<br />
Ideally, the external trace tool will share the interface with<br />
the other connected devices.<br />
Within the SoC, the TMC operates as Embedded <strong>Trace</strong><br />
Router and has the task of passing on the trace data<br />
through the AXI bus for the export to the IP of the highspeed<br />
interface (see fi gure 4).<br />
This new method of trace export will need completely new<br />
trace tools. <strong>Lauterbach</strong> is currently in close contact with<br />
leading semiconductor manufacturers to develop the appropriate<br />
tools for this switch in technology.<br />
TRACE32 <strong>CoreSight</strong> Features<br />
• Open for use with all cores which can be integrated<br />
into <strong>CoreSight</strong>; <strong>Lauterbach</strong> offers debug solutions for<br />
all ARM/Cortex cores and for numerous DSPs, as well<br />
as for confi gurable cores.<br />
• Support for asymmetric multiprocessing (AMP) and<br />
symmetric multiprocessing (SMP)<br />
• Debugging via JTAG interface and 2-pin Serial Wire Debug<br />
• Synchronized debugging of all cores<br />
• Support for the <strong>CoreSight</strong> Cross Trigger Matrix<br />
• Support for all types of trace macrocells<br />
(ETM, PTM, HTM, ITM, STM, and more)<br />
• Tools for parallel and serial trace ports<br />
• Multicore tracing<br />
<strong>Trace</strong> bus (ATB)<br />
SRAM<br />
Fig. 4: In Router mode, the <strong>Trace</strong> <strong>Memory</strong> <strong>Controller</strong> forwards the trace<br />
data for the export to a high-speed standard interface.<br />
www.lauterbach.com