2007 EPD Final.qxd - Red Angus Association of America
2007 EPD Final.qxd - Red Angus Association of America
2007 EPD Final.qxd - Red Angus Association of America

You also want an ePaper? Increase the reach of your titles
YUMPU automatically turns print PDFs into web optimized ePapers that Google loves.
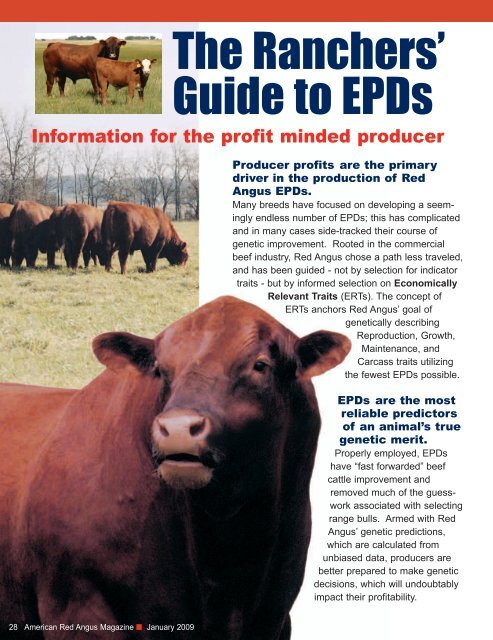
The Ranchers’<br />
Guide to <strong>EPD</strong>s<br />
Information for the pr<strong>of</strong>it minded producer<br />
Producer pr<strong>of</strong>its are the primary<br />
driver in the production <strong>of</strong> <strong>Red</strong><br />
<strong>Angus</strong> <strong>EPD</strong>s.<br />
Many breeds have focused on developing a seemingly<br />
endless number <strong>of</strong> <strong>EPD</strong>s; this has complicated<br />
and in many cases side-tracked their course <strong>of</strong><br />
genetic improvement. Rooted in the commercial<br />
beef industry, <strong>Red</strong> <strong>Angus</strong> chose a path less traveled,<br />
and has been guided - not by selection for indicator<br />
traits - but by informed selection on Economically<br />
Relevant Traits (ERTs). The concept <strong>of</strong><br />
ERTs anchors <strong>Red</strong> <strong>Angus</strong>’ goal <strong>of</strong><br />
genetically describing<br />
Reproduction, Growth,<br />
Maintenance, and<br />
Carcass traits utilizing<br />
the fewest <strong>EPD</strong>s possible.<br />
<strong>EPD</strong>s are the most<br />
reliable predictors<br />
<strong>of</strong> an animal’s true<br />
genetic merit.<br />
Properly employed, <strong>EPD</strong>s<br />
have “fast forwarded” beef<br />
cattle improvement and<br />
removed much <strong>of</strong> the guesswork<br />
associated with selecting<br />
range bulls. Armed with <strong>Red</strong><br />
<strong>Angus</strong>’ genetic predictions,<br />
which are calculated from<br />
unbiased data, producers are<br />
better prepared to make genetic<br />
decisions, which will undoubtably<br />
impact their pr<strong>of</strong>itability.<br />
28 <strong>America</strong>n <strong>Red</strong> <strong>Angus</strong> Magazine ■ January 2009
Absolute performance is not predictable...<br />
RELATIVE PERFORMANCE IS.<br />
<strong>EPD</strong>s: What, Why & How?<br />
<strong>EPD</strong> (Expected Progeny Differences) values are relative;<br />
they do not indicate absolute levels <strong>of</strong> performance.<br />
Rather, they can be used to predict differences in the performance<br />
<strong>of</strong> progeny sired by different bulls. <strong>EPD</strong>s are<br />
calculated from comparisons within Contemporary<br />
Groups. A contemporary group is a group <strong>of</strong> calves that<br />
were born in the same year and season, in the same<br />
herd, <strong>of</strong> the same sex and were fed and managed alike.<br />
The differences in performance between calves are mostly<br />
genetic, because the entire contemporary group was<br />
provided an equal opportunity to perform.<br />
For Example: differences in weaning weight <strong>of</strong> calves<br />
(once age adjusted) within the same contemporary group<br />
can be explained by the individuals’ genetic potential for<br />
pre-weaning growth, and their dam’s genetics for milk<br />
production.<br />
No ifs, ands or butts about it...<br />
For Example: Suppose your old herd bull has a yearling<br />
weight <strong>EPD</strong> <strong>of</strong> 50. You buy a new bull with a yearling<br />
weight <strong>EPD</strong> <strong>of</strong> 70. How much will the new bull boost<br />
your calves’ yearling weights?<br />
The Answer...<br />
<strong>EPD</strong>s have a clear advantage over less sophisticated<br />
predictors such as actual weights or<br />
within-herd ratios. Actual and even adjusted weights<br />
are affected by environment, nutrition and management,<br />
and may not even be comparable from one side <strong>of</strong> the<br />
ranch to the other. Contemporary group ratios are an<br />
Sutherlin Farms Provides<br />
improvement, as they account for such environmental<br />
We cannot predict how much performance will change<br />
from one year to the next because <strong>of</strong> varying environmental<br />
conditions (rainfall, temperature, available feedstuffs,<br />
etc). However, we do know this: the calves raised in the<br />
variables. However, they do not remove variations in performance<br />
from mating bias, nor do they incorporate comparative<br />
performance data on related individuals in count-<br />
the Best Genetic Value at<br />
less herds throughout the country.<br />
same contemporary group sired by your new bull will<br />
have the genetics to weigh an average <strong>of</strong> 20 pounds<br />
more at 365 days <strong>of</strong> age than calves sired by the old bull.<br />
<strong>EPD</strong>s solve all <strong>of</strong> these problems. The <strong>Red</strong> <strong>Angus</strong><br />
<strong>EPD</strong> model accounts for which cows were bred to which<br />
bulls - removing all variation in performance that is due to<br />
Private Treaty Prices!<br />
mating bias. It also evaluates thousands <strong>of</strong> contemporary<br />
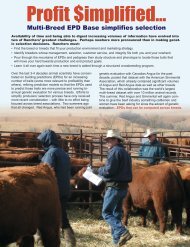
Land Grant universities have <strong>of</strong>ten shown that<br />
being a "low-cost" operation is key to survival in<br />
the cow/calf business. Ironically, the same<br />
research has shown that genetics (bulls) are the<br />
only area where low-cost producers spend more<br />
money than high cost producers.<br />
groups across the breed. While weights and ratios can<br />
not be compared on animals from different herds,<br />
<strong>EPD</strong>s can.<br />
30 <strong>America</strong>n <strong>Red</strong> <strong>Angus</strong> Magazine ■ January 2009
Understanding ACCURACY<br />
<strong>Red</strong> <strong>Angus</strong> <strong>EPD</strong>s are <strong>of</strong>ten presented with a corresponding<br />
accuracy value, which measures the strength <strong>of</strong> the<br />
relationship between the genetic prediction (<strong>EPD</strong>) and<br />
true genetic value. Accuracies are reported as a decimal<br />
number from zero to one. As accuracy value approaches<br />
1.0, the <strong>EPD</strong> is "accurately" or closely estimating the true<br />
genetic merit <strong>of</strong> an animal for a given trait. By the same<br />
token, accuracies closer to zero indicate that the <strong>EPD</strong> has<br />
far less reliability. Although <strong>EPD</strong>s for low accuracy animals<br />
can be considered unreliable relative to higher accuracy<br />
<strong>EPD</strong>s, they are still the best objective measure <strong>of</strong> an<br />
animal's genetic merit. While "perfect" accuracies <strong>of</strong><br />
1.0, are never achieved, many heavily used <strong>Red</strong><br />
<strong>Angus</strong> sires have accuracies greater than 0.9 (some<br />
as high as .99).<br />
Possible Change<br />
<strong>EPD</strong>s are predictions, and while an animal's true genetic<br />
merit will never change, it is safe to assume that their<br />
<strong>EPD</strong>s may change from one calf crop to the next, as<br />
more information (i.e., progeny data) is evaluated.<br />
A possible change value is an estimation <strong>of</strong> the change<br />
potential (in trait units) for a given <strong>EPD</strong>. The true genetic<br />
value <strong>of</strong> each genetic prediction would be expected to fall<br />
within (plus or minus) one standard deviation 2/3 <strong>of</strong> the<br />
time. (The other 1/3 <strong>of</strong> the time, bulls <strong>EPD</strong>s could change<br />
more than one standard deviation.) The possible change<br />
chart (right) shows the potential variation in <strong>EPD</strong> values<br />
that could be observed at different levels <strong>of</strong> accuracy for<br />
the various traits. For all traits, as accuracy increases,<br />
the possible change value decreases and vice versa.<br />
Possible Change Example:<br />
Assume a 60 lb yearling weight <strong>EPD</strong> had an accuracy <strong>of</strong><br />
.30. We would expect the true genetic value to exist<br />
between 49 and 71 lbs two-thirds (2/3) <strong>of</strong> the time (60 lb<br />
YW <strong>EPD</strong> +/- possible change <strong>of</strong> 11). This is what is<br />
referred to as the confidence range.<br />
As accuracy increases, the confidence range narrows.<br />
For example: if we increase accuracy in the<br />
above example to .80 acc., the true genetic value would<br />
be expected to fall between 57 and 63 lbs two-thirds <strong>of</strong><br />
the time (60 +/- 3).<br />
Confidence range estimates the potential variation<br />
between an animal’s published <strong>EPD</strong> and their true<br />
genetic value. It does not imply more or less phenotypic<br />
variation in an animal’s progeny. This means that a low<br />
accuracy sire should not be expected to have any more<br />
or less variation in his progeny than a high accuracy sire.<br />
32 <strong>America</strong>n <strong>Red</strong> <strong>Angus</strong> Magazine ■ January 2009
Data Quantity vs. Data Quality<br />
In 1995, <strong>Red</strong> <strong>Angus</strong> implemented Total Herd<br />
Reporting, and became the first breed to<br />
require the annual production <strong>of</strong> each cow and<br />
the performance <strong>of</strong> every calf raised through<br />
weaning to be reported. It had become obvious<br />
that the registration based fee structure actually discouraged<br />
the submission <strong>of</strong> data by charging for each calf.<br />
THR requires the payment <strong>of</strong> an annual assessment for<br />
each cow in the breeding herd. However, the cost <strong>of</strong><br />
reporting performance data, registration <strong>of</strong> her calf, and<br />
subsequent transfer <strong>of</strong> that calf to a new owner are<br />
included in this assessment fee.<br />
The net effect <strong>of</strong> THR is tw<strong>of</strong>old:<br />
■ <strong>Red</strong> <strong>Angus</strong> <strong>EPD</strong>s are calculated from complete contemporary<br />
group data - not just the data from the calves<br />
good enough to register.<br />
■ Breeders have the incentive to transfer registered bulls<br />
to their commercial customers, which is the foundation <strong>of</strong><br />
<strong>Red</strong> <strong>Angus</strong>' Feeder Calf Certification Program - a USDA<br />
Process Verified Program that adds value to feeder cattle<br />
by genotypic verification <strong>of</strong> <strong>Angus</strong>, source verification to<br />
ranch <strong>of</strong> origin and group age verification.<br />
Garbage In... Garbage Out<br />
The biggest benefit <strong>of</strong> THR is the elimination <strong>of</strong> reporting bias from<br />
data used to calculate <strong>EPD</strong>s. Reporting bias is demonstrated with<br />
the calf ratios shown in Tables 1 & 2. (Ratios are used in the example<br />
since they reflect the performance differences used to calculate<br />
<strong>EPD</strong>s.) When only the top three calves are reported, the ratios are<br />
negatively affected for all calves (Table 2), because the group average<br />
is raised. The ratio is the percentage <strong>of</strong> variation between an<br />
individual weight and the group average. Obviously, incorrectly raising<br />
the group average will incorrectly reduce the ratio and incorrectly<br />
report progeny data on representative sires. Perhaps even more<br />
significant is the overestimate <strong>of</strong> performance <strong>of</strong> sires whose poorer<br />
performing calves are not reported. Only THR builds <strong>EPD</strong>s<br />
using the entire calf crop - not just the calves that<br />
were good enough to register.<br />
Table 1. Contemporary Group with complete data<br />
Calf Weaning WWT<br />
ID Weight Ratio<br />
A 600 120<br />
B 550 110<br />
C 500 100<br />
D 450 90<br />
E 400 80<br />
Table 2. Contemporary Group with incomplete reporting<br />
True/THR “Selected”<br />
Calf Weaning WWT WWT<br />
ID Weight Ratio Ratio<br />
A 600 120 109<br />
B 550 110 100<br />
C 500 100 91<br />
D 450 90<br />
E 400 80<br />
34 <strong>America</strong>n <strong>Red</strong> <strong>Angus</strong> Magazine ■ January 2009
Cows Eat Money!<br />
The ME <strong>EPD</strong> predicts differences in energy requirements <strong>of</strong> mature<br />
daughters <strong>of</strong> an individual and is expressed in Mega-calories per month.<br />
Differences in Maintenance Energy requirements can easily translate<br />
into differences in feed required to maintain body weight.<br />
2/3 <strong>of</strong> proven<br />
<strong>Red</strong> <strong>Angus</strong> bulls fit<br />
in this <strong>EPD</strong> range<br />
ME = 10 ME = 0<br />
How does this affect me? The energy content <strong>of</strong><br />
average quality range forage is approximately 0.86 Mcal<br />
per pound <strong>of</strong> dry matter. If a sire has an ME <strong>EPD</strong> <strong>of</strong> +20<br />
Mcal/month his <strong>of</strong>fspring will require approximately 23 lbs<br />
(20/0.86) more dry matter per month than <strong>of</strong>fspring <strong>of</strong> the<br />
sire with an ME <strong>EPD</strong> <strong>of</strong> 0. Magnify that difference over<br />
12 months and 100 cows: you’ll have to come up with<br />
another 14 tons <strong>of</strong> feed, or get rid <strong>of</strong> a few cows.<br />
How is ME <strong>EPD</strong> calculated?<br />
There are three components <strong>of</strong> ME <strong>EPD</strong>: Mature Weight,<br />
Milk, and Body Condition Score (BCS). To calculate ME<br />
<strong>EPD</strong>, <strong>Red</strong> <strong>Angus</strong> breeders collect mature cow weights<br />
(taken when calves are weaned) and BCS (cows should<br />
be scored when weighed). The Mature Weights are<br />
adjusted to 5 years <strong>of</strong> age, and to a common BCS <strong>of</strong> 5. It<br />
is essential that all cows in the same contemporary group<br />
are scored by the same person. BCS plays an important<br />
role in calculating <strong>Red</strong> <strong>Angus</strong>' ME <strong>EPD</strong> as it is essential<br />
that mature weight be standardized to body condition.<br />
Think <strong>of</strong> it this way:<br />
A BCS 7 cow that weighs 1200 lbs is really a "FAT" 1100<br />
lb cow. Likewise, a BCS 3 cow that weighs 1200 lbs is<br />
really a "Skinny” 1350 lb cow.<br />
Why does Milk <strong>EPD</strong> play a role in ME <strong>EPD</strong> - My<br />
cows are dry through the winter anyway?<br />
Higher milking cattle have greater visceral organ mass.<br />
The machinery that makes the milk still has to be maintained<br />
even when the cow is not lactating.<br />
ME <strong>EPD</strong> helps ensure environmental fit.<br />
Cattle run in all types <strong>of</strong> environments, and each has different<br />
available feedstuffs. When cattle have higher maintenance<br />
energy requirements than their environment will support,<br />
producers must supplement feed, decrease stocking<br />
rate or accept decreasing body condition scores <strong>of</strong> their animals,<br />
which can adversely affect reproductive performance.<br />
Maintenance "Curve Benders"<br />
While higher milking, higher growth (larger mature size) cattle<br />
typically have higher maintenance requirements, there<br />
are many <strong>Red</strong> <strong>Angus</strong> sire choices that defy these antagonisms<br />
- actually combining positive revenue traits (Growth<br />
and Milk) with negative Expense Traits (ME).<br />
The Expense side <strong>of</strong> ranchers’ pr<strong>of</strong>it equation<br />
Pr<strong>of</strong>it equals revenue minus expenses. Select for ME<br />
<strong>EPD</strong> in conjunction with revenue trait <strong>EPD</strong>s to ensure feed<br />
costs don't get out <strong>of</strong> line with selection for greater performance<br />
and production. Single trait selection for ME ignores<br />
revenue, thus ignoring pr<strong>of</strong>it.<br />
36 <strong>America</strong>n <strong>Red</strong> <strong>Angus</strong> Magazine ■ January 2009
Traits that add weight<br />
to your bank account!<br />
These beef industry standard <strong>EPD</strong>s represent obvious revenue traits for cow/calf<br />
operators and feeders. <strong>Red</strong> <strong>Angus</strong> <strong>EPD</strong>s are the only ones built through the use<br />
<strong>of</strong> Total Herd Reporting.<br />
Birth Weight <strong>EPD</strong> (BW) predicts the difference, in<br />
pounds, for birth weight, and is also used in the calculation<br />
<strong>of</strong> <strong>Red</strong> <strong>Angus</strong>' Calving Ease Direct (CED)<br />
<strong>EPD</strong>.<br />
Weaning Weight <strong>EPD</strong> (WW) predicts the difference,<br />
in pounds, for weaning weight (adjusted to age<br />
<strong>of</strong> dam and a standard 205 days <strong>of</strong> age). This is an<br />
indicator <strong>of</strong> growth from birth to weaning.<br />
Yearling Weight <strong>EPD</strong> (YW) predicts the expected<br />
difference, in pounds, for yearling weight (adjusted<br />
to a standard 365 days <strong>of</strong> age). This is an indicator<br />
<strong>of</strong> growth from birth to yearling.<br />
Milk <strong>EPD</strong> (MILK) predicts the difference in maternal<br />
production <strong>of</strong> an individual animal's daughters as<br />
expressed by the weaning weight <strong>of</strong> their calves.<br />
Total Maternal <strong>EPD</strong> (TM) predicts the rancher's<br />
actual observation <strong>of</strong> weaning weights <strong>of</strong> calves<br />
raised by an animal's daughters. TM includes the<br />
daughters milk <strong>EPD</strong> plus half <strong>of</strong> her genetic contribution<br />
to her calf's weaning weight <strong>EPD</strong>. The formula<br />
for TM <strong>EPD</strong> is:<br />
TM <strong>EPD</strong> = Milk <strong>EPD</strong> + 1 / 2 (WW <strong>EPD</strong>)<br />
2/3 <strong>of</strong> yearling<br />
<strong>Red</strong> <strong>Angus</strong> bulls fit<br />
in this <strong>EPD</strong> range<br />
BW = 2.5 BW = -1.9<br />
2/3 <strong>of</strong> yearling<br />
<strong>Red</strong> <strong>Angus</strong> bulls fit<br />
in this <strong>EPD</strong> range<br />
WW = 23 WW = 39<br />
2/3 <strong>of</strong> yearling<br />
<strong>Red</strong> <strong>Angus</strong> bulls fit<br />
in this <strong>EPD</strong> range<br />
YW = 41 YW = 69<br />
2/3 <strong>of</strong> yearling<br />
<strong>Red</strong> <strong>Angus</strong> bulls fit<br />
in this <strong>EPD</strong> range<br />
Milk = 11 Milk = 21<br />
2/3 <strong>of</strong> yearling<br />
<strong>Red</strong> <strong>Angus</strong> bulls fit<br />
in this <strong>EPD</strong> range<br />
TM = 25 TM = 39<br />
Bred in Carcass Premiums<br />
Branded products and value-based grids have increased the focus on carcass traits as producers<br />
target these value added markets. <strong>Red</strong> <strong>Angus</strong> utilizes actual carcass data combined<br />
with real time ultrasound data to calculate their marbling and Rib-eye area <strong>EPD</strong>s.<br />
<strong>Red</strong> <strong>Angus</strong> takes the road less traveled in the prediction <strong>of</strong> Fat thickness, where only carcass<br />
data is used. Because ultrasound fat thickness is positively correlated to yearling<br />
growth and yearling REA, selection for leaner scanning bulls would select against the good<br />
doing, more heavily muscled bulls.<br />
Marbling Score (MARB) predicts differences for<br />
carcass marbling score as expressed in marbling score<br />
units. Higher marbling scores are positively correlated<br />
with higher carcass quality grades.<br />
Rib Eye Area (REA) predicts differences <strong>of</strong> carcass<br />
rib eye area between the 12th and 13th rib. Rib<br />
eye area is positively correlated with carcass yield<br />
grade which also considers fat thickness and carcass<br />
weights.<br />
12th Rib Fat Thickness (FAT) predicts differences<br />
for carcass fat depth over the 12th rib, as expressed in<br />
inches. Fat thickness is negatively correlated with carcass<br />
yield grade which also considers rib eye area and<br />
carcass weights.<br />
2/3 <strong>of</strong> yearling<br />
<strong>Red</strong> <strong>Angus</strong> bulls fit<br />
in this <strong>EPD</strong> range<br />
MARB = -.04 MARB = .18<br />
2/3 <strong>of</strong> yearling<br />
<strong>Red</strong> <strong>Angus</strong> bulls fit<br />
in this <strong>EPD</strong> range<br />
REA = -.10 REA = .24<br />
2/3 <strong>of</strong> yearling<br />
<strong>Red</strong> <strong>Angus</strong> bulls fit<br />
in this <strong>EPD</strong> range<br />
FAT = .01 FAT = -.01<br />
38 <strong>America</strong>n <strong>Red</strong> <strong>Angus</strong> Magazine ■ January 2009
Pr<strong>of</strong>it starts at Reproduction!<br />
Research has shown that reproduction has four to ten times the economic impact <strong>of</strong><br />
carcass traits. Yet many breeds have limited or no genetic measures <strong>of</strong> reproductive<br />
merit. <strong>Red</strong> <strong>Angus</strong> is the only breed that completely describes cow herd reproduction<br />
from birth through pr<strong>of</strong>itable lifespan. <strong>Red</strong> <strong>Angus</strong>’ unique utilization <strong>of</strong> Total<br />
Herd Reporting allows the breeding and subsequent pregnancy/calving <strong>of</strong> each<br />
replacement heifer retained or purchased to be reported.<br />
The data reported for these <strong>EPD</strong>s are categorical measures (yes or<br />
no answers) to the respective observation.<br />
TRAIT positive observation negative observation<br />
CED unassisted birth assisted birth<br />
HPG pregnant open<br />
CEM unassisted calving assisted calving<br />
STAY still productive after age 6 not productive after age six<br />
Pr<strong>of</strong>itable Reproduction can be boiled down to<br />
success in these four Economically Relevant Traits:<br />
Each is expressed in percent probability, meaning the higher the <strong>EPD</strong>,<br />
the more likely the positive observation.<br />
Calving Ease Direct (CED) - predicts the probability <strong>of</strong> calves being born<br />
unassisted out <strong>of</strong> two year-old heifers. Producers want live calves - born unassisted.<br />
Selecting on actual birth weight is flawed; it is influenced by non-genetic<br />
factors such as nutrition and weather (ambient temperature). While BW <strong>EPD</strong><br />
removes these non-genetic factors, <strong>Red</strong> <strong>Angus</strong>’ CED <strong>EPD</strong> is the best predictor <strong>of</strong><br />
calving ease. The CED <strong>EPD</strong> includes variation in BW plus other influential genetic<br />
factors such as gestation length, calf shape, etc.<br />
Heifer Pregnancy (HPG) - predicts the probability <strong>of</strong> heifers conceiving to<br />
calve at two years <strong>of</strong> age. Many breeds <strong>of</strong>fer genetic predictions <strong>of</strong> yearling bull<br />
scrotal circumference as an indicator <strong>of</strong> age <strong>of</strong> puberty. While puberty is a prerequiste,<br />
many factors influence pregnancy rate. <strong>Red</strong> <strong>Angus</strong>’ HPG <strong>EPD</strong> <strong>of</strong>fers a tool<br />
which selects for what is economically relavant to ranchers - pregnant heifers.<br />
Calving Ease Maternal (CEM) - predicts the probability <strong>of</strong> a given animal's<br />
daughters calving unassisted at two years <strong>of</strong> age. Replacement heifers<br />
should be able to calve on their own. <strong>Red</strong> <strong>Angus</strong>' CEM <strong>EPD</strong> <strong>of</strong>fers the industry's<br />
most reliable prediction to address that concern. It includes not only the predisposition<br />
for a female to calve unassisted, but also her contribution to her calf's traits<br />
(birth weight, calf shape, etc.) that make it more likely to be born assisted.<br />
Stayability (STAY) - predicts the probability that a bull's daughters will<br />
remain in the herd until at least six years <strong>of</strong> age. University studies have<br />
shown the breakeven point on replacement heifers is five to six years <strong>of</strong> age.<br />
Females that don't stay in the herd that long are losing money, and they also contribute<br />
to a higher rate <strong>of</strong> replacement females that producers must retain instead<br />
<strong>of</strong> being cash cropped.<br />
2/3 <strong>of</strong> yearling<br />
<strong>Red</strong> <strong>Angus</strong> bulls fit<br />
in this <strong>EPD</strong> range<br />
CED = 1 CED = 9<br />
2/3 <strong>of</strong> proven<br />
<strong>Red</strong> <strong>Angus</strong> bulls fit<br />
in this <strong>EPD</strong> range<br />
HPG = 7 HPG = 11<br />
2/3 <strong>of</strong> yearling<br />
<strong>Red</strong> <strong>Angus</strong> bulls fit<br />
in this <strong>EPD</strong> range<br />
CEM = 1 CEM = 7<br />
2/3 <strong>of</strong> yearling<br />
<strong>Red</strong> <strong>Angus</strong> bulls fit<br />
in this <strong>EPD</strong> range<br />
STAY = 8 STAY = 14<br />
40 <strong>America</strong>n <strong>Red</strong> <strong>Angus</strong> Magazine ■ January 2009
Genetic decisions come with long term implications for producer pr<strong>of</strong>its...<br />
Match selection pressure to meet your program’s needs:<br />
1. Building a cow herd?<br />
■ Combine low expense traits (ME <strong>EPD</strong>) with acceptable revenue traits (TM, WW) to breed efficiency into the cow herd.<br />
■ Improve fertility with selection pressure on HPG <strong>EPD</strong>s.<br />
■ Sleep through the night by selecting high CEM <strong>EPD</strong>s.<br />
■ Lower replacement rates by selecting higher than average Stayability (STAY) <strong>EPD</strong>s.<br />
2. Breeding virgin heifers?<br />
■ Select for CED <strong>EPD</strong> as the most meaningful predictor <strong>of</strong> calving ease. BW is nested in this prediction, so selection for higher CED<br />
<strong>EPD</strong>s will typically select for lower BW <strong>EPD</strong>s.<br />
3. Selling calves or yearlings?<br />
■ Heavier payweights may be achieved by selecting higher WW <strong>EPD</strong>s, but...make sure heavier is what you want. Heavier weaning<br />
weights mean heavier payweights for calf feds, however, for those who backgound their calves, too much weaning weight could<br />
translate into yearlings that are too heavy when they enter the feed yard, and finish too late. Overshooting performance goals<br />
can be just as detrimental as falling short.<br />
■ Enhance your reputation - improve traits that impact feeder pr<strong>of</strong>its, such as carcass traits and post-weaning gain (YW).<br />
4. Retaining Ownership?<br />
■ Docile and fast starting, <strong>Red</strong> <strong>Angus</strong> are easy to start on feed and keep on feed.<br />
■ Balance YW <strong>EPD</strong> <strong>of</strong> potential bulls with the existing cow herd to pinpoint needed improvement for post weaning gains.<br />
5. Selling on a Grid?<br />
Target your market<br />
and work backwards<br />
to find the right bulls…<br />
After all, your marketing objectives become<br />
part <strong>of</strong> your operation’s environment - same<br />
as rainfall and available feedstuffs.<br />
Therefore, follow these steps when selecting<br />
bulls:<br />
1) Know the markets you wish to hit: feeder calves, yearlings,<br />
value based grids, replacement females.<br />
2) Have a true appraisal <strong>of</strong> how close your cow herd is to that<br />
target; understanding your cows have to continue to live and<br />
reproduce in your environment.<br />
3) Identify bulls whose <strong>EPD</strong>s predict the ability to move your<br />
cow herd in the right direction for the traits required to hit<br />
your market endpoint.<br />
■ Fine-tune marbling (MARB), rib eye area (REA), and back fat (FAT) <strong>EPD</strong>s to target quality or yield grade based grids.<br />
■ Balance Carcass <strong>EPD</strong>s against existing cow herd; breeding towards a goal <strong>of</strong> Choice YG 3's or better.<br />
• Cowherds <strong>of</strong> higher continental influence may require additional selection pressure on marbling <strong>EPD</strong> to improve quality grade.<br />
• High percentage British cowherds typically benefit from selection for larger ribeye <strong>Red</strong> <strong>Angus</strong> or <strong>Red</strong> <strong>Angus</strong> x Continental hybrid bulls.<br />
Be sure to join us online at DVAuction.com<br />
for more <strong>of</strong> the Ranchers’ Guide Series!<br />
Visit us at <strong>Red</strong><strong>Angus</strong>.org<br />
for future episodes and times.<br />
Please feel free to contact the<br />
<strong>Red</strong> <strong>Angus</strong> <strong>Association</strong> <strong>of</strong> <strong>America</strong><br />
if you have further questions, or<br />
need assistance with <strong>EPD</strong>s or in<br />
the selection <strong>of</strong> new herd sires(s).<br />
42 <strong>America</strong>n <strong>Red</strong> <strong>Angus</strong> Magazine ■ January 2009