View - Uppsala Monitoring Centre
View - Uppsala Monitoring Centre
View - Uppsala Monitoring Centre

Create successful ePaper yourself
Turn your PDF publications into a flip-book with our unique Google optimized e-Paper software.
Drug Safety 2008; 31 (11): 1035-1048<br />
ORIGINAL RESEARCH ARTICLE 0114-5916/08/0011-1035/$48.00/0<br />
© 2008 Adis Data Information BV. All rights reserved.<br />
Impact of Stratification on Adverse<br />
Drug Reaction Surveillance<br />
Johan Hopstadius, 1 G. Niklas Norén, 1,2 Andrew Bate 1,3 and I. Ralph Edwards 1<br />
1 <strong>Uppsala</strong> <strong>Monitoring</strong> <strong>Centre</strong>, WHO Collaborating <strong>Centre</strong> for International Drug <strong>Monitoring</strong>,<br />
<strong>Uppsala</strong>, Sweden<br />
2 Department of Mathematics, Stockholm University, Stockholm, Sweden<br />
3 School of Information Systems, Computing and Mathematics, Brunel University, London, UK<br />
Abstract<br />
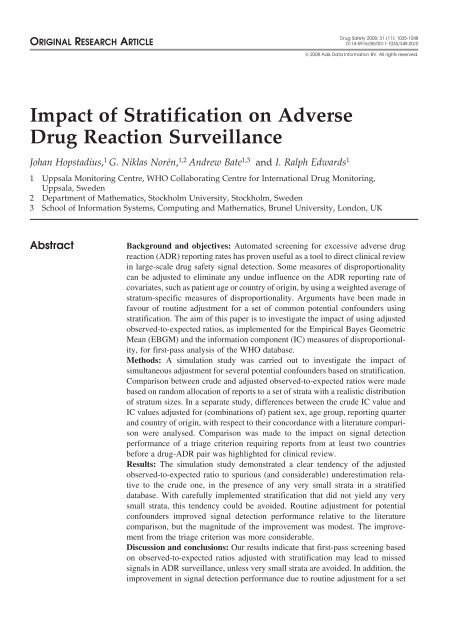
Background and objectives: Automated screening for excessive adverse drug<br />
reaction (ADR) reporting rates has proven useful as a tool to direct clinical review<br />
in large-scale drug safety signal detection. Some measures of disproportionality<br />
can be adjusted to eliminate any undue influence on the ADR reporting rate of<br />
covariates, such as patient age or country of origin, by using a weighted average of<br />
stratum-specific measures of disproportionality. Arguments have been made in<br />
favour of routine adjustment for a set of common potential confounders using<br />
stratification. The aim of this paper is to investigate the impact of using adjusted<br />
observed-to-expected ratios, as implemented for the Empirical Bayes Geometric<br />
Mean (EBGM) and the information component (IC) measures of disproportionality,<br />
for first-pass analysis of the WHO database.<br />
Methods: A simulation study was carried out to investigate the impact of<br />
simultaneous adjustment for several potential confounders based on stratification.<br />
Comparison between crude and adjusted observed-to-expected ratios were made<br />
based on random allocation of reports to a set of strata with a realistic distribution<br />
of stratum sizes. In a separate study, differences between the crude IC value and<br />
IC values adjusted for (combinations of) patient sex, age group, reporting quarter<br />
and country of origin, with respect to their concordance with a literature comparison<br />
were analysed. Comparison was made to the impact on signal detection<br />
performance of a triage criterion requiring reports from at least two countries<br />
before a drug-ADR pair was highlighted for clinical review.<br />
Results: The simulation study demonstrated a clear tendency of the adjusted<br />
observed-to-expected ratio to spurious (and considerable) underestimation relative<br />
to the crude one, in the presence of any very small strata in a stratified<br />
database. With carefully implemented stratification that did not yield any very<br />
small strata, this tendency could be avoided. Routine adjustment for potential<br />
confounders improved signal detection performance relative to the literature<br />
comparison, but the magnitude of the improvement was modest. The improvement<br />
from the triage criterion was more considerable.<br />
Discussion and conclusions: Our results indicate that first-pass screening based<br />
on observed-to-expected ratios adjusted with stratification may lead to missed<br />
signals in ADR surveillance, unless very small strata are avoided. In addition, the<br />
improvement in signal detection performance due to routine adjustment for a set
1036 Hopstadius et al.<br />
of common confounders appears to be smaller than previously assumed. Other<br />
approaches to improving signal detection performance such as the development of<br />
refined triage criteria may be more promising areas for future research.<br />
Background<br />
of the ADR in the database. [3] It is a so-called<br />
shrinkage measure that tends to the baseline value of<br />
The analysis of individual case safety reports 0, until a large enough number of reports on a<br />
(ICSRs) related to suspected adverse drug reaction particular drug-ADR pair have accumulated. This<br />
(ADR) incidents in clinical practice remains the decreases the risk of highlighting chance dispropormost<br />
important method to discover unexpected ad- tionality. The formulae for computing the IC are<br />
verse effects from drug substances that are already complicated, but well approximated by equation<br />
on the market. [1] ICSR submission is also sometimes 1: [11]<br />
referred to as spontaneous reporting. The <strong>Uppsala</strong><br />
O xy + 1/2<br />
<strong>Monitoring</strong> <strong>Centre</strong> (UMC) maintains and analyses IC = log 2<br />
E xy + 1/2<br />
the world’s largest database of international ADR<br />
reports on behalf of the WHO Programme for Interwhere<br />
Oxy is the observed number of reports on the<br />
(Eq. 1)<br />
national Drug <strong>Monitoring</strong>. The main use of the<br />
WHO database is to raise hypotheses about suspectnumber<br />
of such reports conditional on the overall<br />
ADR and the drug together and Exy is the expected<br />
ed ADRs, also referred to as signals. The WHO<br />
definition of a signal is:<br />
relative reporting rate of the ADR in the database<br />
“Reported information on a possible causal reladatabase.<br />
Accurate formulae for 95% credibility in-<br />
and the total number of reports on the drug in the<br />
tionship between an adverse event and a drug, the<br />
relationship being unknown or incompletely docuavailable.<br />
tervals for both the crude and the adjusted IC are<br />
mented previously. Usually more than a single reinterval<br />
[9] The lower limit of the 95% credibility<br />
port is required to generate a signal, depending<br />
is referred to as IC025, and is the standard<br />
upon the seriousness of the event and the quality of measure used to screen the WHO database for ex-<br />
the information.” [2]<br />
cessive ADR relative reporting rates. The Empirical<br />
While careful clinical review of ICSRs remains a Bayes Geometric Mean (EBGM) is an alternative<br />
critical and irreplaceable step of the signal detection shrinkage measure based on the same observed-toprocess,<br />
knowledge discovery methods are becomties.<br />
expected ratio as the IC and with similar proper-<br />
ing increasingly important to filter the massive<br />
[12,13]<br />
amounts of data for interesting associations and for Disproportionality analysis is only the first step<br />
pattern recognition to identify unexpected character- in the UMC knowledge discovery process. Triage<br />
istics of groups of ICSRs. [3,4] A knowledge discovfocus<br />
(prioritization) algorithms have been designed to<br />
ery framework for hypothesis generation in ADR<br />
attention on the drug-ADR pairs for which<br />
surveillance has been in routine use as part of the follow-up is most urgent and to highlight drug-ADR<br />
UMC signal detection process since 1998 [5] and has pairs also in the absence of disproportional reporting<br />
helped highlight several important drug safety probviewed<br />
rates. [14] All highlighted drug-ADR pairs are re-<br />
lems later published in the medical literature. [6,7]<br />
by subject matter experts to identify issues<br />
Central to the initial phase of UMC’s knowledge worthy of general communication.<br />
discovery framework is the information component An important obstacle in the analysis of any<br />
(IC) measure of disproportionality. [3,8-10] The IC is observational dataset is the possible presence of<br />
based on an observed-to-expected ratio that con- measured or unmeasured confounders – covariates<br />
trasts the relative reporting rate of an ADR given a that distort the quantitative relationships under<br />
particular drug to the overall relative reporting rate study. Downward confounders are covariates that<br />
© 2008 Adis Data Information BV. All rights reserved. Drug Safety 2008; 31 (11)
Impact of Stratification on ADR Surveillance 1037<br />
mask true intrinsic associations. An example in the<br />
WHO database is the negative crude IC value for the<br />
association between tamoxifen and impotence. [15]<br />
Tamoxifen is primarily used in women and impo-<br />
tence primarily affects men. The expected number<br />
of reports on tamoxifen and impotence, taking this<br />
into account, is considerably less than the crude<br />
expected number based on the number of reports on<br />
tamoxifen and the number of reports on impotence<br />
in the database. This leads to the lower crude than<br />
adjusted IC value. In contrast, upward confounders<br />
are covariates that result in false apparent associations<br />
between events of interest. An example in the<br />
WHO database is the positive crude IC value for the<br />
association between Haemophilus influenzae type B<br />
vaccine and fever convulsions. [15] This is due to the<br />
lower rate of fever convulsions in the database as a<br />
whole than in the young children to whom the<br />
vaccine is primarily given, which leads to an underestimated<br />
expected number of reports.<br />
Adjustment of the IC for potential confounders is<br />
possible by stratifying the database into subgroups<br />
based on each report’s value for the suspected confounder,<br />
and replacing the overall expected count in<br />
the equation for computing the IC value (equation 1)<br />
by a sum over stratum-specific expected counts. [9,12]<br />
This may eliminate the unwanted impact of the<br />
confounder adjusted for. However, when there is<br />
considerable variation between strata, no overall<br />
measure is appropriate. Confounding can only be<br />
evaluated in the absence of effect modification.<br />
The first-pass screening for disproportional re-<br />
porting rates in the WHO database has traditionally<br />
been based on crude IC values. [3,8-10] The advantages<br />
of this are transparency and computational efficiency.<br />
As a complement, stratum-specific variation is<br />
also considered. [10] Arguments have been made in<br />
favour of routine adjustment based on stratification.<br />
[12] However, although a range of comparative<br />
studies to investigate the performance of different<br />
data-mining algorithms for ICSRs have been carried<br />
out, [16-19] few have explicitly considered the impact<br />
of routine adjustment for potential confounders<br />
based on stratification. One exception is the study by<br />
Almenoff et al., [20] who found that the number of<br />
associations highlighted based on the EBGM disproportionality<br />
measure decreased with stratification.<br />
However, this study did not investigate to what<br />
extent stratification selectively eliminated the false<br />
positives or also led to missed true signals. Indeed,<br />
in an earlier study of the WHO database based on a<br />
fixed threshold at IC025>0, simultaneous adjustment<br />
for patient age, patient sex, reporting quarter and<br />
country of origin increased specificity at the expense<br />
of decreased sensitivity relative to a literature refer-<br />
ence. [15]<br />
Aim<br />
The aim of this paper is to determine to what<br />
extent routine adjustment for a set of potential con-<br />
founders based on stratification improves first-pass<br />
screening of the WHO database, and to investigate<br />
whether stratification that is too fine may have a<br />
negative impact on the adjusted observed-to-expec-<br />
ted ratio.<br />
Methods<br />
Data Source<br />
The studies presented in this paper are based on<br />
data from the WHO database as of 30 September<br />
2006. At that point in time, the database contained<br />
more than 3.7 million reports of suspected ADRs –<br />
the first of which dated back to 1967. All in all, over<br />
700 000 unique drug-ADR pairs had been reported<br />
together at least once in the database. More than 80<br />
countries participated in the programme and the<br />
current inflow of new reports was in the order of<br />
200 000 per year.<br />
Covariates<br />
There is a wide range of potential confounders in<br />
ADR surveillance, which cannot all be accounted<br />
for routinely in first-pass disproportionality ana-<br />
lysis. A feasible approach is to routinely adjust for a<br />
more restricted selection of covariates expected to<br />
be the most important confounders in general. In<br />
observed-to-expected ratio-based disproportionality<br />
analysis with the EBGM, patient age, patient sex<br />
© 2008 Adis Data Information BV. All rights reserved. Drug Safety 2008; 31 (11)
1038 Hopstadius et al.<br />
and time of reporting are routinely adjusted for. [13,14] base as of 30 September 2006 were partitioned into<br />
For international ADR surveillance, it has been ar- 34 756 different strata of varying sizes. To eliminate<br />
gued that country of origin is also an important any true confounding due to the four covariates by<br />
potential confounder. [21] As a consequence, we limit which data were originally stratified, all reports<br />
the following studies to these four covariates. Al- were randomly re-allocated across strata while<br />
though concomitant medication is likely to be one of keeping the resulting numbers of reports per stratum<br />
the most important types of confounders in ADR fixed. Crude and adjusted observed-to-expected rasurveillance,<br />
we do not consider it further in the tios were calculated based on this simulated stratificontext<br />
of this paper. It has earlier been demonstra- cation. As the allocation of reports to strata was<br />
ted that routine simultaneous adjustment for all random, the simulated stratification should have no<br />
possible combinations of concomitant medication true impact on the observed-to-expected ratio, and<br />
using stratification leads quickly to a large number any systematic differences between the crude and<br />
of very small strata and to severe overstratification adjusted observed-to-expected ratios would indicate<br />
where the adjusted observed-to-expected ratio tends a potential problem with the adjusted observed-toto<br />
1, even for the most excessive crude relative expected ratio. To investigate the impact of<br />
reporting rates. [15] As a consequence, routine adjust- shrinkage on the potential vulnerability of the obment<br />
for co-medication would require a different served-to-expected ratio to overstratification, we<br />
approach, such as shrinkage regression. [22]<br />
also compared crude and adjusted IC values based<br />
on the simulated stratification. In order to show<br />
A Simulation Study of the Impact<br />
whether any sensitivity to overstratification is a<br />
of Overstratification<br />
property of the observed-to-expected ratio on which<br />
the IC and the EBMG are based, and not an artefact<br />
The adjusted observed-to-expected ratio dis- of the specific shrinkage used, the simulation study<br />
cussed in the Background section is similar to the considered both shrunk and unshrunk measures. The<br />
Mantel-Haenszel odds ratio in that both can be seen mathematical details that motivate why vulnerabilias<br />
weighted averages of stratum-specific measures ty for overstratification is a property of the observof<br />
association. One advantage of the Mantel-Haen- ed-to-expected ratio are given in the Appendix.<br />
szel odds ratio [23] is that it is also accurate for sparse<br />
data. [24] However, it is unclear whether the same A Database Study of the Impact of Different<br />
property holds for the adjusted observed-to-expec- Potential Confounders<br />
ted ratio. We wanted to investigate the impact of<br />
adjusting the observed-to-expected ratio for several Under the assumption that overstratification may<br />
potential confounders at once using stratification. be a problem for measures of disproportionality<br />
For this purpose, we partitioned the WHO data- based on the observed-to-expected ratio, it is imporbase<br />
based on a cross-classification of reports into tant to find ways to reduce the stratification granusubcategories<br />
based on patient sex, patient age larity. One approach is to decrease the number of<br />
group, country of origin and time of reporting. We potential confounders adjusted for. The main quesused<br />
the standard age groups already available in tion then is which of our four potential confounders<br />
the WHO database (age unspecified; 0–1 month; have the most considerable overall impact on drug-<br />
2 months–4 years; 5–11 years; 12–16 years; 17–69 ADR disproportionality in the WHO database. To<br />
years; and 70+ years), we divided reporting time be able to determine this, we investigated to what<br />
into quarterly (3-month) intervals, in correspon- extent adjustment by different sets of covariates led<br />
dence with the intervals in which the WHO database to differences between the crude and adjusted IC<br />
is routinely screened, and we used separate strata for values. We also studied to what extent adjustment<br />
each country of origin. This produced a stratification for different sets of confounders improved signal<br />
where the 3 704 938 case reports in the WHO data- detection performance in ADR surveillance. The<br />
© 2008 Adis Data Information BV. All rights reserved. Drug Safety 2008; 31 (11)
Impact of Stratification on ADR Surveillance 1039<br />
lack of a general ‘gold standard’ for evaluating 1986–90; 1991–3; 1994–6; 1997–9; 2000–2; and<br />
signal detection performance has been discussed 2003–6 (the interval length diminishing with calenelsewhere.<br />
[25] We used as a reference here the overcreases).<br />
dar time as the number of reports per year in-<br />
view of first published case reports of suspected<br />
In addition, countries with
1040 Hopstadius et al.<br />
15<br />
13<br />
11<br />
9<br />
7<br />
5<br />
3<br />
1<br />
–1<br />
–3<br />
–5<br />
–7<br />
–9<br />
–11<br />
–13<br />
–15<br />
–15–13–11 –9 –7 –5 –3 –1 1 3 5 7 9 11 13 15<br />
log 2 Observed/expected<br />
Fig. 1. Adjusted vs crude observed-to-expected ratios for a random<br />
allocation of reports to strata with the same size distribution as the<br />
WHO database when simultaneously stratified by patient sex, patient<br />
age (seven groups), country of origin and time of reporting (in<br />
quarterly intervals).<br />
log 2 Observed/expected adjusted for random strata<br />
cies in the signals of disproportional reporting highlighted<br />
with the two measures and therefore emerging<br />
drug safety issues that could be missed. At least<br />
for some drug-ADR pairs, the spurious underestimation<br />
is considerable and likely to outweigh any beneficial<br />
impact of actual confounder elimination in a<br />
real-world analysis.<br />
The numbers quoted in the previous paragraph<br />
are from a single realization of the simulation experiment.<br />
To confirm that variability in the simulation<br />
results is not excessive, we repeated the experiment<br />
five times. All quoted results were stable over these<br />
repeated simulations. For example, the number of<br />
drug-ADR pairs for which the absolute value of the<br />
difference between the crude and adjusted log observed-to-expected<br />
ratio exceeds 1 varied between<br />
3047 and 3177. For the IC, the corresponding range<br />
was 505–614.<br />
Database Study<br />
observed-to-expected ratio to spuriously fall below<br />
that of the crude (in particular for large crude ob-<br />
served-to-expected ratios). For most combinations,<br />
the difference between the crude and the adjusted<br />
observed-to-expected ratios is only minor as seen in<br />
figure 2, which is a histogram of the difference<br />
between the crude and the adjusted observed-toexpected<br />
ratios. Altogether, there are 3044 drug-<br />
ADR pairs for which the logarithm of the adjusted<br />
observed-to-expected ratio falls more than 1 unit<br />
below that of the crude, and 5 drug-ADR pairs for<br />
which the logarithm of the adjusted observed-toexpected<br />
ratio exceeds that of the crude by more<br />
than 1 unit. Figures 3 and 4 display the same graphs<br />
based on IC values. Shrinkage reduces but does not<br />
eliminate the problem with spurious underestimation.<br />
There are 565 drug-ADR pairs for which the<br />
adjusted IC falls more than 1 unit below that of the<br />
crude. These are considerable differences in that<br />
they correspond to an overestimation of >100% or<br />
an underestimation of >50% of the underlying observed-to-expected<br />
ratio. For 2127 drug-ADR pairs,<br />
the crude but not the adjusted IC025 exceeds 0, and<br />
for 1039 drug-ADR pairs, the adjusted but not the<br />
crude IC025 exceeds 0. These represent discrepan-<br />
Figure 5 illustrates the general impact of the four<br />
different covariates on drug-ADR disproportionality<br />
in the WHO database. The scatter plots compare<br />
crude and adjusted IC values for all drug-ADR<br />
associations with at least three reports in the WHO<br />
database. The more the point clouds deviate from a<br />
narrow diagonal line, the greater are the discrepancies<br />
between crude and adjusted IC values. Clearly,<br />
Number of drug-ADR combinations (×10 4 )<br />
3<br />
2.5<br />
2<br />
1.5<br />
1<br />
0.5<br />
0<br />
–2 –1.5 –1 –0.5 0 0.5 1 1.5 2<br />
log 2 (Obs/Exp crude ) –log 2 (Obs/Exp adjusted )<br />
Fig. 2. Histogram displaying the difference between the crude and<br />
the adjusted log observed-to-expected ratios. This corresponds to<br />
the spread perpendicular to the diagonal of figure 1. ADR = adverse<br />
drug reaction.<br />
© 2008 Adis Data Information BV. All rights reserved. Drug Safety 2008; 31 (11)
Impact of Stratification on ADR Surveillance 1041<br />
IC adjusted for random strata<br />
10<br />
8<br />
6<br />
4<br />
2<br />
0<br />
–2<br />
–4<br />
–6<br />
–8<br />
–10<br />
–10 –8 –6 –4 –2 0 2 4 6 8 10<br />
IC crude<br />
Fig. 3. Adjusted vs crude information component (IC) for a random<br />
allocation of reports to strata with the same size distribution as the<br />
WHO database when simultaneously stratified by patient sex, patient<br />
age (seven groups), country of origin and time of reporting (in<br />
quarterly intervals).<br />
the impact of patient sex is considerably less than<br />
that of the other three covariates.<br />
Figure 6 displays precision-recall graphs based<br />
on the crude IC025 value and based on IC025 values<br />
adjusted for each of the four covariates. Figure 7 is<br />
an enlarged version of figure 6, zoomed in around<br />
the area of the precision recall-graph corresponding<br />
to the current threshold (marked with an x) which is<br />
used routinely in the WHO database to highlight<br />
drug-ADR pairs for clinical review. Clearly, the<br />
adjustment by country of origin and year of reporting,<br />
respectively, led to the most considerable improvements<br />
in performance relative to the literature<br />
reference. Based on the major performance improvement<br />
of separate adjustment for country of<br />
origin and time of reporting, we wanted to investigate<br />
their combined effect. Figure 8 displays the<br />
precision-recall graph for simultaneous adjustment<br />
by time of reporting and country of origin. Precision-recall<br />
graphs based on crude IC025 values and<br />
IC025 values adjusted for country of origin or time of<br />
reporting are included for comparison. Figure 9 is an<br />
enlarged version of figure 8, zoomed in around the<br />
area of the precision recall-graph corresponding to<br />
the current threshold (marked with an x). Clearly,<br />
simultaneous adjustment for the two covariates fur-<br />
ther improves performance relative to separate adjustment<br />
for either covariate. To demonstrate that<br />
the IC simultaneously adjusted for country of origin<br />
and time of reporting does not suffer from overstratification,<br />
figure 10 displays a comparison of adjusted<br />
and crude observed-to-expected ratios based on<br />
randomization of reports across strata as in the simulation<br />
described in the methods section. Figure 11<br />
demonstrates that the spurious differences between<br />
adjusted and crude observed-to-expected ratios are<br />
minimal with this stratification. We expect this is<br />
due to the avoidance of any strata with fewer than<br />
100 reports in this stratification approach.<br />
To put into perspective the magnitude of the<br />
performance improvement as a result of simultaneous<br />
adjustment of the IC 025 for time of reporting and<br />
country of origin, figure 12 displays precision-recall<br />
graphs for the crude and adjusted IC025 values together<br />
with precision-recall graphs for the crude and<br />
adjusted IC025 values when combined with a triage<br />
criterion requiring reports from more than one coun-<br />
try to highlight a drug-ADR pair for clinical review<br />
(as originally proposed by Ståhl et al. [14] ). While the<br />
adjustment for time of reporting and country of<br />
origin does improve performance both with and<br />
without the triage criterion, the magnitude of the<br />
improvement is rather small relative to that due to<br />
the triage criterion. This supports the comment by<br />
Number of drug-ADR combinations (×10 4 )<br />
3.5<br />
3<br />
2.5<br />
2<br />
1.5<br />
1<br />
0.5<br />
0<br />
–2 –1.5 –1 –0.5 0 0.5 1 1.5 2<br />
IC crude –IC adjusted<br />
Fig. 4. Histogram displaying the difference between the crude and<br />
the adjusted information component (IC). This corresponds to the<br />
spread perpendicular to the diagonal of figure 3. ADR = adverse<br />
drug reaction.<br />
© 2008 Adis Data Information BV. All rights reserved. Drug Safety 2008; 31 (11)
1042 Hopstadius et al.<br />
IC adjusted for sex<br />
IC adjusted for reporting country<br />
10<br />
8<br />
6<br />
4<br />
2<br />
0<br />
–2<br />
–4<br />
–6<br />
–8<br />
–10<br />
–10 –8 –6 –4 –2 0 2 4 6 8 10<br />
IC crude<br />
10<br />
8<br />
6<br />
4<br />
2<br />
0<br />
–2<br />
–4<br />
–6<br />
–8<br />
–10<br />
–10 –8 –6 –4 –2 0 2 4 6 8 10<br />
IC crude<br />
IC adjusted for year of reporting IC adjusted for age<br />
10<br />
8<br />
6<br />
4<br />
2<br />
0<br />
–2<br />
–4<br />
–6<br />
–8<br />
–10<br />
–10 –8 –6 –4 –2 0 2 4 6 8 10<br />
IC crude<br />
10<br />
8<br />
6<br />
4<br />
2<br />
0<br />
–2<br />
–4<br />
–6<br />
–8<br />
–10<br />
–10 –8 –6 –4 –2 0 2 4 6 8 10<br />
IC crude<br />
Fig. 5. Scatter plots of adjusted vs crude information component (IC) values for each of the four covariates considered in this paper, based<br />
on all drug-adverse drug reaction combinations with at least three reports in the WHO database.<br />
from routine adjustment for any potential confound-<br />
er(s) considered in this study.<br />
Bate et al. [28] that routine adjustment for a group of<br />
common confounders is perhaps not among the most<br />
important possible improvements to first-pass exploratory<br />
analysis of ICSRs.<br />
Summary<br />
Observed-to-expected ratios adjusted based on<br />
stratification must be carefully monitored for overstratification:<br />
the presence of any small strata may<br />
lead to spurious underestimation. Careful adjustment<br />
based on stratification by time interval of<br />
reporting and country of origin did improve signal<br />
detection performance in the WHO database relative<br />
to a literature reference. The general impact of adjusting<br />
based on stratification by patient age and sex<br />
was less. In contrast, the performance improvement<br />
due to a triage criterion requiring reports from more<br />
than one country to highlight a drug-ADR pair for<br />
clinical review was considerably greater than that<br />
Precision<br />
0.35<br />
0.30<br />
0.25<br />
0.20<br />
0.15<br />
0.10<br />
0.05<br />
Crude<br />
Patient sex<br />
Patient age<br />
Country of origin<br />
Year of reporting<br />
0.00<br />
0.0 0.1 0.2 0.3 0.4 0.5 0.6 0.7 0.8 0.9 1.0<br />
Recall<br />
Fig. 6. Graphs indicating the precision and recall relative to the<br />
literature reference at varying thresholds, for four different IC 025<br />
values: crude; adjusted for patient sex; patient age; time of reporting;<br />
and country of origin.<br />
© 2008 Adis Data Information BV. All rights reserved. Drug Safety 2008; 31 (11)
Impact of Stratification on ADR Surveillance 1043<br />
0.090<br />
0.085<br />
Crude<br />
Patient sex<br />
Patient age<br />
Country of origin<br />
Year of reporting<br />
0.090<br />
0.085<br />
Crude<br />
Country of origin<br />
Year of reporting<br />
Country of origin<br />
and year of reporting<br />
Precision<br />
0.080<br />
Precision<br />
0.080<br />
0.075<br />
0.075<br />
0.070<br />
0.52 0.53 0.54 0.55 0.56 0.57 0.58 0.59 0.6 0.61 0.62<br />
Recall<br />
Fig. 7. Enlarged version of figure 6 around the area corresponding<br />
to a threshold at IC 025 = 0. The exact points on the graphs corresponding<br />
to the threshold are marked with crosses.<br />
Discussion<br />
tios are vulnerable to overstratification. Even stratifying<br />
by a moderate number of covariates may lead<br />
to unreliable adjusted observed-to-expected ratios.<br />
In the WHO database, stratification by a dummy<br />
covariate with the size and number of strata as based<br />
on simultaneous adjustment by patient age, sex,<br />
reporting quarter and country of origin, led to con-<br />
siderable, spurious underestimation of both the adjusted<br />
observed-to-expected ratio and the adjusted<br />
IC. Because of this sensitivity of the adjusted observed-to-expected<br />
ratio to overstratification, strate-<br />
gies for routine adjustment of the IC or the EBGM<br />
Routine adjustment for a standard set of potential<br />
confounders based on stratification has been assumed<br />
to be a useful approach in first-pass screening<br />
of spontaneous reports for disproportional reporting<br />
rates. The higher specificity of the adjusted EBGM<br />
compared with the unadjusted EBGM observed in<br />
some empirical studies has been interpreted as evi-<br />
dence of successful confounder elimination; [20,29]<br />
however, our results indicate that spurious underestimation<br />
is an alternative explanation. In this paper,<br />
we have demonstrated that observed-to-expected ra-<br />
0.070<br />
0.52 0.53 0.54 0.55 0.56 0.57 0.58 0.59 0.6 0.61 0.62<br />
Recall<br />
Fig. 9. Enlarged version of figure 8 around the area corresponding<br />
to a threshold at IC 025 = 0. The exact points on the graphs corresponding<br />
to the threshold are marked with crosses.<br />
Precision<br />
0.35<br />
0.30<br />
0.25<br />
0.20<br />
0.15<br />
0.10<br />
0.05<br />
0.00<br />
0.0<br />
Crude<br />
Country of origin<br />
Year of reporting<br />
Country of origin and year of reporting<br />
0.1 0.2 0.3 0.4 0.5 0.6 0.7 0.8 0.9 1.0<br />
Recall<br />
Fig. 8. Graphs indicating the precision and recall relative to the<br />
literature reference at varying thresholds, for four different IC 025<br />
values: crude; adjusted for reporting time interval; adjusted for<br />
country of origin; and simultaneously adjusted for reporting time<br />
interval and country of origin.<br />
log 2 Observed/expected adjusted for<br />
country and year group<br />
10<br />
8<br />
6<br />
4<br />
2<br />
0<br />
–2<br />
–4<br />
–6<br />
–8<br />
–10<br />
–10 –8 –6 –4 –2 0 2 4 6 8 10<br />
log 2 Observed/expected<br />
Fig. 10. Adjusted vs crude log2 observed-to-expected ratios, for a<br />
random allocation of case reports to strata with the same size<br />
distribution as the WHO database when simultaneously stratified by<br />
reporting time interval and country of origin.<br />
© 2008 Adis Data Information BV. All rights reserved. Drug Safety 2008; 31 (11)
1044 Hopstadius et al.<br />
Number of drug-ADR combinations (×10 5 )<br />
3<br />
2.5<br />
2<br />
1.5<br />
1<br />
0.5<br />
0<br />
–2 –1.5 –1 –0.5 0 0.5 1 1.5 2<br />
IC crude –IC adjusted<br />
Fig. 11. Histogram displaying the difference between the crude and<br />
the adjusted log observed-to-expected ratios. This corresponds to<br />
the spread perpendicular to the diagonal of figure 10. ADR = adverse<br />
drug reaction.<br />
signal detection performance. Other choices are certainly<br />
possible, and may lead to slightly different<br />
results. However, we do not expect there to be<br />
systematic variations to the extent that our conclusions,<br />
with respect to the relative importance of<br />
routine adjustment for potential confounders, would<br />
be invalidated by a different choice of reference.<br />
The sensitivity of the observed-to-expected ratio to<br />
overstratification was demonstrated independently<br />
of the selected gold standard.<br />
An important advantage of adjustment based on<br />
stratification by country of origin and time of reporting<br />
is that it usually yields transparent adjusted<br />
measures that correspond closely to stratum-specific<br />
measures based on those time periods and countries<br />
in which both the drug and the ADR have been<br />
reported. In addition, there are no missing data for<br />
these covariates on any reports in the WHO data-<br />
base, and confounding by country of origin and time<br />
of reporting usually corresponds to aspects of data<br />
collection that may be more difficult to identify in<br />
clinical review than confounding by patient charac-<br />
teristics. At the same time, the lack of overall im-<br />
provement from adjusting for patient sex and age<br />
does not imply that these covariates are not some-<br />
times important confounders. Some examples of<br />
drug-ADR pairs with great discrepancies between<br />
crude IC values and IC values adjusted for patient<br />
based on stratification must be carefully designed so<br />
that they do not create any very small strata.<br />
In our simulation study, stratifying by the dummy<br />
covariate did not confound any drug-ADR pairs.<br />
Thus, the adjusted observed-to-expected ratio could<br />
at best perform as well as the crude ratio. In realworld<br />
data analysis, the adjusted observed-to-expected<br />
ratio may eliminate the impact of some confounders.<br />
However, the spurious underestimation in<br />
our simulation was of such magnitude that it cannot<br />
be assumed ignorable relative to any beneficial impact<br />
of successful elimination of confounding.<br />
While the unique international coverage of the<br />
WHO database makes it unusually heterogeneous,<br />
overstratification is an important concern also for<br />
more homogeneous datasets. The observed-to-expected<br />
ratio is sensitive to the presence of any small<br />
strata, and given the more limited scope of company<br />
ADR surveillance systems, even a partitioning of<br />
reports into the approximately 900 strata used in<br />
routine adjustment of the EBGM [29,30] will produce<br />
some very small strata. In addition, continuous ADR<br />
surveillance may lead to a situation where strata<br />
related to the most recent time period contain very<br />
few reports, regardless of overall dataset size. Clearly,<br />
careful adjustment of the observed-to-expected<br />
ratio is important in any analysis of ICSRs.<br />
We have chosen to use the first reports information<br />
in Reactions Weekly as reference for evaluating<br />
Precision<br />
0.7<br />
0.6<br />
0.5<br />
0.4<br />
0.3<br />
0.2<br />
0.1<br />
Adjusted with triage<br />
Crude with triage<br />
Adjusted without triage<br />
Crude without triage<br />
0<br />
0 0.1 0.2 0.3 0.4 0.5<br />
Recall<br />
0.6 0.7 0.8 0.9 1.0<br />
Fig. 12. Precision-recall graphs for the crude IC025 and the IC025<br />
simultaneously adjusted for reporting time interval and country of<br />
origin, with and without a triage criterion requiring reports from<br />
more than one country.<br />
© 2008 Adis Data Information BV. All rights reserved. Drug Safety 2008; 31 (11)
Impact of Stratification on ADR Surveillance 1045<br />
sex or age have previously been presented. [15,20]<br />
However, the majority of these examples corre-<br />
spond to simple stratum-specific effects, such as<br />
ADRs that by definition only ever affect male pa-<br />
tients, and they are usually easy to identify in the<br />
clinical review.<br />
Routine strategies to screen for stratum-specific<br />
disproportionality are clearly an important complement<br />
to screening for overall disproportionality.<br />
Moreover, if first-pass screening is based on unstratified<br />
disproportionality analysis, methods for highlighting<br />
suspected confounding are also important.<br />
A standard approach to data-driven confounder<br />
identification is to look for changes in a measure due<br />
to adjustment by different covariates. [15] A more<br />
open-ended approach may be to, as a first step, use<br />
disproportionality analysis to identify covariates<br />
that are disproportionally reported with both the<br />
drug and the ADR. This is an important area for<br />
future research.<br />
This paper has focused on the observed-to-expected<br />
ratio, primarily because it is the basis for routine<br />
surveillance of the WHO database. While extreme<br />
overstratification would have a negative impact also<br />
on adjusted proportional reporting ratios (PRRs) [4]<br />
and Mantel-Haenszel adjusted reporting odds ratios<br />
(RORs), [31] they appear to be far less sensitive to the<br />
presence of small numbers of very small strata.<br />
Their main limitation in the context of ADR surveillance<br />
is that they are vulnerable to spurious associa-<br />
tions based on very few reports and require additional<br />
filters to be useful in first-pass screening. [4] Regression-based<br />
adjustment for potential confounders<br />
is an alternative to the post-stratification approach<br />
discussed here. Its main advantages are that it allows<br />
for direct adjustment by numerical covariates and<br />
that several covariates can be adjusted for simultaneously<br />
without accounting for potential interaction<br />
between confounders. However, regression-based<br />
adjustment may not be considered transparent and<br />
can still be sensitive to overstratification. [32] Adjustment<br />
for suspected confounders based on propensity<br />
scores may be a useful approach to handle multiple<br />
confounders, since propensity scores project reports<br />
on to a small number of strata. However, propensity<br />
score-based adjustment is a form of automated confounder<br />
selection strategy that must be applied separately<br />
to each drug. Changes in a database over time<br />
could lead to changes in the propensity score projections<br />
that, in turn, induce unexpected changes in the<br />
adjusted measures. In the context of ADR surveil-<br />
lance, adjustment for suspected confounders based<br />
on propensity scores is therefore perhaps more appropriate<br />
for hypothesis refinement and strengthen-<br />
ing.<br />
Conclusions<br />
It is clear that if a measure of disproportionality<br />
based on the observed-to-expected ratio is routinely<br />
adjusted for a set of potential confounders, the user<br />
must beware that the reduction in false positives<br />
may come at a cost of missed signals. Indeed, given<br />
the rather modest performance improvement from<br />
routine adjustment for potential confounders ob-<br />
served in this study, it remains an open question<br />
regarding how much effort should be spent on implementing<br />
and improving strategies for routine ad-<br />
justment in ADR surveillance. Our results indicate<br />
that resources may be better spent on research to<br />
improve triage algorithms for signal selection and<br />
follow-up.<br />
Acknowledgements<br />
The authors are indebted to all the national centres that<br />
make up the WHO Programme for International Drug <strong>Monitoring</strong><br />
and contribute case reports to the WHO database.<br />
However, the opinions and conclusions are not necessarily<br />
those of the various centres or of the WHO. The authors<br />
would also like to thank Professor Rolf Sundberg for helpful<br />
comments on an earlier draft of this article.<br />
No sources of funding were used to assist in the prepara-<br />
tion of this study. The authors have no conflicts of interest<br />
that are directly relevant to the content of this study.<br />
Appendix<br />
Further Mathematical Detail Relating to<br />
Effects of Overstratification<br />
Our simulation study provides empirical evi-<br />
dence that the adjusted observed-to-expected ratio<br />
tends to spurious underestimation in the presence of<br />
© 2008 Adis Data Information BV. All rights reserved. Drug Safety 2008; 31 (11)
1046 Hopstadius et al.<br />
any very small strata. In this appendix, we provide This adjusted observed-to-expected ratio was<br />
some mathematical details for the interested reader first proposed for the EBGM by DuMouchel, [12] and<br />
who wants to understand the background to this later adopted for the IC. [9]<br />
behaviour. Consider the following 2 × 2 contingency<br />
table for the reporting of drug x and ADR y<br />
In practice, and will be zero in any<br />
(equation 2):<br />
stratum z that contains no reports on x or no reports<br />
on y. Therefore, in some cases, the adjusted observed-to-expected<br />
y not y<br />
ratio corresponds closely to the<br />
x a b a + b<br />
crude observed-to-expected ratio for a specific subset<br />
of the database. For example, adjustment by<br />
not x c d<br />
country of origin and time of reporting will restrict<br />
a + c<br />
a + b + c + d<br />
the basis for the expected number of reports on a<br />
(Eq. 2) drug-ADR pair to those countries and time periods<br />
Conditional on the marginal number of reports on in which both the drug and the ADR have been<br />
x (a + b), the marginal number of reports on y (a + c) reported. The advantage of this is that it may elimi-<br />
and the total number of reports (a + b + c + d), the nate any undue impact of geographical and temporal<br />
observed-to-expected ratio (OE) is (equation 3): variations in reporting rates. The drawback is that<br />
for rare drugs and ADRs, the adjusted Exy may be<br />
a/(a + b)<br />
OE =<br />
based on a very small subset of the database, and<br />
(a + c)/(a + b + c + d)<br />
thereby be more sensitive to sampling variability<br />
(Eq. 3) than the unadjusted Exy.<br />
where the observed and the expected number of A closer investigation reveals that the presence of<br />
reports on x and y together can be expressed as any very small strata has a negative impact on the<br />
(equations 4 and 5):<br />
adjusted observed-to-expected ratio. Consider the<br />
O xy = a<br />
adjusted observed-to-expected ratio expressed in<br />
(Eq. 4) terms of the counts in the 2 × 2 contingency table<br />
(a + b)(a + c)<br />
(equation 8):<br />
E xy =<br />
a + b + c + d<br />
a<br />
OE adj =<br />
(Eq. 5)<br />
Σ (a z + b z )(a z + c z )<br />
a z + b z + c z + d average of the stratum-specific ob- z<br />
A weighted<br />
served-to-expected ratios, with weights equal to the<br />
(Eq. 8)<br />
stratum-specific expected number of reports is The adjusted observed-to-expected ratio is<br />
(equation 6):<br />
strongly affected by single report strata in which the<br />
z<br />
O xy<br />
drug and the ADR co-occur (i.e. with az = 1 and bz =<br />
z<br />
Σ z z ·E<br />
E xy<br />
cz = dz = 0). In such a stratum, both the observed and<br />
xy<br />
OE adj =<br />
the expected counts are 1. Conditional on the stratum-specific<br />
marginals, there is no randomness left<br />
Σ z Ez<br />
xy<br />
O xy<br />
=<br />
in az for such degenerated tables, and the observed<br />
Σ z Ez<br />
xy<br />
number of reports will always equal the expected.<br />
(Eq. 6) Moreover, given that the stratum-specific observedwhere<br />
the expected number of reports in each stragiven<br />
to-expected ratio is based on one single report, it is<br />
tum z is (equation 7):<br />
an unreasonably large weight in the<br />
weighted<br />
average (equation 8). If the overall crude expected<br />
count is small (as is often the case in ADR surveil-<br />
lance), the dampening effect on the overall observed-to-expected<br />
ratio will be considerable.<br />
z<br />
E xy = (a z + b z )(a z + c z )<br />
a z + b z + c z + d z<br />
(Eq. 7)<br />
© 2008 Adis Data Information BV. All rights reserved. Drug Safety 2008; 31 (11)
Impact of Stratification on ADR Surveillance 1047<br />
holm: Faculty of Science, Department of Mathematics, Stockholm<br />
University, 2007<br />
12. DuMouchel W. Bayesian data mining in large frequency tables,<br />
with an application to the FDA spontaneous reporting system.<br />
Am Stat 1999; 53 (3): 177-90<br />
13. Gould AL. Practical pharmacovigilance analysis strategies.<br />
Counter-intuitively, if placed in a separate stra-<br />
tum, an additional ICSR on a particular drug-ADR<br />
pair will moderate the original observed-to-expected<br />
ratio towards 1. This problem is not specific to<br />
single report strata. Consider a stratum with origi-<br />
Pharmacoepidemiol Drug Saf 2003; 12 (7): 559-74<br />
nally four reports such as az = bz = cz = 0 and dz = 4. 14. Ståhl M, Lindquist M, Edwards IR, et al. Introducing triage<br />
If a report on the drug-ADR pair of interest is placed logic as a new strategy for the detection of signals in the WHO<br />
Drug <strong>Monitoring</strong> Database. Pharmacoepidemiol Drug Saf<br />
in this stratum so that bz and cz remain 0, dz remains<br />
2004; 13 (6): 355-63<br />
4, but az increases to 1, then increases from 0 to 15. Hopstadius J. Methods to control for confounding variables in<br />
screening for association in the WHO drug safety database<br />
0.2. If the original overall observed count was 3 and<br />
[master’s thesis]. <strong>Uppsala</strong>: Department of Mathematics, Uppthe<br />
overall adjusted expected count was 0.01, then sala University, 2006<br />
the overall observed-to-expected ratio decreases 16. Roux E, Thiessard F, Fourrier A, et al. Evaluation of statistical<br />
association measures for the automatic signal generation in<br />
from 3/0.01 = 300 to 4/0.21 ≈19, even though the<br />
pharmacovigilance. IEEE Trans Inf Technol Biomed 2005; 9<br />
observed count has increased by 1 and the expected (4): 518-27<br />
count by only 0.2. Similar examples can be found 17. Hauben M, Reich L. Safety related drug-labelling changes:<br />
findings from two data mining algorithms. Drug Saf 2004; 27<br />
where added reports on a drug-ADR pair reduce the<br />
(10): 735-44<br />
observed-to-expected ratio, even if placed in a stra- 18. Lindquist M, Stahl M, Bate A, et al. A retrospective evaluation<br />
tum where any of az, bz, cz and dz are non-zero. of a data mining approach to aid finding new adverse drug<br />
reaction signals in the WHO International Database. Drug Saf<br />
Shrinkage will reduce but not eliminate this prob-<br />
2000; 23 (6): 533-42<br />
lem.<br />
References<br />
19. van Puijenbroek EP, Bate A, Leufkens HG, et al. A comparison<br />
of measures of disproportionality for signal detection in spontaneous<br />
reporting systems for adverse drug reactions.<br />
Pharmacoepidemiol Drug Saf 2002; 11 (1): 3-10<br />
1. Rawlins MD. Spontaneous reporting of adverse drug reactions. 20. Almenoff J, LaCroix K, Yuen N, et al. Comparative perform-<br />
II: uses. Br J Clin Pharmacol 1988; 26 (1): 7-11<br />
ance of two quantitative safety signalling methods: implications<br />
2. Edwards IR, Biriell C. Harmonisation in pharmacovigilance.<br />
for use in a pharmacovigilance department. Drug Saf<br />
Drug Saf 1994; 10 (2): 93-102<br />
2006; 29 (10): 875-87<br />
3. Bate A, Lindquist M, Edwards IR, et al. A Bayesian neural 21. Lilienfeld D, Nicholas S, Macneil D, et al. Violation of homogenetwork<br />
method for adverse drug reaction signal generation. neity: a methodologic issue in the use of data mining tools.<br />
Eur J Clin Pharmacol 1998; 54 (4): 315-21 Drug Saf 2003; 26 (5): 363-4<br />
4. Evans SJ, Waller PC, Davis S. Use of proportional reporting 22. Hauben M, Madigan D, Gerrits CM, et al. The role of data<br />
ratios (PRRs) for signal generation from spontaneous adverse mining in pharmacovigilance. Expert Opin Drug Saf 2005; 4<br />
drug reaction reports. Pharmacoepidemiol Drug Saf 2001; 10 (5): 929-48<br />
(6): 483-6<br />
23. Mantel N, Haenszel W. Statistical aspects of the analysis of data<br />
5. Lindquist M, Edwards IR, Bate A. From association to alert: a from retrospective studies of disease. J Natl Cancer Inst 1959<br />
revised approach to international signal analysis. Pharma- (22): 719-49<br />
coepidemiol Drug Saf 1999; 8 (S1): S15-25<br />
24. Breslow N. Odds ratio estimators when the data are sparse.<br />
6. Sanz EJ, De-las-Cuevas C, Kiuru A, et al. Selective serotonin<br />
Biometrika 1981; 68 (1): 73-84<br />
reuptake inhibitors in pregnant women and neonatal withdrawal<br />
syndrome: a database analysis. Lancet 2005; 365 (9458): 25. Bate A. The use of a bayesian confidence propagation neural<br />
482-7<br />
network in pharmacovigilance [doctoral thesis]. Umeå: Department<br />
of Pharmacology and Clinical Neuroscience, Umeå<br />
7. Coulter DM, Bate A, Meyboom RH, et al. Antipsychotic drugs<br />
University, 2003<br />
and heart muscle disorder in international pharmacovigilance:<br />
data mining study. BMJ 2001; 322 (7296): 1207-9<br />
26. Bentzen N. An international glossary for general/family prac-<br />
8. Bate A, Lindquist M, Edwards IR. A data mining approach for tice. Fam Pract 1995; 12 (3): 341-69<br />
signal detection and analysis. Drug Saf 2002; 25 (6): 393-7 27. Henderson AR. Assessing test accuracy and its clinical conse-<br />
9. Norén GN, Bate A, Orre R, et al. Extending the methods used to quences: a primer for receiver operating characteristic curve<br />
screen the WHO drug safety database towards analysis of analysis. Ann Clin Biochem 1993; 30 (Pt 6): 521-39<br />
complex associations and improved accuracy for rare events. 28. Bate A, Edwards IR, Lindquist M, et al. Violation of homogene-<br />
Stat Med 2006; 25 (21): 3740-57<br />
ity: a methodological issue in the use of data mining tools.<br />
10. Orre R, Lansner A, Bate A, et al. Bayesian neural networks with Drug Saf 2003; 26 (5): 363-6<br />
confidence estimations applied to data mining. Comput Stat 29. Levine JG, Tonning JM, Szarfman A. Reply: the evaluation of<br />
Data Anal 2000; 34 (8): 473-93<br />
data mining methods for the simultaneous and systematic<br />
11. Norén GN. Statistical methods for knowledge discovery in detection of safety signals in large databases: lessons to be<br />
adverse drug reaction surveillance [doctoral thesis]. Stock- learned. Br J Clin Pharmacol 2006; 61 (1): 105-13<br />
© 2008 Adis Data Information BV. All rights reserved. Drug Safety 2008; 31 (11)
1048 Hopstadius et al.<br />
30. Szarfman A, Tonning JM, Doraiswamy PM. Pharmacovigilance is low and there are multiple confounders. Am J Epidemiol<br />
in the 21st century: new systematic tools for an old problem. 2003; 158 (3): 280-7<br />
Pharmacotherapy 2004; 24 (9): 1099-104<br />
31. Egberts AC, Meyboom RH, van Puijenbroek EP. Use of measures<br />
of disproportionality in pharmacovigilance: three Dutch<br />
Correspondence: Johan Hopstadius, <strong>Uppsala</strong> <strong>Monitoring</strong><br />
examples. Drug Saf 2002; 25 (6): 453-8<br />
32. Cepeda MS, Boston R, Farrar JT, et al. Comparison of logistic<br />
regression versus propensity score when the number of events<br />
<strong>Centre</strong>, Box 7051, <strong>Uppsala</strong>, S-751 40, Sweden.<br />
E-mail: johan.hopstadius@who-umc.org<br />
© 2008 Adis Data Information BV. All rights reserved. Drug Safety 2008; 31 (11)