PDF - Sarantis
PDF - Sarantis
PDF - Sarantis

You also want an ePaper? Increase the reach of your titles
YUMPU automatically turns print PDFs into web optimized ePapers that Google loves.
vvdsvdvsdy<br />
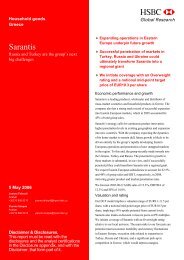
<strong>Sarantis</strong><br />
Greece/ Personal Goods<br />
Company update<br />
Buy<br />
unchanged<br />
Share price*: EUR<br />
Target price: EUR<br />
Reuters/Bloomberg<br />
Accounting Standard/Since<br />
8.72<br />
10.10<br />
SRSr.AT/SAR GA<br />
IFRS/2004<br />
Market capitalisation (EURm ) 333.0<br />
No. of shares (m) 38.1<br />
Free float 52.0%<br />
Daily avg. no. trad. sh. 12 mth 78,100<br />
Daily avg. trad. vol. 12 mth (m) 0.62<br />
Price high 12 mth (EUR) 8.94<br />
Price low 12 mth (EUR) 6.60<br />
Abs. perf. 1 mth 4.6%<br />
Abs. perf. 3 mth 12.4%<br />
Abs. perf. 12 mth -3.1%<br />
(EUR) 12/07e 12/08e 12/09e<br />
Sales (m) 244 278 319<br />
EBITDA (m) 37 44 51<br />
EBITDA margin 15.2% 15.7% 16.0%<br />
EBIT (m) 34 40 46<br />
EBIT margin 13.8% 14.5% 14.3%<br />
Net Profit (adj.)(m) 24 28 33<br />
ROCE 14.3% 15.7% 16.5%<br />
Net debt/(cash) (m) 57 48 36<br />
Debt Equity 58.7% 39.7% 24.4%<br />
Debt/EBITDA 1.5 1.1 0.7<br />
Int. cover(EBITDA/Fin. int 12.3 15.1 18.3<br />
EV/Sales 1.5 1.3 1.1<br />
EV/EBITDA 9.8 8.1 6.7<br />
EV/EBIT 10.8 8.8 7.5<br />
P/E (adj.) 13.8 11.8 10.2<br />
P/BV 3.4 2.8 2.3<br />
OFCF yield 0.7% 3.8% 5.0%<br />
Dividend yield 1.5% 1.9% 2.2%<br />
EPS (adj.) 0.63 0.74 0.86<br />
BVPS 2.56 3.14 3.81<br />
DPS 0.13 0.16 0.19<br />
10.0<br />
9.5<br />
9.0<br />
8.5<br />
8.0<br />
7.5<br />
7.0<br />
6.5<br />
Apr 06 May 06 Jun 06 Jul 06 Aug 06 Sep 06 Oct 06 Nov 06 Dec 06 Jan 07 Feb 07 Mar 07 Apr 07 May 07<br />
Source: Datastream<br />
SARANTIS<br />
ASE (Rebased)<br />
Shareholders: Irina Investments 32%; Jason<br />
Enterprises 15%; Fidelity Investments<br />
10%;<br />
*closing price as of 18/ 05/ 2007<br />
21 May 2007<br />
Signs of recovery for the new markets and new agreements<br />
dismiss uncertainty<br />
‣ We proceed with changes in our forecasts in order to include: a) the impact<br />
of the change in the penetration method of the group in the new markets,<br />
b) its partnership with Estee Lauder for the launch of the male fragrance<br />
Mustang in North America, c) the change of Theodoridis S.A. (its car<br />
accessories division) consolidation method, while d) we also take into<br />
account the favourable trends of the old foreign markets during the first<br />
quarter of the year.<br />
‣ We conclude with sales at EUR244.3m in FY:07, implying a 13.4% y-o-y,<br />
while EBIT is seen at EUR33.8m (+15.3% y-o-y). Bottom line in the current<br />
year is seen at EUR24.2m, recording an annual growth of 6.6%. Note that<br />
our estimates still incorporate losses from the new markets, which are<br />
expected to reach EUR4.8m in FY:07, while they are seen breakeven in<br />
FY:08.<br />
‣ Our estimates stand slightly higher compared to the management’s<br />
guidance - especially for the current year, +3.4% in bottom line - partially<br />
explained by the contribution of operations in US (included in our<br />
forecasts), while we also adopt a more optimistic stance for the new<br />
markets in FY:07 and consider a slightly better performance for the old<br />
foreign countries.<br />
‣ We proceed with an upward revision of our valuation from EUR8.70 per<br />
share to EUR10.10 per share, retaining our ‘Buy’ recommendation, since<br />
our target price implies a 15.8% upside potential. We note that our<br />
valuation is no longer affected by the high capital expenses of the group<br />
(as previously, given the acquisition plans of the group).<br />
‣ <strong>Sarantis</strong> continues to trade at attractive multiples, offering significant<br />
discounts to its peers. P/E(07e) and P/E(08e) for <strong>Sarantis</strong> stands at 13.8x<br />
and 11.8x respectively, implying a discount of 28.5% and 31.3% compared<br />
to its peers.<br />
‣ <strong>Sarantis</strong> reported a strong set of Q1:07 financial results with sales at<br />
EUR54.4m, +11.4% y-o-y (2% below our estimates). EBIT grew by 34.0%<br />
at EUR7.6m (16% above our estimates), while net income settled at<br />
EUR5.5m vs. EUR4.5m in Q1:06 (18% higher than our estimates). On a<br />
comparable basis, bottom line reported an annual growth of 72.7%. At<br />
operational level, results were above our estimates, mainly on the back of<br />
the strong performance of the old foreign countries and a better than<br />
expected performance of the new markets.<br />
Head of Research Costis Sinanidis +30 210 817 3386 csinanidis@ibg.gr<br />
Analyst(s): Maria Psyllou +30 210 817 3381 mpsyllou@ibg.gr<br />
Produced by:<br />
In cooperation with<br />
All ESN research is available<br />
on Bloomberg: “ESNR” <br />
Distributed by the Members of ESN<br />
(see last page of this report)
<strong>Sarantis</strong><br />
Forecasts Revision<br />
Latest Developments of the Group<br />
• Partnership with Estee Lauder for the launch of male fragrance in North America<br />
<strong>Sarantis</strong> Group has announced its partnership with Estee Lauder for the launch of Mustang<br />
(fragrance for men) in North America. <strong>Sarantis</strong> Group bears the responsibility of the<br />
exclusive production of Mustang, while has also created its advertising campaign. The<br />
Mustang fragrance will be launched in July 2007 to North American retailers as well as to<br />
mass merchandisers and a chain of drug stores. We welcome this development, since any<br />
positive effect will come on top of the normal performance, while the group had minimal<br />
CAPEX for this cooperation.<br />
There are not official numerical estimates from <strong>Sarantis</strong> management on the impact of the<br />
agreement, however there is definitely significant upside potential. In our estimates for the<br />
current year, we include an additional amount of EUR2.5m in sales from USA, which<br />
however may be conservative given the positive prospects of the agreement. We<br />
incorporate an ΕΒΙΤ margin which is higher than the group’s products, even from its own<br />
products portfolio, since the production of Mustang allows the creation of synergies, which<br />
are enhanced proportional to the quantity of production. Given the size of the American<br />
market, if this pilot program proves successful it can significantly support the financial<br />
performance of the group and alter its business profile. However – at least for the time –<br />
we prefer to account for a small contribution in sales and operational performance from this<br />
activity.<br />
• Agreement with local distributor in Ukraine<br />
<strong>Sarantis</strong> signed an agreement with the local distributor Cornil in Ukraine, according to<br />
which Cornil will distribute <strong>Sarantis</strong>' products for a 3-year period, starting as of May 11th.<br />
<strong>Sarantis</strong> will be responsible for advertising expenses proportional to the sales of Cornil,<br />
while will also pay a distribution fee to Cornil (we assume c.25%). Cornil is a top local<br />
distributor with a distribution network across all the major cities in Ukraine. The agreement<br />
is in line with the overall revised penetration model of <strong>Sarantis</strong> in the new markets (Russia,<br />
Turkey and Ukraine). More specifically, the agreement is expected to benefit the group by<br />
maximizing efficiency in distribution, increasing market shares of its products and<br />
improving profitability. At the same time, it offsets inefficiencies of the model used so far<br />
(which was based on high marketing expenses and lacked mass market penetration) and<br />
ensures high return on advertising and promotion expenses through Cornil. According to<br />
the managerment, the completion of the agreement is expected to fully offset the high fixed<br />
operating expenses of the current model. Note that <strong>Sarantis</strong> distributes its own products of<br />
mass-market cosmetics (C-THRU, BU and STR8) as well as household products (Fino,<br />
Grosik and Camel) in Ukraine. Recall also that in FY:06 <strong>Sarantis</strong> reported Ukraine sales of<br />
EUR0.5m and losses of EUR1m at EBIT level.<br />
Overall, the focus of new established countries is among the top priorities of <strong>Sarantis</strong>,<br />
targeting to limit the high fixed operating expenses and increased losses based on the<br />
strengthening of its distribution network potentials. The new penetration model in the new<br />
countries of Turkey, Ukraine and Turkey is based on the delegation of distribution and<br />
sales to a national distributor. Consequently, costs allocation will not be fixed – as currently<br />
– but proportional to sales. Moreover, products distribution is guaranteed resulting to a<br />
more efficient advertisement expense and support. According to the management, after the<br />
completion of the new distribution method operational fixed cost for these markets will not<br />
exist.<br />
Additionally, the group is currently under negotiations with three top distributors in Turkey<br />
and Russia, while we understand the agreements are expected to be announced very<br />
soon. According to the management - and based on its revised guidance (announced in<br />
March of the current year) – the new markets are expected to generate a total loss of<br />
EUR5.2m (partially generated by the operation of the old model and partially by the<br />
in cooperation with<br />
Page 2
<strong>Sarantis</strong><br />
downsizing of the existing premises). All the agreements are expected to run as of July of<br />
the current year. Given the results of the first quarter of the year, which imply a more<br />
optimistic scenario for the full year results of these countries (in Q1:07 losses of<br />
EUR1.14m) and the conclusion of the agreement in Ukraine which came earlier than July,<br />
we include in our estimates a loss for the full year in the new markets of EUR4.8m, i.e.<br />
slightly lower compared to the estimate of the company. Based on the current market<br />
trends the risk on our estimates is on the upside (lower losses).<br />
The decision for the implementation of the new penetration model in the new countries<br />
alters the plans of the group for potential acquisitions in Ukraine and Turkey, which were<br />
already included in our previous forecasts. The positive aspect of this development is that<br />
the strategic choice of the agreements with national distributors - instead of acquisitions -<br />
ammends the problems of the new markets without requiring significant CAPEX<br />
(c.EUR30m on our assumptions). Consequently, although we do not conclude with<br />
significant changes in operational performance from this factor, this development has a<br />
positive effect in our target price.<br />
• Change of Theodoridis S.A. consolidation method<br />
<strong>Sarantis</strong> announced the change in the consolidation method of Theodoridis S.A. (its car<br />
accessories division – Oto Top). The group will use the "joint control method"<br />
(consolidation in proportion to <strong>Sarantis</strong>’ participation) instead of the full consolidation<br />
method until now. Recall that <strong>Sarantis</strong> holds a 50% stake in Theodoridis S.A. in Greece<br />
and an indirect 25% stake in Bulgaria. Based on this development, <strong>Sarantis</strong> provided an<br />
adjusted guidance for the period 2007-2009 (compared to the guidance announced at the<br />
end of March). The change in the consolidation method implies a decrease in sales and<br />
EBIT level by c.3% and c.1% respectively, however there are no changes in bottom line<br />
estimates of the management.<br />
We underline that the adjustments in guidance are exclusively related to the change of<br />
consolidation method of Theodoridis, while the company has also provided adjusted figures<br />
for the years 2005 and 2006.<br />
<strong>Sarantis</strong> adjusted guidance (including Theodoridis with the joint control method)<br />
Adj. Actual Adj. Actual<br />
2005 2006<br />
% ch. (*) Adj. 2007e % ch. (**) Adj. 2008e % ch. (**) Adj. 2009e % ch. (**)<br />
Sales 201.50 215.34 -3.5% 241.50 -3.4% 273.50 -3.2% 313.00 -2.8%<br />
y-o-y 6.9% 12.1% 13.3% 14.4%<br />
EBITDA 31.28 32.84 -1.8% 36.12 -1.0% 42.95 -1.2% 50.40 -1.0%<br />
EBITDA margin 15.5% 15.3% 15.0% 15.7% 16.1%<br />
y-o-y 5.0% 10.0% 18.9% 17.3%<br />
EBIT 27.71 29.29 -1.8% 32.62 -1.2% 39.35 -1.3% 44.80 -1.1%<br />
EBIT margin 13.8% 13.6% 13.5% 14.4% 14.3%<br />
y-o-y 5.7% 11.4% 20.6% 13.9%<br />
EBT 24.97 29.29 -1.2% 29.62 -1.6% 36.65 -0.3% 42.00 -0.2%<br />
EBT margin 12.4% 13.6% 12.3% 13.4% 13.4%<br />
y-o-y 17.3% 1.1% 23.7% 14.6%<br />
EAT 19.07 22.01 -1.2% 22.32 -1.5% 27.83 -0.3% 32.13 -0.2%<br />
Net Margin 9.5% 10.2% 9.2% 10.2% 10.3%<br />
y-o-y 15.4% 1.4% 24.7% 15.5%<br />
Minorities -0.26 -0.66 -1.06 0.13 0.18<br />
on sales -0.1% -0.3% -0.4% 0.0% 0.1%<br />
y-o-y 60.6% -112.3% 38.5%<br />
EATAM 19.33 22.67 0.0% 23.38 0.0% 27.70 0.0% 31.95 0.0%<br />
Net Margin 9.6% 10.5% 9.7% 10.1% 10.2%<br />
y-o-y 17.3% 3.1% 18.5% 15.3%<br />
Source: Marfin Analysis / Egnatia Finance, <strong>Sarantis</strong><br />
* refer to the change of adjusted figures compared to the reported figures<br />
**refer to the changes of adjusted figures compared to the latest communicated guidance of the group (March, 2007)<br />
in cooperation with<br />
Page 3
<strong>Sarantis</strong><br />
Given the latest developments of the group – as analysed above – and taking into account<br />
the trends of the first quarter of the year, we conclude with sales at EUR244.3m in FY:07,<br />
implying a 13.4% y-o-y, while EBIT is seen at EUR33.8m (+15.3% y-o-y). Bottom line in the<br />
current year is seen at EUR24.2m, recording an annual growth of 6.6%.<br />
We note that for the current year we incorporate a low digit growth for sales in Greece, with<br />
improved however growth rates for the old foreign countries – also supported by their good<br />
performance in the first quarter of the year – while new markets contribution in sales<br />
reaches almosts EUR8m for the current year. We remind that 2007 is the first year to<br />
account for the whole contribution of the four new countries, since Ukraine and Turkey<br />
started operation in 2005, while Hungary and Russia in April and November of 2006<br />
respectively. At EBIT level, we see improved margins for the old foreign countries, however<br />
we anticipate a total loss of EUR4.8m in FY:07 for the new markets which are expected to<br />
breakeven in FY:08.<br />
For the next years, we anticipate an average top line growth of 14.3% for the period 2007e-<br />
2009e, while bottom line is seen recording a 16.3% CAGR for the same period. Although<br />
our current forecasts seem to stand lower compared to our previous estimates, we repeat<br />
that part of this change is attributed to the change of consolidation method of Theodoridis<br />
(that’s why changes in bottom line seem smaller compared to changes in bottom line).<br />
<strong>Sarantis</strong> changes in Forecasts (in EURm) – Our new estimates do not include acquisitive<br />
growth as was the case with our previous forecasts<br />
2006 New 2007f Old 2007f % ch. New 2008f Old 2008f % ch.<br />
Sales 215.3 244.3 260.8 -6.3% 278.1 304.9 -8.8%<br />
EBITDA 32.8 37.1 39.4 -5.9% 43.8 47.5 -7.9%<br />
margin 15.3% 15.2% 15.1% 15.7% 15.6%<br />
EBIT 29.3 33.8 35.3 -4.4% 40.2 42.4 -5.2%<br />
margin 13.6% 13.8% 13.5% 14.5% 13.9%<br />
EBT 29.3 30.7 30.8 -0.1% 37.3 37.7 -1.0%<br />
margin 13.6% 12.6% 11.8% 13.4% 12.4%<br />
EAT 22.7 24.2 23.9 1.0% 28.2 29.5 -4.2%<br />
margin 10.5% 9.9% 9.2% 10.2% 9.7%<br />
Source: Marfin Analysis / Egnatia Finance, <strong>Sarantis</strong><br />
Compared to the management’s guidance, our estimates stand slightly higher compared to<br />
the management’s guidance, especially for the current year partially explained by the<br />
contribution of operations in US (included in our forecasts, not included in the guidance),<br />
while we also adopt a more optimistic stance for the new markets and we consider a<br />
slightly better performance of the old foreign countries.<br />
Our estimates compared to the management’s guidance (in EURm)<br />
2007<br />
Guidance<br />
2007 MAe<br />
MAe vs.<br />
Guid.<br />
2008<br />
Guidance<br />
2008 MAe<br />
MAe vs.<br />
Guid.<br />
Sales 241.5 244.3 1.1% 273.5 278.1 1.7%<br />
EBITDA 36.1 37.1 2.7% 43.0 43.8 1.9%<br />
EBITDA margin 15.0% 15.2% 15.7% 15.7%<br />
EBIT 32.6 33.8 3.5% 39.4 40.2 2.2%<br />
EBIT margin 13.6% 13.8% 13.4% 14.5%<br />
Net Profits 23.4 24.2 3.4% 27.7 28.2 1.9%<br />
Source: Marfin Analysis / Egnatia Finance, <strong>Sarantis</strong><br />
in cooperation with<br />
Page 4
<strong>Sarantis</strong><br />
Valuation<br />
We value <strong>Sarantis</strong> using a 3-stage DCF model with a WACC assumption for the first stage<br />
at 9.2% and for the second stage at 8.8%. Our higher WACC assumption for the first stage<br />
accounts for the increased risk of the group’s exposure in the new markets in the short<br />
term. Our valuation also incorporates a 0.5% perpetuity growth rate.<br />
<strong>Sarantis</strong> DCF Valuation (in EURm)<br />
1st stage<br />
2nd stage<br />
Long Term Free Risk Rate 4.5% 4.5%<br />
Estimated Beta 1.2 1.2<br />
Equity Risk Premium 5.5% 5.0%<br />
Cost of Equity 10.8% 10.3%<br />
Target Capital Gearing 25.0% 25.0%<br />
WACC 9.2% 8.8%<br />
Average growth to perpetuity 0.5%<br />
EURm<br />
Sum of FCFs (07e-11f) 74.65<br />
Sum of FCFs 2nd stage (12f-18f) 152.08<br />
FCF to perpetuity 190.71<br />
Total FCF 417.44<br />
plus cash & market value of investments minus<br />
minorities:<br />
54.32<br />
minus current borrowings -86.83<br />
Implied value of equity 384.93<br />
Implied value per share 10.10<br />
Source: Marfin Analysis / Egnatia Finance<br />
We proceed with an upwards revision of our valuation from EUR8.70 per share to<br />
EUR10.10 per share, retaining our ‘Buy’ recommendation, since our target price implies a<br />
15.8% upside potential. We note that our valuation is no longer affected by the high capital<br />
expenses of the group (as previously, given the acquisition plans of the group).<br />
<strong>Sarantis</strong> continues to trade at attractive multiples, offering significant discounts to its peers.<br />
P/E(07e) and P/E(08e) for <strong>Sarantis</strong> stands at 13.8x and 11.8x respectively, implying a<br />
discount of 28.5% and 31.3% compared to its peers.<br />
Note however that bottom line for <strong>Sarantis</strong> is suppressed this year, since we will continue<br />
to see new markets delivering losses (EUR4.8m on our assumptions), however we expect<br />
breakeven in the next year.<br />
in cooperation with<br />
Page 5
<strong>Sarantis</strong><br />
<strong>Sarantis</strong> Peer Group Comparison<br />
Price Market Cap. P/E 07 (x) P/E 08 (x)<br />
EV/EBITDA 07<br />
(x)<br />
EV/EBITDA 08<br />
(x)<br />
Procter & Gamble 47.0 148,433.2 18.2 16.2 11.1 10.6<br />
Colgate Palmolive Co. 49.9 25,605.1 20.3 18.1 12.0 10.9<br />
Reckitt Benckiser 40.6 29,111.0 22.4 20.1 15.6 14.0<br />
Henkel 114.6 15,830.2 17.7 15.5 10.2 9.0<br />
Beiersdorf AG 53.3 13,444.2 28.0 24.1 14.5 12.5<br />
Estee Lauder 34.8 7,314.4 18.9 16.8 10.1 9.3<br />
Clarins S.A. 61.6 2,510.5 23.7 21.5 13.5 12.3<br />
Unilever Plc 23.3 30,496.6 17.0 15.9 5.2 4.9<br />
Mcbride 3.7 658.9 16.7 15.1 8.2 7.5<br />
Robertet Sa 134.8 293.8 18.4 17.4 8.2 7.7<br />
Mirato SpA 8.9 153.9 16.3 13.7 6.9 7.9<br />
Weigthed Average 19.2 17.2 11.1 10.3<br />
Simple Average 19.8 17.7 10.5 9.7<br />
<strong>Sarantis</strong> 8.72 332.6 13.8 11.8 9.5 7.8<br />
Premium / Discount<br />
<strong>Sarantis</strong> vs Peer group<br />
(weight avg)<br />
<strong>Sarantis</strong> vs Peer group<br />
(simple avg)<br />
Source: Marfin Analysis / Egnatia Finance, JCF<br />
-28.5% -31.3% -14.7% -24.8%<br />
-30.4% -33.3% -10.0% -20.0%<br />
We continue being positive especially on the long term prospects of the group, given its<br />
ambitious expansion plan. The mature Greek market is expected to continue offering a<br />
cushion of cash for the group. The developing foreign markets have started bearing the<br />
fruits of an effort that initiated at the beginning of the decade. The ‘emerging markets’ have<br />
started showing signs of recovery, while new favourable agreements constitute positive<br />
catalysts for the future, leaving space for further support in the valuation.<br />
in cooperation with<br />
Page 6
<strong>Sarantis</strong><br />
Risks to our Valuation<br />
• Execution risks for <strong>Sarantis</strong>’ expansion in the new markets<br />
• Higher than expected marketing and promotion expenses in the E.E. markets could<br />
hurt the bottom line<br />
• Intensified competition from multinationals in the Eastern European markets where<br />
<strong>Sarantis</strong> is operating.<br />
• A faster than expected slowdown in the Greek operations<br />
• A possible loss of high-end cosmetics brands (especially Estee Lauder) would hurt<br />
profitability.<br />
• Increased interest rate environment could hurt <strong>Sarantis</strong> due to its high leverage<br />
in cooperation with<br />
Page 7
<strong>Sarantis</strong><br />
Q1:07 Financial Results<br />
<strong>Sarantis</strong> reported a strong set of Q1:07 financial results with sales at EUR54.4m, +11.4%<br />
y-o-y (2% below our estimates). EBIT grew by 34.0% at EUR7.6m (16% above our<br />
estimates), while net income settled at EUR5.5m vs. EUR4.5m in Q1:06 (18% higher than<br />
our estimates). However, note that results are not directly comparable since Q1:06<br />
included one off revenues of EUR1.3m due to capital gains generated by Multirama<br />
transaction. Excluding one-off items, bottom line reported an annual growth of 72.7%.<br />
At operational level, results were above our estimates, mainly on the back of the strong<br />
performance of the old foreign countries, which reported a 28.9% y-o-y increase in sales<br />
with EBIT margin significantly improving at 11.1% in Q1:07 vs. 4.9% in the respective<br />
period last year. Total margin also improved by 2.4 pps compared to the respective period<br />
last year, statnding at 13.9%.<br />
Note that Q1:06 financial statements include Theodoridis using the full consolidation<br />
method, while Q1:07 results include Theodoridis S.A. using the joint control method. For<br />
comparison reasons, the group has also provided pro forma accounts for Q1:06, as they<br />
are depicted in the next table.<br />
<strong>Sarantis</strong> Q1:07 Results Review (in EURm)<br />
Q1:07a Q1:06a y-o-y<br />
Q1:06 pro<br />
Actual vs.<br />
y-o-y<br />
forma<br />
MAe<br />
Sales 54.38 48.83 11.4% 47.13 15.4% -1.7%<br />
COGS 25.89 23.89 22.93<br />
Gross Profit 28.49 24.94 14.3% 24.20 17.7%<br />
margin 52.4% 51.1% 51.3%<br />
Other Income 2.72 1.86 46.4% 1.83 48.3%<br />
G&A 22.77 20.25 12.4% 19.52 16.6%<br />
EBITDA 8.44 6.54 29.1% 6.51 29.6% 12.3%<br />
margin 15.5% 13.4% 13.8%<br />
Depreciation 0.87 0.89 -1.8% 0.87 0.3%<br />
EBIT 7.57 5.65 34.0% 5.64 34.2% 16.0%<br />
margin 13.9% 11.6% 12.0%<br />
Net Interest Inc. / (Exp.) -0.25 0.46 n.a. 0.48 n.a.<br />
EBT 7.32 6.10 19.9% 6.12 19.5%<br />
margin 13.5% 12.5% 13.0%<br />
Taxes 2.10 1.66 26.6% 1.64 28.1%<br />
EAT 5.22 4.45 17.3% 4.48 16.4%<br />
Minorities -0.26 -0.03 0.01<br />
EAT after minorities 5.48 4.47 22.5% 4.47 22.5% 18.2%<br />
margin 10.1% 9.2% 9.5%<br />
Source: Marfin Analysis / Egnatia Finance, <strong>Sarantis</strong><br />
in cooperation with<br />
Page 8
<strong>Sarantis</strong><br />
Q1:07 Geographical Breakdown<br />
Sales<br />
Q1:07<br />
Focusing on Q1:07 financial performance of the group on a divisional and geograpical<br />
basis, we highlight the following:<br />
• The strong performance of the old foreign countries. Sales for the old countries<br />
increased by 28.9% y-o-y, while EBIT almost tripled.<br />
• Sales in Turkey almost halved on the back of the new penetration model in this<br />
country, as the group didn’t include seasonal products in its portfolio during Q1:07 as it<br />
was the case in the respective period last year.<br />
Sales<br />
Q1:06<br />
y-o-y<br />
Sales<br />
proforma<br />
Q1:06<br />
y-o-y<br />
EBIT<br />
Q1:07<br />
EBIT<br />
Q1:06<br />
y-o-y<br />
EBIT<br />
Q1:06<br />
pro<br />
forma<br />
y-o-y<br />
EBIT<br />
margin<br />
Q1:07<br />
EBIT<br />
margin<br />
Q1:06<br />
EBIT<br />
margin<br />
Q1:06<br />
pro<br />
forma<br />
Greece 26.2 26.8 -2.3% 25.7 1.7% 5.8 5.1 12.7% 3.8 7.4% 22.0% 19.1% 14.6%<br />
% of total 48.1% 54.9% 54.6% 76.1% 90.5% 66.6%<br />
Old Countries<br />
Poland 11.7 8.9 32.6% 0.7 -0.1 n.a. 5.8% -1.4%<br />
Romania 8.9 6.7 33.6% 1.2 0.6 118.5% 13.6% 8.4%<br />
Bulgaria 2.6 2.6 -0.3% 1.9 32.6% 0.2 0.1 74.5% 0.1 352.0% 8.9% 5.0% 2.6%<br />
Serbia 2.1 1.6 28.9% 0.6 0.4 68.5% 30.1% 22.8%<br />
Czech Republic 0.9 0.7 40.4% 0.1 0.0 188.1% 11.8% 6.1%<br />
FYROM 0.4 0.3 39.1% 0.1 0.0 104.6% 24.3% 14.8%<br />
Total Old Countries 26.7 20.7 28.9% 20.0 33.0% 3.0 1.0 189.4% 0.9 217.2% 11.1% 4.9% 4.6%<br />
% of total 49.0% 42.4% 42.5%<br />
New Countries<br />
Ukraine 0.2 0.2 30.4% -0.1 -0.2 - -55.0% -100.0%<br />
Turkey 0.5 1.2 -56.2% -0.5 -0.1 - -86.8% -4.1%<br />
Russia 0.6 0.0 - -0.5 0.0 - -87.7% n.a.<br />
Hungary 0.3 0.0 - -0.1 -0.3 - -34.6% n.a.<br />
Total New Countries 1.6 1.4 14.6% 1.4 -1.1 -0.5 - -0.5 -73.1% -35.3% -35.3%<br />
% of total 2.9% 2.8% 2.9%<br />
Total Sales / EBIT 54.4 48.8 11.4% 47.1 15.4% 7.6 5.7 34.0% 5.6 34.2% 13.9% 11.6% 12.0%<br />
Source: Marfin Analysis / Egnatia Finance<br />
• Fragnances and cosmetics reported a growth rate of 20.8% y-o-y, while household<br />
products improved by 18.7% on an annual basis.<br />
• Health & care products’ EBIT decreased by 21.7% at EUR0.6m on the back of<br />
increased expenses for the promotion of new products (brand name Origins).<br />
Q1:07 Divisional Breakdown<br />
Sales<br />
Q1:07<br />
Sales<br />
Q1:06<br />
Sales<br />
y-o-y<br />
growth<br />
Q1:07<br />
EBIT<br />
Q1:06<br />
EBIT<br />
y-o-y<br />
growth<br />
Q1:07 EBIT<br />
margin<br />
Q1:06 EBIT<br />
margin<br />
Fragnances & Cosmetics 21.6 17.9 20.8% 2.8 2.4 15.6 % 13.0% 13.6%<br />
Household Products 21.9 18.5 18.7% 2.1 1.5 35.9% 9.4% 8.3%<br />
Health & Care Products 5.0 4.6 7.6% 0.6 0.8 -21.7% 11.8% 16.4%<br />
Strategic Alliances 5.9 7.8 -25.0% 2.1 0.9 124.0% 35.5% 11.9%<br />
Total 54.4 48.8 11.4% 7.6 5.7 34.0% 13.9% 11.6%<br />
Source: Marfin Analysis / Egnatia Finance<br />
in cooperation with<br />
Page 9
<strong>Sarantis</strong><br />
Finally, note that own products (fragnances & cosmetics and household products)<br />
increased by 19.5% y-o-y reaching EUR35.0m accounting for an increased 64.4% of total<br />
sales (vs. 60.0% one year before). However, the contribution of own products in EBIT<br />
decreased at 54.3% (EUR4.1m) vs. 59.5% (EUR3.4m) in Q1:06 mainly on the back of the<br />
high fixed operating expenses in the new markets (Turkey, Russia & Ukraine).<br />
in cooperation with<br />
Page 10
<strong>Sarantis</strong><br />
<strong>Sarantis</strong>: Summary tables<br />
PROFIT & LOSS (EURm) 2004 2005 2006e 2007e 2008e 2009e CAGR 09/04<br />
Sales 187.6 208.7 215.3 244.3 278.1 319.1 11.2 %<br />
Cost of Sales & Operating Costs (excl. Pers. Expenses) -159.6 -176.9 -182.5 -207.2 -234.3 -267.8<br />
Personnel Expenses 0.0 0.0 0.0 0.0 0.0 0.0<br />
Non Recurrent Expenses/Income 0.0 0.0 0.0 0.0 0.0 0.0<br />
EBITDA 28.1 31.8 32.8 37.1 43.8 51.2 12 .8 %<br />
Depreciation, Amortisation & Write Downs -3.5 -3.6 -3.6 -3.4 -3.6 -5.5<br />
EBIT (reported) 24.6 28.1 29.3 33.8 40.2 45.7<br />
Net Financial Interest -2.6 -2.9 0.0 -3.0 -2.9 -2.8<br />
Other Financials 0.0 0.0 0.0 0.0 0.0 0.0<br />
Associates 0.0 0.0 0.0 0.0 0.0 0.0<br />
Other Non Recurrent Items 0.0 0.0 0.0 0.0 0.0 0.0<br />
Earnings Before Tax (EBT) 22.0 25.3 29.3 30.7 37.3 42.9 14 .3 %<br />
Tax -4.6 -6.1 -7.3 -7.6 -9.0 -10.1<br />
Tax rate 21.1% 24.2% 24.9% 24.6% 24.1% 23.5%<br />
Discontinued Operations 0.0 0.0 0.0 0.0 0.0 0.0<br />
M inorities -0.4 0.2 0.7 1.0 -0.1 -0.1<br />
Net Profit (reported) 17.0 19.3 22.7 24.2 28.2 32.7 14 .0 %<br />
Net P ro fit (adj.) 17.0 19.3 20.4 24.2 28.2 32.7<br />
CASH FLOW (EURm)<br />
Net profit (reported) + M inorities 17.3 19.2 22.0 23.2 28.3 32.8<br />
Non cash items 3.5 3.6 3.6 3.4 3.6 5.5<br />
Cash Flow 20.9 22.8 25.6 26.5 31.9 38.3 13 .0 %<br />
Change in Net Working Capital 32.6 -15.3 -6.5 -19.1 -16.2 -18.5<br />
Capex 86.9 -2.6 1.7 -5.0 -3.0 -3.0<br />
Operating Free Cash Flow (OpFCF) 140.4 4.9 20.7 2.4 12.6 16.8 -34.6%<br />
Net Financial Investments 0.0 0.0 0.0 0.0 0.0 0.0<br />
Dividends -3.7 -4.8 -5.0 -5.1 -6.2 -7.2<br />
Other (incl. Capital Increase & share buy backs) 0.0 0.0 0.0 0.0 0.0 0.0<br />
Free Cash Flow 136.7 0.1 15.8 -2.6 6.4 9.6<br />
NOP LA T 19.4 21.3 22.0 25.5 30.5 34.9<br />
BALANCE SHEET & OTHER ITEMS (EURm)<br />
Net Tangible A ssets 44.4 44.8 42.1 43.8 43.3 40.8<br />
Net Intangible Assets (incl.Goodwill) 0.0 0.0 0.3 0.2 0.2 0.2<br />
Net Financial Assets & Other 19.7 25.2 26.9 26.9 26.9 26.9<br />
Total Fixed Assets 64.2 70.0 69.3 70.9 70.4 67.8 1.1%<br />
Net Working Capital 71.9 82.8 88.3 107.2 124.2 143.8<br />
Total capital invested/employed 116.3 127.6 130.7 151.3 167.7 184.7<br />
Shareholders Equity 34.6 60.9 77.4 97.8 119.8 145.3 33.2%<br />
M inorities Equity 2.0 1.8 0.9 -0.1 0.0 0.1<br />
Net Debt 79.0 74.2 61.7 57.4 47.6 35.5 -14.8%<br />
Provisions 7.0 5.5 6.1 7.0 8.0 9.1<br />
Other Liabilities 13.4 10.4 11.5 16.1 19.3 21.6<br />
Total M arket Cap 160.3 236.2 308.3 332.6 332.6 332.6<br />
Enterprise Value (EV adj.) 221.6 287.0 344.0 363.0 353.3 341.4<br />
MARGINS AND RATIOS<br />
Sales growth -19.2% 11.2% 3.2% 13.4% 13.9% 14.7%<br />
EB ITDA gro wth -27.6% 13.1% 3.4% 13.0% 18.0% 17.0%<br />
EB IT gro wth -29.7% 14.7% 4.1% 15.3% 19.2% 13.5%<br />
EBITDA margin 15.0% 15.2% 15.3% 15.2% 15.7% 16.0%<br />
EB IT margin 13.1% 13.5% 13.6% 13.8% 14.5% 14.3%<br />
Debt/Equity (gearing) 215.7% 118.2% 78.7% 58.7% 39.7% 24.4%<br />
Debt/EB ITDA 2.8 2.3 1.9 1.5 1.1 0.7<br />
Interest cover (EBITDA/Fin.interest) 10.8 11.1 high 12.3 15.1 18.3<br />
R OC E 14.2% 14.0% 14.0% 14.3% 15.7% 16.5%<br />
WACC 9.2% 9.2% 9.2% 9.2% 9.2% 9.2%<br />
ROCE/WACC 1.5 1.5 1.5 1.5 1.7 1.8<br />
EV/CE 1.63 1.88 2.18 2.04 1.82 1.61<br />
OpFCF/CE 103.1% 3.2% 13.2% 1.4% 6.5% 7.9%<br />
EV/Sales 1.18 1.38 1.60 1.49 1.27 1.07<br />
EV/EBITDA 7.9 9.0 10.5 9.8 8.1 6.7<br />
EV/EBIT 9.0 10.2 11.7 10.8 8.8 7.5<br />
P/E (adj.) 9.4 12.2 15.1 13.8 11.8 10.2<br />
P/CF 7.7 10.3 12.1 12.5 10.4 8.7<br />
P/BV 4.6 3.9 4.0 3.4 2.8 2.3<br />
OpFCF yield 87.5% 2.1% 6.7% 0.7% 3.8% 5.0%<br />
Payout ratio 21.8% 24.8% 21.9% 21.0% 22.0% 21.9%<br />
Dividend yield (gross) 2.3% 1.4% 1.5% 1.5% 1.9% 2.2%<br />
PER SHARE DATA (EUR)<br />
EPS (reported) 0.45 0.51 0.59 0.63 0.74 0.86 13 .9 %<br />
EPS (adj.) 0.45 0.51 0.53 0.63 0.74 0.86 13 .9 %<br />
CFPS 0.55 0.60 0.67 0.70 0.84 1.00 12 .8 %<br />
BVPS 0.91 1.60 2.03 2.56 3.14 3.81 33.0%<br />
DP S 0.10 0.13 0.13 0.13 0.16 0.19 14 .0 %<br />
Source: Company, M arfin Analysis/Egnatia Finance estimates<br />
2004 restated as IFRS proforma<br />
in cooperation with<br />
Page 11
<strong>Sarantis</strong><br />
Recommendation system<br />
From the 18 th October 2004, the Members of ESN use a New Recommendation System.<br />
The new ESN Recommendation System is Absolute. It means that each stock is rated on the<br />
basis of a total return, measured by the upside potential (including dividends) over a 6 months<br />
time horizon.<br />
The ESN spectrum of recommendations (or ratings) for each stock comprises 5 categories:<br />
Buy, Accumulate (or Add), Hold, Reduce and Sell (in short: B, A, H, R, S).<br />
Meaning of each rating or recommendation:<br />
• Buy: the stock is expected to generate a total return of over 15% during the<br />
next 6 months time horizon.<br />
• Accumulate: the stock is expected to generate a total return of 5% to15%<br />
during the next 6 months time horizon.<br />
• Hold: the stock is expected to generate a total return of 0% to 5% during the<br />
next 6 months time horizon<br />
• Reduce: the stock is expected to generate a total return of 0 to -15% during the<br />
next 6 months time horizon<br />
• Sell: the stock is expected to generate a total return below -15% during the<br />
next 6 months time horizon<br />
• Rating Suspended: the rating is suspended due to a capital operation (takeover<br />
bid, SPO, …) where the issuer or a related party of the issuer is or could<br />
be involved or to a change of analyst covering the stock<br />
• Not Rated: there is no rating for a company being floated (IPO) by the issuer or<br />
a related party of the issuer<br />
in cooperation with<br />
Page 12
<strong>Sarantis</strong><br />
Disclosure Appendix<br />
The information and opinions in this report were prepared by Investment Bank of Greece in cooperation with Egnatia Finance, as the two<br />
companies operate under a merger agreement. Both Investment Bank of Greece and Egnatia Finance are regulated by the Hellenic Capital Market<br />
Commission. Investment Bank of Greece and Egnatia Finance have not entered any agreement with the subject companies for the execution of<br />
this analysis.<br />
This report is for informative purposes only. Under no circumstances is it to be used or considered as an offer to sell, or a solicitation of any offer to<br />
buy, any security. While the information contained herein has been obtained from sources believed to be reliable, we do not represent that it is<br />
accurate or complete and it should not be relied upon as such. In producing its research reports, members of Investment Bank of Greece and<br />
Egnatia Finance SA research departments may have received assistance from the subject company(ies) referred to in this report. Any such<br />
assistance may have included access to sites of the issuers, visits to certain operations of the subject company(ies), meetings with management,<br />
employees or other parties associated with the subject company(ies) and the handing by them of historical data regarding the subject company(ies)<br />
(financial statements and other financial data), as well as of all publicly available information regarding strategy and financial targets. Investment<br />
Bank of Greece and Egnatia Finance SA research personnel are prohibited from accepting payment or reimbursement of travel expenses from site<br />
visits to subject companies. It should be presumed that the author(s) of this report, in most cases, has had discussions with the subject<br />
company(ies) to ensure factual accuracy prior to publication. All opinions, projections and estimates constitute the judgment of the author as of the<br />
date of the report and are given in good faith, but are subject to change without notice. Prices and availability of financial instruments also are<br />
subject to change without notice. Investment Bank of Greece and Egnatia Finance SA or one of their affiliates or persons connected with them may<br />
from time to time buy and sell securities referred herein. Although Investment Bank of Greece and Egnatia Finance SA does not set a<br />
predetermined frequency for publication, if this is a fundamental research report, it is the intention of Investment Bank of Greece and Egnatia<br />
Finance SA to provide research coverage of the subject company(ies), including in response to news affecting this issuer, subject to applicable<br />
quiet periods and capacity constraints. Investment Bank of Greece and Egnatia Finance SA may from time to time perform investment banking or<br />
other services for, or solicit investment banking or other business from, any company mentioned in this report. Investment Bank of Greece and<br />
Egnatia Finance SA do and seek to do business with companies covered in their research reports. Thus, investors should be aware that the firms<br />
may have a conflict of interest that could affect the objectivity of this report. Investors should consider this report as only a single factor in making<br />
their investment decision. Securities referred to in this research report are subject to investment risks, including the possible loss of the principal<br />
amount invested. This report is intended for professional investors only and it is not to be reproduced or copied or reprinted or transmitted for any<br />
purpose without permission. We certify that this report has been published in accordance with our conflict management policy and guidelines.<br />
According to Investment Bank of Greece as well as Egnatia Finance SA policies, the Analysis Departments of Investment Bank of Greece and<br />
Egnatia Finance SA are bound by confidentiality, with the exception of data allowed to be published in accordance with the applicable laws.<br />
Investment Bank of Greece and Egnatia Finance SA rely on information barriers to control the flow of information in one or more areas within<br />
Investment Bank of Greece and Egnatia Finance SA organisations. The communication between the Analysis Department of Investment Bank of<br />
Greece and Egnatia Finance SA and the other departments of the aforementioned companies is restricted by Chinese Walls set between the<br />
different departments, so that Investment Bank of Greece and Egnatia Finance SA can abide by the provisions regarding confidential information<br />
and market abuse.<br />
Analyst Certification<br />
The following analysts: Costis Sinanidis, Maria Psyllou hereby certify that the views about the companies and securities contained in this report<br />
accurately reflect their personal views and that no part of their compensation was or will be directly or indirectly related to the specific<br />
recommendations or views in this report.<br />
The analysts mentioned above who prepared this report have the below mentioned financial interests in the companies covered in this<br />
report……none……<br />
Important Regulatory Disclosures on Subject Company<br />
The information and opinions in this report were prepared by INVESTMENT BANK of GREECE and EGNATIA FINANCE SA, which are both<br />
members of the Athens Exchange S.A. and regulated by the Hellenic Capital Market Commission.<br />
The compensation of the research analysts, strategists, or research associates principally responsible for the preparation of this research report<br />
may depend on various factors such as quality of work, stock picking, client feedback and overall firm profitability.<br />
Stock Ratings<br />
You should carefully read the definitions of all ratings used in the research report. Moreover, you should carefully read the entire research report to<br />
obtain a clear view of the analyst’s opinions and not infer its contents from the rating alone.<br />
Marfin Analysis/Egnatia Finance Research Rating Distribution<br />
Data current as of 11/05/2007<br />
Buy Accumulate Hold Reduce Sell<br />
Marfin Analysis / Egnatia Finance Total Coverage 42% 28% 19% 2% 0%<br />
% of companies in each rating category that are investment banking clients 5% 5% 2% 0% 0%<br />
Note that 4 companies are currently under review<br />
Wholesale 100% 0% 0% 0% 0%<br />
% of companies in each rating category that are investment banking clients 0% 0% 0% 0% 0%<br />
in cooperation with<br />
Page 13
<strong>Sarantis</strong><br />
Regulatory Disclosures on Subject Companies<br />
1. As of the date mentioned on the first page of this report, Investment Bank of Greece (or any of its affiliated companies) and/or Egnatia Finance<br />
(or any of its affiliated companies) own 5% or more of a class of common equity securities in the following companies mentioned in this report:<br />
Bank of Cyprus<br />
2. As of the date mentioned on the first page of this report, the following subject companies mentioned in this report own 5% or more of a class of<br />
common equity securities of Investment Bank of Greece (or any of its affiliated companies) and/or Egnatia Finance (or any of its affiliated<br />
companies): Marfin FG<br />
3. Investment Bank of Greece and/or Egnatia Finance act as a market maker for the following securities of the subject companies mentioned in this<br />
report: Alpha Bank, CCHBC, CosmOTE, EFG Eurobank, Emporiki Bank, National Bank, OPAP, OTE, Piraeus Bank, PPC, Hellenic<br />
Exchanges, Intralot, Mytilineos, Hellenic Technodomiki, GEK, Bank of Cyprus<br />
4. Within the last 12 months, Investment Bank of Greece and/or Egnatia Finance have provided underwriting services to the following companies<br />
mention in this report: GPSB<br />
5. Within the last 12 months, Investment Bank of Greece and/or Egnatia Finance had a contractual relationship or have received compensation for<br />
financial advisory services from the following subject companies mentioned in this report: Vivartia, GEK/Terna, GPSB, Motor Oil, Euroline,<br />
Interinvest, Vivere, Hygeia<br />
Rating History<br />
1. 13/03/2007 Buy, Target Price EUR8.70<br />
1. 21/12/2006 Buy, Target Price EUR9.90<br />
2. 13/09/2006 Buy, Target Price EUR9.80<br />
2. 04/07/2006 Buy, Target Price EUR10.10<br />
3. 21/03/2006 Buy, Target Price EUR10.10<br />
4. 15/09/2005 Buy, Target Price EUR7.20<br />
Risks to our forecasts and valuation<br />
• Execution risks for the group’s expansion in the new markets<br />
• A faster than expected slowdown in the Greek operations<br />
• A possible loss of high-end cosmetics brands (especially Estee Lauder) would hurt profitability.<br />
• Intensified competition from multinationals in the Eastern European markets where <strong>Sarantis</strong> is operating.<br />
• Bigger than expected marketing and promotion expenses in the E.E. markets could hurt the bottom line<br />
• Increased interest rate environment could hurt <strong>Sarantis</strong> due to its high leverage<br />
Additional disclosures<br />
1. Additional note to our U.S. readers: This document may be distributed in the United States solely to “major US institutional investors” as defined<br />
in Rule 15a-6 under the US Securities Exchange Act of 1934. Each person that receives a copy, by acceptance thereof, represents and agrees that<br />
he/she will not distribute or otherwise make available this document to any other person.<br />
2. All prices and valuation multiples are based on the closing of ATHEX’s last session prior to the issue of this report, unless otherwise indicated.<br />
3. Our research reports are available upon request, at www.marfininvest.com, on Bloomberg’s IBGR and ESNR functions, and on Thomson One<br />
Analytics website.<br />
4. Additional information is available upon request.<br />
in cooperation with<br />
Page 14
<strong>Sarantis</strong><br />
Investment Bank of Greece<br />
Research<br />
Costis Sinanidis<br />
Andreas Balaskas<br />
Lillian Katelani<br />
Anthony Kouleimanis<br />
Konstantinos Manolopoulos<br />
Chrissoula Moussiou<br />
Maria Psyllou<br />
Vassilis Roumantzis<br />
Natalia Svyrou-Svyriadi<br />
Dimosthenis Triggas<br />
Konstantinos Tzoutzourakis<br />
Konstantinos Zouzoulas<br />
Derivatives<br />
Nikos Kontaroudis<br />
Kostas Kountos<br />
Stavros Pavlidis<br />
Marnia Stabouli<br />
Christos Tsaousoglou<br />
Ioanna Tsega<br />
Thanos Varvitsiotis<br />
Global Derivatives<br />
Ilias Georgopoulos<br />
Konstantinos Gravas<br />
Tel. + 30 210 817 3000<br />
Fax. +30 210 689 6322<br />
email: research@ibg.gr<br />
Sales<br />
Iraklis Kounadis<br />
Spiros Argyriou<br />
Elias Calfoglou<br />
Philipos Dragoumis<br />
Thodoris Edipidis<br />
Nick Katsanos<br />
George Katimertzis<br />
George Kounadis<br />
Petros Mylonas<br />
Thanos Trikatzis<br />
Theodore Varelas<br />
Foreign markets<br />
Michael Andreadis<br />
Michael Papoulis<br />
Stelios Stavrakakis<br />
Capital Markets, Director<br />
European Securities Network<br />
(ESN), Country Manager<br />
Constantinos Xenos<br />
Egnatia Finance<br />
Institutional Equities Desk<br />
Sales / Trading<br />
Nikos Gavalakis<br />
Ilias Dimitros<br />
Evi Anagnostopoulou<br />
John Tsigounis<br />
Structured & Derivative Products<br />
Alexis Roubas<br />
Fedon Kachtitsis<br />
Tel. +30 210 327 9200<br />
Fax. + 30 210 3248694<br />
email: research@egnasec.gr<br />
International Equities Sales<br />
Christos Kostopoulos<br />
Asset Management<br />
Themis Hantzaridis<br />
Charis Papakonstantinou<br />
in cooperation with<br />
Page 15
Disclaimer:<br />
Members of ESN (European Securities Network LLP)<br />
These reports have been prepared and issued by the<br />
Members of European Securities Network LLP (‘ESN’).<br />
ESN, its Members and their affiliates (and any director, officer<br />
or employee thereof), are neither liable for the proper and<br />
complete transmission of these reports nor for any delay in<br />
their receipt. Any unauthorised use, disclosure, copying,<br />
distribution, or taking of any action in reliance on these<br />
reports is strictly prohibited. The views and expressions in the<br />
reports are expressions of opinion and are given in good<br />
faith, but are subject to change without notice. These reports<br />
may not be reproduced in whole or in part or passed to third<br />
parties without permission. The information herein was<br />
obtained from various sources. ESN, its Members and their<br />
affiliates (and any director, officer or employee thereof) do not<br />
guarantee their accuracy or completeness, and neither ESN,<br />
nor its Members, nor its Members’ affiliates (nor any director,<br />
officer or employee thereof) shall be liable in respect of any<br />
errors or omissions or for any losses or consequential losses<br />
arising from such errors or omissions.<br />
Neither the information contained in these reports nor any<br />
opinion expressed constitutes an offer, or an invitation to<br />
make an offer, to buy or sell any securities or any options,<br />
futures or other derivatives related to such securities (‘related<br />
investments’).<br />
These reports are prepared for the clients of the Members of<br />
ESN only. They do not have regard to the specific investment<br />
objectives, financial situation and the particular needs of any<br />
specific person who may receive any of these reports.<br />
Investors should seek financial advice regarding the<br />
appropriateness of investing in any securities or investment<br />
strategies discussed or recommended in these reports and<br />
should understand that statements regarding future prospects<br />
may not be realised. Investors should note that income from<br />
such securities, if any, may fluctuate and that each security’s<br />
price or value may rise or fall. Accordingly, investors may<br />
receive back less than originally invested. Past performance<br />
is not necessarily a guide to future performance. Foreign<br />
currency rates of exchange may adversely affect the value,<br />
price or income of any security or related investment<br />
mentioned in these reports. In addition, investors in securities<br />
such as ADRs, whose value are influenced by the currency of<br />
the underlying security, effectively assume currency risk.<br />
Like all Members employees, analysts receive compensation<br />
that is impacted by overall firm profitability.<br />
For discussion, if applicable, of the valuation methods used to<br />
determine the price targets included in this report/note,<br />
please refer to the latest relevant published research on<br />
single stock. Research is available through your sales<br />
representative.<br />
ESN will provide periodic updates on companies or sectors<br />
based on company-specific developments or<br />
announcements, market conditions or any other publicly<br />
available information.<br />
Unless agreed in writing with an ESN Member, this research<br />
is intended solely for internal use by the recipient.<br />
For additional information and individual disclaimer<br />
please refer to each ESN Member websites:<br />
Banca Akros S.p.A.<br />
Viale Eginardo, 29<br />
20149 Milano<br />
Italy<br />
Phone: +39 02 43 444 389<br />
Fax: +39 02 43 444 302<br />
Bank Degroof<br />
Rue de I’Industrie 44<br />
1040 Brussels<br />
Belgium<br />
Phone: +32 2 287 91 16<br />
Fax: +32 2 231 09 04<br />
Caixa-Banco de Investimento<br />
Rua Barata Salgueiro, 33-5<br />
1269-050 Lisboa<br />
Portugal<br />
Phone: +351 21 389 68 00<br />
Fax: +351 21 389 68 98<br />
Caja Madrid Bolsa S.V.B.<br />
Serrano, 39<br />
28001 Madrid<br />
Spain<br />
Phone: +34 91 436 7813<br />
Fax: +34 91 577 3770<br />
CM - CIC Securities<br />
Avenue de Provence 6<br />
75441 Paris Cedex 09<br />
France<br />
Phone: +33 1 4596 7700<br />
Fax: +33 1 4596 7788<br />
Egnatia Finance S.A.<br />
8 Dragatsaniou Str.<br />
105 59 Athens<br />
Greece<br />
Phone: +302 10 32 79 200<br />
Fax: +302 10 32 48 694<br />
Equinet AG<br />
Gräfstraße 97<br />
60487 Frankfurt am Main<br />
Germany<br />
Phone:+49 69 – 58997 – 410<br />
Fax:+49 69 – 58997 – 299<br />
Mandatum Securities<br />
Unioninkatu 22,<br />
00130 Helsinki<br />
Finland<br />
Phone: +358 10 236 10<br />
Fax: +358 10 236 4755<br />
NCB Stockbrokers Ltd.<br />
3 George Dock,<br />
Dublin 1<br />
Ireland<br />
Phone: +353 1 611 5611<br />
Fax: +353 1 611 5781<br />
www.bancaakros.it,<br />
www.degroof.be,<br />
www.cajamadrid.es,<br />
www.caixabi.pt,<br />
www.cmcics.com,<br />
www.egnatiabank.gr,<br />
www.equinet-ag.de,<br />
www.mandatum.fi,<br />
www.ncb.ie<br />
<strong>Sarantis</strong><br />
Greece<br />
Personal Goods<br />
European Securities Network LLP<br />
Registered office c/o Withers LLP<br />
18 Old Bailey - London EC4M 7EG