EY-Nigeria-Country-Report
EY-Nigeria-Country-Report
EY-Nigeria-Country-Report

Create successful ePaper yourself
Turn your PDF publications into a flip-book with our unique Google optimized e-Paper software.
United States South Africa UK India France Germany Japan South Korea Singapore Switzerland<br />
Capital invested FDI (US$m)<br />
Jobs created by FDI<br />
New project FDI<br />
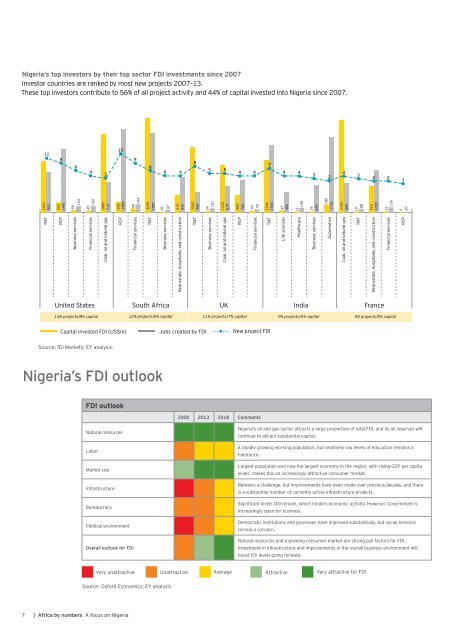
<strong>Nigeria</strong>’s top investors by their top sector FDI investments since 2007<br />
Investor countries are ranked by most new projects 2007–13.<br />
These top investors contribute to 56% of all project activity and 44% of capital invested into <strong>Nigeria</strong> since 2007.<br />
11<br />
9<br />
6<br />
4<br />
3<br />
13<br />
9<br />
6<br />
4 4<br />
8<br />
5 5<br />
4 4<br />
7<br />
4 4<br />
3<br />
2<br />
4<br />
3<br />
2 2<br />
1<br />
TMT<br />
RCP<br />
Business services<br />
Financial services<br />
Coal, oil and natural gas<br />
RCP<br />
Financial services<br />
TMT<br />
Business services<br />
Real estate, hospitality and construction<br />
TMT<br />
Business services<br />
Coal, oil and natural gas<br />
RCP<br />
Financial services<br />
TMT<br />
Life sciences<br />
Healthcare<br />
Business services<br />
Automotive<br />
Coal, oil and natural gas<br />
TMT<br />
Real estate, hospitality and construction<br />
Financial services<br />
RCP<br />
1224<br />
953<br />
243<br />
1491<br />
58<br />
154<br />
45<br />
160<br />
1862<br />
710<br />
256<br />
1980<br />
99<br />
194<br />
2239<br />
1887<br />
16<br />
67<br />
410<br />
845<br />
1540<br />
488<br />
34<br />
101<br />
1125<br />
619<br />
409<br />
760<br />
44<br />
76<br />
1246<br />
1593<br />
47<br />
492<br />
11<br />
109<br />
24<br />
639<br />
1776<br />
189<br />
2190<br />
690<br />
19<br />
88<br />
616<br />
1000<br />
22<br />
126<br />
4<br />
20<br />
United States South Africa<br />
UK India France<br />
14% projects/8% capital 12% projects/6% capital 11% projects/7% capital 9% projects/5% capital 5% projects/5% capital<br />
Capital invested FDI (US$m)<br />
Jobs created by FDI<br />
New project FDI<br />
Source: fDi Markets; <strong>EY</strong> analysis.<br />
46 16,475<br />
<strong>Nigeria</strong>’s FDI outlook<br />
FDI outlook<br />
13,782<br />
12,600<br />
2000 2013 2018 Comments<br />
10,500<br />
Natural resources 24<br />
Labor<br />
5,288<br />
<strong>Nigeria</strong>'s oil and gas sector attracts a large proportion of total FDI, and its oil reserves will<br />
continue to attract substantial capital.<br />
7,015<br />
A rapidly growing working population, but relatively low levels of education remains a<br />
hindrance.<br />
Market size<br />
Infrastructure<br />
Roads and Power plants<br />
Bureaucracy<br />
bridges and transmission<br />
grids<br />
Political environment<br />
Overall outlook for FDI<br />
11<br />
Largest population and now the largest economy in the region, with rising GDP per capita<br />
2,848<br />
7<br />
levels, 2,470 makes this an increasingly attractive consumer market.<br />
5<br />
4<br />
Remains a challenge, but improvements 3have been made over previous decade, and there<br />
2 2<br />
is a substantial number of currently active infrastructure projects.<br />
103<br />
Airports Rail Industrial Significant levels still remain, Ports which hinders Oil and economic gas activity. Commercial However, Government Water is<br />
construction<br />
increasingly open for business. pipelines construction<br />
Capital value (US$m) Democratic institutions Project number and processes have improved substantially, but social tensions<br />
remain a concern.<br />
Natural resources and a growing consumer market are strong pull factors for FDI.<br />
Investment in infrastructure and improvements in the overall business environment will<br />
boost FDI levels going forward.<br />
Very unattractive Unattractive Average Attractive Very attractive for FDI<br />
Source: Oxford Economics; <strong>EY</strong> analysis<br />
7 | Africa by numbers A focus on <strong>Nigeria</strong>