Wealth Distribution and Taxation - DARP
Wealth Distribution and Taxation - DARP
Wealth Distribution and Taxation - DARP

You also want an ePaper? Increase the reach of your titles
YUMPU automatically turns print PDFs into web optimized ePapers that Google loves.
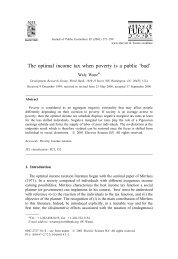
net capital value of<br />
estate<br />
Securities<br />
Cash<br />
Loans, mortgages<br />
etc<br />
Policies of<br />
insurance<br />
Residential<br />
buildings<br />
Other Buildings<br />
<strong>and</strong> L<strong>and</strong><br />
Other assets<br />
Net as % gross<br />
Mortgages<br />
Other debts<br />
HMRC “Identified wealth” 2003<br />
0 - £50,000 4.6% 22.7% 5.6% 8.9% 47.6% 0.1% 10.5% 61.0% 5.7% 33.4%<br />
£50000 - £100,000 4.5% 16.2% 3.0% 14.6% 55.0% 0.0% 6.8% 83.3% 4.1% 12.6%<br />
£100000 - £150,000 3.9% 14.0% 2.4% 18.6% 55.2% 0.1% 5.8% 84.4% 4.3% 11.3%<br />
£150000 - £200,000 4.5% 14.4% 0.7% 12.1% 59.4% 1.6% 7.5% 89.0% 4.9% 6.1%<br />
£200000 - £500,000 8.5% 12.8% 0.9% 12.6% 54.7% 1.5% 9.0% 89.7% 6.5% 3.8%<br />
£500000 - £1000,000 17.6% 11.2% 1.6% 7.6% 42.5% 5.3% 14.1% 93.8% 3.9% 2.3%<br />
£1,000,000 <strong>and</strong> over 23.8% 10.8% 1.9% 5.0% 28.1% 8.1% 22.4% 94.2% 2.9% 3.0%<br />
Residential buildings about 50% of net worth, except for £500,000+<br />
Debts concentrated amongst those with less than £100,000<br />
Source: HMRC statistics table 13.2<br />
Securities concentrated amongst the rich<br />
11 February 2012 Frank Cowell: EC426 8