Entering the Point Cloud - RIEGL Laser Measurement Systems
Entering the Point Cloud - RIEGL Laser Measurement Systems
Entering the Point Cloud - RIEGL Laser Measurement Systems

Create successful ePaper yourself
Turn your PDF publications into a flip-book with our unique Google optimized e-Paper software.
<strong>Entering</strong> <strong>the</strong><br />
<strong>Point</strong> <strong>Cloud</strong><br />
Data analysis<br />
takes center stage<br />
in part two of our<br />
mobile mapping<br />
road trip.<br />
By Joshua I. France, Riegl USA (www.<br />
rieglusa.com), Orlando, Fla., and Craig<br />
Glennie, University of Houston (www.<br />
uh.edu), Houston, Texas.<br />
As detailed in <strong>the</strong> last issue of Earth<br />
Imaging Journal, a recent mobile<br />
mapping project was motivated<br />
by a highway paving company’s<br />
need for better data so it could<br />
manage its costs and bidding approach<br />
more effectively. Upon completing data<br />
collection for <strong>the</strong> project along a ninemile,<br />
two-lane section of Florida’s Interstate<br />
95, we were confident <strong>the</strong> processed<br />
data would provide complete road surface<br />
information for <strong>the</strong> site.<br />
Now our journey on <strong>the</strong> waveform<br />
continues, as we venture into <strong>the</strong> software<br />
portion of <strong>the</strong> mobile mapping system<br />
and into <strong>the</strong> point cloud itself. The<br />
trip begins with data transfer, a step that<br />
separates <strong>the</strong> acquisition computer from<br />
<strong>the</strong> processing functions and software.<br />
Such separation allows for better data<br />
management and for <strong>the</strong> acquisition staff<br />
to collect <strong>the</strong> next project.<br />
The on-ramp into <strong>the</strong> point cloud led to a nine-mile,<br />
two-lane section of Florida’s Interstate 95.<br />
System Specifics<br />
Processing <strong>the</strong> light detection and<br />
ranging (LiDAR) data with <strong>the</strong> project’s<br />
mobile scanning system, <strong>the</strong> Riegl VMX-<br />
250, differs from processing airborne<br />
LiDAR data or o<strong>the</strong>r systems’ LiDAR<br />
data. The VMX-250’s two VQ-250 laser<br />
scanners use an advanced signal processing<br />
technology called online waveform<br />
processing. The technology enables full<br />
waveform analysis and rigorous multitarget<br />
detection to occur during data<br />
acquisition. A single Riegl VQ-250 can<br />
process 300,000 laser shots with multitarget<br />
capability in terms of range and<br />
amplitude measurements in one second.<br />
Online processing allows for <strong>the</strong> data to be<br />
quickly georeferenced—in Riegl’s RiProcess<br />
software suite—by simply unpacking <strong>the</strong><br />
data from a compressed file format and<br />
assigning real-world coordinates based on<br />
<strong>the</strong> selected coordinate system.<br />
It took 1 hour and 12 minutes to collect<br />
18 miles of data on a single Quad-<br />
Core computer with a solid-state drive<br />
running eight tasks in parallel for processing<br />
to a raw point cloud. This workflow<br />
included decompression from <strong>the</strong> raw<br />
data format and <strong>the</strong>n georeferencing and<br />
projecting <strong>the</strong> data into <strong>the</strong> desired coordinate<br />
system, processing <strong>the</strong> trajectory<br />
separately using Applanix’s POSPac Mobile<br />
Mapping Suite. The 18-mile stretch<br />
of highway provided excellent Global<br />
Navigation Satellite System conditions,<br />
with only a few interruptions to satellite<br />
lock. This made for a quick, easy trajectory<br />
processing experience. Once <strong>the</strong> data<br />
50<br />
SEPTEMBER/OCTOBER 2011<br />
© 2011 Earthwide Communications LLC, www.eijournal.com
were processed, we assessed <strong>the</strong> data’s<br />
quality—first to <strong>the</strong>mselves and second<br />
to <strong>the</strong> survey control points. These quality<br />
control checks happen before <strong>the</strong> data<br />
leave <strong>the</strong> RiProcess software suite.<br />
Data Analysis<br />
The analysis process entails visually<br />
inspecting <strong>the</strong> data by first examining <strong>the</strong><br />
system’s calibration. Because <strong>the</strong> Riegl<br />
VMX-250 is calibrated by <strong>the</strong> factory<br />
and <strong>the</strong> scanners are fixed in place on<br />
<strong>the</strong> measurement unit, <strong>the</strong> alignment of<br />
<strong>the</strong> scanners doesn’t drift, but it should<br />
be checked as part of any quality control<br />
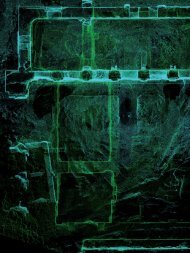
process. Figure 1 gives a vertical difference<br />
between <strong>the</strong> data from <strong>the</strong> two<br />
scanners in a single pass and shows that<br />
<strong>the</strong> vertical alignment of scanner one<br />
and two are within 0.02 feet, which is<br />
indicated by <strong>the</strong> blue-teal color. An area’s<br />
cross section, shown in Figure 2, also can<br />
provide additional analysis of <strong>the</strong> alignment’s<br />
quality.<br />
An analysis of <strong>the</strong> highlighted (yellow)<br />
section of <strong>the</strong> bridge deck, shown<br />
at <strong>the</strong> left side of Figure 2, includes<br />
3,260 points—an area 2.5 feet by 8 feet—<br />
and has a planar standard deviation of<br />
0.016932 feet in <strong>the</strong> vertical direction.<br />
The barrier wall of <strong>the</strong> bridge provided<br />
a visual confirmation of <strong>the</strong> horizontal<br />
Figure 1. A height difference plot compares single-pass scanner 1 and scanner 2.<br />
Figure 2. A cross section of a bridge was used to examine scanner alignment and calibration.<br />
The analysis process<br />
entails visually<br />
inspecting <strong>the</strong> data by<br />
first examining <strong>the</strong><br />
system’s calibration.<br />
alignment. With 3,556 points, <strong>the</strong> right<br />
side of Figure 2 shows a standard deviation<br />
of 0.025065 feet. This quick analysis<br />
gives us confidence that <strong>the</strong> relative<br />
alignment of <strong>the</strong> scanners is stable and<br />
no fur<strong>the</strong>r adjustment needs to be performed.<br />
This brings us to examining <strong>the</strong><br />
relative accuracy of two separate passes.<br />
Dual-Pass Analysis<br />
Again, we use a visual assessment to<br />
examine <strong>the</strong> height differences between<br />
<strong>the</strong> two passes. Because of <strong>the</strong> accuracy<br />
of <strong>the</strong> Global Positioning System (GPS),<br />
<strong>the</strong> height offset between two passes can<br />
drift from 0 to 4 inches of separation. As<br />
shown in Figure 3, <strong>the</strong> relative accuracy<br />
drifts to a 1.2-inch gap between <strong>the</strong> two<br />
passes. The LiDAR control target shows<br />
up clearly in <strong>the</strong> data as seen from <strong>the</strong><br />
top in reflectance view, Figure 4, where<br />
© 2011 Earthwide Communications LLC, www.eijournal.com<br />
Figure 3. Raw data separation was attributed to a relative difference in GPS positioning.<br />
Figure 4. Here <strong>the</strong> raw data match <strong>the</strong> control point.<br />
SEPTEMBER/OCTOBER 2011<br />
51
All changes are<br />
reviewed and<br />
adjusted at control<br />
points as needed,<br />
and <strong>the</strong>n <strong>the</strong> data are<br />
reprocessed to apply<br />
<strong>the</strong> changes.<br />
Figure 5. The tool interface allows users to define <strong>the</strong> size and shape of a cross section to repeat throughout <strong>the</strong> data.<br />
Figure 6. The Scan Alignment tool quality table shows<br />
areas that need more attention.<br />
<strong>the</strong> control chevron is seen in red. Reflectance<br />
is a calibrated intensity product<br />
of <strong>the</strong> system that allows for materials to<br />
have <strong>the</strong> same value whe<strong>the</strong>r 5 feet or 50<br />
feet away from <strong>the</strong> scanner. Now we need<br />
to resolve <strong>the</strong> GPS-induced variations in<br />
<strong>the</strong> data to deliver a consistent surface.<br />
Closing <strong>the</strong> Gap<br />
At this point in <strong>the</strong> workflow processing,<br />
it’s clear that <strong>the</strong> two scanners on <strong>the</strong><br />
Riegl VMX-250 are well aligned; however,<br />
<strong>the</strong> multiple passes need adjustment to<br />
bring parts of <strong>the</strong> mission path into a<br />
closer alignment—probably due to limitations<br />
in <strong>the</strong> accuracy of <strong>the</strong> differential<br />
GPS solution. The goal is to reduce any<br />
vertical offset between passes so <strong>the</strong> data<br />
are merged into a single cloud. Although<br />
<strong>the</strong> vertical relative alignment of multiple<br />
paths are within <strong>the</strong> GPS accuracy<br />
estimate of 2 inches, semi-automated<br />
extraction programs have a hard time<br />
determining where <strong>the</strong> ground lies when<br />
<strong>the</strong> point cloud is separated by even <strong>the</strong>se<br />
small vertical differences.<br />
Riegl <strong>Laser</strong> <strong>Measurement</strong> <strong>Systems</strong> has<br />
developed scan alignment tools to close<br />
relative data gaps based on observations<br />
in <strong>the</strong> LiDAR data and trajectory quality<br />
information. Such tools allow users<br />
to quickly analyze and correct data. By<br />
delivering high-quality data to third-party<br />
software packages for feature extraction,<br />
<strong>the</strong> whole process from collection to data<br />
delivery is smoo<strong>the</strong>r, more efficient and<br />
able to take full advantage of automated<br />
classification, segmentation and object<br />
extraction routines.<br />
The first step in scan alignment is<br />
to make cross sections for each control<br />
point section by making a single section<br />
and cloning it over <strong>the</strong> distance between<br />
control points, as shown in Figure 5.<br />
Some adjustment is required to trim out<br />
areas along <strong>the</strong> road that aren’t of primary<br />
concern, such as underpasses and vegetation.<br />
Once complete, an initial relative<br />
alignment calculation can be run for each<br />
control point site. Then each area is assigned<br />
a quality indicator, and areas with<br />
a yellow or red indicator require more<br />
attention, as shown in Figure 6.<br />
Each area can be selected for refinement<br />
based on a couple of parameters and<br />
filter options, and an absolute alignment<br />
Figures 7 and 8. Changes before (left) and after (right) alignment can be compared in real time.<br />
52<br />
SEPTEMBER/OCTOBER 2011<br />
© 2011 Earthwide Communications LLC, www.eijournal.com
can be performed at each control<br />
point. Shifts can be made to <strong>the</strong><br />
height and across positions for<br />
alignment. Typically <strong>the</strong> height<br />
is adjusted first, and an across<br />
shift is applied during refinement.<br />
The maximum plane separation<br />
distance, plane definition point<br />
variation and search radius can<br />
be adjusted to fit <strong>the</strong> user’s needs.<br />
The changes before (Figure 7) and<br />
after (Figure 8) alignment can be<br />
compared in real time to help<br />
<strong>the</strong> user visualize how <strong>the</strong> point<br />
cloud has been adjusted.<br />
All changes are reviewed and<br />
adjusted at control points as needed,<br />
and <strong>the</strong>n <strong>the</strong> data are reprocessed<br />
to apply <strong>the</strong> changes. The<br />
resulting point cloud now can be<br />
inspected between control points<br />
for any misalignment pockets.<br />
Using <strong>the</strong> scan alignment tool,<br />
quick work is made of closing <strong>the</strong><br />
gap to mitigate trajectory-induced<br />
errors in terms of weighted averaging<br />
of statistically independent<br />
measurements, as well as adjusting<br />
<strong>the</strong> data to <strong>the</strong> accuracy of <strong>the</strong><br />
absolute control. Some additional<br />
work to smooth out o<strong>the</strong>r parts of<br />
<strong>the</strong> data between control points<br />
may also be done <strong>the</strong> same way.<br />
Now <strong>the</strong> resulting point cloud is<br />
within <strong>the</strong> combined noise level<br />
of <strong>the</strong> laser sensors and independent<br />
ground control. In typical<br />
surveys, <strong>the</strong> point cloud shows<br />
vertical deviations of less than a<br />
half inch, as seen in Figure 9.<br />
End of <strong>the</strong> Processing Highway<br />
The road of quality control<br />
analysis comes to an end just<br />
before <strong>the</strong> many off-ramps leading<br />
to feature extraction software.<br />
The final few feet of <strong>the</strong> road are<br />
for data export, which is done<br />
with ease thanks to <strong>the</strong> simple<br />
export user interface in RiProcess.<br />
In most cases <strong>the</strong> user simply<br />
selects a file location and stores<br />
<strong>the</strong> point cloud in <strong>the</strong> ubiquitous<br />
LAS LiDAR data file format<br />
(www.liblas.org). In <strong>the</strong> next<br />
issue of Earth Imaging Journal,<br />
we’ll arrive at our destination<br />
with a look at some of <strong>the</strong> feature<br />
extraction tools and uses of <strong>the</strong><br />
Riegl VMX-250 mobile data.<br />
Figure 9. A section of <strong>the</strong> dual-pass adjusted highway displays vertical<br />
deviations of less than one-half inch.<br />
© 2011 Earthwide Communications LLC, www.eijournal.com<br />
SEPTEMBER/OCTOBER 2011<br />
53