OIL TANKER SPILL STATISTICS: 2009 - ITOPF
OIL TANKER SPILL STATISTICS: 2009 - ITOPF
OIL TANKER SPILL STATISTICS: 2009 - ITOPF

Create successful ePaper yourself
Turn your PDF publications into a flip-book with our unique Google optimized e-Paper software.
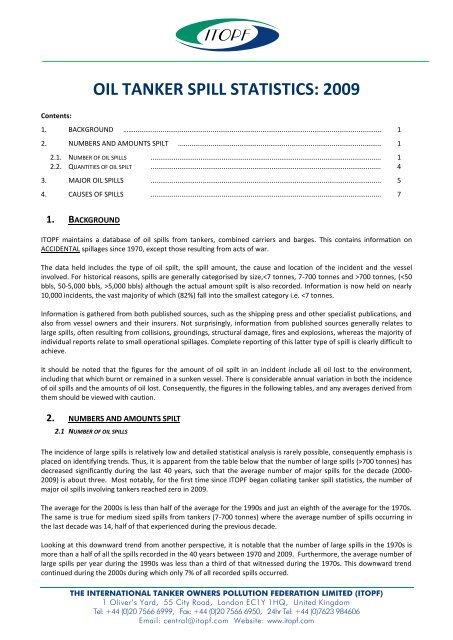
<strong>OIL</strong> <strong>TANKER</strong> <strong>SPILL</strong> <strong>STATISTICS</strong>: <strong>2009</strong><br />
Contents:<br />
1. BACKGROUND ……................................................................................................................................. 1<br />
2. NUMBERS AND AMOUNTS SPILT .......................................................................................................... 1<br />
2.1. NUMBER OF <strong>OIL</strong> <strong>SPILL</strong>S ........................................................................................................................ 1<br />
2.2. QUANTITIES OF <strong>OIL</strong> SPILT ........................................................................................................................ 4<br />
3. MAJOR <strong>OIL</strong> <strong>SPILL</strong>S ........................................................................................................................ 5<br />
4. CAUSES OF <strong>SPILL</strong>S ........................................................................................................................ 7<br />
1. BACKGROUND<br />
<strong>ITOPF</strong> maintains a database of oil spills from tankers, combined carriers and barges. This contains information on<br />
ACCIDENTAL spillages since 1970, except those resulting from acts of war.<br />
The data held includes the type of oil spilt, the spill amount, the cause and location of the incident and the vessel<br />
involved. For historical reasons, spills are generally categorised by size,700 tonnes, (5,000 bbls) although the actual amount spilt is also recorded. Information is now held on nearly<br />
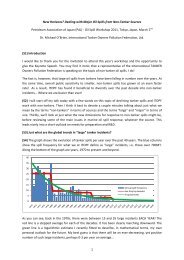
10,000 incidents, the vast majority of which (82%) fall into the smallest category i.e. 700 tonnes) has<br />
decreased significantly during the last 40 years, such that the average number of major spills for the decade (2000-<br />
<strong>2009</strong>) is about three. Most notably, for the first time since <strong>ITOPF</strong> began collating tanker spill statistics, the number of<br />
major oil spills involving tankers reached zero in <strong>2009</strong>.<br />
The average for the 2000s is less than half of the average for the 1990s and just an eighth of the average for the 1970s.<br />
The same is true for medium sized spills from tankers (7-700 tonnes) where the average number of spills occurring in<br />
the last decade was 14, half of that experienced during the previous decade.<br />
Looking at this downward trend from another perspective, it is notable that the number of large spills in the 1970s is<br />
more than a half of all the spills recorded in the 40 years between 1970 and <strong>2009</strong>. Furthermore, the average number of<br />
large spills per year during the 1990s was less than a third of that witnessed during the 1970s. This downward trend<br />
continued during the 2000s during which only 7% of all recorded spills occurred.<br />
THE INTERNATIONAL <strong>TANKER</strong> OWNERS POLLUTION FEDERATION LIMITED (<strong>ITOPF</strong>)<br />
1 Oliver’s Yard, 55 City Road, London EC1Y 1HQ, United Kingdom<br />
Tel: +44 (0)20 7566 6999, Fax: +44 (0)20 7566 6950, 24hr Tel: +44 (0)7623 984606<br />
Email: central@itopf.com Website: www.itopf.com
Number of Spills<br />
<strong>OIL</strong> <strong>TANKER</strong> <strong>SPILL</strong> <strong>STATISTICS</strong>: <strong>2009</strong><br />
Year 7-700 Tonnes > 700 Tonnes<br />
1970 7 29<br />
1971 18 14<br />
1972 48 27<br />
1973 28 32<br />
1974 89 28<br />
1975 96 23<br />
1976 67 27<br />
1977 68 17<br />
1978 59 21<br />
1979 60 35<br />
1980 52 13<br />
1981 54 7<br />
1982 45 4<br />
1983 52 13<br />
1984 26 8<br />
1985 31 8<br />
1986 28 7<br />
1987 27 10<br />
1988 11 10<br />
1989 33 13<br />
Year 7-700 Tonnes > 700 Tonnes<br />
1990 50 14<br />
1991 30 7<br />
1992 31 10<br />
1993 31 11<br />
1994 26 9<br />
1995 20 3<br />
1996 20 3<br />
1997 28 10<br />
1998 26 6<br />
1999 20 6<br />
2000 20 4<br />
2001 17 3<br />
2002 13 3<br />
2003 15 4<br />
2004 16 5<br />
2005 22 4<br />
2006 13 5<br />
2007 13 4<br />
2008 8 1<br />
<strong>2009</strong> 3 0<br />
TABLE 1: NUMBER OF <strong>SPILL</strong>S OVER 7 TONNES<br />
40<br />
35<br />
1970-79:<br />
25.4 spills<br />
per year on<br />
average<br />
30<br />
25<br />
20<br />
15<br />
1980-89:<br />
9.3 spills per<br />
year on<br />
average 1990-99:<br />
7.9 spills<br />
per year on<br />
average 2000-09:<br />
3.3 spills<br />
per year on<br />
average<br />
10<br />
5<br />
0<br />
1970 1975 1980 1985 1990 1995 2000 2005<br />
FIGURE 1: NUMBER OF LARGE <strong>SPILL</strong>S (OVR 700 TONNES), FROM 1970 TO <strong>2009</strong><br />
©<strong>ITOPF</strong> 2010 2
<strong>OIL</strong> <strong>TANKER</strong> <strong>SPILL</strong> <strong>STATISTICS</strong>: <strong>2009</strong><br />
900<br />
800<br />
700<br />
600<br />
500<br />
400<br />
300<br />
200<br />
100<br />
0<br />
1970s 1980s 1990s 2000s<br />
> 700 tonnes<br />
7-700 tonnes<br />
FIGURE 2: NUMBER OF MEDIUM (7-700 TONNES) AND LARGE (> 700 TONNES) <strong>SPILL</strong>S PER DECADE FROM 1970 TO <strong>2009</strong><br />
2.2 QUANTITIES OF <strong>OIL</strong> SPILT<br />
The vast majority of spills are small (i.e. less than 7 tonnes) and data on numbers and amounts is incomplete due to the<br />
inconsistent reporting of smaller incidents worldwide.<br />
Reports on spills of 7 tonnes and above tend to be more reliable and information from these are included in the database to give<br />
a series of annual estimates of the total quantity spilled for the years 1970-<strong>2009</strong>. These amounts are rounded to the nearest<br />
thousand where practical.<br />
Year<br />
Quantity (tonnes)<br />
1970 330,000<br />
1971 138,000<br />
1972 297,000<br />
1973 164,000<br />
1974 174,000<br />
1975 355,000<br />
1976 398,000<br />
1977 291,000<br />
1978 352,000<br />
1979 641,000<br />
1970s Total 3,140,000<br />
1980 206,000<br />
1980 206,000<br />
1981 48,000<br />
1982 12,000<br />
1983 384,000<br />
1984 29,000<br />
1985 85,000<br />
1986 19,000<br />
1987 30,000<br />
1988 190,000<br />
1989 174,000<br />
1980s Total 1,177,000<br />
Year<br />
Quantity (tonnes)<br />
1990 61,000<br />
1991 430,000<br />
1992 167,000<br />
1993 140,000<br />
1994 130,000<br />
1995 12,000<br />
1996 80,000<br />
1997 72,000<br />
1998 15,000<br />
1999 29,000<br />
1990s Total 1,136,000<br />
2000 14,000<br />
2000 14,000<br />
2001 8,000<br />
2002 67,000<br />
2003 42,000<br />
2004 15,000<br />
2005 18,000<br />
2006 23,000<br />
2007 18,000<br />
2008 2,000<br />
<strong>2009</strong> 100<br />
2000s Total 206,000<br />
TABLE 2: ANNUAL QUANTITY OF <strong>OIL</strong> SPILT<br />
©<strong>ITOPF</strong> 2010 3
000's tonnes<br />
<strong>OIL</strong> <strong>TANKER</strong> <strong>SPILL</strong> <strong>STATISTICS</strong>: <strong>2009</strong><br />
Approximately 5.65 million tonnes of oil were lost as a result of tanker incidents from 1970 to <strong>2009</strong>. However, as figure 4<br />
indicates, the volume of oil spilt from tankers does demonstrate a significant improvement through the decades. Consistent<br />
with the reduction in the number of oil spills from tankers, the volume of oil spilt also shows a marked reduction. In some cases,<br />
the total quantity of oil spilt in the last decade was less than had been spilt previously in a single year. Last year the volume of oil<br />
spilt was the lowest in <strong>ITOPF</strong>’s history of collating statistics on tanker spills.<br />
It is notable that a few very large spills are responsible for a high percentage of the oil spilt. For example, in the 1990s, 360 spills<br />
over 7 tonnes were recorded, totalling 1,136,000 tonnes of oil, but 830,000 tonnes (73%) were spilt in just 10 incidents (just<br />
under 3% of the number of incidents in that decade). In comparison, in 2000s, 172 spills over 7 tonnes were recorded, totalling<br />
206,000 tonnes of oil, but 93,000 tonnes (45%) were spilt in just 2 incidents (1%). The figures for a particular year may therefore<br />
be severely distorted by a single large incident. This is clearly illustrated in 1979 (ATLANTIC EMPRESS - 287,000 tonnes), 1983<br />
(CASTILLO DE BELLVER - 252,000 tonnes) and 1991 (ABT SUMMER - 260,000 tonnes).<br />
700<br />
600<br />
500<br />
ATLANTIC EMPRESS<br />
287,000 tonnes<br />
CASTILLO DE BELLVER<br />
252,000 tonnes<br />
ABT SUMMER<br />
260,000 tonnes<br />
400<br />
300<br />
200<br />
KHARK V<br />
80,000 tonnes<br />
EXXON VALDEZ<br />
37,000 tonnes<br />
SEA EMPRESS<br />
72,000 tonnes<br />
ERIKA<br />
20,000 tonnes<br />
PRESTIGE<br />
63,000 tonnes<br />
100<br />
HEBEI SPIRIT<br />
10,500 tonnes<br />
0<br />
1970 1973 1976 1979 1982 1985 1988 1991 1994 1997 2000 2003 2006 <strong>2009</strong><br />
FIGURE 3: QUANTITIES OF <strong>OIL</strong> SPILT (OVER 7 TONNES) FROM 1970 TO <strong>2009</strong><br />
1990s<br />
20.1%<br />
2000s<br />
3.6%<br />
1980s<br />
20.8%<br />
1970s<br />
55.5%<br />
FIGURE 4: PERCENTAGE OF TOTAL <strong>OIL</strong> SPILT PER DECADE FROM 1970 - <strong>2009</strong><br />
©<strong>ITOPF</strong> 2010 4
<strong>OIL</strong> <strong>TANKER</strong> <strong>SPILL</strong> <strong>STATISTICS</strong>: <strong>2009</strong><br />
Apart from a fall in the early 1980s during the worldwide economic recession, seaborne oil trade has grown steadily from 1970<br />
to the present (Figure 5). As increased movements would normally signal increased risk, it is encouraging to learn that<br />
downward trends in oil spills continue despite an overall increase in oil trading over the period.<br />
FIGURE 5: SEABORNE <strong>OIL</strong> TRADE AND NUMBER OF <strong>TANKER</strong> <strong>SPILL</strong>S OVER 7 TONNES, 1970 TO 2008<br />
(Updated figures for <strong>2009</strong> are not available at this time)<br />
3. MAJOR <strong>OIL</strong> <strong>SPILL</strong>S<br />
The table below gives a brief summary of 20 major oil spills since 1967, and the map overleaf shows where they occurred. A<br />
number of these incidents, despite their large size, caused little or no environmental damage as the oil was spilt some distance<br />
offshore and did not impact coastlines. It is for this reason that some of the listed names may be unfamiliar. EXXON VALDEZ is<br />
included for comparison although this incident falls someway outside the group.<br />
Position Shipname Year Location Spill Size (tonnes)<br />
1 ATLANTIC EMPRESS 1979 Off Tobago, West Indies 287,000<br />
2 ABT SUMMER 1991 700 nautical miles off Angola 260,000<br />
3 CASTILLO DE BELLVER 1983 Off Saldanha Bay, South Africa 252,000<br />
4 AMOCO CADIZ 1978 Off Brittany, France 223,000<br />
5 HAVEN 1991 Genoa, Italy 144,000<br />
6 ODYSSEY 1988 700 nautical miles off Nova Scotia, Canada 132,000<br />
7 TORREY CANYON 1967 Scilly Isles, UK 119,000<br />
8 SEA STAR 1972 Gulf of Oman 115,000<br />
9 IRENES SERENADE 1980 Navarino Bay, Greece 100,000<br />
10 URQUIOLA 1976 La Coruna, Spain 100,000<br />
11 HAWAIIAN PATRIOT 1977 300 nautical miles off Honolulu 95,000<br />
12 INDEPENDENTA 1979 Bosphorus, Turkey 95,000<br />
13 JAKOB MAERSK 1975 Oporto, Portugal 88,000<br />
14 BRAER 1993 Shetland Islands, UK 85,000<br />
15 KHARK 5 1989 120 nautical miles off Atlantic coast of Morocco 80,000<br />
16 AEGEAN SEA 1992 La Coruna, Spain 74,000<br />
17 SEA EMPRESS 1996 Milford Haven, UK 72,000<br />
18 NOVA 1985 Off Kharg Island, Gulf of Iran 70,000<br />
19 KATINA P. 1992 Off Maputo, Mozambique 66,700<br />
20 PRESTIGE 2002 Off Spanish coast 63,000<br />
35 EXXON VALDEZ 1989 Prince William Sound, Alaska, USA 37,000<br />
TABLE 3: MAJOR <strong>OIL</strong> <strong>SPILL</strong>S SINCE 1967<br />
©<strong>ITOPF</strong> 2010 5
<strong>OIL</strong> <strong>TANKER</strong> <strong>SPILL</strong> <strong>STATISTICS</strong>: <strong>2009</strong><br />
FIGURE 6: LOCATION OF MAJOR <strong>SPILL</strong>S<br />
©<strong>ITOPF</strong> 2010 6
<strong>OIL</strong> <strong>TANKER</strong> <strong>SPILL</strong> <strong>STATISTICS</strong>: <strong>2009</strong><br />
4. CAUSES OF <strong>SPILL</strong>S<br />
Most incidents are the result of a combination of actions and circumstances, all of which contribute in varying degrees to the<br />
final outcome. The following analysis explores the incidence of spills of different sizes in terms of the primary event or<br />
operation in progress at the time of the spill. These "causes" have been grouped into "Operations" and "Accidents". Spills for<br />
which the relevant information is not available or where the cause was not one of those given are listed under<br />
"Other/unknown".<br />
It is apparent from the table that:<br />
<br />
<br />
<br />
most spills from tankers result from routine operations such as loading, discharging and bunkering which normally<br />
occur in ports or at oil terminals;<br />
the majority of these operational spills are small, with some 90% involving quantities of less than 7 tonnes;<br />
accidental causes such as collisions and groundings generally give rise to much larger spills, with at least 84% of these<br />
incidents involving quantities in excess of 700 tonnes.<br />
700 Tonnes Total<br />
OPERATIONS<br />
Loading / Discharging 3155 383 36 3574<br />
Bunkering 560 32 0 593<br />
Other Operations 1221 62 5 1305<br />
ACCIDENTS<br />
Collisions 176 334 129 640<br />
Groundings 236 265 161 662<br />
Hull Failures 205 57 55 316<br />
Equipment Failures 206 39 4 249<br />
Fire & Explosions 87 33 32 152<br />
Other/Unknown 1983 44 22 2049<br />
TOTAL 7829 1249 444 9522<br />
TABLE 4: INCIDENCE OF <strong>SPILL</strong>S BY CAUSE (700 TONNES 1970- <strong>2009</strong>)<br />
©<strong>ITOPF</strong> 2010 7
<strong>OIL</strong> <strong>TANKER</strong> <strong>SPILL</strong> <strong>STATISTICS</strong>: <strong>2009</strong><br />
Equipment failures<br />
2.6%<br />
Unknown/ Other<br />
25.3%<br />
Loading/Discharging<br />
40.3%<br />
Hull failures<br />
2.6%<br />
Bunkering<br />
7.2%<br />
Fire & Explosions<br />
1.1%<br />
Other operations<br />
15.6%<br />
Groundings<br />
3.0%<br />
Collisions<br />
2.2%<br />
FIGURE 7: INCIDENCE OF <strong>SPILL</strong>S < 7 TONNES BY CAUSE, FROM 1974 TO <strong>2009</strong><br />
(Data before 1974 is not available)<br />
Fire & Explosions<br />
2.6%<br />
Other operations<br />
5%<br />
Other/Unknown<br />
3.5%<br />
Collisions<br />
26.7%<br />
Loading/ Discharging<br />
30.7%<br />
Bunkering<br />
2.6%<br />
Equipment failures<br />
3.1%<br />
Hull failures<br />
4.6%<br />
Groundings<br />
21.2%<br />
FIGURE 8: INCIDENCE OF <strong>SPILL</strong>S 7-700 TONNES BY CAUSE, FROM 1970 TO <strong>2009</strong><br />
Fire & Explosions<br />
7.2%<br />
Other operations<br />
1.1%<br />
Other/ Unknown<br />
5%<br />
Equipment failures<br />
0.9%<br />
Collisions<br />
29.1%<br />
Hull failures<br />
12.4%<br />
Loading/Discharging<br />
8.1%<br />
Groundings<br />
36.3%<br />
FIGURE 9: INCIDENCE OF <strong>SPILL</strong>S >700 TONNES BY CAUSE, FROM 1970 TO <strong>2009</strong><br />
©<strong>ITOPF</strong> 2010 8