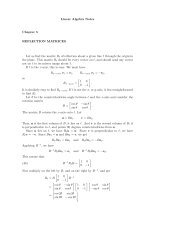
Answer Key - Problem Set 3
Answer Key - Problem Set 3
Answer Key - Problem Set 3

You also want an ePaper? Increase the reach of your titles
YUMPU automatically turns print PDFs into web optimized ePapers that Google loves.
EC132.01(02)<br />
Serge Kasyanenko<br />
Principles of Macroeconomics Fall 2005<br />
<strong>Answer</strong> <strong>Key</strong> - <strong>Problem</strong> <strong>Set</strong> 3<br />
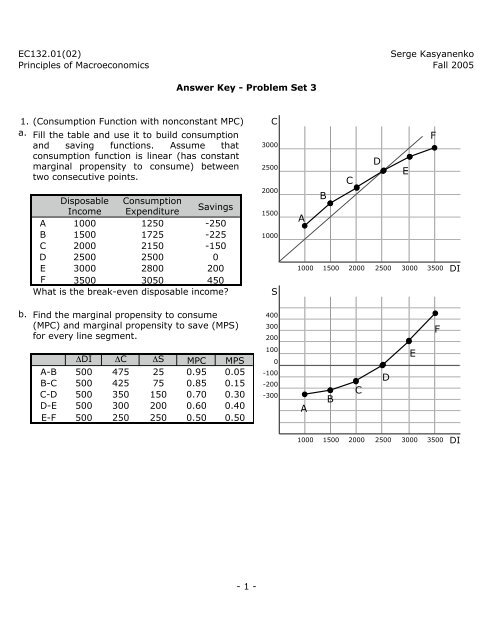
1. (Consumption Function with nonconstant MPC) C<br />
a. Fill the table and use it to build consumption<br />
and saving functions. Assume that 3000<br />
consumption function is linear (has constant<br />
marginal propensity to consume) between 2500<br />
two consecutive points.<br />
Disposable Consumption<br />
Income Expenditure<br />
Savings<br />
A<br />
B<br />
C<br />
D<br />
E<br />
1000<br />
1500<br />
2000<br />
2500<br />
3000<br />
1250<br />
1725<br />
2150<br />
2500<br />
2800<br />
-250<br />
-225<br />
-150<br />
0<br />
200<br />
F 3500 3050 450<br />
What is the break-even disposable income?<br />
2000<br />
1500<br />
1000<br />
S<br />
D<br />
C<br />
B<br />
A<br />
1000 1500 2000 2500<br />
E<br />
3000<br />
F<br />
3500<br />
DI<br />
b.<br />
Find the marginal propensity to consume<br />
(MPC) and marginal propensity to save (MPS)<br />
for every line segment.<br />
400<br />
300<br />
200<br />
F<br />
ΔDI ΔC ΔS MPC<br />
A-B 500 475 25 0.95<br />
B-C 500 425 75 0.85<br />
C-D 500 350 150 0.70<br />
D-E 500 300 200 0.60<br />
E-F 500 250 250 0.50<br />
MPS<br />
0.05<br />
0.15<br />
0.30<br />
0.40<br />
0.50<br />
100<br />
0<br />
-100<br />
-200<br />
-300<br />
A<br />
B<br />
C<br />
D<br />
E<br />
1000 1500 2000 2500<br />
3000 3500<br />
DI<br />
- 1 -
2.<br />
If f(x) is a linear function of x then it can be mathematical represented in the following form:<br />
f(x)=a+b*x, where a (intercept) and b (slope) are two arbitrary constants. Thus, we can<br />
represent consumption and saving function with the same analytical expression. For a linear<br />
function it is sufficient to know two arbitrary point on the line to find the values of both a and b.<br />
For example, took two points form table 6-3 (page 109) in your text:<br />
Disposable<br />
Income<br />
24000<br />
25000<br />
Consumption<br />
Saving<br />
First, let find a and b for the consumption function. We know that the slope of the consumption<br />
function b is equal to the MPC, thus we can find b by dividing a change in consumption (800)<br />
with a change in income (1000):<br />
thus our consumption function is:<br />
C = 5 000 + 0.8*DI (1)<br />
You may use point B to check that it is actually true:<br />
A<br />
B<br />
24200<br />
25000<br />
b=MPC=ΔC/ΔDI=800/1000=0.8<br />
To find a simply use either point A or B in the following way: since C=a+b*DI, consumption at<br />
point A is equal to:<br />
C(B) = 5 000 + 0.8*25 000 = 5 000 + 20 000 = 25 000<br />
The same logic applied to the savings function: S=a+b*DI, where b is the slope of the saving<br />
function which is equal to the marginal propensity to save (0.2 in this table). To find a for this<br />
function use same steps as with consumption function:<br />
-200<br />
24 200 = a+0.8*24 000 or a = 24 200 - 0.8*24 000 = 24 200 - 19 200 = 5 000<br />
-200 = a+0.2*24 000 or a = -200 - 0.2*24 000 =- 200 - 4 800 = - 5 000<br />
as a result, the saving function is<br />
S = - 5 000 + 0.2*DI (2)<br />
Alternatively, you can use your consumption function to derive the savings function:<br />
S = DI-C, S = DI - 5000 - 0.8*DI = - 5000 + 0.2*DI<br />
0<br />
i.<br />
ii.<br />
Using data from the problem 1 fill the following table:<br />
Consumption<br />
function<br />
Saving function<br />
intercept a slope b intercept a slope b<br />
A-B<br />
B-C<br />
300<br />
450<br />
0.95<br />
0.85<br />
-300<br />
-450<br />
0.05<br />
0.15<br />
C-D<br />
D-E<br />
E-F<br />
750<br />
1000<br />
1300<br />
0.70<br />
0.60<br />
0.50<br />
-750<br />
-1000<br />
-1300<br />
0.30<br />
0.40<br />
0.50<br />
What is the economic meaning of the intercepts a of savings and consumption functions?<br />
ANSWER: The value of intercept shows the consumption (savings) when disposable income is<br />
equal to zero. That is in case of consumption function a represents the amount household<br />
needs to consume in order to survive.<br />
- 2 -
05<br />
iii.<br />
How will you use equations 1 and 2 to find the break-even disposable income? (You may either<br />
show it in a general case or for any given a and b from the table.)<br />
ANSWER: To find break even income you have either to equate savings to zero or<br />
consumption to disposable income:<br />
using savings function:<br />
S=0, aS+bS*DI=0 thus DI=-aS/bS<br />
using consumption function:<br />
C=DI, aC+bC*DI=DI thus DI=aC/(1-bC)<br />
for example for the segment A-B aS=-300, bS=0.05, and aC=300, bC=0.95<br />
then S=0 implies that DI=-(-300)/0.05=6000<br />
and C=DI implies that DI=300/(1-0.95)=6000<br />
- 3 -
3. (Fiscal Policy and the Multiplier Model)<br />
a. Fill the table and find the marginal propensities to consume and save.<br />
A<br />
B<br />
C<br />
D<br />
E<br />
GDP Taxes<br />
Disposable Consumption Planned Government Total Planned<br />
Income Expenditure Investment Purchases Expenditure<br />
Q<br />
T DI<br />
C<br />
I<br />
G C+I+G=TE<br />
7000 350 6650 6400 250 150 6800<br />
6500 350 6150 6000 250 150 6400<br />
6000 350 5650 5600 250 150 6000<br />
5500 350 5150 5200 250 150 5600<br />
5000 350 4650 4800 250 150 5200<br />
What is the equilibrium level of GDP?<br />
6000<br />
b. What is the value of the government expenditure multiplier?<br />
What is the value of the tax multiplier?<br />
5.00<br />
4.00<br />
c.<br />
If the government wants to increase GDP with 1000 how should it use each of the fiscal policy instrum<br />
(Discuss each of the instruments separately)<br />
(indicate both the direction and the magnitude of the change)<br />
1) increase government purchases by:<br />
200<br />
2) decrease taxes by:<br />
250<br />
d. Illustrate question c with a multiplier model (<strong>Key</strong>nesian cross) diagram.<br />
TE<br />
TE=C+I+G+ΔG+X<br />
TE<br />
TE=C+I+G+X+ΔT*MPC<br />
↑<br />
TE=C+I+G+X<br />
↑<br />
TE=C+I+G+X<br />
ΔG=200<br />
ΔT*MPC=<br />
250*0.8=200<br />
ΔQ=1000<br />
ΔQ=1000<br />
Q0<br />
→<br />
Q1<br />
GDP<br />
Q0<br />
→<br />
Q1<br />
GDP<br />
- 4 -