Downstream speech enhancement in a low directivity binaural ...
Downstream speech enhancement in a low directivity binaural ...
Downstream speech enhancement in a low directivity binaural ...

Create successful ePaper yourself
Turn your PDF publications into a flip-book with our unique Google optimized e-Paper software.
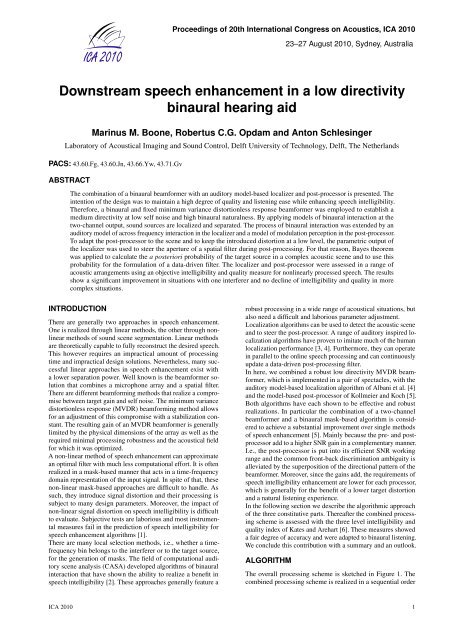
Proceed<strong>in</strong>gs of 20th International Congress on Acoustics, ICA 2010<br />
23–27 August 2010, Sydney, Australia<br />
<strong>Downstream</strong> <strong>speech</strong> <strong>enhancement</strong> <strong>in</strong> a <strong>low</strong> <strong>directivity</strong><br />
b<strong>in</strong>aural hear<strong>in</strong>g aid<br />
Mar<strong>in</strong>us M. Boone, Robertus C.G. Opdam and Anton Schles<strong>in</strong>ger<br />
Laboratory of Acoustical Imag<strong>in</strong>g and Sound Control, Delft University of Technology, Delft, The Netherlands<br />
PACS: 43.60.Fg, 43.60.Jn, 43.66.Yw, 43.71.Gv<br />
ABSTRACT<br />
The comb<strong>in</strong>ation of a b<strong>in</strong>aural beamformer with an auditory model-based localizer and post-processor is presented. The<br />
<strong>in</strong>tention of the design was to ma<strong>in</strong>ta<strong>in</strong> a high degree of quality and listen<strong>in</strong>g ease while enhanc<strong>in</strong>g <strong>speech</strong> <strong>in</strong>telligibility.<br />
Therefore, a b<strong>in</strong>aural and fixed m<strong>in</strong>imum variance distortionless response beamformer was employed to establish a<br />
medium <strong>directivity</strong> at <strong>low</strong> self noise and high b<strong>in</strong>aural naturalness. By apply<strong>in</strong>g models of b<strong>in</strong>aural <strong>in</strong>teraction at the<br />
two-channel output, sound sources are localized and separated. The process of b<strong>in</strong>aural <strong>in</strong>teraction was extended by an<br />
auditory model of across frequency <strong>in</strong>teraction <strong>in</strong> the localizer and a model of modulation perception <strong>in</strong> the post-processor.<br />
To adapt the post-processor to the scene and to keep the <strong>in</strong>troduced distortion at a <strong>low</strong> level, the parametric output of<br />
the localizer was used to steer the aperture of a spatial filter dur<strong>in</strong>g post-process<strong>in</strong>g. For that reason, Bayes theorem<br />
was applied to calculate the a posteriori probability of the target source <strong>in</strong> a complex acoustic scene and to use this<br />
probability for the formulation of a data-driven filter. The localizer and post-processor were assessed <strong>in</strong> a range of<br />
acoustic arrangements us<strong>in</strong>g an objective <strong>in</strong>telligibility and quality measure for nonl<strong>in</strong>early processed <strong>speech</strong>. The results<br />
show a significant improvement <strong>in</strong> situations with one <strong>in</strong>terferer and no decl<strong>in</strong>e of <strong>in</strong>telligibility and quality <strong>in</strong> more<br />
complex situations.<br />
INTRODUCTION<br />
There are generally two approaches <strong>in</strong> <strong>speech</strong> <strong>enhancement</strong>.<br />
One is realized through l<strong>in</strong>ear methods, the other through nonl<strong>in</strong>ear<br />
methods of sound scene segmentation. L<strong>in</strong>ear methods<br />
are theoretically capable to fully reconstruct the desired <strong>speech</strong>.<br />
This however requires an impractical amount of process<strong>in</strong>g<br />
time and impractical design solutions. Nevertheless, many successful<br />
l<strong>in</strong>ear approaches <strong>in</strong> <strong>speech</strong> <strong>enhancement</strong> exist with<br />
a <strong>low</strong>er separation power. Well known is the beamformer solution<br />
that comb<strong>in</strong>es a microphone array and a spatial filter.<br />
There are different beamform<strong>in</strong>g methods that realize a compromise<br />
between target ga<strong>in</strong> and self noise. The m<strong>in</strong>imum variance<br />
distortionless response (MVDR) beamform<strong>in</strong>g method al<strong>low</strong>s<br />
for an adjustment of this compromise with a stabilization constant.<br />
The result<strong>in</strong>g ga<strong>in</strong> of an MVDR beamformer is generally<br />
limited by the physical dimensions of the array as well as the<br />
required m<strong>in</strong>imal process<strong>in</strong>g robustness and the acoustical field<br />
for which it was optimized.<br />
A non-l<strong>in</strong>ear method of <strong>speech</strong> <strong>enhancement</strong> can approximate<br />
an optimal filter with much less computational effort. It is often<br />
realized <strong>in</strong> a mask-based manner that acts <strong>in</strong> a time-frequency<br />
doma<strong>in</strong> representation of the <strong>in</strong>put signal. In spite of that, these<br />
non-l<strong>in</strong>ear mask-based approaches are difficult to handle. As<br />
such, they <strong>in</strong>troduce signal distortion and their process<strong>in</strong>g is<br />
subject to many design parameters. Moreover, the impact of<br />
non-l<strong>in</strong>ear signal distortion on <strong>speech</strong> <strong>in</strong>telligibility is difficult<br />
to evaluate. Subjective tests are laborious and most <strong>in</strong>strumental<br />
measures fail <strong>in</strong> the prediction of <strong>speech</strong> <strong>in</strong>telligibility for<br />
<strong>speech</strong> <strong>enhancement</strong> algorithms [1].<br />
There are many local selection methods, i.e., whether a timefrequency<br />
b<strong>in</strong> belongs to the <strong>in</strong>terferer or to the target source,<br />
for the generation of masks. The field of computational auditory<br />
scene analysis (CASA) developed algorithms of b<strong>in</strong>aural<br />
<strong>in</strong>teraction that have shown the ability to realize a benefit <strong>in</strong><br />
<strong>speech</strong> <strong>in</strong>telligibility [2]. These approaches generally feature a<br />
robust process<strong>in</strong>g <strong>in</strong> a wide range of acoustical situations, but<br />
also need a difficult and laborious parameter adjustment.<br />
Localization algorithms can be used to detect the acoustic scene<br />
and to steer the post-processor. A range of auditory <strong>in</strong>spired localization<br />
algorithms have proven to imitate much of the human<br />
localization performance [3, 4]. Furthermore, they can operate<br />
<strong>in</strong> parallel to the onl<strong>in</strong>e <strong>speech</strong> process<strong>in</strong>g and can cont<strong>in</strong>uously<br />
update a data-driven post-process<strong>in</strong>g filter.<br />
In here, we comb<strong>in</strong>ed a robust <strong>low</strong> <strong>directivity</strong> MVDR beamformer,<br />
which is implemented <strong>in</strong> a pair of spectacles, with the<br />
auditory model-based localization algorithm of Albani et al. [4]<br />
and the model-based post-processor of Kollmeier and Koch [5].<br />
Both algorithms have each shown to be effective and robust<br />
realizations. In particular the comb<strong>in</strong>ation of a two-channel<br />
beamformer and a b<strong>in</strong>aural mask-based algorithm is considered<br />
to achieve a substantial improvement over s<strong>in</strong>gle methods<br />
of <strong>speech</strong> <strong>enhancement</strong> [5]. Ma<strong>in</strong>ly because the pre- and postprocessor<br />
add to a higher SNR ga<strong>in</strong> <strong>in</strong> a complementary manner.<br />
I.e., the post-processor is put <strong>in</strong>to its efficient SNR work<strong>in</strong>g<br />
range and the common front-back discrim<strong>in</strong>ation ambiguity is<br />
alleviated by the superposition of the directional pattern of the<br />
beamformer. Moreover, s<strong>in</strong>ce the ga<strong>in</strong>s add, the requirements of<br />
<strong>speech</strong> <strong>in</strong>telligibility <strong>enhancement</strong> are <strong>low</strong>er for each processor,<br />
which is generally for the benefit of a <strong>low</strong>er target distortion<br />
and a natural listen<strong>in</strong>g experience.<br />
In the fol<strong>low</strong><strong>in</strong>g section we describe the algorithmic approach<br />
of the three constitutive parts. Thereafter the comb<strong>in</strong>ed process<strong>in</strong>g<br />
scheme is assessed with the three level <strong>in</strong>telligibility and<br />
quality <strong>in</strong>dex of Kates and Arehart [6]. These measures showed<br />
a fair degree of accuracy and were adapted to b<strong>in</strong>aural listen<strong>in</strong>g.<br />
We conclude this contribution with a summary and an outlook.<br />
ALGORITHM<br />
The overall process<strong>in</strong>g scheme is sketched <strong>in</strong> Figure 1. The<br />
comb<strong>in</strong>ed process<strong>in</strong>g scheme is realized <strong>in</strong> a sequential order<br />
ICA 2010 1
23–27 August 2010, Sydney, Australia Proceed<strong>in</strong>gs of 20th International Congress on Acoustics, ICA 2010<br />
and is entirely performed <strong>in</strong> the digital frequency doma<strong>in</strong>. The<br />
overall output demand is to enhance the signal <strong>in</strong> the frontal<br />
l<strong>in</strong>e of sight and to attenuate noise from all other directions.<br />
The two comb<strong>in</strong>ed methods use different constra<strong>in</strong>ts to perform<br />
this task. The MVDR beamform<strong>in</strong>g algorithm does not al<strong>low</strong><br />
target distortion, while the b<strong>in</strong>aural post-processor <strong>in</strong>tr<strong>in</strong>sically<br />
performs target distortion and has therefore to be implemented<br />
with great care. A dichotic signal is ma<strong>in</strong>ta<strong>in</strong>ed throughout the<br />
process<strong>in</strong>g and presented to the ears. The fol<strong>low</strong><strong>in</strong>g divisions<br />
give a synopsis of the applied MVDR beamform<strong>in</strong>g method,<br />
the localizer and the post-processor.<br />
Figure 1: Comb<strong>in</strong>ed process<strong>in</strong>g scheme of a b<strong>in</strong>aural MVDR<br />
beamformer, realized <strong>in</strong> the arms of a pair of spectacles, and an<br />
auditory model based localizer and post-processor.<br />
B<strong>in</strong>aural Beamformer<br />
The technique of MVDR beamform<strong>in</strong>g facilitates maximal <strong>directivity</strong><br />
ga<strong>in</strong> for a given array configuration and assumptions<br />
of the noise field. The optimal filters are calculated <strong>in</strong> an optimization<br />
rout<strong>in</strong>e that maximizes the array’s ga<strong>in</strong> with the filters<br />
F(k) as parameter. The method generally suffers from a large<br />
noise sensitivity. The optimization procedure was therefore supplemented<br />
to achieve a maximum ga<strong>in</strong> at a predef<strong>in</strong>ed noise<br />
sensitivity [7, 8]. The array of microphones is al<strong>in</strong>ed <strong>in</strong> an endfire<br />
configuration along the z-axis and resides <strong>in</strong> the arms of a<br />
pair of spectacles. The optimal filters are then calculated as fol<strong>low</strong>s:<br />
First, the propagation delay vector W(k,θ,φ) for θ = 0,<br />
φ = 0 for a plane wave can be formalized as:<br />
W(k) = [e jkz1 e jkz2 ... e jkzN ] T , (1)<br />
for omnidirectional transducers at positions z1 ...,zN (k is the<br />
wavenumber and j = √ −1). When multiply<strong>in</strong>g the propagation<br />
delay vector with the filter vector and summ<strong>in</strong>g them, the array<br />
frequency response to a plane wave from the target direction<br />
reads:<br />
Γ T(k) = F T (k)W(k). (2)<br />
The array <strong>directivity</strong> factor, i.e., the averaged squared arrays target<br />
response |Γ T(k,θ,φ)| 2 divided by the average squared array<br />
response of sound <strong>in</strong>cident from all directions |Γ(k,θ,φ)| 2 , is<br />
employed as an objective function <strong>in</strong> the optimization process<br />
[8]. In matrix notation, the <strong>directivity</strong> factor is consequently<br />
given by:<br />
Q(k) = maxθ,φ {FH (k)W∗ (k)WH (k)F(k)}<br />
FH (k)ST , (3)<br />
(k)F(k)<br />
where (◦) H is the Hermitian transpose, (◦) ∗ is the conjugatecomplex<br />
operator and S is the cross-spectral density matrix of<br />
the microphones <strong>in</strong> the noise field. It is assumed that the noise<br />
field is isotropic and uniform, hence <strong>in</strong> the endfire configuration<br />
of the microphones the elements of S are given by:<br />
Smn = s<strong>in</strong>(k(zm − zn))<br />
. (4)<br />
(k(zm − zn))<br />
The optimization rout<strong>in</strong>e of the optimal beamform<strong>in</strong>g method,<br />
which was developed <strong>in</strong> [9] and adapted to the presented application<br />
<strong>in</strong> [8], is def<strong>in</strong>ed as:<br />
m<strong>in</strong><br />
F(k) {FH (k)S(k) T F(k)}, (5)<br />
while adher<strong>in</strong>g to Γ T(k) = 1 and a predef<strong>in</strong>ed maximal al<strong>low</strong>ed<br />
noise sensitivity F H (k)F(k) < Ψ max. Fol<strong>low</strong><strong>in</strong>g [8], the solution<br />
to the problem is:<br />
F T<br />
opt,β (k) = WH (k)(S(k) + β(k)I) −1<br />
WH (k)(S(k) + β(k)I) −1 . (6)<br />
W(k)<br />
In this formula (◦) −1 <strong>in</strong>dicates the <strong>in</strong>verse of a matrix, I the<br />
identity matrix and β(k) is a stabiliz<strong>in</strong>g factor that determ<strong>in</strong>es<br />
the level of the sensor noise that is adapted dur<strong>in</strong>g the optimization.<br />
The filters were calculated for an array with 4 omnidirectional<br />
transducers at a length of 72 mm. Subjective list<strong>in</strong>g tests yielded<br />
an advantage <strong>in</strong> SNR for normal hear<strong>in</strong>g subjects of 7.5 dB<br />
and for hear<strong>in</strong>g impaired subjects of 6.2 dB [8]. This notable<br />
<strong>enhancement</strong> of <strong>speech</strong> <strong>in</strong>telligibility attracted commercial attention<br />
and the development was further adapted for a cas<strong>in</strong>g<br />
of the entire process<strong>in</strong>g of the highly directive hear<strong>in</strong>g aid <strong>in</strong><br />
the arms of a pair of spectacles. For daily use three programs of<br />
different <strong>directivity</strong> (omnidirectional, <strong>low</strong> and high <strong>directivity</strong>)<br />
were calculated. The filters are applied <strong>in</strong> a weighted overlapadd<br />
design <strong>in</strong> 31 subbands. A measurement of the <strong>directivity</strong><br />
<strong>in</strong>dex (DI(k) = 10log 10 (Q(k))) of the hear<strong>in</strong>g glasses worn by<br />
an artificial head showed an averaged ga<strong>in</strong> <strong>in</strong> SNR of 7.2 dB<br />
<strong>in</strong> the high <strong>directivity</strong> mode and 4.4 dB for the <strong>low</strong> <strong>directivity</strong><br />
mode [7]. The <strong>directivity</strong> <strong>in</strong>dex as a function of frequency for<br />
each program-mode and an artificial head are shown <strong>in</strong> Figure<br />
2. The different modes show a similar progress of the direc-<br />
DI (dB)<br />
10<br />
5<br />
0<br />
−5<br />
10 2<br />
Artificial head<br />
HG omni<br />
HG <strong>low</strong> dir<br />
HG high dir<br />
10 3<br />
frequency (Hz)<br />
Figure 2: Directivity <strong>in</strong>dex <strong>in</strong> 1/3 octave-bands of three programs<br />
of the beamformer output and an artificial head at one<br />
ear.<br />
tivity <strong>in</strong>dex. The array offers <strong>directivity</strong> from approx. 100 Hz<br />
to 5000 Hz <strong>in</strong> the <strong>low</strong> <strong>directivity</strong> mode as well as <strong>in</strong> the high<br />
<strong>directivity</strong> mode, and covers the spectrum of <strong>speech</strong>. In the<br />
omnidirectional mode, only the front microphones of the arrays<br />
are used which are at a prom<strong>in</strong>ent position <strong>in</strong> front of the head<br />
and therefore also result <strong>in</strong> some <strong>directivity</strong>.<br />
The hear<strong>in</strong>g glasses <strong>in</strong> the <strong>low</strong> <strong>directivity</strong> mode serve as the<br />
front-end <strong>in</strong> the here presented comb<strong>in</strong>ed process<strong>in</strong>g scheme<br />
and deliver a fixed ga<strong>in</strong> <strong>in</strong> SNR to the subsequent units. The<br />
fixed beamformer is well suited for this task, as it provides a<br />
fixed b<strong>in</strong>aural pattern, which is a prerequisite of the here applied<br />
b<strong>in</strong>aural localizer and post-processor.<br />
2 ICA 2010<br />
10 4
Proceed<strong>in</strong>gs of 20th International Congress on Acoustics, ICA 2010 23–27 August 2010, Sydney, Australia<br />
Localization<br />
For acoustical localization purposes often the use of the <strong>in</strong>dependent<br />
component analysis (ICA) and the time delay of arrival<br />
(TDOA) method <strong>in</strong> comb<strong>in</strong>ation with microphone arrays are<br />
suggested [10, 11]. These approaches can deliver perfect results,<br />
however the number of sources has to be known beforehand,<br />
large arrays of microphones are required, a free field placement<br />
of the receivers is needed or ambiguous (front-back) confusions<br />
occur due to symmetry. Generally the number of sources is not<br />
known <strong>in</strong> an acoustical environment and because a hear<strong>in</strong>g aid<br />
is carried on the body, the use of large microphone arrays is not<br />
desirable. Furthermore, due to head and body shadow effects<br />
the free field placement of receivers is not possible. Therefore<br />
the choice for a CASA approach was made. CASA <strong>in</strong> fact utilizes<br />
the head shadow effect and b<strong>in</strong>aural hear<strong>in</strong>g to process<br />
the signal <strong>in</strong>formation. We adopted the basic pr<strong>in</strong>ciples from<br />
Albani et al. [4], which is based on neurophysiological studies<br />
of the Barn Owl [12, 13], and extended it with a preselection of<br />
time w<strong>in</strong>dows by the Internal Coherence (IC), multiple source<br />
detection <strong>in</strong> one time w<strong>in</strong>dow and co<strong>in</strong>cidence detection between<br />
the <strong>in</strong>ternal level- and time differences (ILD and ITD)<br />
cues. The details of this algorithm are given <strong>in</strong> the next section.<br />
The data process<strong>in</strong>g with<strong>in</strong> the algorithm is summarized <strong>in</strong> Figure<br />
3. Each process block <strong>in</strong> this figure will be briefly discussed<br />
step by step hereafter. The first step is to transform the time<br />
Figure 3: F<strong>low</strong> chart of localization algorithm structure.<br />
doma<strong>in</strong> data (b<strong>in</strong>aural <strong>in</strong>put) <strong>in</strong>to the frequency doma<strong>in</strong>, by the<br />
use of an overlapp<strong>in</strong>g short time Fourier transform (STFT) representation<br />
[14]. A Hann w<strong>in</strong>dow is used to probe the time data.<br />
A 50% overlap of the time w<strong>in</strong>dows assures the conservation<br />
of the total <strong>in</strong>formation, due to the shape of the Hann w<strong>in</strong>dow.<br />
A fast Fourier transform (FFT) is carried out over each time<br />
w<strong>in</strong>dow. The result is a collection of time-frequency (TF) b<strong>in</strong>s,<br />
which represent the signal content over a region <strong>in</strong> time and frequency.<br />
In the next step, cross- and auto-spectra are calculated<br />
from these TF-b<strong>in</strong>s:<br />
�<br />
Φll( f ,n) ≡ |L( f ,n)| 2�<br />
, (7)<br />
�<br />
Φrr( f ,n) ≡ |R( f ,n)| 2�<br />
, (8)<br />
Φlr( f ,n) ≡ 〈L( f ,n)R ∗ ( f ,n)〉. (9)<br />
Respectively, Φll, Φrr and Φlr are the auto-spectra of the left<br />
and right signals and is the cross-spectrum between them. L<br />
and R are the STFT representations of the left and right ear. f<br />
denotes the frequency b<strong>in</strong> <strong>in</strong>dex, where every b<strong>in</strong> has a bandwidth<br />
of 31.25 Hz. n is the number of the time w<strong>in</strong>dow. The<br />
expectation operator 〈◦〉 denotes the average over time and is<br />
def<strong>in</strong>ed as a first order <strong>low</strong> pass filter given� <strong>in</strong> equation (10)<br />
and characterised by a coefficient γ = exp − 1<br />
�<br />
τ , which is<br />
fs<br />
dependent on a time constant τ and the time w<strong>in</strong>dow sample<br />
frequency fs [15]:<br />
〈X(n)〉 = (1 − γ)X(n) + γX(n − 1). (10)<br />
These time averaged cross- and auto-spectra are used to compute<br />
the necessary three b<strong>in</strong>aural cues for the localization process;<br />
Interaural Level Difference (ILD) ∆L, Interaural Time<br />
Difference (ITD) ∆φ and the magnitude squared Interaural Coherence<br />
(IC) IC:<br />
∆L(n, ERB) = 1<br />
∆φ(n, ERB) = 1<br />
IC(n, ERB) =<br />
fend(ERB)<br />
∑ 10log10 Nb f = fstart(ERB)<br />
Nb<br />
fend(ERB)<br />
∑<br />
f = fstart(ERB)<br />
fend(ERB)<br />
∑<br />
f = fstart(ERB)<br />
� �<br />
Φll( f ,n)<br />
, (11)<br />
Φrr( f ,n)<br />
arg(Φlr( f ,n))<br />
, (12)<br />
2π f<br />
fend(ERB)<br />
∑ |Φlr( f ,n)|<br />
f = fstart(ERB)<br />
2<br />
Φll( f ,n)<br />
fend(ERB)<br />
∑<br />
f = fstart(ERB)<br />
Φrr( f ,n)<br />
. (13)<br />
To apply the tonotopic decomposition of the human hear<strong>in</strong>g,<br />
these cues are calculated <strong>in</strong> bands of equivalent rectangular<br />
bandwidths (ERB) [16]. Therefore, there is a summation over<br />
the frequency b<strong>in</strong>s f , which belong with<strong>in</strong> the selected ERBband.<br />
For normalization purposes it is necessary to divide by the<br />
number of frequency b<strong>in</strong>s used <strong>in</strong> the specific ERB-band, Nb.<br />
In the next step the IC cue is calculated to determ<strong>in</strong>e if there is<br />
sufficient data present <strong>in</strong> the current time w<strong>in</strong>dow. When the IC<br />
value is above a certa<strong>in</strong> threshold (between 0 (no coherence) and<br />
1 (total coherence)) the <strong>in</strong>formation from that time w<strong>in</strong>dow will<br />
be used for localization. Next, the ILD and ITD cues from the<br />
time w<strong>in</strong>dows that passed this test are calculated and compared<br />
to a map with reference ILD and ITD values per ERB-band.<br />
When, with<strong>in</strong> a marg<strong>in</strong>, a match<strong>in</strong>g value of the map is found,<br />
the correspond<strong>in</strong>g location gets a score po<strong>in</strong>t. The reference<br />
maps are built up us<strong>in</strong>g Plomp sentences [17] as sources from<br />
all possible directions. The output is a score matrix with the<br />
number of matches with the reference map values per location<br />
for each ERB-band, for both ILD and ITD cues. After that, for<br />
each location the scores of all or a selected range of ERB-bands<br />
are added up and normalized. Locations which have a higher<br />
normalized score than the threshold value will be considered<br />
as sources. This process is actually select<strong>in</strong>g the most probable<br />
sources per time w<strong>in</strong>dow, separately based on the ILD and ITD<br />
cue. In this stage both ILD and ITD score vectors conta<strong>in</strong> m<strong>in</strong>or<br />
localization errors. Therefore <strong>in</strong> the next step a co<strong>in</strong>cidence detection<br />
pr<strong>in</strong>ciple [18] is used to detect the concurr<strong>in</strong>g locations<br />
between ILD and ITD for each time w<strong>in</strong>dow, provid<strong>in</strong>g a more<br />
robust localization result with a higher confidence <strong>in</strong>terval. This<br />
is realized by m<strong>in</strong>imiz<strong>in</strong>g the probability of a fault detection.<br />
The conditional probability of a fault detection by both ILD<br />
and ITD, p(ILD ∩ IT D) = p(ILD|IT D) · p(IT D), is generally<br />
smaller than the separate probability of a fault detection, p(ILD)<br />
or p(IT D). As last step a summation of location scores over<br />
time w<strong>in</strong>dows is performed to give a certa<strong>in</strong> location stability<br />
<strong>in</strong> time.<br />
To show the performance of this localization algorithm a hypothetical<br />
situation with three speakers and a receiver is assumed.<br />
The three speakers are at 1 m distance of the receiver and have<br />
on average the same sound pressure level. The three speakers<br />
are located <strong>in</strong> front of the receiver at −40 ◦ , 0 ◦ and 40 ◦<br />
azimuth and produce different sentences of the Plomp corpus<br />
[17]. Simulations with this situation are performed <strong>in</strong> three<br />
different environments; Anechoic, cafeteria background noise<br />
with a SNR of 5 dB and <strong>in</strong> a reverberant rectangular room of<br />
volume 1000 m 3 with T60 = 1s, which corresponds to a reverberation<br />
radius of 1.9 m. The results are given <strong>in</strong> Figure<br />
ICA 2010 3
23–27 August 2010, Sydney, Australia Proceed<strong>in</strong>gs of 20th International Congress on Acoustics, ICA 2010<br />
4. From the total amount of time-frames, the algorithm used<br />
37.3%, 31.7% and 27.4% of time-frames for the localization<br />
process <strong>in</strong> the anechoic condition, the cafeteria noise and the<br />
reverberant environment, respectively.<br />
−75<br />
−90<br />
−60<br />
−105<br />
−120<br />
−45<br />
−135<br />
Anechoic<br />
−30<br />
0 15<br />
30<br />
−15<br />
−150<br />
−165 ±180<br />
45<br />
60<br />
75<br />
−75<br />
−60<br />
−45<br />
90<br />
0.5<br />
1<br />
105<br />
1.5<br />
2 120<br />
2.5x10<br />
135<br />
2<br />
−90<br />
−105<br />
−120<br />
−135<br />
Cafeteria noise<br />
−30<br />
0 15<br />
30<br />
−15<br />
150 Reverberant −150<br />
165<br />
−165<br />
0 ±180<br />
15<br />
−30 30<br />
−15<br />
−75<br />
−90<br />
−60<br />
−105<br />
−120<br />
−45<br />
−135<br />
−150<br />
−165 ±180<br />
45<br />
60<br />
75<br />
90<br />
0.5<br />
1<br />
105<br />
1.5<br />
2 120<br />
2.5x10<br />
135<br />
2<br />
150<br />
165<br />
45<br />
60<br />
75<br />
90<br />
0.5<br />
1<br />
105<br />
1.5<br />
2 120<br />
2.5x10<br />
135<br />
2<br />
150<br />
165<br />
Figure 4: Localization performance of 3 speakers <strong>in</strong> an anechoic,<br />
cafeteria noise (5 dB SNR) and reverberant (T60 = 1.0 s)<br />
environment.<br />
Mask-based Post-processor<br />
The formation of masks is based on a local selection criterion<br />
that decides whether a certa<strong>in</strong> time-frequency b<strong>in</strong> belongs to<br />
the target or to the noise. An example of the application based<br />
on a simple local SNR criterion is given <strong>in</strong> Figure 5. A class of<br />
successful b<strong>in</strong>aural <strong>speech</strong> <strong>enhancement</strong> algorithms employs<br />
the deviation of acoustic sources from the mid-l<strong>in</strong>e as a selection<br />
criterion, i.e., their b<strong>in</strong>aural differences. By def<strong>in</strong><strong>in</strong>g a<br />
weight<strong>in</strong>g function with a preferential listen<strong>in</strong>g direction, b<strong>in</strong>s<br />
that correspond to this direction are weighted with one and b<strong>in</strong>s<br />
that do not correspond to this direction are attenuated with a<br />
value smaller than one. Wittkop et al. [19, 2] give an overview<br />
of these algorithms that capture psychoacoustical pr<strong>in</strong>ciples of<br />
the spatial mask<strong>in</strong>g release.<br />
Generally, these algorithms calculate the b<strong>in</strong>aural cues from<br />
the comparison of the left and the right STFT signals. As an<br />
extension to the short-time spectra, the <strong>speech</strong> <strong>enhancement</strong><br />
algorithm of Kollmeier and Koch [5] uses modulation spectra<br />
to analyze b<strong>in</strong>aural disparity. The algorithm has been designed<br />
on the grounds of physiological and psychoacoustical results,<br />
where a decomposition of stimuli <strong>in</strong>to different modulation<br />
frequencies has been found to be <strong>in</strong>dependent of center frequencies,<br />
i.e. the tonotopic representation of the cochlear frequency<br />
decomposition, as well as the spatial decomposition. Psychoacoustically,<br />
this particular process<strong>in</strong>g of the auditory system<br />
is also known as co-modulation mask<strong>in</strong>g release. For <strong>speech</strong><br />
<strong>in</strong>telligibility this generally means, that if two speakers differ <strong>in</strong><br />
their fundamental frequency which modulate their respective<br />
spectra, they are each more <strong>in</strong>telligible than if their fundamentals<br />
collapse. The Kollmeier and Koch <strong>speech</strong> <strong>enhancement</strong><br />
algorithm has been shown to be robust <strong>in</strong> different acoustic<br />
situations and to improve the SNR over a wide dynamic range<br />
by approximately 2 dB [5, 19].<br />
In here, a variation of this algorithm is applied to the b<strong>in</strong>aural<br />
output of the MVDR beamformer. The variation refers to<br />
the weight<strong>in</strong>g function. First, a frequency <strong>in</strong>dependent direc-<br />
Centre Frequency [Hz]<br />
Centre Frequency [Hz]<br />
5000<br />
2688<br />
1473<br />
720<br />
325<br />
80<br />
5000<br />
2688<br />
1473<br />
720<br />
325<br />
80<br />
Signal<br />
0.3 0.6 0.9 1.2 Time [s]<br />
Mixture<br />
0.3 0.6 0.9 1.2 Time [s]<br />
Centre Frequency [Hz]<br />
5000<br />
2688<br />
1473<br />
720<br />
325<br />
80<br />
5000<br />
2688<br />
1473<br />
720<br />
325<br />
80<br />
5000<br />
2688<br />
1473<br />
720<br />
325<br />
80<br />
Masked mixture<br />
0.3 0.6 0.9 1.2 Time [s]<br />
Noise<br />
0.3 0.6 0.9 1.2 Time [s]<br />
Ideal Mask<br />
0.3 0.6 0.9 1.2 Time [s]<br />
Figure 5: Illustration of the mask<strong>in</strong>g pr<strong>in</strong>ciple. The spectrogram<br />
of the sentence “We kwamen net te laat terug.” said by male is<br />
shown <strong>in</strong> the top left panel (red denotes <strong>low</strong> energy and violet<br />
high energy). The sentence is mixed with noise and the aim is<br />
to filter the sentence by apply<strong>in</strong>g a mask (<strong>in</strong> the spectrotemporal<br />
doma<strong>in</strong>). The noise is recorded <strong>in</strong> an autobus with an artificial<br />
dummy head. The spectrogram of the noise is shown <strong>in</strong> the top<br />
right panel. The spectrogram of the <strong>speech</strong> signal mixed with<br />
the noise is shown <strong>in</strong> the middle left panel (SNR=-7 dB). The<br />
middle right panel shows the mask. All b<strong>in</strong>s with a SNR above<br />
-7 dB are white and the time-frequency b<strong>in</strong>s with an SNR be<strong>low</strong><br />
-7 dB are black. The bottom panel shows the spectrogram of the<br />
mixture after multiplication with the mask.<br />
tionality was applied, which is adopted from the lateral filter<br />
function of Wittkop and Hohmann [20]. Second, the reference<br />
values for the mask generation are data-driven. Therefore the<br />
parametric output of the localizer is used to calculate the a<br />
posteriori probability for the presence of the target source at a<br />
certa<strong>in</strong> azimuthal position. By such means, the filter-function<br />
is constantly updated to the scene and the effects of distortion<br />
are reduced. The concept for source separation was <strong>in</strong>troduced<br />
by Madhu [21, 22]. By way of example, he has shown that<br />
reverberation <strong>in</strong>creases the variation of the b<strong>in</strong>aural cues and<br />
that an a posteriori estimation corresponds to that change and<br />
opens the spatial aperture <strong>in</strong> mask-based filters.<br />
For the most part, the here applied Kollmeier and Koch <strong>speech</strong><br />
processor was implemented accord<strong>in</strong>g to the algorithmic features<br />
given <strong>in</strong> [5]. We therefore restrict this report to the details<br />
of the variation from the <strong>in</strong>itial implementation.<br />
The parametric output of the localizer is first used to calculate<br />
an azimuthal non-symmetric aperture of the filter toward the<br />
target speaker. For that reason, the parametric output of the<br />
localizer is used as the <strong>in</strong>put to an expectation-maximization<br />
(EM) rout<strong>in</strong>e <strong>in</strong> order to approximate the localization through<br />
a mixture of gaussians (MoG). This MoG fit ˆθ(n) is then employed<br />
to calculate the angular a posteriori probability of a<br />
target source Pt| ˆθ (n) <strong>in</strong> a time frame n. The approximation<br />
through a MoG is based on an a priori probability of Pi, the<br />
location θi with θ ∈ [−π,π] and a variance σ 2 i<br />
of each source i<br />
with Q the total number of sources. The EM algorithm of Feder<br />
and We<strong>in</strong>ste<strong>in</strong> (see [23]) is applied to iteratively approximate<br />
the MoG estimation:<br />
�<br />
Q<br />
ˆθ(n)<br />
(θ(n) − θi) 2<br />
= ∑ Piexp −<br />
i=1<br />
2σ 2 �<br />
. (14)<br />
i<br />
4 ICA 2010
Proceed<strong>in</strong>gs of 20th International Congress on Acoustics, ICA 2010 23–27 August 2010, Sydney, Australia<br />
Thereafter, the a posteriori probability of the target source P t| ˆθ<br />
is calculated with Bayes theorem:<br />
Pt| ˆθ (n) =<br />
1<br />
σt Ptexp<br />
�<br />
− ( ˆθ(n)−θt) 2<br />
2σ 2<br />
�<br />
t<br />
∑ Q<br />
i=1 1 σi Piexp<br />
�<br />
− ( ˆθ(n)−θi) 2<br />
2σ 2<br />
� . (15)<br />
i<br />
In this study, we assume the target source to be <strong>in</strong> front of the<br />
listener at zero degree. Figure 6 exemplifies three possible MoG<br />
fits of source comb<strong>in</strong>ations (dashed l<strong>in</strong>e) and the a posteriori<br />
target probability that adapts consequently to the scene. The<br />
1<br />
0.8<br />
0.6<br />
0.4<br />
0.2<br />
0<br />
−50 0<br />
deg<br />
50<br />
1<br />
0.8<br />
0.6<br />
0.4<br />
0.2<br />
0<br />
P<br />
t | θ<br />
^<br />
^<br />
θ<br />
−50 0<br />
deg<br />
50<br />
1<br />
0.8<br />
0.6<br />
0.4<br />
0.2<br />
0<br />
−50 0<br />
deg<br />
50<br />
Figure 6: A posteriori probability of a target-source (solid l<strong>in</strong>e)<br />
<strong>in</strong> different arrangements (<strong>in</strong>cident angles and variances) of<br />
sound sources (dashed l<strong>in</strong>e), where the target-source resides at<br />
zero degree.<br />
distribution of the target probability is then used to construct a<br />
trapezoidal weight<strong>in</strong>g function, where the reference values of<br />
the pass-range and the stop-range are calculated from Pt| ˆθ = 0.5<br />
and Pt| ˆθ = 0.05, respectively.<br />
Given that we yield the left and right short-time modulation<br />
spectra with Φl(n, fc, fm) and Φr(n, fc, fm), respectively, the<br />
level and phase differences can be calculated with:<br />
�<br />
�<br />
�<br />
∆L(n, fc, fm) = 10log �<br />
Φrr(n, fc, fm) �<br />
�<br />
10 � Φll(n, fc, fm) � (16)<br />
and<br />
∆φ(n, fc, fm) = arg(Φlr(n, fc, fm)), (17)<br />
where Φrr(n, fc, fm) as well as Φll(n, fc, fm) are the time averaged<br />
auto-spectra of the right and left channel, respectively, and<br />
Φlr is the time-averaged cross-spectra. The time averag<strong>in</strong>g is<br />
realized as <strong>in</strong> Eq. (10) with τ the time constant of a first order<br />
<strong>low</strong> pass filter. The b<strong>in</strong>aural reference values ∆Lα and ∆φα with<br />
α ≡ [sccw; pccw;t; pcw;scw] were taken from a look-up table<br />
(sccw and pccw are the stop and pass angle counterclockwise,<br />
t is the target angle and pcw and scw denote the pass and stop<br />
angle clockwise). This database was built up from b<strong>in</strong>aural<br />
record<strong>in</strong>gs of transfer-functions <strong>in</strong> the horizontal plane at steps<br />
of 1 deg with an artificial head. ∆Lα and ∆φα were calculated<br />
from the convolution of the transfer-functions with a <strong>speech</strong><br />
token of 30 s length. A voice activity detection algorithm was<br />
used to exclude pauses <strong>in</strong> the discourse of three male talkers that<br />
were subsequently summed to a mix. The trapezoidal weight<strong>in</strong>g<br />
function is then calculated <strong>in</strong> analogy with the weight<strong>in</strong>g<br />
function <strong>in</strong> [20]. A schematic sketch of a weight<strong>in</strong>g function is<br />
given <strong>in</strong> Fig. 7.<br />
S<strong>in</strong>ce the formalization is equal for the weight<strong>in</strong>g function of<br />
∆L and ∆φ, we only write down ∆L. We further reduce the<br />
notation of the weight<strong>in</strong>g function to the clockwise side <strong>in</strong><br />
Equations (18) and (19) and n, the time-<strong>in</strong>dex is dropped for<br />
brevity. First, the frequency-dependent reference values are<br />
calculated to establish a frequency-<strong>in</strong>dependent spatial filter:<br />
δLpcw( fc, fm) ≡ m<strong>in</strong>{|∆Lpcw( fc, fm) − ...<br />
∆Lt( fc, fm)|},{|∆Lscw( fc, fm) − ∆Lt( fc, fm)|}, (18)<br />
Figure 7: Schematic sketch of the mask-based spatial weight<strong>in</strong>g<br />
function. sccw and pccw are the stop and pass angle counterclockwise,<br />
t is the target angle and pcw and scw denote the pass<br />
and stop angle clockwise of the b<strong>in</strong>aural reference values.<br />
and<br />
δLscw( fc, fm) ≡ max{|∆Lpcw( fc, fm) − ...<br />
∆Lt( fc, fm)|},{|∆Lscw( fc, fm) − ∆Lt( fc, fm)|}. (19)<br />
∆L( fc, fm) is corrected for asymmetries <strong>in</strong> the same way:<br />
δL( fc, fm) ≡ ∆L( fc, fm) − ∆Lt( fc, fm). (20)<br />
The trapezoidal weight<strong>in</strong>g function takes then the fol<strong>low</strong><strong>in</strong>g<br />
form ( fc and fm are dropped for brevity):<br />
⎧<br />
⎪⎨<br />
Mt,∆L =<br />
⎪⎩<br />
here<strong>in</strong> Λcw is:<br />
Λcw =<br />
ε ; if δL < δLsccw<br />
Λccw ; if δLsccw < δL < δLpccw<br />
1 ; if δLpccw < δL < δLpcw<br />
Λcw ; if δLpcw < δL < δLscw<br />
ε ; if δLsccw < δL<br />
, (21)<br />
(−1 + ε)<br />
|δLscw − δLpcw| (δL − δLpcw) + 1, (22)<br />
and ε is the maximum attenuation.<br />
Mt,∆L(n, fc, fm) and Mt,∆φ (n, fc, fm) are then comb<strong>in</strong>ed to a<br />
total weight<strong>in</strong>g function for suppress<strong>in</strong>g the <strong>in</strong>terference to a<br />
target:<br />
Mt(n, fc, fm) = (bMt,∆L(n, fc, fm) + ...<br />
(1 − b)Mt,∆φ (n, fc, fm)) e . (23)<br />
where e denotes an expansion exponent. The filtered modulation<br />
spectrum is <strong>in</strong>versely transformed to the STFT representation<br />
and corrected for the lost phase <strong>in</strong>formation as described <strong>in</strong> [5].<br />
F<strong>in</strong>ally, the left and right output of the MVDR beamformer are<br />
each (Yt,MV DR(n, fc)) weighted with the desired envelope of the<br />
target speaker <strong>in</strong> the STFT doma<strong>in</strong>:<br />
Yt(n, fc) = Mt(n, fc)Yt,MV DR(n, fc). (24)<br />
In order to keep the process<strong>in</strong>g as clear as possible, no smooth<strong>in</strong>g<br />
of the short-time spectra or modulation spectra is applied.<br />
EVALUATION<br />
The comb<strong>in</strong>ed process<strong>in</strong>g scheme was tested <strong>in</strong> three setups.<br />
For the assessment of the <strong>speech</strong> <strong>in</strong>telligibility and quality, the<br />
appropriately weighted three level version of the Speech Intelligibility<br />
Index (SII) of Kates and Arehart [6] was applied. To<br />
<strong>in</strong>clude the dom<strong>in</strong>at<strong>in</strong>g effect of the b<strong>in</strong>aural advantage, the<br />
head shadow effect, a ‘better ear’ model<strong>in</strong>g was <strong>in</strong>cluded <strong>in</strong><br />
auditory critical bands for the three level <strong>in</strong>dex I3. A ‘mean ear’<br />
model<strong>in</strong>g <strong>in</strong> auditory critical bands was calculated for the three<br />
level quality measure Q3. Therefore, the signal-to-distorition<br />
ratio (cf. Eq. (13) <strong>in</strong> [1]) is calculated <strong>in</strong> auditory critical bands<br />
and the maximum is taken <strong>in</strong> bands for the ‘better ear’ effect of<br />
the I3 measure, and the arithmetic mean <strong>in</strong> bands is calculated<br />
for the ‘mean ear’ for the Q3 measure.<br />
As this contribution is ma<strong>in</strong>ly about the improvement of the<br />
ICA 2010 5
23–27 August 2010, Sydney, Australia Proceed<strong>in</strong>gs of 20th International Congress on Acoustics, ICA 2010<br />
beamformer output, the analysis refers only to this improvement<br />
and not to the total improvement. Moreover, the analysis<br />
of the total improvement would be of limited validity, s<strong>in</strong>ce<br />
the beamformer is optimized for an ideal diffuse noise field.<br />
However, to test the co-modulation mask<strong>in</strong>g release process<strong>in</strong>g<br />
of the Kollmeier and Koch algorithm, pure <strong>speech</strong> samples for<br />
the target and the <strong>in</strong>terferer were applied <strong>in</strong> the assessment.<br />
Preparatory, pauses <strong>in</strong> <strong>speech</strong> were excluded by a voice activity<br />
algorithm and sentences were faded <strong>in</strong>to each other with an<br />
overlap add technique. Given a sufficient time-duration of the<br />
presentation, the short-time SII version, <strong>in</strong> here it is calculated<br />
<strong>in</strong> w<strong>in</strong>dows of about 30 ms length with an overlap of 50 %, is to<br />
a fair extend capable to predict <strong>speech</strong> <strong>in</strong>telligibility and quality<br />
for pure <strong>speech</strong>-maskers.<br />
Three acoustical scenes at three different SNR levels were analyzed.<br />
For the <strong>speech</strong> material of different talkers, sentences<br />
of the Plomp corpus were used [17], prepared as above mentioned<br />
and comb<strong>in</strong>ed to samples of 30 s length. The SNR levels<br />
were calculated at the ear level after the beamform<strong>in</strong>g stage<br />
and comprised -5, 0 and 5 dB. Figure 8 gives the setups and<br />
results, where S stands for target-speaker and N stands for noisespeaker.<br />
The circles denote the <strong>in</strong>itial unprocessed situation at<br />
the three SNRs. The Kollmeier Koch algorithm was adjusted<br />
better ear I3<br />
1<br />
0.8<br />
0.6<br />
0.4<br />
0.2<br />
S0N−90<br />
0<br />
0 5<br />
mean ear Q3<br />
10<br />
better ear I3<br />
1<br />
0.8<br />
0.6<br />
0.4<br />
0.2<br />
S0N−30<br />
0<br />
0 5<br />
mean ear Q3<br />
10<br />
better ear I3<br />
1<br />
0.8<br />
0.6<br />
0.4<br />
0.2<br />
S0N±90<br />
0<br />
0 5<br />
mean ear Q3<br />
10<br />
Figure 8: Results of the <strong>speech</strong> <strong>in</strong>telligibility improvement with<br />
the post-processor and the data-driven filter generation. ◦ denote<br />
orig<strong>in</strong>al situations and × denotes the processed situations.<br />
by hand to achieve an optimal process<strong>in</strong>g. The parameters of<br />
the algorithm are given <strong>in</strong> Table 1. As can be seen, the post-<br />
Table 1: Parameters as applied <strong>in</strong> the simplified implementation<br />
of the Kollmeier Koch <strong>speech</strong> <strong>enhancement</strong> algorithm<br />
e b ε τ<br />
2 0.95 0.2 0.2<br />
process<strong>in</strong>g improves both the <strong>speech</strong> <strong>in</strong>telligibility and quality<br />
throughout the range of SNRs and conditions. The improvement<br />
<strong>in</strong> <strong>speech</strong> <strong>in</strong>telligibility is the highest <strong>in</strong> the S0N-90 situation<br />
and almost no improvement is obta<strong>in</strong>ed <strong>in</strong> the two <strong>in</strong>terferer<br />
situation S0N±90, where the sparsity and disjo<strong>in</strong>tness requirements<br />
of different sources <strong>in</strong> the time-frequency representation<br />
are violated. A smaller but clear decl<strong>in</strong>e <strong>in</strong> <strong>speech</strong> <strong>in</strong>telligibility<br />
improvement is also observed from the S0N-90 to the S0N-30<br />
situation, when the b<strong>in</strong>aural cues get less separable to build up a<br />
weight<strong>in</strong>g function. In spite of that, an <strong>in</strong>crease of 20 % <strong>speech</strong><br />
<strong>in</strong>telligibility corresponds to an <strong>in</strong>crease <strong>in</strong> SNR of approximately<br />
1 to 2 dB and this marks an important advantage <strong>in</strong> the<br />
respective situations. Although the algorithm was not adjusted<br />
to yield a maximal quality improvement, no deterioration is<br />
observed <strong>in</strong> all conditions. This is an important outcome as<br />
listen<strong>in</strong>g ease and <strong>speech</strong> quality prevent fatigue and together<br />
form a requirement for a feasible <strong>speech</strong> <strong>enhancement</strong> algorithm.<br />
A further improvement <strong>in</strong> signal quality might be achieved by<br />
smooth<strong>in</strong>g the short-time spectrograms with a leaky <strong>in</strong>tegration<br />
<strong>in</strong> the cepstral doma<strong>in</strong> [24], which is a technique that is generally<br />
used on b<strong>in</strong>ary masks. Together with the <strong>enhancement</strong><br />
of the robustness of the Kollmeier Koch algorithm through a<br />
penalty measure of b<strong>in</strong>aural variance (cf. weight<strong>in</strong>g function <strong>in</strong><br />
[5]), these technical advances are left to further research. The<br />
primary aim here was the comb<strong>in</strong>ation of fundamental build<strong>in</strong>g<br />
blocks <strong>in</strong> a clear and straightforward design.<br />
CONCLUSION<br />
In order to achieve a high improvement <strong>in</strong> <strong>speech</strong> <strong>in</strong>telligibility<br />
while ma<strong>in</strong>ta<strong>in</strong><strong>in</strong>g or improv<strong>in</strong>g <strong>speech</strong> quality, a comb<strong>in</strong>ed<br />
<strong>speech</strong> <strong>enhancement</strong> scheme has been presented. It consists of<br />
a <strong>low</strong>-<strong>directivity</strong> MVDR beamformer, an auditory model-based<br />
localizer and an auditory model-based <strong>speech</strong> <strong>enhancement</strong> algorithm.<br />
The MVDR beamformer realizes a ga<strong>in</strong> of 4.4 dB <strong>in</strong><br />
a diffuse noise field at <strong>low</strong> self noise and features externalized<br />
b<strong>in</strong>aural cues. These cues are exploited by the localizer and<br />
the post-processors. The localizer, which applies physiological<br />
pr<strong>in</strong>ciples of across frequency <strong>in</strong>teraction, performs robust <strong>in</strong> a<br />
wide range of acoustical situations. Its parametric output is used<br />
to estimate a data-driven filter <strong>in</strong> the post-process<strong>in</strong>g algorithm.<br />
This filter, realized as a time-frequency mask, acts on the total<br />
acoustic scene to enhance the <strong>in</strong>telligibility of the <strong>in</strong>formation<br />
com<strong>in</strong>g from a target-speaker and ma<strong>in</strong>ta<strong>in</strong>s simultaneously a<br />
natural background and localization cues. Therewith the postprocessor<br />
can potentially yield an audiological benefit. The here<br />
applied <strong>in</strong>strumental measures of <strong>speech</strong> <strong>in</strong>telligibility and quality<br />
reported an improvement of about 20 % at <strong>low</strong> to mid SNR<br />
levels <strong>in</strong> s<strong>in</strong>gle-<strong>in</strong>terferer situations. Also when the situations<br />
become more complex, the post-process<strong>in</strong>g algorithm does not<br />
deteriorate <strong>speech</strong> <strong>in</strong>telligibility and quality.<br />
The comb<strong>in</strong>ation of a pre-processor and a post-processor as<br />
applied here is not new, e.g., [25]. The advantage of the here<br />
presented scheme is its robustness and its balance between distortion<br />
and <strong>speech</strong> <strong>in</strong>telligibility improvement. In spite of that,<br />
the entire process<strong>in</strong>g cha<strong>in</strong> holds a degree of complexity that<br />
is not easily manageable. We tried to simplify the process<strong>in</strong>g<br />
where possible <strong>in</strong> this contribution to get a better <strong>in</strong>sight <strong>in</strong>to<br />
the crucial parts of the process<strong>in</strong>g. However for a successful<br />
design, objective measures and standard tests of b<strong>in</strong>aural <strong>speech</strong><br />
<strong>in</strong>telligibility and quality for the nonl<strong>in</strong>ear processors should<br />
be established to perform the difficult algorithmic parameter<br />
adjustment. Once these measures are available, a thorough ref<strong>in</strong>ement<br />
of <strong>speech</strong> <strong>enhancement</strong> approaches that are similar to<br />
the here presented work can fol<strong>low</strong>.<br />
ACKNOWLEDGMENTS<br />
The authors like to thank Hendrik Elz<strong>in</strong>ga for his help.<br />
REFERENCES<br />
[1] J. M. Kates and K. H. Arehart, “Coherence and the <strong>speech</strong><br />
<strong>in</strong>telligibility <strong>in</strong>dex,” J. Acoust. Soc. Am., vol. 117, no. 4,<br />
pp. 2224–2237, 2005.<br />
[2] D. Wang and G. Brown, Computational Auditory Scene<br />
Analysis. A John Wiley & Sohns, Inc., Publication, 2006.<br />
[3] C. Liu, B. Wheeler, W. O’brien Jr., R. Bilger, C. Lans<strong>in</strong>g,<br />
and A. Feng, “Localization of multiple sound sources with<br />
two microphones,” J. Acoust. Soc. Am., vol. 108, no. 4,<br />
pp. 1888–1905, 2000.<br />
[4] S. Albani, J. Peissig, and B. Kollmeier, “Model of b<strong>in</strong>aural<br />
localization resolv<strong>in</strong>g multiple sources and spatial<br />
ambiguities,” <strong>in</strong> Psychoacoustics, Speech and Hear<strong>in</strong>g<br />
Aids (B. Kollmeier, ed.), pp. 227–232, World Scientific<br />
Publish<strong>in</strong>g Co. Pte. Ltd., 1996.<br />
[5] B. Kollmeier and R. Koch, “Speech <strong>enhancement</strong> based on<br />
physiological and psychoacoustical models of modulation<br />
perception and b<strong>in</strong>aural <strong>in</strong>teraction,” J. Acoust. Soc. Am.,<br />
vol. 95, pp. 1593–1602, March 1994.<br />
6 ICA 2010
Proceed<strong>in</strong>gs of 20th International Congress on Acoustics, ICA 2010 23–27 August 2010, Sydney, Australia<br />
[6] J. Kates and K. Arehart, “A model of <strong>speech</strong> itelligibility<br />
and quality <strong>in</strong> hear<strong>in</strong>g aids,” <strong>in</strong> IEEE Workshop on applications<br />
of signal process<strong>in</strong>g to audio and acoustics, (New<br />
Paltz), pp. 53–56, IEEE, 2005.<br />
[7] M. M. Boone, “Directivity measurements on a highly<br />
directive hear<strong>in</strong>g aid: the hear<strong>in</strong>g glasses,” AES 120th<br />
Convention, Paris, 2006.<br />
[8] I. Merks, B<strong>in</strong>aural Application of Microphone Arrays for<br />
Improvement Speech Intelligibility <strong>in</strong> a noisy Environment.<br />
PhD thesis, University of Technology Delft, 2000.<br />
[9] J. Capon, R. Greenfield, and R. Kolker, “Multidimensional<br />
maximum likelihood process<strong>in</strong>g of a large aperture<br />
seismic array,” Proceed<strong>in</strong>gs of the IEEE, vol. 55, no. 2,<br />
pp. 192–213, 1967.<br />
[10] A. Hyvär<strong>in</strong>en, “Survey on <strong>in</strong>dependent component analysis,”<br />
Neural Comput<strong>in</strong>g Surveys, vol. 2, pp. 94–128, 1999.<br />
[11] N. Madhu and R. Mart<strong>in</strong>, Advances <strong>in</strong> Digital Speech<br />
Transmission, ch. Source localization with microphone<br />
arrays, pp. 156–170. John Wiley & Sons, Ltd, 2008.<br />
[12] M. S. Bra<strong>in</strong>ard, E. I. Knudsen, and S. D. Esterly, “Neural<br />
derivation of sound source location: Resolution of spatial<br />
ambiguities <strong>in</strong> b<strong>in</strong>aural cues,” J. Acoust. Soc. Am., vol. 91,<br />
no. 2, pp. 1015–1027, 1992.<br />
[13] E. I. Knudsen and M. Konishi, “Mechanisms of sound<br />
localization <strong>in</strong> the barn owl (tyto alba),” J. Comp. Physiol.<br />
A, vol. 133, pp. 13–21, 1979.<br />
[14] F. Hlawatsch and G. Boudreaux-Bartels, “L<strong>in</strong>ear and<br />
quadratic time-frequency signal representations,” IEEE<br />
Signal Process. Mag., vol. 9, pp. 21–67, 1992.<br />
[15] T. Wittkop, Two-channel noise reduction algorithms motivated<br />
by models of b<strong>in</strong>aural <strong>in</strong>teraction. PhD thesis,<br />
Carl-von-Ossietzky-Universität, Oldenburg, 2001.<br />
[16] B. Moore, An <strong>in</strong>troduction to the psychology of hear<strong>in</strong>g,<br />
vol. 1, ch. 3, pp. 100–101. New York, USA: Academic<br />
press, 3rd ed., 1989.<br />
[17] R. Plomp and A. Mimpen, “Improv<strong>in</strong>g the reliability of<br />
test<strong>in</strong>g the <strong>speech</strong> reception threshold for sentences,” International<br />
Journal of Audiology, vol. 18, no. 1, pp. 43–52,<br />
1979.<br />
[18] W. Bothe and W. Kolhörster, “Das Wesen der Höhenstrahlung,”<br />
Zeitschrift für Physik A, vol. 56, no. 11,<br />
pp. 751–777, 1929.<br />
[19] T. Wittkop, S. Albani, V. Hohmann, J. Peissig, W. Woods,<br />
and B. Kollmeier, “Speech process<strong>in</strong>g for hear<strong>in</strong>g aids:<br />
Noise reduction motivated by models of b<strong>in</strong>aural <strong>in</strong>teraction,”<br />
ACTA ACUSTICA united with ACUSTICA, pp. 684–<br />
699, July 1997.<br />
[20] T. Wittkop and V. Hohmann, “Strategy-selective noise<br />
reduction for b<strong>in</strong>aural digital hear<strong>in</strong>g aids,” Speech Communication,<br />
vol. 39, pp. 111–138, 2003.<br />
[21] N. Madhu, “Data-driven mask generation for source separation,”<br />
(Denmark), ISAAR, 2009.<br />
[22] N. Madhu and J. Wouters, “Localisation-based, situationadaptive<br />
mask generation for source separation,” (Cyprus),<br />
pp. 3–5, International Symposium on Communications,<br />
Control and Signal Process<strong>in</strong>g (ISCCSP), 2010.<br />
[23] M. Lázaro, I. Santamaría, and C. Pantaleón, “A new embased<br />
tra<strong>in</strong><strong>in</strong>g algorithm for RBF networks,” Neural Netw.,<br />
vol. 16, no. 1, pp. 69–77, 2003.<br />
[24] N. Madhu, C. Breithaupt, and R. Mart<strong>in</strong>, “Temporal<br />
smooth<strong>in</strong>g of spectral masks <strong>in</strong> the cepstral doma<strong>in</strong> for<br />
<strong>speech</strong> separation,” <strong>in</strong> ICASSP, 2008.<br />
[25] M. Lockwood, D. Jones, R. Bilger, C. Lans<strong>in</strong>g, W. J.<br />
O’Brien, B. Wheeler, and A. Feng, “Performance of timeand<br />
frequency-doma<strong>in</strong> b<strong>in</strong>aural beamformers based on<br />
recorded signals from real rooms,” J. Acoust. Soc. Am.,<br />
vol. 115, no. 1, pp. 379–391, 2004.<br />
ICA 2010 7