Hockey Stick? What Hockey Stick? - WEBCommentary
Hockey Stick? What Hockey Stick? - WEBCommentary
Hockey Stick? What Hockey Stick? - WEBCommentary

You also want an ePaper? Increase the reach of your titles
YUMPU automatically turns print PDFs into web optimized ePapers that Google loves.
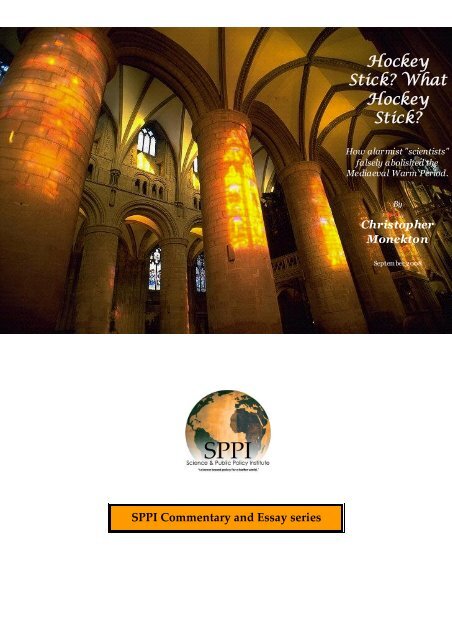
<strong>Hockey</strong><br />
<strong>Stick</strong>? <strong>What</strong><br />
<strong>Hockey</strong><br />
<strong>Stick</strong>?<br />
How alarmist "scientists"<br />
falsely abolished the<br />
Mediaeval Warm Period.<br />
By<br />
Christopher<br />
Monckton<br />
Septem ber 2008<br />
SPPI Commentary and Essay series
AN EXTRAORDINARY SERIES of postings at www.climateaudit.org, the deservedly welltrafficked<br />
website of the courageous and tenacious Canadian statistician Steve McIntyre, is a<br />
remarkable indictment of the corruption and cynicism that is rife among the alarmist climate<br />
scientists favored by the UN’s discredited climate panel, the IPCC.<br />
In laymen’s language, the present paper respectfully summarizes Steve McIntyre’s account of the<br />
systematically dishonest manner in which the “hockey-stick” graph falsely showing that today’s<br />
temperatures are warmer than those that prevailed during the medieval climate optimum was fabricated<br />
in 1998/9, adopted as the poster-child of climate panic by the IPCC in its 2001 climate assessment, and<br />
then retained in its 2007 assessment report despite having been demolished in the scientific literature.<br />
It is a long tale, but well worth following. No one who reads it will ever again trust the IPCC or the<br />
“scientists” and environmental extremists who author its climate assessments.<br />
At some time or another, most people will have seen the hockey stick – the iconic graph which purports<br />
to show that, after centuries of stable temperatures, the second half of the 20th century saw a sudden<br />
and unprecedented warming of the northern hemisphere – a warming caused, we were told, by<br />
humankind burning fossil fuels and releasing carbon dioxide into the atmosphere –<br />
The IPCC’s infamous and now-discredited “hockey-stick” graph that falsely abolished the medieval warm period and<br />
enhanced by at least half the true temperature increase since 1980, giving the misleading impression that temperatures in<br />
the latter half of the 20 th century were unprecedented in the recent history of the Earth. In fact, temperatures were warmer<br />
than the present for almost two-thirds of the past 10,000 years – most recently during the “medieval climate optimum”, a<br />
warm period from about 950 to 1350 A.D. The “hockey stick” appeared in the IPCC’s 2001 assessment report six times,<br />
and in full color, the only graph to be so favored. The graph was not based on science. It was a political statement.<br />
Very briefly, we shall summarize the earlier stages in the campaign of disfiguring machination on the<br />
part of the climate “scientists” who – but for Steve McIntyre and his colleague Professor Ross<br />
2
McKitrick – would have succeeded in gravely misleading the world’s policymakers. We begin in 1990,<br />
when the IPCC clearly showed the existence of the medieval warm period in a graph in its first climate<br />
assessment –<br />
o C<br />
Mediaeval warmperiod<br />
Little IceAge<br />
10 00 11 00 12 00 13 00 14 00 15 00 16 00 17 00 18 00 19 00<br />
The medieval warm period is correctly and prominently shown in the IPCC’s 1990 report<br />
The medieval warm period had in fact been up to 3 degrees Celsius warmer than today’s<br />
temperatures, as numerous papers in the peer-reviewed literature clearly demonstrate. The best<br />
source for such papers is the Medieval Warm Period Database at www.co2science.org.<br />
In 1995 a senior researcher into early climate told David Deming, a climate researcher, that “we<br />
have to abolish the medieval warm period” (Deming, 2005). Not “we need to re-examine the<br />
temperature record of the past millennium”, but “we have to abolish the medieval warm period.”<br />
The existence of a prolonged warm period so recently in the Earth’s climate history was making it<br />
impossible for the environmental extremists driving the “global warming” scare to convince the<br />
world’s policymakers that today’s comparatively temperate temperatures were anything to worry<br />
about. The “hockey stick”, therefore, was a deliberate attempt to falsify the true climate record.<br />
In 1998/9, in the journal Nature, three paleoclimatologists (Mann et al., 1998, 1999) published the<br />
“hockey stick” graph. In 2001, the IPCC’s climate report prominently featured the defective graph.<br />
The IPCC’s politicized bureaucrats liked the graph so much that they reproduced it six times, in<br />
very large scale, and in full color. The “hockey-stick” graph was the only graph in the entire 2001<br />
assessment report that was reproduced as often as this.<br />
The fabricators of the graph had used the varying widths of tree-rings as their principal method of<br />
estimating early-climate temperatures. They had unwisely assumed that wider tree-rings always<br />
indicated warmer temperatures. However, the IPCC had previously – and correctly – given strong<br />
warnings against using tree-rings as proxies for pre-instrumental surface temperatures.<br />
One reason for the IPCC’s warnings was that wider tree-rings do not always indicate warmer<br />
temperatures. Trees grow faster not only when it is warmer but also when there is more carbon<br />
dioxide in the atmosphere, because carbon dioxide is not a pollutant but a naturally-occurring<br />
3
substance that is plant food. With sunlight, chlorophyll, and water, it is an essential ingredient in<br />
plant photosynthesis, without which there would be little or no life on Earth.<br />
Seen in a geological perspective, the pre-industrial concentration of carbon dioxide was almost as<br />
low as it has been in the past half-billion years. Indeed, even the present concentration is well<br />
below what has been the norm in recent geological history. In the Cambrian era, for instance, a<br />
diagram in the IPCC’s 2001 assessment report shows that carbon dioxide concentration was almost<br />
20 times that of today.<br />
Tree-rings, therefore, were unsuitable because CO 2 fertilization distorted the data. The fabricators<br />
of the “hockey stick” nevertheless gave the unreliable tree-rings 390 times as much weight as any<br />
of the other data they used, because the tree-ring data, unlike the remaining paleoclimate data they<br />
had used in fabricating the graph, gave them the hockey-stick shape they wanted.<br />
This shape allowed them to do what David Deming had been told that the environmentalist faction<br />
wanted to do – namely, to abolish the medieval warm period and pretend that today’s temperatures<br />
were likely to have been unprecedented in the past 1000 years.<br />
Tree-rings from Sheep Mountain, CA, that produced the desired “hockey-stick” shape, falsely suggesting a<br />
pronounced uptrend in the 20 th century, (upper panel) were given 390 times more weight than tree-rings from<br />
Mayberry Slough, AZ, that correctly suggested a far less dramatic picture (lower panel). The IPCC had<br />
recommended against using tree-rings as the basis for reconstructing pre-instrumental surface temperatures<br />
on Earth because not only warmer weather but also increased carbon dioxide concentration accelerates the<br />
growth of trees and hence widens their annual growth-rings.<br />
Not only did the fabricators of the “hockey stick” use temperature proxies that the IPCC had said<br />
should not be used; not only did they give these questionable proxies almost 400 times more weight<br />
than proxies that did not give them the hockey-stick shape they wanted; but they then also left out<br />
the tree-ring dataset that included the medieval warm period itself.<br />
4
However, the graph’s fabricators said in the “scientific” paper that accompanied their graph that<br />
they had included the tree-ring dataset for the medieval warm period that they had in fact omitted.<br />
Worse, they hid the missing data in a file on their own computer that they had revealingly labeled<br />
“CENSORED_DATA”. They knew perfectly well that they were censoring the data. However, by<br />
saying they had used the data they had in fact censored and hence excluded, they hoped no one<br />
would ever find out. They reckoned without McIntyre and McKitrick, who, when the history of the<br />
now-collapsing climate scare comes to be written, will be remembered as having done more than<br />
anyone to expose the corruption at the heart of the discredited scientific case for climate panic.<br />
The graph’s fabricators inserted their own “estimates” in place of the data they had left out, but did<br />
not publish the fact that they had done so. Unsurprisingly, the “estimates” somehow succeeded in<br />
wiping out all evidence of the higher temperatures that had obtained during the Middle Ages.<br />
McIntyre and McKitrick later worked out that, if the omitted data from the medieval warm period<br />
were reinserted, evidence for the vanished medieval warm period instantly reappeared –<br />
Restoring the “censored” data restores the medieval warm period (McIntyre & McKitrick, 2005)<br />
Next, McIntyre and McKitrick obtained from the fabricators of the “hockey stick” the computer<br />
program and data they had used in compiling the fake graph. The computer program produced a<br />
“hockey-stick” graph almost every time, even if random “red noise” rather than real data were used<br />
–<br />
5
Upper panel: The graph using real temperature proxy data. Lower panel: The graph using random red noise. The<br />
two graphs are near-identical in shape, both resembling hockey sticks.<br />
McIntyre and McKitrick then decided to run the fabricators’ computer program several times with<br />
different sets of random data. On almost every occasion, the computer program produced “hockeystick”<br />
shapes that were indistinguishable from those constructed using real data –<br />
6
Seven runs of the fabricators’ defective computer model with random data and one with real tree-ring data. It is impossible<br />
to tell which graph is based on real data.<br />
The peer-reviewers at Nature – scientists who were supposed to be experts in paleoclimatology – did<br />
not detect any of these serious defects in the methods the fabricators of the “hockey-stick” graph had<br />
used. The editors of Nature had already abused the convention of strict impartiality in scientific<br />
publications by declaring in print a prejudice in favor of the alarmist view about “global warming”, and<br />
by strongly suggesting that in future no papers questioning that the alarmist theory would be published.<br />
Likewise, the two rounds of “peer review” which preceded the IPCC’s 2001 assessment report did not<br />
detect any of the defects either. However, it is important to understand that the IPCC’s reports are not<br />
peer-reviewed in the accepted sense of the term. The reviewers are hand-picked by the IPCC, which<br />
has been known to veto the appointment of anyone known to have doubts about the alarmist position.<br />
And the authors of the IPCC’s science chapters, uniquely in the scientific world, have – and frequently<br />
exercise – the right to overrule the peer-reviewers’ recommendations. The IPCC tried to conceal the<br />
extent to which authors whose credentials are satisfactorily alarmist have been allowed to overrule<br />
serious and even fundamental criticisms by peer-reviewers: it initially sent all the reviewers’ comments<br />
on its 2007 report, in hard copy only, to a library that was closed for renovation, so that no one could<br />
look at them for several months after publication. Eventually, but only under pressure, the IPCC agreed<br />
to allow the reviewers’ comments to be published online. In the crucial chapter attributing recent<br />
warming to humankind, the authors had decided to reject more than half of all the reviewers’<br />
comments.<br />
The IPCC relied heavily upon the defective hockey-stick graph as the basis for its conclusion that it<br />
may be warmer worldwide today than at any time in the past 1,300 years. Without the bogus graph, the<br />
truth as presented in the IPCC’s 1990 report would have prevailed: the medieval warm period was<br />
7
warmer, and in some places considerably warmer, than the present. Greenland, for instance, is one of<br />
the alarmists’ favorite poster-children for climate panic. Headlines talking of unprecedented warming<br />
and sudden collapse of the vast Greenland ice sheet are commonplace. Yet the burial-ground in the<br />
principal medieval Viking settlement, at Hvalsey in south-western Greenland, is under permafrost to<br />
this day. It was certainly not under permafrost when the Vikings buried their dead there during the<br />
Middle Ages.<br />
The IPCC’s 2001 and 2007 reports carefully avoided pointing out that temperatures have been higher<br />
than today’s throughout most of the past 10,000 years. Indeed, in the Bronze Age, during the Holocene<br />
Climate Optimum, which was called an “Optimum” because warmer weather is better for life on the<br />
planet than colder, temperatures were many degrees warmer than the present for several thousand<br />
years.<br />
Nature, when asked, flatly refused to part with details of the data and methods used by the scientists<br />
who had created the defective graph. That refusal is directly contrary to the central principle of the<br />
scientific method, which is that the unpublished methods and data that underlie the published results of<br />
any scientist in any learned journal must be made available to other scientists so that they can replicate<br />
the methods and test whether the results are valid. However, Nature, having declared its unscientific<br />
prejudice in favor of the climate scare, no longer makes any pretence at being a proper learned journal<br />
of science. On this subject, at least, it is now merely another politicized mouthpiece of the international<br />
environmentalist extremists.<br />
Worse, the fabricators of the false graph themselves also at first refused, time and again, to supply their<br />
data and programs. Eventually, and only after continuous pressure from McIntyre and McKitrick, they<br />
reluctantly made an untidy jumble of code and data available. It was among this jumble that the two<br />
researchers found the CENSORED_DATA file and many other questionable details.<br />
When McIntyre and McKitrick first tried to publish their revelations about the numerous and serious<br />
scientific defects in the graph that abolished the medieval warm period and provided the central plank<br />
in the platform of climate panic that the IPCC had constructed in its 2001 report, Nature flatly refused<br />
to publish a paper drawing attention to them. Once again, the editors refused to take a scientific<br />
approach and allow anyone in their pages to suggest that they had been wrong. The two researchers<br />
also had great difficulty in persuading other leading scientific journals to publish the truth. Many of<br />
them, like Nature, had abandoned scientific objectivity in favor of a declared political bias in favor of<br />
climate panic.<br />
Eventually, and only under pressure, Nature was compelled to publish a belated, muddled, and<br />
inadequate correction written, but only under pressure, by the fabricators of the bogus graph.<br />
Geophysical Research Letters finally published a paper by the two determined researchers exposing the<br />
defects in the graph (McIntyre & McKitrick, 2005). This paper provoked astonishment and dismay<br />
throughout the climatological community. That was the first moment at which many honest scientists<br />
who had previously accepted the climate scare at face value began to question the methods and the<br />
motives of the handful of politicized scientists who, between them, were chiefly responsible for<br />
creating and promoting the now-failed scare.<br />
So much controversy was generated by the two researchers’ paper that three statisticians engaged by<br />
the US House of Representatives (Wegman et al., 2005) were invited to examine the evidence on both<br />
sides. In a damning report, the statisticians confirmed all of the findings of McIntyre and McKitrick to<br />
the effect that the graph was defective. The statisticians also found that a suspicious collection of<br />
8
subsequent papers that had suddenly appeared supporting the notion that the medieval warm period had<br />
not existed had nearly all been written by associates or co-authors of the inventors of the defective<br />
graph, and using similarly questionable data and methods.<br />
A report by a committee of the US National Academy of Sciences also confirmed that the graph was<br />
defective, saying that its conclusion was no better than “plausible”, and, witheringly, that it had “a<br />
validation skill not significantly different from zero” – in short, that scientifically speaking it was<br />
worthless. Very nearly all of the news media, when reporting the findings of the NAS, did not read the<br />
report itself but lazily based their stories only on the accompanying press release, which had been<br />
carefully drafted to exclude the NAS’ finding that the graph was worthless, highlighting instead the<br />
notion that its conclusion as to the absence of the medieval warm period was “plausible”. The media<br />
did not even mention the one caveat that appeared even in the politicized press release from the NAS –<br />
namely that all temperature proxies going back more than 400 years were inherently unreliable. Al<br />
Gore, absurdly unscientific as ever, even went so far as to declare that the NAS had “vindicated” the<br />
defective graph, when in fact it had found the graph valueless. Somehow the NAS found it expedient<br />
not to correct Gore’s characteristic misstatement of the truth.<br />
It is not only the medieval shank of the “hockey stick” that is defective. Professor McKitrick published<br />
papers in 2006 and in 2007 that demonstrated a clear correlation between varying levels of economic<br />
activity in different parts of the world and varying rates of temperature change in the past 50 years as<br />
recorded in the major global-temperature datasets, correctly inferring from this strong correlation that<br />
the compilers of the datasets, some of whom are among the most notorious promoters of the climate<br />
scare, had insufficiently adjusted the raw data to remove the false warming effects caused by increasing<br />
industrialization and urbanization. If these “urban heat island effects” had been properly removed from<br />
the data, there should have been no correlation between regional variations in economic activity and<br />
regional variations in the warming rate.<br />
Notwithstanding the papers by McIntyre and McKitrick, the Congressional statisticians under<br />
Wegman, and the damning report by the NAS, the IPCC neither apologized for nor withdrew the<br />
defective graph. Instead, in defiance of all the norms of the scientific method, it continues to rely upon<br />
the “hockey stick” in its publications to this day. The first of Professor McKitrick’s papers about the<br />
considerable overstatement of the warming rate since 1980 was published in good time to be mentioned<br />
in the IPCC’s 2007 assessment report. The report indeed mentions it, but it is significant that the IPCC<br />
found it expedient to abandon its declared rule that its reports faithfully reflect the balance of<br />
arguments as published in the peer-reviewed learned journals. At the time when the IPCC’s 2007 report<br />
was published, there had been no published challenge to Professor McKitrick’s paper. However, its<br />
finding that the increase in global temperatures since 1980 had been flagrantly exaggerated in the major<br />
global-temperature datasets was as profoundly uncongenial to the IPCC’s bureaucrats and politicized<br />
scientists as his earlier papers’ conclusion that the medieval warm period had indeed been, as history<br />
records, a great deal warmer than the present. Therefore the IPCC simply stated, without being able to<br />
cite a single scientific authority or reason, that it proposed to disregard Professor McKitrick’s finding.<br />
The IPCC’s original revelation of the 1000-year graph with its near-static temperatures until 50 years<br />
ago (the shaft of the hockey stick), followed by the apparently dramatic temperature rise in the last few<br />
decades (the blade of the hockey stick), was a key moment for many environmentalists. Al Gore, of<br />
course, used the graph in his flawed movie promoting the climate scare, and his carefully-selected<br />
audience dutifully greeted the graph with gasps of astonishment. However, like much else in Gore’s<br />
movie, the graph was false.<br />
9
How, then, has it come to pass that the IPCC continues to rely upon a graph that has been so thoroughly<br />
and utterly discredited, and so obviously fabricated on the basis of CENSORED_DATA that had been<br />
inappropriately selected, massaged, manipulated and run through a computer program that would<br />
produce a “hockey stick” shape even if the input data were random?<br />
The lack of scientific integrity that led to the publication of the original graph is nothing when<br />
compared with the maneuvers and machinations that the IPCC has relied upon in finding excuses for<br />
covering up its deliberate previous use of a defective graph by the simple expedient of continuing to<br />
rely upon it in its current publications. I am grateful to Bishop Hill for the following account –<br />
http://bishophill.squarespace.com/blog/2008/8/11/caspar-and-the-jesuspaper.html<br />
McIntyre and McKitrick had rightly criticized the fabricators of the “hockey stick” for having refused<br />
to publish an essential statistical result known as the “cross-validation R 2 ”, a measure of how well the<br />
fabricators’ reconstruction of temperatures correlated with actual temperature records.<br />
In May 2005, at the height of the controversy, and on the very day that McIntyre was making a rare<br />
public appearance in Washington to discuss his findings, two Mann associates, Caspar Amman and<br />
Eugene Wahl, issued a press release in which they claimed that they had submitted two manuscripts for<br />
publication, which together purported to show that they had replicated the hockey stick exactly,<br />
confirmed its statistical underpinnings and demonstrated that McIntyre's criticisms were baseless. This<br />
was trumpeted as “independent confirmation” of the hockey stick.<br />
A few eyebrows were raised at the dubious practice of using a press release rather than a learned paper<br />
in a peer-reviewed scientific journal to announce research findings. On the rare occasions when this<br />
kind of announcement is made, it tends to be about papers that have been published, or have at least<br />
been accepted for publication. To make such a dramatic announcement about the mere submission of a<br />
paper was almost without precedent.<br />
The first of these two allegedly confirmatory papers was submitted to Geophysical Research Letters, a<br />
journal of the American Geophysical Union. It was a purported rebuttal by Ammann and Wahl of a<br />
paper by Steve McIntyre criticizing the “hockey stick” in an earlier edition of the same journal.<br />
The second, longer paper, also by Wahl and Ammann, had started its long road to publication at the<br />
journal Climatic Change. This article purported to be a replication of the hockey stick and confirmation<br />
of its scientific correctness. However, in a surprising turn of events, the journal's editor, prominent<br />
global warming [2 http://www.climateaudit.org/?p=204] catastrophist Steven Schneider, mischievously<br />
asked none other than Steve McIntyre to be one of the paper's anonymous peer reviewers.<br />
In fairly short order, the paper by Ammann and Wahl was rejected by GRL, many of its criticisms<br />
either relating to other McIntyre papers than the one at hand, or relying on the still-unpublished paper<br />
in Climatic Change for their arguments. Since that paper was unpublished, it was effectively<br />
impossible for McIntyre to defend himself against these criticisms. Shortly after Ammann and Wahl's<br />
paper was rejected, a third attempted rebuttal of McIntyre’s work, this time by David Ritson, a<br />
physicist, was also rejected by the journal's editors.<br />
We have seen above that one of the chief criticisms of the hockey stick was the fact that its author,<br />
Michael Mann, had withheld key validation statistics so that it was impossible for anyone to gauge the<br />
reliability of his reconstruction of northern-hemisphere temperatures in the period before instrumental<br />
10
measurements began. These validation statistics were to be key to the subsequent story. At the time of<br />
their press release, Wahl and Ammann had made public the computer code that they had used in their<br />
papers. By the time their paper was submitted to Climatic Change, McIntyre had reconciled their work<br />
with his own so that he understood every difference. And he therefore now knew that Wahl and<br />
Ammann's work suffered from exactly the same problem as the hockey stick itself: the R 2 number was<br />
so low as to suggest that the hockey stick had no meaning at all, although another crucial variable, the<br />
reduction-of-error statistic, was relatively high. It was only this latter figure that had been mentioned in<br />
the paper. Far from confirming the scientific integrity of the hockey stick, Wahl and Ammann’s work<br />
actually confirmed McIntyre's criticisms of it! McIntyre's first action as a peer reviewer was therefore<br />
to request from Wahl and Ammann the verification statistics for their replication of the “hockey-stick”<br />
graph. Confirmation that the R 2 was close to zero would cast substantial doubt on Wahl and Ammann's<br />
replication.<br />
Wahl and Ammann's response was similar to that of the fabricators of the original “hockey stick”. They<br />
refused any access to their verification variables, flouting not only the journal’s published rules but also<br />
the norms of the scientific method, which require that results published in learned journals be<br />
independently verifiable. As a justification for their extraordinary refusal, they said that they had<br />
rebutted McIntyre’s criticisms in their forthcoming GRL paper, even though they knew perfectly well<br />
that the paper had been rejected by the journal some days previously.<br />
At the start of July 2005, with his review of the Climatic Change paper by Ammann and Wahl<br />
complete, McIntyre took the opportunity to probe this point, by asking the journal to find out the<br />
anticipated publication date of the GRL paper. Wahl and Ammann were thereupon forced to admit the<br />
rejection, but they declared that it was unjustified and that they would seek publication elsewhere.<br />
With the replication of the hockey stick in tatters, reasonable people might have expected some sort of<br />
pause in the political momentum. Seasoned observers of the climate scene, however, will be<br />
unsurprised to hear that global warming eminences grises like Sir John Houghton and one of the<br />
authors of the original “hockey stick” continued to cite the Wahl and Ammann papers, although their<br />
draft paper for Climatic Change had not yet been accepted and their draft paper for GRL had been<br />
rejected. Notwithstanding the rejection, the press release by Wahl and Ammann was not withdrawn.<br />
Events soon took another surprising turn. It was announced that the editor-in-chief of Geophysical<br />
Research Letters, Jay Famiglietti, had taken over the file for the McIntyre paper and its responses. This<br />
was justified, he said, because of the high number of responses (just four) that the McIntyre paper had<br />
received. That two of those responses had been rejected and were no longer in play was not mentioned.<br />
The reason for the change quickly became apparent hen, at the end of September, the rejected response<br />
from David Ritson turned out not only to have been re-submitted but had also been accepted for<br />
publication, but without any copy of it having been sent to McIntyre so that he could reply to it in the<br />
same issue. This was another clear breach of the journal’s rules, which required that an article's author<br />
should be able to comment on responses before they were accepted. Famiglietti refused to make any<br />
on-the-record comments about why he had behaved as he did.<br />
If McIntyre had any suspicions about the implications of Famiglietti's malfeasance, he must have been<br />
quite certain when, shortly afterwards, hockey stick author Michael Mann commented on his climate<br />
blog that both the Climatic Change and the GRL papers were going to be accepted for publication<br />
shortly. Sure enough, in the last week of September 2005, the GRL paper was resubmitted and<br />
revisions were made to the CC paper. Both papers were back in play again.<br />
11
As 2005 neared its end, two important events loomed large. The first was the year-end deadline for<br />
submission of papers for the IPCC's Fourth Assessment Report on the state of the climate, and<br />
realization soon dawned on McIntyre and the observers of the goings-on at GRL: the IPCC needed to<br />
have the Wahl and Ammann papers in the report so that they could continue to use the hockey stick,<br />
with its frightening and unprecedented uptick in temperatures. Mountains were going to be moved to<br />
keep the papers in play.<br />
The other important happening was the fall meeting of the American Geophysical Union, which would<br />
be attended by many of the big names in paleoclimate and at which both McIntyre and Ammann would<br />
be making presentations. McIntyre's plan was to use the question-and-answer session after Ammann's<br />
presentation to once again press for the R 2 number for the hockey stick, a figure that had never been<br />
released, though it had been repeatedly requested over the previous years by McIntyre, journals,<br />
politicians and journalists. When confronted, Amman once again prevaricated.<br />
After the session, McIntyre attempted to clear the air by inviting Ammann to lunch. In the<br />
circumstances, this seems to have been a relatively amicable affair, but McIntyre's suggestion that he<br />
and Ammann write a joint paper outlining where they agreed and where they differed was not taken up.<br />
When McIntyre later formalized this offer in an email, Ammann failed even to acknowledge it.<br />
While the AGU was meeting in San Francisco, Climate Change had provisionally accepted Wahl and<br />
Amman's Climatic Change paper, any objections which might have been raised by McIntyre swept<br />
aside by the simple expedient of not inviting him to review the second draft.<br />
The resubmitted version of the paper turned out to be almost identical to the old one,<br />
http://www.climateaudit.org/?p=492#more-492, except that a new section on the statistical treatments<br />
had been added, presumably as a condition of acceptance. And here there was an upside because,<br />
buried deep within the paper, Amman and Wahl had quietly revealed their verification R 2 figures,<br />
which were, just as McIntyre had predicted, close to zero for most of the reconstruction, strongly<br />
suggesting that the hockey stick had little predictive power. Their decision to reveal these key data is<br />
necessarily obscure, but may well have been prompted by McIntyre's decision to file a complaint of<br />
academic misconduct about Amman with his employers, UCAR. Although the complaint was rejected,<br />
it may well have put sufficient pressure on Ammann and the journal to show the numbers that everyone<br />
wanted to see.<br />
The Climatic Change paper's provisional acceptance date was December 12 2005, just a few days<br />
before the deadline for papers to be mentioned in the IPCC’s Fourth Assessment Report. Strangely, the<br />
version that was accepted seems to have been dated 24 February 2006: therefore, according to its rules<br />
the IPCC should not have been able to consider it.<br />
<strong>What</strong> is more, it appears that the new sections discussing the statistical verifications were only added in<br />
this post year-end version. As McIntyre put it:<br />
So under its own rules, is IPCC allowed to refer to Ammann and Wahl [2006]? Of course not. Will they? We all<br />
know the answer to that. When they refer to Ammann and Wahl [2006], will they also refer to its confirmation of<br />
our claims about [the authors of the original graph’s] verification R 2 statistics? Of course not. That information was<br />
not available to them in December. But wait a minute, if Ammann and Wahl was in press in December, wouldn’t<br />
that information have been available to them? Silly me.<br />
12
In other words, the version of the paper which had gone forward to the IPCC had not included the<br />
adverse verification statistics, but the version accepted by the journal had. The IPCC got their rebuttal<br />
of McIntyre and the journal got a fig-leaf of respectability to cover up its duplicity.<br />
By March 2006, the Climatic Change paper by Wahl and Ammann had been fully accepted, but there<br />
was to be another hiccup that would threaten it. After all the shenanigans at GRL with the replacement<br />
of the editor and the resubmission of letters, the journal decided once again to reject Wahl and<br />
Amman's attempt to rebut McIntyre's work. Ostensibly this was because the arguments were “already<br />
out there”, but the truth was surely that there were so many holes in the statistical arguments as to make<br />
their publication an embarrassment to the journal.<br />
This new rejection was a problem for the Climatic Change paper, as I will explain below. When using<br />
an R 2 verification, researchers can refer to tables of benchmarks to gauge the significance of their<br />
results. Now that the fact that the hockey stick and Amman and Wahl's replication of it were public,<br />
Ammann was arguing that the correct measure of significance was in fact the alternative reduction-oferror<br />
statistic. His problem was that, for reduction-of-error statistics, there are no tables of benchmarks<br />
for the researcher to refer to – he has to establish a benchmark of his own by other means. And Amman<br />
had done this in the GRL paper which had just been http://www.climateaudit.org/?p=564 6<br />
http://www.climateaudit.org/?p=578 7 http://www.climateaudit.org/?p=592 rejected. Without the GRL<br />
paper, he had no basis at all for his argument that his results in Climatic Change were statistically<br />
significant.<br />
There is a rule of thumb for reduction-of-error statistics: this says that positive reduction-of-error<br />
numbers have some significance while negative ones do not. Unfortunately for Ammann, this rule<br />
applies only to linear regressions; as the hockey stick was clearly not linear, it could not apply. The<br />
original hockey-stick fabricators had claimed to have created a benchmark through other means, and<br />
that the figure was still zero. Now Ammann and Wahl, while they had been silent on the issue in their<br />
original GRL submission, announced in their resubmission that they had performed benchmarking<br />
calculations that had confirmed that the significance level for the reduction-of-error statistic should<br />
remain at zero.<br />
However, now that the resubmission had been rejected by GRL, the “establishment” of this benchmark<br />
was set at nought, and the statistical arguments in their Climatic Change paper which relied on it could<br />
no longer be maintained. And then silence. A year later, the Climatic Change paper was nowhere to be<br />
seen, although it had been accepted for publication. It was stuck in a kind of publishing limbo once<br />
again. This left the IPCC and Climatic Change with a problem. McIntyre observed:<br />
“I’m intrigued as to what the final Wahl and Ammann version will look like. They have an intriguing choice: the<br />
inclusion of a reference to this article in [the IPCC’s Fourth Assessment Report] was premised on their article [in<br />
Climatic Change] being “in press”, which would prohibit them from re-working their article to deal with the GRL<br />
rejection. But the article needs to be re-worked, since it will look pretty silly to describe their GRL article as “under<br />
review” more than 18 months after it has been rejected.”<br />
In the background, however, much had been happening. Suddenly in September 2007, and with the<br />
IPCC report published, the Climatic Change paper suddenly appeared, preceded in the same journal by<br />
another paper by the same authors. <strong>What</strong> had happened was that Wahl and Ammann were quietly<br />
allowed to rewrite their rejected GRL paper and submit it to Climatic Change instead. All reference to<br />
the rejected GRL paper in the Climatic Change paper could be replaced by reference to the new paper.<br />
With identical authorship, and a maze of cross-references between them, the two Climatic Change<br />
13
papers might have been carefully designed to make any understanding of how their arguments relied<br />
circularly on each other as difficult as possible.<br />
The beauty of this approach was that it allowed for retention of the original acceptance date for the<br />
Climatic Change paper, and hence its inclusion in the IPCC process. It did leave Wahl, Ammann, and<br />
the IPCC with the embarrassing problem that a paper that had allegedly been accepted in March 2006<br />
relied upon another paper that even the journal itself said had only been received in August 2006, and,<br />
in reality, was even later than that. Readers should note that this matters because unless the paper was<br />
had been accepted by the journal by the deadline for inclusion in the IPCC’s Fourth Assessment<br />
Report, it should not have been referenced by the IPCC at all. But the IPCC desperately needed the<br />
Climatic Change paper; and although the inconsistency was pointed out, the IPCC merely waved the<br />
objections aside as irrelevant.<br />
The Climatic Change paper argument leads from the text, to the appendix and then onto the resurrected<br />
GRL paper, which itself referred back frequently to the Climatic Change paper, creating a logically<br />
flawed, circular argument. One notable feature of the two papers by Ammann and Wahl was that they<br />
relegated some of their key argumentation to their Supplementary Information sections, which were<br />
online appendices to the published papers. In particular, the resurrected GRL paper stated that the<br />
statistical discussions and, more precisely, the establishment of reduction-of-error benchmarks could be<br />
seen there. To have key arguments available only in the online Suppelementary Information was most<br />
unusual and it quickly became apparent why this curious route had been followed: the Supplementary<br />
Information was not in fact available. Even the peer reviewers appear not to have had access: yet they<br />
had nevertheless cleared for publication the two papers which made no sense without it. Once again,<br />
Ammann refused McIntyre's request for the data and code. His reply to this request was startling,<br />
particularly bearing in mind that Ammann is a public servant:<br />
“Under such circumstances, why would I even bother answering your questions, isn’t that just lost time?”<br />
Again, everything fell silent. For the next year nothing more was heard of the two papers. McIntyre<br />
pressed from his blog for release of the Supplementary Information, and the politicians of the<br />
environmentalist lobby were able to take rapid advantage of the political space created by the IPCC<br />
report. Then, in the late summer of 2008, and entirely unannounced, Wahl and Ammann’s<br />
Supplementary Information suddenly appeared on Caspar Ammann’s website, some three years after<br />
that first press release announcing the “refutation” of McIntyre's work. With it, and a godsend to<br />
McIntyre, was the code used to establish the benchmark for the reduction-of-error statistic. With no<br />
more than a few days’ work, McIntyre was at last able to establish exactly what had been done.<br />
Recall that Ammann and Wahl had said they had established a benchmark of zero for a 99%-significant<br />
reduction-of-error score – that is to say, there is only a 1% chance that that score could have arisen<br />
merely by chance. McIntyre had, much earlier, shown that if red noise rather than real data were run<br />
through the algorithm, reduction-of-error scores of more than 0.5 were readily achievable. (Red noise is<br />
best described as a "random walk" – a line which wiggles at random, but is not entirely random like<br />
white noise.) To reduce the chance of random error to 1%, a minimum reduction-of-error score of 0.54<br />
was essential. How Amman had come up with zero as his benchmark had been a mystery.<br />
Now, with the code in front of him, McIntyre could see exactly what Wahl and Ammann had done.<br />
And what they had done was to calculate almost exactly the same figure as he had! The number they<br />
had arrived at was 0.52, just a whisker away from McIntyre's own 0.54, but they had reported to the<br />
14
world that it was sufficient only to score a positive number! Of course, this wasn't picked up by the<br />
peer reviewers because, as we have seen, they had no access to the Supplementary Information.<br />
Nevertheless, the IPCC's purposes had been served – the hockey stick found its way intact into the<br />
Fourth Assessment Report, unscathed by skirmishes with inconvenient statistical truths. However, the<br />
figure of 0.52 was insufficient for Wahl & Ammann’s purposes. Their problem was that the key<br />
component of the hockey stick had a verification reduction-of-error statistic of 0.48, leaving it<br />
tantalisingly just below the verification threshold they had themselves calculated. They needed it to be<br />
in the top rank. Getting it there was going to be tricky. For each simulation, a thousand runs through the<br />
statistical sausage machine were perfomed and the reduction-of-error value, the correlation with the<br />
temperature record, was recorded. Then all the runs were sorted in order of reduction-of-error value,<br />
the best runs having the highest reduction of error and the worst the lowest. Wahl and Ammann needed<br />
to show that the hockey stick’s reduction-of-error value was right up there with the best simulations –<br />
in the top 1%. While its reduction-of-error value was high, it was not high enough. And it was no good<br />
simply removing runs which had a higher score than the hockey stick, since this would not increase its<br />
position enough – they would have been reducing the total number of runs as well as the number of<br />
runs which were scoring better than the hockey stick. To get the answer they needed, the higher-scoring<br />
runs had to be made to be lower than the hockey stick, but left in the calculation.<br />
To do this, Wahl and Ammann came up with a kludge which they called a calibration/verification<br />
reduction-of-error ratio. As the name suggests, this was the ratio of the reduction-of-error values for<br />
calibration and for verification. This ratio is, however, entirely unknown to statistics, or to any other<br />
branch of science. But it was not plucked out of the air. The ratio and the threshold value set for it by<br />
Wahl and Ammann was carefully calculated. They argued that any run with a ratio less than 0.75<br />
should be assigned a score of –9999. Since the hockey stick had a score of 0.813, 0.75 was close to the<br />
highest level that could be set without rejecting the hockey stick itself.<br />
However, if they had set their ratio threshold too low, not enough runs would have been rejected and<br />
the hockey stick would no longer be “99% significant”. Some of the results of this ratio were entirely<br />
perverse – it was possible for a run that had scored a reasonably good reduction-of-error value in the<br />
calibration, showing that there was a good correlation between it and the actual temperatures, to be<br />
ejected from the final assessment on the ground that it had done very well in the verification – in short,<br />
that the correlation with actual temperatures was considered too good!<br />
With this new and entirely arbitrary statistical prestidigitation in place, Wahl and Ammann were able to<br />
reject several of the runs which had stood between the hockey stick and what they saw as its rightful<br />
place as the gold standard for climate reconstructions. That the statistical foundations on which they<br />
had built this paleoclimate castle were a swamp of misrepresentation, deceit, concealment and<br />
malfeasance was, to Wahl and Ammann, an irrelevance. For political and public consumption, the<br />
hockey stick still lived, ready to guide political decision-making for years to come.<br />
15
Was the medieval warm period warmer than today?<br />
The false hockey-stick graph relied upon so very heavily by the IPCC in its<br />
2001 and 2007 reports has been rejected, for very good reasons, as having<br />
“a validation skill not significantly different from zero”. In short, the hockey<br />
stick, for all the squirming and wriggling of its fabricators and of their<br />
associates, and for all the dishonesty and deception perpetrated by the<br />
editors and peer-reviewers of several once-learned journals that are on the<br />
climate issue no more than political soap-boxes for environmental extremism<br />
dressed up to look as though it were science, does not tell us anything. It does<br />
not tell us that there was no medieval warm period, as its fanatical but<br />
scientifically-dubious supporters in and around the IPCC have tried to claim.<br />
Precisely because the hockey stick is valueless, we cannot even use its<br />
rejection by all serious scientists to demonstrate that the Middle Ages were<br />
warmer than the present. Therefore we need to get away from the statistical<br />
games played by the graph’s fabricators and by those, closely linked with<br />
them by previous joint authorship of papers in the learned journals, who<br />
have dishonestly come to their aid.<br />
Instead, we need to examine the wider peer-reviewed literature, not to create<br />
statistical compilations from the proxy temperature records, but to examine<br />
the original proxies themselves, excluding the tree-ring proxies that are<br />
known to be useless because CO 2 fertilization accelerates tree growth in the<br />
same way as rising temperature accelerates it.<br />
All the papers referenced below present graphs that provide visual<br />
confirmation of the existence of the medieval climate optimum or warm<br />
period in every region of the planet.<br />
16
Spannagel Cave, Central Austrian Alps<br />
Mangini et al. (2005) developed a<br />
highly-resolved 2000-year record<br />
of temperature with better than<br />
decadal resolution from a<br />
stalagmite recovered from<br />
Spannagel Cave in the Central<br />
Alps of Austria (47.09°N,<br />
11.67°E). The highest<br />
temperatures of the past two<br />
millennia occurred during the<br />
Medieval Warm Period (AD 800-<br />
1300) and were “slightly higher<br />
than those of the top section of the<br />
stalagmite (1950) and higher than<br />
the present-day temperature.” In<br />
fact, at three different points<br />
during the medieval warm period, their data indicate temperature spikes in excess of 1°C above present<br />
(1995-1998) temperatures.<br />
Cold Air Cave, Makapansgat Valley, South Africa<br />
Tyson et al. (2000) reported<br />
that maximum annual air<br />
temperatures in the vicinity<br />
of Cold Air Cave (24°1'S,<br />
29°11'E) in the<br />
Makapansgat Valley of<br />
South Africa were inferred<br />
from a relationship between<br />
color variations in banded<br />
growth-layer laminations of<br />
a well-dated stalagmite and<br />
the air temperature of a<br />
surrounding 49-station<br />
climatological network<br />
developed over the period 1981-1995, as well as from a quasi-decadal-resolution record of oxygen and<br />
carbon stable isotopes. The medieval warm period (AD 1000-1325) was as much as 3-4°C warmer<br />
than the Current Warm Period (AD 1961-1990 mean).<br />
17
Kitagawa and Matsumoto (1995)<br />
analyzed δ 13 C variations of<br />
Japanese cedars growing on<br />
Yakushima Island, southern Japan<br />
(30°20'N, 130°30'E), to reconstruct<br />
a high-resolution proxy temperature<br />
record over the past 2000 years. The<br />
Medieval Warm Period occurred<br />
between AD 800-1250 and from the<br />
authors' Figure 3, peak warmth<br />
during this time was about 1°C<br />
above that of the Current Warm<br />
Period.<br />
Yakushima Island, Southern Japan<br />
Eastern Bransfield Basin, Antarctic Peninsula<br />
Khim et al. (2002) inferred general climatic features from a study of the grain size, total organic carbon<br />
content, biogenic silica content and, most importantly, magnetic susceptibility of 210 Pb- and 14 C-dated<br />
sediments retrieved from the eastern Bransfield Basin (61°58.9'S, 55°57.4'W) just off the northern tip<br />
of the Antarctic Peninsula. Most of the Medieval Warm Period (AD 1050-1550) was warmer than the<br />
Current Warm Period –<br />
18
Sombre Lake, Signy Island, Maritime Antarctica<br />
Noon et al. (2003) inferred<br />
primarily summer climatic<br />
conditions from a δ 18 O record<br />
preserved in authigenic carbonate<br />
retrieved from sediments of Sombre<br />
Lake (60°43'S, 45°38'W) on Signy<br />
Island, maritime Antarctica. The<br />
Medieval Warm Period (AD 1130-<br />
1215) was warmer than the Current<br />
Warm Period –<br />
Lake Sugan, Northern Tibet<br />
Qiang et al. (2005) conducted stable carbon isotope analyses on sediment cores taken from Lake Sugan<br />
(38°51.19'N, 93°54.09'E) in the NE Tibetan Plateau to produce a proxy of winter temperatures over<br />
2,000 years. The results indicated a warm and dry period between 580 and 1200 AD, which they state<br />
"corresponds to the Medieval Warm Period." A view of the data in the author's Figure 3 reveals the<br />
medieval warm period was probably at least as warm between ~AD 1100 and 1200 as it is presently –<br />
19
Lake Huguangyan, Leizhou Peninsula, Tropical South China<br />
Chu et al. (2002) derived a climatic history from the geochemistry of dated sediments taken from Lake<br />
Huguangyan (21°9'N, 110°17'E) on the Leizhou Peninsula of South China, as well as from information<br />
contained in historical documents. The Medieval Warm Period occurred between AD 900 and 1300-<br />
Northwestern Arabian Sea, Oman<br />
Gupta et al. (2005) derived a high-resolution record of variations in the Indian summer monsoon from<br />
relative abundances of the planktic foraminifer Globigerina bulloides which they had obtained from a<br />
sediment core off the coast of Oman in the northwestern Arabian Sea (18°03.08'N, 57°36.56'E),<br />
indicating that southwest monsoon winds were stronger during the Medieval Warm Period (AD 800-<br />
1300), coincident with a period of high solar activity –<br />
20
New Zealand<br />
Wilson et al. (1979) derived temperatures from an 18 O/ 16 O profile through a stalagmite found in a New<br />
Zealand cave (40.67°S, 172.43°E), revealing the medieval warm period to have occurred between AD<br />
1050 and 1400 and to have been 0.75°C warmer than the current warm period –<br />
Waitomo, North Island, New Zealand<br />
Williams et al. (2005) inferred temperatures from δ 18 O data obtained from four stalagmites found in<br />
caves at Waitomo (38.3°S, 175.1°E) on New Zealand's North Island for which 19 TIMS uranium series<br />
ages were measured. The Medieval Warm Period occurred between AD 1100 and 1400 and was<br />
warmer than the Current Warm Period –<br />
21
Lake Redon, Central and Eastern Pyrenees, Northeast Spain<br />
Pla and Catalan (2005) analyzed chrysophyte cyst data collected from a sediment core obtained from<br />
Lake Redon (42.64°N, 0.77°E) in the Central and Eastern Pyrenees of northeast Spain, producing a<br />
history of winter/spring temperatures for this region throughout the Holocene. The medieval warm<br />
period (~ AD 875 to 1000) was categorized as the "warmest period" of the record, with temperature<br />
about 0.25°C warmer than it is currently –<br />
22
Toskaljavri, Fennoscandia<br />
Seppa and Birks (2002) reconstructed July mean temperatures from a pollen profile of the sediments of<br />
Toskaljavri (69°12'N, 21°28'E), a tree-line lake in the continental sector of northern Fennoscandia. The<br />
medieval warm period occurred between AD 600 and 1000 and was 0.8°C warmer than today –<br />
23
Gorner Glacier, Swiss Alps<br />
Holzhauser et al. (2005) present a high-resolution record of glacial variation for Gorner glacier, in the<br />
Swiss Alps (~46.05°N, 7.62°E), as part of an effort to develop a 3500-year climate history of westcentral<br />
Europe. In their estimation, "at no other glacier in the Swiss Alps ... [is] the Medieval Climatic<br />
Optimum so well documented as at the Gorner glacier," especially when the glacier retreated to levels<br />
beyond that of the present-day between AD 800 and 1100. Because glaciers in mountain areas are<br />
"highly sensitive to climate changes and thus provide one of nature's clearest signals of warming or<br />
cooling and/or dry and wet climate periods," as they describe it, "one can say that the quasi periodical<br />
fluctuations of Alpine glaciers were driven by glacier-hostile (warm/dry) and glacier-friendly<br />
(cool/wet) periods." On this basis, therefore, one can cautiously conclude that temperatures at Gorner<br />
Glacier were likely warmer during the Medieval Warm Period than they have been recently.<br />
Great Aletsch Glacier, Swiss Alps<br />
Holzhauser et al. (2005) also present a high-resolution record of glacial variation for the Great Aletsch<br />
glacier in Swiss Alps (~46.38°N, 7.75°E), as part of an effort to develop a 3500-year climate history of<br />
west-central Europe. As they describe it, the Medieval Warm Period occurred between AD 800 and<br />
1300; and based on data presented in their Figure 2 (reproduced below), glacial extension between AD<br />
800 and 1000 was at a level equal to that of today. Furthermore, because glaciers in mountain areas are<br />
"highly sensitive to climate changes and thus provide one of nature's clearest signals of warming or<br />
cooling and/or dry and wet climate periods," in their estimation, they state that "one can say that the<br />
quasi periodical fluctuations of Alpine glaciers were driven by glacier-hostile (warm/dry) and glacierfriendly<br />
(cool/wet) periods." On this basis one can logically, albeit cautiously, conclude that<br />
temperatures during the Medieval Warm Period were likely as warm as they are today at the Great<br />
Aletsch Glacier.<br />
24
Lower Grindelwald Glacier, Bernese Alps, Switzerland<br />
Holzhauser et al. (2005) also present a record of glacial variation for the Lower Grindelwald glacier, in<br />
the Bernese Alps, Switzerland (~46.58°N, 8.00°E), as part of an effort to develop a 3500-year climate<br />
history of west-central Europe. The Medieval Warm Period was identified in their Figure 2 as a period<br />
of significant glacial recession between AD 800 and 1300 –<br />
Dog Lake, South-Eastern British Columbia, Canada<br />
Hallett et al. (2003) compared the dendrochronological fire history of the forested area surrounding<br />
Dog Lake (50.77°N, 116.1°W) with a high-resolution charcoal record derived from a sediment core<br />
extracted from the lake to reconstruct the region's fire history over the past 1000 years. In addition, the<br />
authors constructed a proxy record of lake-level change based on accumulation rates of Chara<br />
globularis-type oospores in the lake sediment core. These analyses revealed the presence of frequent<br />
forest fires and lowered lake levels during the Medieval Warm Period (AD 980-1270), which in the<br />
words of the authors support evidence of "warmer and drier climate than today" –<br />
25
Island of Pico, Azores, Central North Atlantic<br />
Bjorck et al. (2006) inferred general climatic conditions from "sedimentology, geochemistry, diatom<br />
analyses, magnetic properties, and multivariate statistics, together with 14 C and 210 Pb dating<br />
techniques" applied to a core obtained from the center of a small crater lake on the Azores island of<br />
Pico (38°26'N, 28°12'W). The medieval warm period was broadly characterized by the adjoining<br />
"cooler/drier periods" of 400-800 and 1300-1800 cal yr BP, but the authors found it most strongly<br />
expressed between AD 1000 and 1100 –<br />
Coastal Peru, South America<br />
Rein et al. (2005) derived sea surface temperatures from alkenones extracted from a high-resolution<br />
marine sediment core retrieved off the coast of Peru (12.05°S, 77.66°W), spanning the past 20,000<br />
years and ending in the 1960s. From their Figure 11, adapted below, it can be seen that the warmest<br />
temperatures of this 20,000 year period (~23.2°C) occurred during the late Medieval time (AD 800-<br />
1250). Taking this value, 23.2°C, and comparing it with the modern monthly long-term means in sea<br />
surface temperature, which the authors characterize as between 15°C and 22°C, we estimate the peak<br />
warmth of the Medieval Warm Period was about 1.2°C above the Current Warm Period –<br />
26
Coastal Peru, South America<br />
Rein et al. (2004) analyzed a high-resolution sediment core retrieved from a sheltered basin situated on<br />
the edge of the Peruvian shelf about 80 km west of Lima, Peru (12.05°S, 77.66°W) to produce a proxy<br />
record of El Niño flooding over the past 12,000 years. Results indicated the presence of a significant<br />
dry episode during the late Medieval period in which lithic concentrations - a proxy for El Niño events<br />
- were "very low for about 450 years during the Medieval climatic anomaly from A.D. 800 to 1250."<br />
Because heavy winter rainfalls along and off coastal Peru only occur during times of maximum El Niño<br />
strength, and because El Niños are typically much more prevalent and stronger during cooler as<br />
opposed to warmer periods [see El Niño (Relationship to Global Warming) in our Subject Index], the<br />
implied lack of strong El Niños during the period of time from A.D. 800-1250 suggests that this period<br />
was truly a Medieval Warm Period.<br />
27
Lomonosovfonna Ice Core, Svalbard, Norway<br />
Grinsted et al. (2006), from data obtained from a 121-meter-long ice core extracted from the highest ice<br />
field in Svalbard (Lomonosovfonna: 78°51'53"N, 17°25'30"E), developed "a model of chemical<br />
fractionation in ice based on differing elution rates for pairs of ions ... as a proxy for summer melt<br />
(1130-1990)," which was "validated against twentieth-century instrumental records and longer<br />
historical climate proxies." This work revealed, in their words, that "the Medieval Warm Period in<br />
Svalbard summer conditions [was] as warm (or warmer) as present-day," because "the degree of<br />
summer melt was significantly larger during the period 1130-1300 than in the 1990s."<br />
28
Summit of the Greenland Ice Sheet<br />
Dahl-Jensen compiled contour plots of temperature histograms from the GRIP ice-core as a function of<br />
time, describing the reconstructed temperature history and its uncertainty at the present elevation (3240<br />
m) of the summit of the Greenland Ice Sheet. (A) The last 100 ky BP. The last glacial maximum (25 ka<br />
BP) is seen to have been 23 degrees K colder than the present temperature, and temperatures are seen<br />
to rise directly into the warm climate optimum 8 to 5 ka. (B) The last 10 ky BP. The climate optimum<br />
is 2.5 degrees K warmer than the present temperature, and at 5 ka the temperature slowly cools toward<br />
the cold temperatures found around 2 ka. (C) The last 2000 years. The medieval warming (~1000 AD)<br />
is 1 degree K warmer than the present temperature, and the Little Ice Age is seen to have two minima<br />
at 1500 and 1850 A.D., followed by a temperature rise culminating around 1930 A.D. Temperature<br />
cools between 1940 and 1995.<br />
29
Temperatures from proxy data with tree-rings eliminated<br />
Loehle (2007) compiled a global palaeoclimate temperature series from proxy temperature data after<br />
eliminating data derived from tree-rings, which are unreliable in that their growth is enhanced not only<br />
by temperature increase but also by higher precipitation and by CO2 fertilization. After the distortions<br />
caused by the tree-ring data were eliminated, the medieval warm period was shown to have been<br />
significantly warmer than the present.<br />
MWP<br />
30
Conclusion<br />
The continuing affair of the “hockey-stick” graph is a microcosm of the profound collapse of the rigor,<br />
objectivity, and honesty that were once hallmarks of the scientific community. The need to look to the<br />
State for very nearly all science funding has inflicted upon the scientific community a dull, dishonest<br />
uniformity, so that the deliberate falsification of results to support the current official orthodoxy has<br />
become commonplace, particularly where the climate question is concerned.<br />
It was bad enough that one of those behind the “hockey stick” affair should have told a fellowresearcher,<br />
“We need to get rid of the medieval warm period.” It was worse that the authors of the<br />
bogus graph attempted to do just that, by ignoring, undervaluing or even suppressing proxies for<br />
northern-hemisphere temperature that did not suit the result they wanted; by falsely stating that they<br />
had used data they had in fact replaced with “estimates” of their own that gave them a less inconvenient<br />
answer; by overvaluing by many orders of magnitude the contribution of datasets that suited the result<br />
they wanted.<br />
It was worse still that the IPCC, several leading journals and numerous former co-authors of the three<br />
fabricators of the hockey stick should have continued to cling to it as though it were Gospel even<br />
though it has been justifiably and utterly discredited in the scientific literature, and should have gone<br />
through an elaborate pantomime of rewriting and publishing previously-rejected papers with the<br />
connivance of a dishonest journal editor, so that an entirely fictitious scientific support for the false<br />
graph could be falsely claimed by the IPCC in its current Fourth Assessment Report.<br />
The IPCC might have regained some of the scientific credibility that it lost by its publication of the<br />
2001 graph if, in its 2007 assessment report, it had had the integrity, honesty, and common sense to<br />
apologise for the failure of its soi-disant “peer-review” process to identify the multiple and serious<br />
scientific errors that led to the publication of the graph.<br />
As it is, the IPCC, rather than apologizing, has chosen to participate in the falsification of subsequent<br />
results purporting to uphold the original graph, and altogether to ignore papers such as those whose<br />
graphs are shown here, confirming the well-established historical record of the existence of the<br />
medieval warm period. No serious scientist, therefore, can any longer take any of the IPCC’s<br />
conclusions seriously for a single moment longer. As Lord Lawson of Blaby has long argued, the IPCC<br />
should now be abolished. It cannot serve any useful purpose in future, because it has dishonestly lent<br />
its support not merely to the falsification of scientific results but to the persistent maintenance of that<br />
falsification. The IPCC is finished.<br />
Was there a medieval warm period? Yes. Was that period warmer worldwide than the present? Yes.<br />
Are today’s global temperatures exceptional? No. Have the past ten thousand years been generally<br />
warmer than the present? Yes: much warmer. Is there, therefore, the slightest reason for the childish<br />
panic that the environmental extremist movement and its servant the IPCC have attempted to whip up?<br />
No. Should any government devote a single further penny to the climate scare? No. Even if humankind<br />
is contributing significantly to warmer weather (which is highly unlikely), adaptation to warmer<br />
weather as and if necessary would be orders of magnitude cheaper than the measures to reduce carbon<br />
emissions that the world’s extremist politicians are now so eagerly but purposelessly advocating.<br />
The real cost of the flagrant abuses of the scientific method surrounding the question of climate that are<br />
so well illustrated by the affair of the “hockey stick” is a terrible, unseen cost in human lives. The<br />
31
iofuel scam that arose directly out of the climate scare has taken one-third of US agricultural land out<br />
of food production in just two years. Similar economic disasters have occurred worldwide, not because<br />
of “global warming” but because of the catastrophically bad policy-making that the “global warming”<br />
scare has engendered among politicians too ignorant of science and too lazy to do other than swim with<br />
the rising tide of pseudo-scientific nonsense.<br />
The environmental extremists, who have already killed 50 million children through malaria by their<br />
now-canceled ban on the use of DDT, the only effective agent against the anopheles mosquito that<br />
spreads the infective parasite, are already eagerly killing millions more through their latest<br />
scientifically-baseless scare – the “global warming” panic pandemic. Food riots are occurring<br />
throughout the world among the poorest of the poor in many countries: but the desperation, starvation,<br />
disease, and death that accompany the sudden famines that the biofuel-driven doubling of world food<br />
prices has engendered are scarcely reported by our news media. In Haiti, they are eating mud pies made<br />
of earth, water, a tiny knob of butter, and a pinch of salt; or they sell the mud pies to less fortunate<br />
neighbours at 3 US cents each. Has any Western news medium reported this, or the hundreds of other<br />
agonizing stories of famine and starvation all round the world? No. Instead, every icicle that falls in<br />
Greenland is paraded as an omen of imminent doom: and, as for the crooked pseudo-scientists who<br />
invented the hockey stick, supported it, and continue to parade it in the mendacious documents of the<br />
IPCC, no journalist would dare to ask any of them the questions that would expose their self-seeking<br />
corruption for what it is. These evil pseudo-scientists, through the falsity of their statistical<br />
manipulations, have already killed far more people through starvation than “global warming” will ever<br />
kill. They should now be indicted and should stand trial alongside Radovan Karadzic for nothing less<br />
than high crimes against humanity: for, in their callous disregard for the fatal consequences of their<br />
corrupt falsification of science, they are no less guilty of genocide than he.<br />
32
References<br />
BJORCK, S., Rittenour, T., Rosen, P., Franca, Z., Moller, P., Snowball, I., Wastegard, S., Bennike, O.<br />
and Kromer, B. 2006. A Holocene lacustrine record in the central North Atlantic: proxies for volcanic<br />
activity, short-term NAO mode variability, and long-term precipitation changes. Quaternary Science<br />
Reviews 25: 9-32.<br />
CHU, G., Liu, J., Sun, Q., Lu, H., Gu, Z., Wang, W. and Liu, T. 2002. The 'Medieval Warm Period'<br />
drought recorded in Lake Huguangyan, tropical South China. The Holocene 12: 511-516.<br />
DAHL-JENSEN (1998), Temperature history of the summit of the Greenland Ice Sheet, Science 282.<br />
GRINSTED, A., Moore, J.C., Pohjola, V., Martma, T. and Isaksson, E. 2006. Svalbard summer<br />
melting, continentality, and sea ice extent from the Lomonosovfonna ice core. Journal of Geophysical<br />
Research 111: 10.1029/2005JD006494.<br />
GUPTA, A.K., Das, M. and Anderson, D.M. 2005. Solar influence on the Indian summer monsoon<br />
during the Holocene. Geophysical Research Letters 32: doi:10.1029/2005GL022685.<br />
HALLETT, D.J., Mathewes, R.W. and Walker, R.C. 2003. A 1000-year record of forest fire, drought<br />
and lake-level change in southeastern British Columbia, Canada. The Holocene 13: 751-761.<br />
HOLZHAUSER, H., Magny, M. and Zumbuhl, H.J. 2005. Glacier and lake-level variations in westcentral<br />
Europe over the last 3500 years. The Holocene 15: 789-801.<br />
KHIM, B.-K., Yoon, H.I., Kang, C.Y. and Bahk, J.J. 2002. Unstable climate oscillations during the<br />
Late Holocene in the Eastern Bransfield Basin, Antarctic Peninsula. Quaternary Research 58: 234-<br />
245.<br />
MANGINI, A., Spotl, C. and Verdes, P. 2005. Reconstruction of temperature in the Central Alps<br />
during the past 2000 yr from a δ 18 O stalagmite record. Earth and Planetary Science Letters 235: 741-<br />
751.<br />
NOON, P.E., Leng, M.J. and Jones, V.J. 2003. Oxygen-isotope (δ 18 O) evidence of Holocene<br />
hydrological changes at Signy Island, maritime Antarctica. The Holocene 13: 251-263.<br />
PLA, S. and Catalan, J. 2005. Chrysophyte cysts from lake sediments reveal the submillennial<br />
winter/spring climate variability in the northwestern Mediterranean region throughout the Holocene.<br />
Climate Dynamics 24: 263-278.<br />
QIANG, M., Chen, F., Zhang, J., Gao, S. and Zhou, A. 2005. Climatic changes documented by stable<br />
isotopes of sedimentary carbonate in Lake Sugan, northeastern Tibetan Plateau of China, since 2,000<br />
years before the present. Chinese Science Bulletin 50: 1930-1939.<br />
REIN B., Lückge, A., Reinhardt, L., Sirocko, F., Wolf, A. and Dullo, W.-C. 2005. El Niño variability<br />
off Peru during the last 20,000 years. Paleoceanography 20: 10.1029/2004PA001099.<br />
REIN B., Luckge, A. and Sirocko, F. 2004. A major Holocene ENSO anomaly during the Medieval<br />
period. Geophysical Research Letters 31: 10.1029/2004GL020161.<br />
33
SEPPA, H. and Birks, H.J.B. 2002. Holocene climate reconstructions from the Fennoscandian treeline<br />
area based on pollen data from Toskaljavri. Quaternary Research 57: 191-199.<br />
TYSON, P.D., Karlen, W., Holmgren, K. and Heiss, G.A. 2000. The Little Ice Age and medieval<br />
warming in South Africa. South African Journal of Science 96: 121-126.<br />
WILLIAMS, P.W., King, D.N.T., Zhao, J.-X. and Collerson, K.D. 2004. Speleothem master<br />
chronologies: combined Holocene 18 O and 13 C records from the North Island of New Zealand and their<br />
palaeoenvironmental interpretation. The Holocene 14: 194-208.<br />
WILSON, A.T., Hendy, C.H. and Reynolds, C.P. 1979. Short-term climate change and New Zealand<br />
temperatures during the last millennium. Nature 279: 315-317.<br />
34