Tests for Two Populations with Excel - SLC Home Page
Tests for Two Populations with Excel - SLC Home Page
Tests for Two Populations with Excel - SLC Home Page

You also want an ePaper? Increase the reach of your titles
YUMPU automatically turns print PDFs into web optimized ePapers that Google loves.
MATHEMATICS 360-255-LW<br />
Quantitative Methods II<br />
Martin Huard<br />
Fall 2009<br />
<strong>Two</strong> Population <strong>Tests</strong> <strong>with</strong> <strong>Excel</strong><br />
Hypothesis testing <strong>for</strong> the mean of two dependent samples<br />
Example 1<br />
A company claims its 12-week exercise program significantly reduces weight. A random sample<br />
of 6 persons was selected and their weight (in kg) measured be<strong>for</strong>e and after the program.<br />
Be<strong>for</strong>e After<br />
91 86<br />
84 88<br />
109 100<br />
142 121<br />
94 92<br />
120 111<br />
At the 1% level of significance, can you conclude that the mean weight loss is greater than zero?<br />
Assume the populations are normally distributed. Use the classical approach.<br />
Make the usual heading in cells A1:A4. In cell A6 write “Be<strong>for</strong>e” and in cell B6 “After”. Enter<br />
the above data in below these two headings, in cells A6:B11.<br />
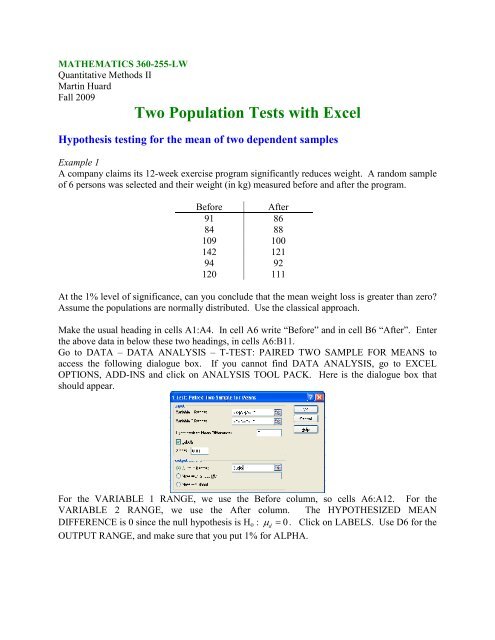
Go to DATA – DATA ANALYSIS – T-TEST: PAIRED TWO SAMPLE FOR MEANS to<br />
access the following dialogue box. If you cannot find DATA ANALYSIS, go to EXCEL<br />
OPTIONS, ADD-INS and click on ANALYSIS TOOL PACK. Here is the dialogue box that<br />
should appear.<br />
For the VARIABLE 1 RANGE, we use the Be<strong>for</strong>e column, so cells A6:A12. For the<br />
VARIABLE 2 RANGE, we use the After column. The HYPOTHESIZED MEAN<br />
DIFFERENCE is 0 since the null hypothesis is H o : µ<br />
d<br />
= 0. Click on LABELS. Use D6 <strong>for</strong> the<br />
OUTPUT RANGE, and make sure that you put 1% <strong>for</strong> ALPHA.
QM II<br />
<strong>Two</strong> Population <strong>Tests</strong> <strong>with</strong> <strong>Excel</strong><br />
Once you have the results, adjust the columns widths accordingly and round some of the<br />
numbers. Your <strong>Excel</strong> worksheet should look like:<br />
H 0: µ<br />
d<br />
= 0<br />
Degrees of freedom<br />
p-value – one tail<br />
( df , )<br />
d<br />
t =<br />
− µ<br />
sd<br />
n<br />
d<br />
t<br />
α<br />
( )<br />
p-value – two tails<br />
t df , α<br />
2<br />
You can then complete the 5 steps, making cell references in step 3 and step 4. Here is what<br />
your worksheet should look like, where the shaded cells are obtained <strong>with</strong> an appropriate cell<br />
reference.<br />
Fall 2009 Martin Huard 2
QM II<br />
<strong>Two</strong> Population <strong>Tests</strong> <strong>with</strong> <strong>Excel</strong><br />
Hypothesis testing <strong>for</strong> the mean of two independent (known σ)<br />
Example 2<br />
A social sociologist was interested in sex differences in the number of books a person reads.<br />
<strong>Two</strong> random samples were taken, one of men and the other, and the number of books read during<br />
the last month was recorded. Is there a difference <strong>with</strong> respect to the number of books read by<br />
females and males? Use a 3% level of significance. Assume that the population standard<br />
deviation <strong>for</strong> females is 3.1 and 2.9 <strong>for</strong> males.<br />
Female: 8 3 1 7 7 6 8 5 6 5 4 2 9 7 6 8 2 4 5 6 9 1 2 4 6 8 7 5 9 6<br />
Male: 1 5 8 3 2 1 2 6 4 2 9 3 4 8 7 2 6 12 4 5 3 1 3 6 7 4 1 2 6 3 1 2 3<br />
As in the previous example, copy this data in cells A6:B39. Go to TOOLS – DATA ANALYSIS<br />
and choose Z-TEST TWO SAMPLE FOR MEANS. Fill in the in<strong>for</strong>mation appropriately (don’t<br />
<strong>for</strong>get that <strong>Excel</strong> asks <strong>for</strong> the variance, but you have the standard deviation!). Your results<br />
should look like this (where the relevant in<strong>for</strong>mation was highlighted).<br />
z =<br />
( x − x ) − ( µ − µ )<br />
F M F M<br />
2 2<br />
sF<br />
sM<br />
n<br />
+<br />
F nM<br />
Fall 2009 Martin Huard 3
QM II<br />
<strong>Two</strong> Population <strong>Tests</strong> <strong>with</strong> <strong>Excel</strong><br />
Hypothesis testing <strong>for</strong> the mean of two independent (unknown σ)<br />
Example 3<br />
A social psychologist was interested in sex differences in the sociability of teenagers. Using the<br />
number of good friends as a measure, he compared the sociability of eight female and seven<br />
male teenagers. Is there a difference <strong>with</strong> respect to sociability between teenage females and<br />
males? Use a 3% level of significance. Assume that the sociability of female and male<br />
teenagers are normally distributed. Use the p-value approach.<br />
Females Males<br />
8 1<br />
3 5<br />
1 8<br />
7 3<br />
7 2<br />
6 1<br />
8 2<br />
5<br />
As in the previous example, copy this table in cells A6:B14. Proceed as in the previous example,<br />
except use T-TEST: TWO-SAMPLE ASSUMING EQUAL VARIANCES in DATA<br />
ANALYSIS. Your results should look like this (where the relevant in<strong>for</strong>mation was<br />
highlighted).<br />
( − 1) + ( −1)<br />
2 2<br />
nF sF nM sM<br />
s p<br />
= n F + n M −2<br />
x<br />
t =<br />
s<br />
F<br />
− x<br />
M<br />
+<br />
1 1<br />
p nF<br />
nM<br />
Fall 2009 Martin Huard 4