eti facts behind the figures - The Nigerian Stock Exchange
eti facts behind the figures - The Nigerian Stock Exchange
eti facts behind the figures - The Nigerian Stock Exchange

You also want an ePaper? Increase the reach of your titles
YUMPU automatically turns print PDFs into web optimized ePapers that Google loves.
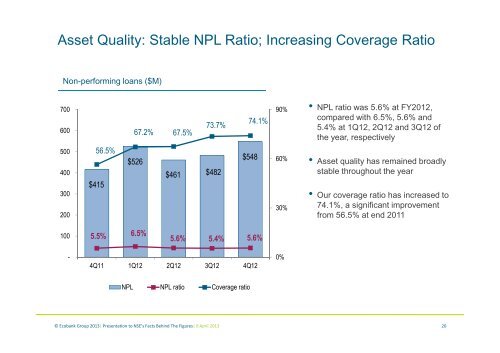
Asset Quality: Stable NPL Ratio; Increasing Coverage Ratio<br />
Non-performing loans ($M)<br />
700<br />
600<br />
67.2% 67.5%<br />
73.7%<br />
74.1%<br />
90%<br />
• NPL ratio was 5.6% at FY2012,<br />
compared with 6.5%, 5.6% and<br />
5.4% at 1Q12, 2Q12 and 3Q12 of<br />
<strong>the</strong> year, respectively<br />
500<br />
400<br />
300<br />
200<br />
56.5%<br />
$415<br />
$526<br />
$461 $482<br />
$548<br />
60%<br />
30%<br />
• Asset quality has remained broadly<br />
stable throughout <strong>the</strong> year<br />
• Our coverage ratio has increased to<br />
74.1%, a significant improvement<br />
from 56.5% at end 2011<br />
100<br />
5.5% 6.5%<br />
5.6% 5.4% 5.6%<br />
-<br />
4Q11 1Q12 2Q12 3Q12 4Q12<br />
0%<br />
NPL NPL ratio Coverage ratio<br />
© Ecobank Group 2013| Presentation to NSE’s Facts Behind <strong>The</strong> Figures| 8 April 2013<br />
20