eti facts behind the figures - The Nigerian Stock Exchange
eti facts behind the figures - The Nigerian Stock Exchange
eti facts behind the figures - The Nigerian Stock Exchange

You also want an ePaper? Increase the reach of your titles
YUMPU automatically turns print PDFs into web optimized ePapers that Google loves.
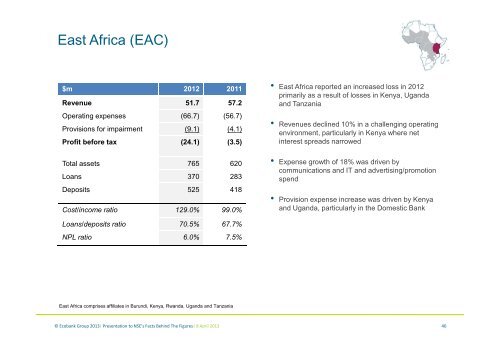
East Africa (EAC)<br />
$m 2012 2011<br />
Revenue 51.7 57.2<br />
Operating expenses (66.7) (56.7)<br />
Provisions for impairment (9.1) (4.1)<br />
Profit before tax (24.1) (3.5)<br />
Total assets 765 620<br />
Loans 370 283<br />
Deposits 525 418<br />
Cost/income ratio 129.0% 99.0%<br />
• East Africa reported an increased loss in 2012<br />
primarily as a result of losses in Kenya, Uganda<br />
and Tanzania<br />
• Revenues declined 10% in a challenging operating<br />
environment, particularly in Kenya where net<br />
interest spreads narrowed<br />
• Expense growth of 18% was driven by<br />
communications and IT and advertising/promotion<br />
spend<br />
• Provision expense increase was driven by Kenya<br />
and Uganda, particularly in <strong>the</strong> Domestic Bank<br />
Loans/deposits ratio 70.5% 67.7%<br />
NPL ratio 6.0% 7.5%<br />
East Africa comprises affiliates in Burundi, Kenya, Rwanda, Uganda and Tanzania<br />
© Ecobank Group 2013| Presentation to NSE’s Facts Behind <strong>The</strong> Figures| 8 April 2013<br />
40