IPAA Oil & Gas Producing Industry in Your State - Energy in Depth
IPAA Oil & Gas Producing Industry in Your State - Energy in Depth
IPAA Oil & Gas Producing Industry in Your State - Energy in Depth

You also want an ePaper? Increase the reach of your titles
YUMPU automatically turns print PDFs into web optimized ePapers that Google loves.
<strong>IPAA</strong> <strong>Oil</strong> & <strong>Gas</strong> <strong>Produc<strong>in</strong>g</strong> <strong>Industry</strong><br />
<strong>in</strong> <strong>Your</strong> <strong>State</strong><br />
2007-2008<br />
COMPILED BY <strong>IPAA</strong> FEBRUARY 2009 AMERICA’S INDEPENDENT C1
Be a part of <strong>IPAA</strong>’s premiere grassroots <strong>in</strong>itiative, the<br />
RIG Program<br />
What is the <strong>IPAA</strong> RIG Program?<br />
• A volunteer-based campaign<br />
• A tool for educat<strong>in</strong>g elected offi cials<br />
• The most effective way for you to have a<br />
positive impact on your <strong>in</strong>dustry!<br />
Intended to maximize the <strong>in</strong>dependent producer’s voice and concerns<br />
regard<strong>in</strong>g national energy policy, the RIG Program will establish susta<strong>in</strong>ed,<br />
one-to-one relationships between <strong>IPAA</strong> members and their elected<br />
offi cials.<br />
Small tasks can have a large effect! Help make a difference <strong>in</strong> shap<strong>in</strong>g our<br />
national energy policy, jo<strong>in</strong> the RIG Program today and f<strong>in</strong>d out what you<br />
can do to get <strong>in</strong>volved.<br />
To learn more, or to register to participate, visit www.ipaa.org/rig/<br />
Or send an email to rigprogram@ipaa.org<br />
C2 AMERICA’S INDEPENDENT COMPILED BY <strong>IPAA</strong> FEBRUARY 2009
INDEPENDENT PETROLEUM<br />
ASSOCIATION OF AMERICA<br />
1201 15th St., N.W., Suite 300<br />
Wash<strong>in</strong>gton, DC 20005<br />
(202) 857-4722<br />
Fax: (202) 857-4799<br />
www.ipaa.org<br />
Chairman<br />
H.G. “Buddy” Kleemeier<br />
Vice-Chairman<br />
Bruce V<strong>in</strong>cent<br />
Treasurer<br />
Diemer True<br />
President & CEO<br />
Barry Russell<br />
Immediate Past Chairman<br />
Mike L<strong>in</strong>n<br />
GOVERNMENT RELATIONS<br />
Vice President of Government Relations<br />
Lee O. Fuller<br />
Vice President of Federal Resources<br />
& Political Affairs<br />
Dan Naatz<br />
Vice President of Crude <strong>Oil</strong> and Natural <strong>Gas</strong><br />
Regulatory Affairs<br />
Susan G<strong>in</strong>sberg<br />
Director of Government Relations &<br />
<strong>Industry</strong> Affairs<br />
Joel Noyes<br />
Legislative and PAC Manager<br />
Cortney Hazen<br />
Legislative Assistant<br />
Ryan Ullman<br />
Brent Golleher<br />
BUSINESS DEVELOPMENT, CAPITAL<br />
MARKETS, AND MEMBERSHIP<br />
Vice President of Bus<strong>in</strong>ess Development, Capital<br />
Markets, and Membership<br />
William V. Moyer<br />
Director of Membership Services<br />
LuAnne Tyler<br />
INFORMATION SERVICES<br />
Vice President of Economics &<br />
International Affairs<br />
Frederick J. Lawrence<br />
MEETINGS<br />
Vice President of Meet<strong>in</strong>gs<br />
T<strong>in</strong>a Haml<strong>in</strong><br />
Director of Meet<strong>in</strong>gs<br />
Christ<strong>in</strong> McGrath<br />
Assistant Director<br />
Kim Egan<br />
Meet<strong>in</strong>gs Manager<br />
Carol<strong>in</strong>e Hawk<strong>in</strong>s<br />
Meet<strong>in</strong>gs Market<strong>in</strong>g Manager<br />
Joanie Rylander<br />
Meet<strong>in</strong>gs Coord<strong>in</strong>ator<br />
Nikki McDermott<br />
COMMUNICATIONS<br />
Vice President of Public Affairs<br />
& Communications<br />
Jeff Eshelman<br />
Director of Public Affairs<br />
Nicole Daigle<br />
Staff Editor<br />
Brendan Bradley<br />
Educational Center<br />
Director of Education<br />
Doris Richardson<br />
F<strong>in</strong>ancial Services<br />
Director<br />
Daniel Watford<br />
ADMINISTRATION<br />
Vice President of Adm<strong>in</strong>istration<br />
Therese McCafferty<br />
THE OIL & GAS PRODUCING INDUSTRY IN YOUR STATE<br />
The Year <strong>in</strong> Review<br />
2006: US <strong>Energy</strong> <strong>Energy</strong> Future<br />
at a Crossroad ………… 3<br />
Statistical Summary<br />
Crude <strong>Oil</strong> Summary …………………… 19<br />
Natural <strong>Gas</strong> Summary ………………… 20<br />
Drill<strong>in</strong>g Summary ……………………… 21<br />
<strong>State</strong> Statistics<br />
United <strong>State</strong>s …………………………… 24<br />
Federal Offshore ……………………… 26<br />
Alabama ………………………………… 28<br />
Alaska …………………………………… 30<br />
Arizona …………………………………… 32<br />
Arkansas ………………………………… 34<br />
California ………………………………… 36<br />
Colorado ………………………………… 38<br />
Florida …………………………………… 40<br />
Ill<strong>in</strong>ois …………………………………… 42<br />
Indiana …………………………………… 44<br />
Kansas …………………………………… 46<br />
Kentucky ………………………………… 48<br />
Louisiana ………………………………… 50<br />
Maryland ………………………………… 52<br />
Michigan ………………………………… 54<br />
Mississippi ……………………………… 56<br />
Missouri ………………………………… 58<br />
Montana ………………………………… 60<br />
Nebraska ………………………………… 62<br />
Nevada…………………………………… 64<br />
New Mexico……………………………… 66<br />
New York ………………………………… 68<br />
North Dakota …………………………… 70<br />
Ohio ……………………………………… 72<br />
Oklahoma ……………………………… 74<br />
Oregon …………………………………… 76<br />
Pennsylvania …………………………… 78<br />
South Dakota …………………………… 80<br />
Tennessee ……………………………… 82<br />
Texas …………………………………… 84<br />
Utah ……………………………………… 86<br />
Virg<strong>in</strong>ia …………………………………… 88<br />
West Virg<strong>in</strong>ia …………………………… 90<br />
Wyom<strong>in</strong>g. ………………………………… 92<br />
Exploration and Drill<strong>in</strong>g<br />
Rotary Rigs Operat<strong>in</strong>g ………………… 94<br />
New-Field Wildcat Wells Drilled ……… 93<br />
Exploratory Wells Drilled ……………… 96<br />
Development Wells Drilled …………… 97<br />
Total Wells Drilled ……………………… 98<br />
CONTENTS<br />
Production<br />
<strong>Produc<strong>in</strong>g</strong> Crude <strong>Oil</strong> Wells …………… 99<br />
<strong>Produc<strong>in</strong>g</strong> Natural <strong>Gas</strong> Wells …………100<br />
Crude <strong>Oil</strong> Production ……………………101<br />
Natural <strong>Gas</strong> Production …………………102<br />
Marg<strong>in</strong>al Wells<br />
<strong>Produc<strong>in</strong>g</strong> <strong>Oil</strong> Marg<strong>in</strong>al Wells …………103<br />
Marg<strong>in</strong>al <strong>Oil</strong> Well Production …………104<br />
<strong>Produc<strong>in</strong>g</strong> Marg<strong>in</strong>al <strong>Gas</strong> Wells …………105<br />
Marg<strong>in</strong>al <strong>Gas</strong> Production ………………106<br />
Abandonments ………………………… 110<br />
F<strong>in</strong>ancial<br />
Cost-Drill<strong>in</strong>g & Equipp<strong>in</strong>g Wells ………107<br />
Crude <strong>Oil</strong> Revenues ……………………108<br />
Natural <strong>Gas</strong> Revenues …………………109<br />
Severance & Production Taxes ……… 111<br />
Prices<br />
Crude <strong>Oil</strong> Wellhead Prices …………… 112<br />
Natural <strong>Gas</strong> Wellhead Prices ………… 113<br />
Refi ner Acquisition Cost<br />
of Crude <strong>Oil</strong> ……………………………… 114<br />
Retail <strong>Gas</strong>ol<strong>in</strong>e Prices ………………… 114<br />
Wholesale Prices -Total U.S. ………… 115<br />
Consumption<br />
Petroleum Consumption ……………… 115<br />
Natural <strong>Gas</strong> Consumption …………… 117<br />
Miscellaneous<br />
American <strong>Oil</strong> & <strong>Gas</strong> Historical Society .... 19<br />
<strong>State</strong> Rank<strong>in</strong>gs ………………………… 20<br />
World Crude <strong>Oil</strong> Reserves …………… 114<br />
<strong>Industry</strong> Employment - 2006 ………… 118<br />
Reference Information<br />
Abbreviations/Conversions …………… 119<br />
Cooperat<strong>in</strong>g <strong>Oil</strong> & <strong>Gas</strong> Associations …… 9<br />
Data Sources …………………………… 111<br />
Educational Resources ………………… 15<br />
Glossary …………………………………120<br />
<strong>Oil</strong> and <strong>Gas</strong> Museums ………………… 17<br />
<strong>State</strong> Education Program ……………… 11<br />
<strong>State</strong> <strong>Energy</strong> Contacts …………………… 7<br />
Young Professionals <strong>in</strong> <strong>Energy</strong> ……… 16<br />
<strong>State</strong> history facts and cover photography provided<br />
by Bruce Wells, Executive Director of the American<br />
<strong>Oil</strong> & <strong>Gas</strong> Historical Society (AOGHS) and the<br />
historical society’s quarterly newsletter, the Petroleum<br />
Age. AOGHS is a 501(c)-3 nonprofi t energy education<br />
organization based <strong>in</strong> Wash<strong>in</strong>gton, DC.<br />
Visit www.aoghs.org or email bawells@aoghs.org.<br />
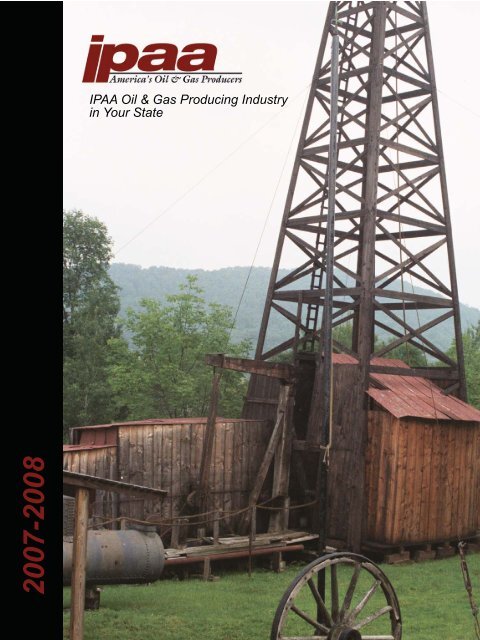
Image: A standard cable-tool rig at Penn-Brad<br />
Historical <strong>Oil</strong> Well Park, near Bradford, PA.<br />
IT Manager and Webmaster<br />
Kirk Friedman<br />
COMPILED BY <strong>IPAA</strong> FEBRUARY 2009 AMERICA’S INDEPENDENT 1<br />
Adm<strong>in</strong>istrative Assistant<br />
Vanessa Johnson<br />
CONTENTS THE OIL & GAS PRODUCING INDUSTRY IN YOUR STATE
THE OIL & NATURAL GAS PRODUCING INDUSTRY<br />
IN YOUR STATE<br />
Vol. 77 No. 19<br />
Editor: Frederick J. Lawrence<br />
The <strong>Oil</strong> & Natural <strong>Gas</strong> <strong>Produc<strong>in</strong>g</strong> <strong>Industry</strong> In <strong>Your</strong> <strong>State</strong> is published<br />
each year as the special statistical issue of America’s Independent,<br />
official magaz<strong>in</strong>e of the Independent Petroleum Association<br />
of America, (<strong>IPAA</strong>).<br />
Roustabout and corporate members of <strong>IPAA</strong> receive one free copy<br />
of this issue; additional copies or regular member copies are available<br />
for $25 each. Non-members of <strong>IPAA</strong> are charged $75 per<br />
copy. Complimentary subscribers are entitled to one free issue;<br />
additional copies cost $25 each.<br />
<strong>IPAA</strong> offers the follow<strong>in</strong>g publications as part of its Economic Reports:<br />
The <strong>Oil</strong> & Natural <strong>Gas</strong> <strong>Produc<strong>in</strong>g</strong> <strong>Industry</strong> In <strong>Your</strong> <strong>State</strong> (annual)<br />
U.S. Petroleum Statistics (annual)<br />
America’s Independent magaz<strong>in</strong>e (monthly)<br />
<strong>Industry</strong> Fact Sheets (periodically)<br />
International Primer (first edition & supplements)<br />
International Taxation Primer<br />
<strong>IPAA</strong> International Activity Survey<br />
<strong>IPAA</strong> Members may receive all the above reports on a regular basis<br />
by pay<strong>in</strong>g $75 per year. Non-members of <strong>IPAA</strong> may subscribe<br />
to the reports listed above for $400 per year. Reports also may be<br />
purchased on an <strong>in</strong>dividual basis.<br />
To subscribe or <strong>in</strong>quire about any of <strong>IPAA</strong>’s Economic Reports, contact:<br />
Independent Petroleum Association of America<br />
Information Services Department (flawrence@ipaa.org)<br />
1201 15th St., N.W., Suite 300<br />
Wash<strong>in</strong>gton, D.C. 20005<br />
Phone: 202-857-4722<br />
Fax: 202-857-0444<br />
www.ipaa.org<br />
2 AMERICA’S INDEPENDENT COMPILED BY <strong>IPAA</strong> FEBRUARY 2009
THE YEAR IN REVIEW: INTRODUCTION TO 2006 O&G IN YOUR STATE<br />
2006: U.S <strong>Energy</strong> Future at a Crossroads<br />
Pete Stark, Ph. D., IHS<br />
Introduction:<br />
In the wake of Hurricanes Katr<strong>in</strong>a and Rita, anxieties<br />
about the security of U.S. energy supplies soared while<br />
the petroleum <strong>in</strong>dustry focused on restor<strong>in</strong>g oil and gas<br />
production and realign<strong>in</strong>g supply cha<strong>in</strong>s. Dur<strong>in</strong>g June<br />
2006, the M<strong>in</strong>erals Management Service (MMS) reported<br />
that hurricane damages resulted <strong>in</strong> cumulative loss<br />
of 162 MMb of oil production and 784 Bcf of cumulative<br />
gas production from the Federal Offshore Gulf of<br />
Mexico. This amounted to 30% of annual oil production<br />
and 21% of annual natural gas production from this<br />
prov<strong>in</strong>ce. Vulnerability of offshore Gulf of Mexico production<br />
and near-shore facilities to hurricane damage<br />
prompted the U.S. <strong>Energy</strong> Information Agency (EIA) to<br />
add a hurricane risk factor to its oil and gas production<br />
forecasts. <strong>Energy</strong> policy makers looked for options to<br />
improve the security of oil and gas supplies and calls<br />
for “energy <strong>in</strong>dependence” and freedom from “foreign”<br />
oil imports made headl<strong>in</strong>es dur<strong>in</strong>g the first quarter of<br />
2006. The petroleum <strong>in</strong>dustry noted that a simple option<br />
to reduce the vulnerability of U.S. oil and gas supplies<br />
would be to open access to prospective offshore<br />
and Arctic areas that have been off limits to explorers.<br />
Fears abounded at the start of the year that tight oil and<br />
gas supplies would substantially <strong>in</strong>crease prices dur<strong>in</strong>g<br />
the year. On January 3, 2006 U.S. crude oil was<br />
$63.14 per barrel, almost 50% higher than the price on<br />
January 3, 2005. Concerns about political risks <strong>in</strong> the<br />
Middle East, supply disruptions <strong>in</strong> other important oil<br />
produc<strong>in</strong>g countries like Nigeria and OPEC’s dw<strong>in</strong>dl<strong>in</strong>g<br />
surplus produc<strong>in</strong>g capacity were cited as drivers for<br />
high oil prices even though January 2006 U.S. crude oil<br />
stocks stood at 321 MMb, at the top of the 5-year maximum<br />
range for this month. Crude oil stocks cont<strong>in</strong>ued<br />
to build through most of the year reach<strong>in</strong>g a high of 340<br />
MMb dur<strong>in</strong>g November. Monthly oil prices eventually<br />
peaked at $74.40 per barrel dur<strong>in</strong>g July 2006 and the<br />
year closed at $57.75 per barrel – off $5.39 from January<br />
3, 2006. The 2006 annual average oil price, nevertheless,<br />
was $65.58, almost 16% higher than <strong>in</strong> 2005.<br />
The abrupt and unexpected turnaround <strong>in</strong> the U.S. gas<br />
market was a relief for consumers but created crossroads<br />
for producers, planners and policy makers alike. Dur<strong>in</strong>g<br />
1997, U.S. gas production essentially reached a plateau.<br />
From 1997 to 2005, U.S. gas production ranged from<br />
56 – 60 Bcfd before a series of hurricanes struck the Gulf<br />
Coast. To susta<strong>in</strong> this decade-long plateau, U.S. gas<br />
well completions more than doubled from about 12,500<br />
wells dur<strong>in</strong>g 1997 to 30,349 gas wells dur<strong>in</strong>g 2006.<br />
Increased drill<strong>in</strong>g was required to offset the decl<strong>in</strong>e <strong>in</strong><br />
high productivity conventional offshore and onshore gas<br />
production with lower productivity gas wells from unconventional<br />
reservoirs. From 1997 through 2005 this looked<br />
to be a los<strong>in</strong>g game. Comb<strong>in</strong>ed offshore and onshore<br />
conventional gas production lost 4,056 Bcf (<strong>in</strong>clud<strong>in</strong>g<br />
the impact of the 2005 hurricanes) while unconventional<br />
gas production from coalbed methane, tight sands and<br />
shales <strong>in</strong>creased by 3,471 Bcf. Growth <strong>in</strong> gas production<br />
from the Barnett shale <strong>in</strong> the Ft. Worth Bas<strong>in</strong> plus<br />
coalbed methane and tight sands <strong>in</strong> Rocky Mounta<strong>in</strong><br />
bas<strong>in</strong>s did not offset all of the decl<strong>in</strong>e <strong>in</strong> conventional<br />
gas but it saved the day for U.S. gas consumers.<br />
U.S. gas well productivity, however, was decreas<strong>in</strong>g as<br />
average peak well production dropped from 1,324 Mcfd<br />
<strong>in</strong> 1997 to 678 Mcfd per well <strong>in</strong> 2006. As a result, <strong>in</strong>dustry<br />
had to drill more gas wells each year just to replace<br />
production. Shortages of skilled manpower arose and<br />
costs <strong>in</strong>creased 65% dur<strong>in</strong>g 2005 and 2006 as <strong>in</strong>dustry<br />
pressed to drill more wells. Moreover, community <strong>in</strong>terests<br />
and environmental advocates pressed to curtail the<br />
expansion of unconventional gas drill<strong>in</strong>g. Despite these<br />
challenges, U.S. gas production reached 17,638 Bcf for<br />
the year – the largest volume s<strong>in</strong>ce 2001. Nevertheless, a<br />
paradox emerged as planners and policy makers looked<br />
for alternate sources of gas supplies and tapped LNG<br />
imports as the solution to meet future U.S. natural gas<br />
demand. Permits for LNG regassification facilities were<br />
put on a fast track and projects were launched with the<br />
objective to accommodate as much as 9 Bcfd <strong>in</strong> LNG<br />
imports dur<strong>in</strong>g 2009 and as much as 20 Bcfd by 2020.<br />
Insights on key E&P trends that are embedded <strong>in</strong> the<br />
2006 data <strong>in</strong> this publication are summarized below:<br />
The behavior of natural gas prices was more surpris<strong>in</strong>g.<br />
The January 3, 2006 U.S. natural gas spot price<br />
was $10.63 per Mcf, some 84% higher than the price on<br />
January 3, 2005 and the EIA forecast that Henry Hub<br />
gas would average about $9.50 per Mcf for the year.<br />
The weather and a demand slump <strong>in</strong> response to four<br />
months of double digit gas prices, though, helped to pa<strong>in</strong>t<br />
a different picture. Mild mid-w<strong>in</strong>ter weather curtailed<br />
gas demand for heat<strong>in</strong>g and drove seasonal gas storage<br />
volumes from a scant 6% above average level at yearend<br />
2005 to almost 48% above average by mid-February<br />
2006. Correspond<strong>in</strong>gly, by March 1 the Henry Hub spot<br />
gas price dropped to $6.73 per Mcf – a 37% decl<strong>in</strong>e from<br />
the first of the year. The gas storage surplus prevailed<br />
for most of the year and natural gas spot price averaged<br />
$6.91 dur<strong>in</strong>g 2006, off $2.06 or 23% from 2005.<br />
Natural <strong>Gas</strong> Play Highlights:<br />
Even though gas prices slumped dur<strong>in</strong>g the first quarter,<br />
<strong>in</strong>dependent operators cont<strong>in</strong>ued to expand their<br />
assessments of unconventional gas plays throughout<br />
2006. Significant <strong>in</strong>dustry developments <strong>in</strong>volved the<br />
expanded quest to test the potential of shale source<br />
rocks throughout the U.S. Importantly, breakthroughs<br />
<strong>in</strong> staged hydraulic fracs and horizontal well completions<br />
that were pioneered <strong>in</strong> the Barnett shale helped<br />
to establish several important new shale gas plays.<br />
Southwestern <strong>Energy</strong> drove the successful expansion<br />
of the Fayetteville shale <strong>in</strong> the Arkoma Bas<strong>in</strong><br />
of Arkansas and achieved <strong>in</strong>itial production rates<br />
<strong>in</strong> excess of 2 MMcfd from its horizontal wells.<br />
THE YEAR IN REVIEW<br />
COMPILED BY <strong>IPAA</strong> FEBRUARY 2009 AMERICA’S INDEPENDENT 3
THE YEAR IN REVIEW: INTRODUCTION TO 2006 O&G IN YOUR STATE<br />
THE YEAR IN REVIEW<br />
Newfield Exploration Company expanded its Woodford<br />
shale play <strong>in</strong> southeast Oklahoma and found that reduc<strong>in</strong>g<br />
frac <strong>in</strong>tervals to 500 feet or less generated the<br />
same ultimate gas recoveries as achieved from 1,000<br />
ft. frac stages <strong>in</strong> earlier wells. Other <strong>in</strong>dependent operators<br />
expanded the Woodford play <strong>in</strong>to the Ardmore<br />
Bas<strong>in</strong> of southern Oklahoma. Also <strong>in</strong> the mid-cont<strong>in</strong>ent<br />
region, operators tested the Caney shale <strong>in</strong> Oklahoma<br />
and the Bend shale <strong>in</strong> the Palo Duro Bas<strong>in</strong>. In the Permian<br />
Bas<strong>in</strong>, thick Woodford and Barnett shales attracted<br />
substantial <strong>in</strong>dustry <strong>in</strong>terest but economic success was<br />
not demonstrated before the end of the year. Independents<br />
also tested the Mississippian Floyd shale and<br />
Cambrian Conasauga shale <strong>in</strong> the Black Warrior Bas<strong>in</strong>,<br />
Devonian shales <strong>in</strong> the Appalachian Bas<strong>in</strong> and Delta<br />
Petroleum Corp. announced promis<strong>in</strong>g tests of Pennsylvanian<br />
Paradox shales <strong>in</strong> the Paradox Bas<strong>in</strong> of Utah.<br />
Operators also leveraged improved well completion<br />
technologies to <strong>in</strong>crease the harvest of <strong>in</strong>-place gas by<br />
downspac<strong>in</strong>g <strong>in</strong> established tight sand plays. Noteworthy<br />
were the Bossier and Cotton Valley plays <strong>in</strong> East Texas,<br />
Cretaceous Mesaverde sand plays <strong>in</strong> the Piceance,<br />
U<strong>in</strong>ta and Green River Bas<strong>in</strong>s. Also <strong>in</strong> the Green River<br />
Bas<strong>in</strong>, operators moved to 20 and 10 acre spac<strong>in</strong>g <strong>in</strong><br />
the prolific Lance formation of the P<strong>in</strong>edale Anticl<strong>in</strong>e with<br />
estimated 20 Tcf recoverable gas and at the Jonah field<br />
with estimated 7 to 10 Tcf recoverable gas. Increased<br />
well densities, though, prompted objections from environmental<br />
groups and community <strong>in</strong>terests. To address<br />
the issues, stakeholders were organized to stimulate<br />
collaborative communications and operators responded<br />
by reduc<strong>in</strong>g the environmental footpr<strong>in</strong>t by drill<strong>in</strong>g from<br />
pads, <strong>in</strong>stall<strong>in</strong>g water treatment and pipe systems, rapid<br />
restoration of disturbed surface areas, adjust<strong>in</strong>g operations<br />
to wildlife migrations and so forth. Such actions<br />
reduced the number of legal actions and allowed<br />
operators to spend more time on field operations.<br />
<strong>Gas</strong> Drill<strong>in</strong>g and Production:<br />
Dur<strong>in</strong>g 2006, U.S. natural gas well completions <strong>in</strong>creased<br />
by 13% to 30,642 wells. <strong>State</strong> level drill<strong>in</strong>g<br />
statistics tend to be too coarse to reflect the emergence<br />
of new plays but some are <strong>in</strong>dicative as <strong>in</strong> the follow<strong>in</strong>g<br />
table show<strong>in</strong>g the number of gas well completions<br />
for 2005 and 2006 with the <strong>in</strong>dicated % change:<br />
<strong>State</strong> 2005 2006 % Change Key Play<br />
AR 277 395 43% Fayetteville shale<br />
KS 851 1,215 43% Cherokee CBM<br />
PA 2,614 3,247 24% Devonian shale<br />
UT 445 649 46% Cretaceous tight sands<br />
The <strong>in</strong>creas<strong>in</strong>g value of horizontal wells to enable<br />
commercial production from certa<strong>in</strong> unconventional<br />
coalbed methane and shale reservoirs is reflected <strong>in</strong><br />
the dramatic 71% <strong>in</strong>crease <strong>in</strong> horizontal completions<br />
from 2004 through 2006. The Fayetteville play drove<br />
Arkansas horizontal drill<strong>in</strong>g from four wells dur<strong>in</strong>g<br />
2004 to 107 dur<strong>in</strong>g 2006. Oklahoma horizontal wells<br />
<strong>in</strong>creased by 381 wells dur<strong>in</strong>g 2004 to 699 wells dur<strong>in</strong>g<br />
2006 with much of the <strong>in</strong>crease <strong>in</strong> Woodford shale,<br />
Hartshorne coalbed methane and Granite Wash gas<br />
plays. The Barnett shale play drove most of the <strong>in</strong>crease<br />
<strong>in</strong> Texas horizontal wells which <strong>in</strong>creased from<br />
1,250 wells dur<strong>in</strong>g 2004 to 2,200 wells dur<strong>in</strong>g 2006.<br />
Coalbed methane plays added 557 Bcf of production<br />
– 16% of the production growth from unconventional<br />
reservoirs – from 1997 through 2006 but the rate<br />
of production growth and new drill<strong>in</strong>g slowed dur<strong>in</strong>g<br />
2006. Coalbed methane drill<strong>in</strong>g only grew by 44 wells<br />
to 6,710 total wells dur<strong>in</strong>g 2006. Drill<strong>in</strong>g <strong>in</strong>creases<br />
<strong>in</strong> the Cherokee coals of southeastern Kansas and<br />
Pennsylvanian coals <strong>in</strong> Virg<strong>in</strong>ia were offset by decreased<br />
drill<strong>in</strong>g <strong>in</strong> Powder River Bas<strong>in</strong> coalbed methane<br />
plays. As a result, U.S. coalbed methane production<br />
added only 62 Bcf to reach 1,662 Bcf dur<strong>in</strong>g 2006.<br />
Thanks <strong>in</strong> large part to the growth of onshore unconventional<br />
plays, U.S. natural gas production recovered<br />
from the hurricane impacts and added 387.2 Bcf to reach<br />
17,638 Bcf for the year – the most s<strong>in</strong>ce 2001. <strong>Gas</strong> production<br />
<strong>in</strong> Texas (+327 Bcf), Wyom<strong>in</strong>g (+109 bcf), Colorado<br />
(+97.3 Bcf), Oklahoma (+71 Bcf) and Utah (+40 Bcf) –<br />
mostly from unconventional gas plays – more than offset<br />
the decrease of 219 Bcf from Federal Offshore production.<br />
<strong>Oil</strong> Play Highlights:<br />
Two significant oil plays – Chevron’s Jack 2 test <strong>in</strong> the<br />
deepwater offshore Gulf of Mexico and the evolv<strong>in</strong>g<br />
Devonian Bakken shale oil play <strong>in</strong> the Williston Bas<strong>in</strong><br />
– dom<strong>in</strong>ated U.S. oil E&P news dur<strong>in</strong>g 2006. The<br />
Jack 2 well, a 28,500 ft. well <strong>in</strong> about 7,000 ft. of water<br />
<strong>in</strong> Walker Ridge Block 758, yielded the first successful<br />
production test of the pre-salt Lower Tertiary Wilcox<br />
reservoir. This was good news to operators of eleven<br />
other <strong>in</strong>dicated ultra-deepwater discoveries <strong>in</strong> this play.<br />
The test flowed 6,000 bopd from about 40% of the<br />
measured reservoir. Chevron and partners <strong>in</strong>dicated this<br />
test could be the key to unlock 3 to 13 billion barrels of<br />
recoverable oil from the Wilcox ultra-deepwater trend.<br />
Expansion of the Bakken shale play <strong>in</strong>to Mountrail<br />
County, ND established two sweet spots at the Parshall<br />
and Sanish fields and identified a new north – south<br />
fairway east of the Nesson Anticl<strong>in</strong>e that could boost<br />
the play <strong>in</strong>to the giant category. Horizontal wells and<br />
staged hydraulic frac technologies have unlocked the<br />
potential of the Bakken shale. As the potential of the<br />
new Bakken trend was realized the number of horizontal<br />
wells <strong>in</strong> North Dakota jumped from 150 wells dur<strong>in</strong>g<br />
2004 to 375 wells dur<strong>in</strong>g 2006. Correspond<strong>in</strong>gly, oil<br />
production <strong>in</strong> North Dakota grew from 30,142 Mb dur<strong>in</strong>g<br />
2004 to 36,763 Mb dur<strong>in</strong>g 2006. Independents EOG<br />
Resources Inc. and Whit<strong>in</strong>g <strong>Oil</strong> and <strong>Gas</strong> Corp. led the<br />
development <strong>in</strong> this important new Bakken oil play.<br />
4 AMERICA’S INDEPENDENT COMPILED BY <strong>IPAA</strong> FEBRUARY 2009
THE YEAR IN REVIEW: INTRODUCTION TO 2006 O&G IN YOUR STATE<br />
<strong>Oil</strong> Drill<strong>in</strong>g and Production:<br />
Driven by higher oil prices, U.S. operators <strong>in</strong>creased oil<br />
well completions dur<strong>in</strong>g 2006 by 21% to 13,278 wells.<br />
Increased activity <strong>in</strong> traditional oil produc<strong>in</strong>g trends <strong>in</strong><br />
Texas, Oklahoma and Kansas accounted for most of the<br />
ga<strong>in</strong>s while the expand<strong>in</strong>g Bakken play <strong>in</strong> North Dakota<br />
added 140 of the total 2,349 well <strong>in</strong>crease from 2005.<br />
At the close of 2006 the U.S. recorded 403,887 produc<strong>in</strong>g<br />
oil wells which produced 1,661.9 MMbo dur<strong>in</strong>g the<br />
year. Marg<strong>in</strong>al oil wells cont<strong>in</strong>ued to play a valuable role.<br />
The 355,794 marg<strong>in</strong>al oil wells generated 360.7 MMbo or<br />
22% of U.S. oil production dur<strong>in</strong>g the year. Overall 2006<br />
crude oil production dropped by 38.9 MMb to 1,661.9<br />
MMb. Alaska reported the largest decl<strong>in</strong>e of 66.5 MMb<br />
from 2005 to 269.2 MMb dur<strong>in</strong>g 2006. Even though U.S.<br />
crude oil production decreased by 107 Mb/d (2%) crude<br />
oil imports essentially rema<strong>in</strong>ed flat at 10,118 Mb/d.<br />
Conclud<strong>in</strong>g Comments:<br />
The U.S. exploration and production bus<strong>in</strong>ess demonstrated<br />
great resiliency dur<strong>in</strong>g 2006. Even though<br />
oil and gas prices slumped and substantial resources<br />
were <strong>in</strong>vested to rebuild offshore oil and gas production<br />
capacity, the <strong>in</strong>dustry managed to boost gas production<br />
by more than 2% to 17.638 Bcf, the largest volume s<strong>in</strong>ce<br />
2001. Independent operators led the onshore <strong>in</strong>dustry<br />
and demonstrated the capability to boost commercial<br />
gas production from unconventional reservoirs <strong>in</strong>clud<strong>in</strong>g<br />
gas from shales. They also demonstrated that they<br />
could produce significant amounts of oil from the Bakken<br />
shale. These developments made a positive statement<br />
about the <strong>in</strong>dustry’s capabilities to make a substantial<br />
contribution to U.S. energy security objectives.<br />
THE YEAR IN REVIEW<br />
COMPILED BY <strong>IPAA</strong> FEBRUARY 2009 AMERICA’S INDEPENDENT 5
NEW LOOK FOR OUR PUBLICATION<br />
The <strong>IPAA</strong> Statistics Department would like to recognize our<br />
cont<strong>in</strong>ue collaboration with IHS for this publication. In an effort to<br />
enhance the data quality and broaden our sources, <strong>IPAA</strong> welcomes<br />
the wide-rang<strong>in</strong>g and professional <strong>in</strong>put provided by IHS.<br />
<strong>IPAA</strong> cont<strong>in</strong>ues its efforts to enhance the scope and quality of state<br />
and national data that will make this publication more valuable for<br />
those <strong>in</strong> <strong>in</strong>dustry, government, academia, f<strong>in</strong>ance, and other stakeholder<br />
groups. IHS has helped expand data <strong>in</strong> new areas such as<br />
unconventional oil and natural gas production, permit and operator<br />
data, horizontal drill<strong>in</strong>g figures and marg<strong>in</strong>al production by state.<br />
We will cont<strong>in</strong>ue to expand our <strong>in</strong>dustry perspective and endeavor<br />
to provide readers with more detailed analysis on <strong>in</strong>dustry trends by<br />
nation and play-type <strong>in</strong> addition to more comprehensive state data.<br />
In the 2007-2008 issue we have added several resources at<br />
the beg<strong>in</strong>n<strong>in</strong>g of the publication that provide resource l<strong>in</strong>ks for<br />
state education programs, Young Professional chapters and<br />
oil and gas museums. This section follows <strong>IPAA</strong>’s broad efforts<br />
to expand its Education Center <strong>in</strong> Houston, TX and work<br />
with more energy education groups around the country. In the<br />
future, more issues of the publication will be pr<strong>in</strong>ted for distribution<br />
to educators <strong>in</strong> schools around the country so teachers and<br />
students will better understand the important role played by the<br />
E&P <strong>in</strong>dustry <strong>in</strong> provid<strong>in</strong>g jobs and energy to our country.<br />
We appreciate the assistance of IHS <strong>in</strong> improv<strong>in</strong>g both the<br />
scope and quality of this upstream publication. Please let us<br />
know if you have ideas perta<strong>in</strong><strong>in</strong>g to other ways we can improve.<br />
You can send your comments to Fred Lawrence at<br />
<strong>IPAA</strong> (fl awrence@ipaa.org). Thank you for your cont<strong>in</strong>ued support<br />
of one of the <strong>in</strong>dustry’s most <strong>in</strong>formative publications.<br />
METHODOLOGY<br />
• IHS uses multiple sources of data such as test files (Texas<br />
and Louisiana test <strong>in</strong>formation is used to allocate production<br />
volumes on a well completion level), <strong>in</strong>jection files and plugg<strong>in</strong>g<br />
reports that is <strong>in</strong>tegrated with basic production volume data that<br />
is submitted by <strong>in</strong>dividual states. As a result production totals<br />
may differ from the <strong>Energy</strong> Information Adm<strong>in</strong>istration data.<br />
• IHS production data is used on state pages <strong>in</strong>cludes<br />
peak production, average production, average output per<br />
well, coalbed methane, heavy oil and marg<strong>in</strong>al wells.<br />
• EIA production data is used for determ<strong>in</strong><strong>in</strong>g wellhead value<br />
of production, cumulative crude oil wellhead value, state<br />
production rank<strong>in</strong>gs, and natural gas marketed production. All<br />
price data from EIA or states. <strong>State</strong> reserve data is from EIA.<br />
• All Federal Offshore statistics <strong>in</strong>clude only those<br />
wells <strong>in</strong> Federal waters. All state well statistics<br />
<strong>in</strong>clude those offshore wells for each state.<br />
• Deepest Well statistics are based on total depth recorded<br />
from state completion reports. The only exceptions are<br />
m<strong>in</strong>or occurrences where projected depth from permits<br />
have been used as a proxy for Deepest Well statistics.<br />
• Well statistics for oil, gas and dry wells are all classes that were<br />
drilled with the <strong>in</strong>tent to fi nd hydrocarbons. Historical well counts<br />
do not <strong>in</strong>clude any miscellaneous wells ie <strong>in</strong>jection, storage, etc.<br />
• Drilled footage is the actual drilled footage as reported. For<br />
sidetracks it is the footage from the whipstock or kickoff<br />
po<strong>in</strong>t to total depth. For wells deepened it is the footage<br />
from the orig<strong>in</strong>al total depth to the new total depth.<br />
• Marg<strong>in</strong>al wells are defi ned as oil wells produc<strong>in</strong>g 15 or less<br />
barrels of oil and 90 or less thousand cubic feet of gas<br />
per day (previous editions used stripper wells produc<strong>in</strong>g<br />
less than 10 bbls of oil and 60 Mcf of gas per day).<br />
6 AMERICA’S INDEPENDENT COMPILED BY <strong>IPAA</strong> FEBRUARY 2009
STATE ENERGY CONTACTS<br />
Alabama <strong>State</strong> <strong>Oil</strong> & <strong>Gas</strong> Board<br />
420 Hackberry Lane/P.O. Box 869999<br />
Tuscaloosa, AL 35486-6999<br />
(205) 349-2852<br />
(205) 349-2861 Fax<br />
http://www.ogb.state.al.us<br />
Alaska Department of Natural<br />
Resources<br />
Division of <strong>Oil</strong> & <strong>Gas</strong><br />
550 West 7th Ave., Suite 800<br />
Anchorage, AK 99501-3560<br />
(907) 269-8800<br />
http://www.dog.dnr.state.ak.us/oil/<strong>in</strong>dex.<br />
htm<br />
Alaska <strong>Oil</strong> & <strong>Gas</strong> Conservation<br />
Commission<br />
3001 Porcup<strong>in</strong>e Drive<br />
Anchorage, AK 99501-3192<br />
(907) 279-1433<br />
http://www.state.ak.us/local/akpages/<br />
ADMIN/ogc/homeogc.htm<br />
Arizona Geological Survey<br />
P.O. Box 40952<br />
Tucson, AZ 85717<br />
(502) 770-3500<br />
http://arizonageologicalsoc.org<br />
Arkansas <strong>Oil</strong> & <strong>Gas</strong> Commission<br />
2215 West Hillsboro<br />
El Dorado, AR 71730<br />
(870) 862-4965<br />
(870) 862-8823 Fax<br />
http://www.aogc.state.ar.us/<br />
California Department of<br />
Conservation<br />
Division of <strong>Oil</strong> & <strong>Gas</strong><br />
801 K Street, MS 20-20<br />
Sacramento, CA 95814<br />
(916) 445-9686<br />
(916) 323-0424 Fax<br />
http://www.consrv.ca.gov/<strong>in</strong>dex/<br />
Colorado <strong>Oil</strong> & <strong>Gas</strong> Conservation<br />
Commission<br />
1120 L<strong>in</strong>coln St., Suite 801<br />
Denver, CO 80203<br />
(303) 894-2100<br />
(303) 894-2109 Fax<br />
http://oil-gas.state.co.us/<br />
Florida Bureau of Geology<br />
Division of Resource Management<br />
903 West Tennessee Street<br />
Tallahasee, FL 32304<br />
(904) 488-4191<br />
Ill<strong>in</strong>ois Department of Natural<br />
Resources<br />
<strong>Oil</strong> and <strong>Gas</strong> Division<br />
One Natural Resources Way<br />
Spr<strong>in</strong>gfield, IL 62702-1271<br />
(217) 782-6302<br />
http://www.dnr.state.il.us/m<strong>in</strong>es/<strong>in</strong>dex.htm<br />
Indiana Department of Natural<br />
Resources<br />
<strong>Oil</strong> and <strong>Gas</strong> Division<br />
402 W. Wash<strong>in</strong>gton St., Room 293<br />
Indianapolis, IN 46204<br />
(317) 232-4055<br />
(317) 232-1550 Fax<br />
http://www.<strong>in</strong>.gov/dnr/dnroil/<br />
Interstate <strong>Oil</strong> and <strong>Gas</strong> Compact<br />
Commission<br />
P.O. Box 53127<br />
Oklahoma City, OK 73152-3127<br />
(405) 525-3596<br />
(405) 525-3592 Fax<br />
http://www.iogcc.state.ok.us<br />
Kansas Corporation Commission<br />
F<strong>in</strong>ney St. Office Build<strong>in</strong>g<br />
130 South Market, Room 2078<br />
Wichita, KS 67202-3802<br />
(316) 337-6211<br />
http://kcc.state.ks.us<br />
Kentucky Department of M<strong>in</strong>es and<br />
M<strong>in</strong>erals<br />
<strong>Oil</strong> and <strong>Gas</strong> Division<br />
1025 Capital Center Dr.<br />
Frankfurt, KY 40601<br />
(502) 573-0147<br />
http://dogc.ky.gov/<br />
Louisiana Department of Natural<br />
Resources<br />
P.O. Box 94275/617 North Third Street<br />
Baton Rouge, LA 70804-9275<br />
(225) 342-5515<br />
http://www.dnr.state.la.us<br />
Maryland Geological Survey<br />
2300 Sa<strong>in</strong>t Paul Street<br />
Baltimore, MD 21218-5210<br />
(401) 554-5500<br />
http://www.mgs.md.gov/<br />
Michigan Geological Survey<br />
Department of Natural Resources<br />
P.O. Box 30028<br />
Lans<strong>in</strong>g, MI 48909<br />
(517) 373-2352<br />
http://www.michigan.gov/dnr<br />
Mississippi <strong>State</strong> <strong>Oil</strong> and <strong>Gas</strong> Board<br />
500 Greymont, Suite E<br />
Jackson, MS 39202-3446<br />
(601) 354-7142<br />
(601) 354-6873 Fax<br />
http://www.ogb.state.ms.us<br />
Missouri Department of Natural<br />
Resources<br />
P.O. Box 176<br />
Jefferson City, MO 65102<br />
(800) 361-4827<br />
http://www.dnr.mo.gov/<br />
Montana Board of <strong>Oil</strong> and <strong>Gas</strong><br />
Conservation<br />
2535 St. John’s Avenue<br />
Bill<strong>in</strong>gs, MT 59102<br />
(406) 656-0040<br />
(406) 655-6015<br />
http://bogc.dnrc.state.mt.us<br />
Nebraska <strong>Oil</strong> & <strong>Gas</strong> Conservation<br />
Commission<br />
P.O. Box 399<br />
Sidney, NE 69162<br />
(308) 254-6919<br />
http://www.nogcc.ne.gov/<br />
Nevada Department of M<strong>in</strong>erals<br />
400 West K<strong>in</strong>g Street, Suite 106<br />
Carson City, NV 89703<br />
(702) 684-7040<br />
(702) 684-7052 Fax<br />
http://m<strong>in</strong>erals.state.nv.us/<br />
New Mexico <strong>Energy</strong>, M<strong>in</strong>erals and<br />
Natural Resources Department<br />
1220 S. St. Francis Drive<br />
Santa Fe, NM 87505<br />
(505) 476-3440<br />
(505) 476-3462 Fax<br />
http://www.emnrd.state.nm.us/<br />
New York <strong>State</strong> Department of<br />
Environmental Conservation<br />
625 Broadway<br />
Albany, NY 12233-6500<br />
(518) 402-8076<br />
(518) 402-8060 Fax<br />
http://www.dec.state.ny.us/website/dmn/<br />
New York <strong>State</strong> Geological Survey<br />
(NYSGS)<br />
3140 Cultural Education Center<br />
Albany, NY 12230<br />
(518) 474-5816<br />
Fax: (518) 486-2034<br />
www.nysm.nysed.gov/research/geology<br />
New York <strong>State</strong> <strong>Energy</strong> Research and<br />
Development Authority (NYSERDA)<br />
17 Columbia Circle<br />
Albany, NY 12203-6399<br />
(518) 862-1090, ext. 3303 or<br />
1-866-NYSERDA ext. 3303<br />
Fax: (518) 862-1091<br />
www.Get<strong>Energy</strong>Smart.org.North<br />
North Dakota Industrial Commission<br />
<strong>Oil</strong> and <strong>Gas</strong> Division<br />
600 East Boulevard Avenue, Dept. 405<br />
Bismark, ND 58505-0840<br />
(701) 328-8020<br />
(701) 328-8022<br />
http://www.oilgas.nd.gov<br />
STATE ENERGY CONTACTS<br />
COMPILED BY <strong>IPAA</strong> FEBRUARY 2009 AMERICA’S INDEPENDENT 7
STATE ENERGY CONTACTS AND FEDERAL ORGANIZATIONS<br />
STATE ENERGY CONTACTS AND FEDERAL ORGANIZATIONS<br />
Ohio Department of Natural<br />
Resources<br />
Division of M<strong>in</strong>eral Resources<br />
Management<br />
1855 Founta<strong>in</strong> Square Drive, Bldg. H-2<br />
Columbus, OH 43224-1362<br />
(614) 265-6633<br />
(614) 265-7999 Fax<br />
http://www.ohiodnr.com/m<strong>in</strong>eral/<strong>in</strong>dex.html<br />
Oklahoma Corporation Commission<br />
<strong>Oil</strong> and <strong>Gas</strong> Division<br />
P.O. Box 52000/2101 N. L<strong>in</strong>coln Blvd.<br />
Oklahoma City, OK 73152-2000<br />
(405) 521-2211<br />
http://www.occ.state.ok.us/<br />
Oregon Department of Geology and<br />
M<strong>in</strong>eral Industries<br />
800 NE Oregon St., #28, Room 965<br />
Portland, OR 97232<br />
(503) 731-4100<br />
(503) 731-4066 Fax<br />
http://www.oregongeology.com/sub/<br />
default.htm<br />
Pennsylvania Dept. of Environmental<br />
Resources<br />
<strong>Oil</strong> and <strong>Gas</strong> Division<br />
Rachel Carson St. Ofc Bldg., Box 8765<br />
Harrisburg, PA 17105-8765<br />
(717) 772-2199<br />
(717) 772-2291 Fax<br />
http://www.dep.state.pa.us/dep/deputate/m<strong>in</strong>res/<br />
oilgas/oilgas.htm<br />
South Dakota Dept. of Environment &<br />
Natural Resources<br />
523 E. Capitol - Joe Foss Bldg.<br />
Pierre, SD 57501<br />
(605) 773-3151<br />
(605) 773-6035 Fax<br />
http://www.state.sd.us/denr/denr.html<br />
Tennessee Dept. of Geology &<br />
Conservation<br />
<strong>Oil</strong> and <strong>Gas</strong> Board<br />
401 Church St., 13th Fl.<br />
Nashville, TN 37243<br />
(615) 532-0445<br />
http://www.state.tn.us/environment/<br />
Texas Railroad Commission<br />
Office of Information Services<br />
P.O. Drawer 12967<br />
Aust<strong>in</strong>, TX 78711-2967<br />
(512) 463-6887<br />
http://www.rrc.state.tx.us/<br />
Utah Department of Natural<br />
Resources<br />
1594 West North Temple/P.O. Box<br />
145801<br />
Salt Lake City, UT 84114-5801<br />
(801) 538-5277<br />
(801) 359-3940 Fax<br />
http://dogm.nr.state.ut.us/<br />
Virg<strong>in</strong>ia Division of <strong>Energy</strong><br />
Dept. of M<strong>in</strong>es, M<strong>in</strong>erals & <strong>Energy</strong><br />
PO Drawer 900<br />
Big Stone Gap, VA 24219<br />
(276) 523-8146<br />
http://www.mme.state.va.us/dgo/default.htm<br />
West Virg<strong>in</strong>ia Office of <strong>Oil</strong> & <strong>Gas</strong><br />
1356 Hansford St.<br />
Charleston, WV 25301<br />
(304) 558-6075<br />
(304) 558-6047 Fax<br />
http://www.wvdep.org/<br />
Wyom<strong>in</strong>g Dept. of Environmental<br />
Quality<br />
122 West 25th Street - Herscheler Bldg.<br />
Cheyenne, WY 82002<br />
(307) 777-7937<br />
(307) 777-7682 Fax<br />
http://deq.state.wy.us/<br />
Wyom<strong>in</strong>g <strong>Oil</strong> and <strong>Gas</strong> Conservation<br />
Commission<br />
Box 2640/777 West First Street<br />
Casper, WY 82602<br />
(307) 234-7147<br />
(307) 234-5306 Fax<br />
http://wogcc.state.wy.us/<br />
Federal Organizations<br />
<strong>Energy</strong> Information Adm<strong>in</strong>istration<br />
Forrestal Build<strong>in</strong>g - Room 1F-048<br />
1000 Independence Avenue, S.W.<br />
Wash<strong>in</strong>gton, D.C. 20585<br />
(202) 586-5000<br />
http://www.eia.doe.gov<br />
Federal <strong>Energy</strong> Regulatory<br />
Committee<br />
888 First St., NE, Room 2-A<br />
Wash<strong>in</strong>gton, D.C. 20426<br />
(866) 208-3372<br />
http://www.ferc.gov<br />
National Petroleum Technology<br />
Office<br />
One West Third St., Suite 1400<br />
Tulsa, OK 74103-3519<br />
(918) 699-2000<br />
(918) 699-2005 Fax<br />
http://www.npto.doe.gov<br />
U.S. Department of <strong>Energy</strong><br />
Fossil <strong>Energy</strong> Dept.<br />
1000 Independence Avenue, S.W.<br />
Wash<strong>in</strong>gton, D.C. 20585<br />
(202) 586-6503<br />
http://www.fe.doe.gov<br />
U.S. Department of <strong>Energy</strong><br />
Offi ce of Scientifi c and Technical<br />
Information<br />
P.O. Box 62<br />
Oak Ridge,TN 37831<br />
http://www.osti.gov/<br />
U.S. Dept. of the Interior - MMS<br />
Mail Stop 3000, P.O. Box 25165<br />
Denver, CO 80225<br />
(303) 231-3230<br />
http://www.doi.gov/ & http://www.mms.gov/<br />
U.S. Dept. of the Interior<br />
Bureau of Land Management<br />
1849 C Street NW, Rm. 5665<br />
Wash<strong>in</strong>gton DC 20240<br />
Phone: 202-208-3801<br />
Fax: 202-208-5242U.S.<br />
www.blm.gov<br />
Environmental Protection Agency<br />
Ariel Rios Bldg. 1200 Penn. Ave., N.W.,<br />
3213A<br />
Wash<strong>in</strong>gton, DC 20460<br />
(202) 260-2090<br />
http://www.epa.gov<br />
U.S. Geological Survey<br />
12201 Sunrise Valley Dr.<br />
Reston, VA 20192<br />
(703) 648-4000<br />
http://www.usgs.gov/<br />
8 AMERICA’S INDEPENDENT COMPILED BY <strong>IPAA</strong> FEBRUARY 2009
COOPERATING OIL & GAS ASSOCIATIONS<br />
American Association of Professional Landmen<br />
4100 Fossil Creek Blvd.<br />
Fort Worth, TX 76137-2791<br />
(817) 847-7700<br />
(817) 847-7704 Fax<br />
http://www.landman.org<br />
American Exploration & Production Council<br />
1350 Eye St., NW, Suite 510<br />
Wash<strong>in</strong>gton DC 20005<br />
(202) 652-2359<br />
http://www.axpc.us/<br />
Association of <strong>Energy</strong> Service Companies<br />
10200 Richmond Avenue<br />
Houston, TX 77042<br />
(713) 781-0758<br />
(713) 781-7542 Fax<br />
http://www.aesc.net<br />
California Independent Petroleum Association<br />
1112 I Street, Suite 350<br />
Sacramento, CA 95814<br />
(916) 447-1177<br />
(916) 447-1144 Fax<br />
http://www.cipa.org<br />
Independent <strong>Oil</strong> Producers’ Agency<br />
1228 N Street, Suite 26<br />
Sacramento, CA 95814<br />
(916) 442-7095<br />
(916) 442-5822 Fax<br />
Independent <strong>Oil</strong> Producers Assoc. Tri-<strong>State</strong><br />
2104 L<strong>in</strong>coln Avenue<br />
Evansville, IN 47714<br />
(812) 479-9451<br />
(812) 476-2569 Fax<br />
Independent Petroleum Assoc. of<br />
Mounta<strong>in</strong> <strong>State</strong>s<br />
518 17th Street, Suite 620<br />
Denver, CO 80202<br />
(303) 623-0987<br />
(303) 893-0709 Fax<br />
http://www.ipams.org<br />
Independent Petroleum Assoc. of New Mexico<br />
529 West San Francisco St./PO Box 576<br />
Santa Fe, NM 87504<br />
(505) 984-0128<br />
(505) 622-8996 Fax<br />
http://www.ipanm.org<br />
Michigan <strong>Oil</strong> & <strong>Gas</strong> Association<br />
124 West Allegan St., Suite 1610<br />
Lans<strong>in</strong>g, MI 48933<br />
(517) 487-1092<br />
(517) 487-0961 Fax<br />
http://www.michiganoilandgasassociation.org<br />
Mississippi Indep. Producers & Royalty Owners<br />
P.O. Box 13393<br />
Jackson, MS 39236<br />
(601) 362-0502<br />
(601) 362-5397 Fax<br />
http://www.mipro.ms<br />
Montana Petroleum Association<br />
601 Euclid Ave., P.O. Box 1186<br />
Helena, MT 59624-1186<br />
(406) 442-7582<br />
(406) 443-7291 Fax<br />
http://montanapetroleum.org<br />
National Association of Royalty Owners<br />
P.O. Box 5779<br />
Norman, OK 73070-5779<br />
(405) 573-2972<br />
http://www.naro-us.org<br />
Colorado <strong>Oil</strong> & <strong>Gas</strong> Association<br />
1776 L<strong>in</strong>coln Street, Suite 1008<br />
Denver, CO 80203<br />
(303) 861-0362<br />
(303) 861-0373 Fax<br />
http://www.coga.org<br />
East Texas Producers & Royalty Owners Assoc.<br />
P.O. Box 1700<br />
Kilgore, TX 75663<br />
(903) 984-8671<br />
(903) 984-1499 Fax<br />
Eastern Kansas <strong>Oil</strong> & <strong>Gas</strong> Association<br />
P.O. Box 355<br />
Chanute, KS 66720<br />
(620) 431-1020<br />
(620) 431-9325 Fax<br />
FL Independent Petroleum Producers Assoc.<br />
P.O. Box 230<br />
Pensacola, FL 32591<br />
(904) 434-6830<br />
(904) 434-6842 Fax<br />
Ill<strong>in</strong>ois <strong>Oil</strong> & <strong>Gas</strong> Association<br />
P.O. Box 788<br />
Mount Vernon, IL 62864<br />
(618) 242-2857<br />
(618) 242-3418 Fax<br />
http://www.ioga.com<br />
Independent <strong>Oil</strong> & <strong>Gas</strong> Association of NY<br />
5743 Walden Drive<br />
Lakeview, NY 14085<br />
(716) 627-4250<br />
(716) 627-4375 Fax<br />
http://iogany.org<br />
Independent <strong>Oil</strong> & <strong>Gas</strong> Assoc. of Pennsylvania<br />
Northridge Office Plaza II<br />
Wexford, PA 15090-7906<br />
(724) 933-7306<br />
(717) 933-7310 Fax<br />
Independent <strong>Oil</strong> & <strong>Gas</strong> Assoc. of West Virg<strong>in</strong>ia<br />
405 Capitol St., Suite 507<br />
Charleston, WV 25301<br />
(304) 344-9867<br />
(304) 344-5836 Fax<br />
http://www.iogawv.com/<br />
Indiana <strong>Oil</strong> & <strong>Gas</strong> Association<br />
Route 1, P.O. Box 197<br />
Bridgeport, IL 62417<br />
(618) 943-1010<br />
(618) 943-5301 Fax<br />
International Association of Geophysical<br />
Contractors<br />
2550 N. Loop, W, Suite 104<br />
Houston, TX 77092<br />
(713) 957-8080<br />
(713) 957-0008 Fax<br />
http://www.iagc.org<br />
Kansas Independent <strong>Oil</strong> & <strong>Gas</strong> Association<br />
105 S. Broadway, Suite 500<br />
Wichita, KS 67202-4262<br />
(316) 263-7297<br />
(316) 263-3021 Fax<br />
http://www.kioga.org<br />
Kentucky <strong>Oil</strong> & <strong>Gas</strong> Association<br />
#1-A Physicians Park<br />
Frankfort, KY 40601<br />
(502) 226-1955<br />
(502) 226-3626 Fax<br />
http://kyoilgas.org<br />
Liaison Committee of Cooperat<strong>in</strong>g <strong>Oil</strong> &<br />
<strong>Gas</strong> Associations<br />
P.O. Box 1143<br />
Graham, TX 76450<br />
(940) 549-5261<br />
(940) 549-4241 Fax<br />
Louisiana <strong>Oil</strong> & <strong>Gas</strong> Association<br />
P.O. Box 4069<br />
Baton Rouge, LA 70821-4069<br />
(800) 443-1433<br />
(225) 388-9561 Fax<br />
http://www.loga.la<br />
Louisiana Landowners Association<br />
P.O. Box 44121<br />
Baton Rouge, LA 70804-4121<br />
(504) 927-5619<br />
(504) 928-7339 Fax<br />
http://www.louisiana2000.com/LLA/<br />
National Stripper Well Association<br />
P.O. Box 18336<br />
Oklahoma City, OK 73154<br />
(405) 601-8002<br />
New Mexico <strong>Oil</strong> & <strong>Gas</strong> Association<br />
P. O. Box 1864, 500 Don <strong>Gas</strong>par<br />
Santa Fe, NM 87504-1864<br />
(505) 982-2568<br />
(505) 982-0811 Fax<br />
http://www.nmoga.org<br />
New York <strong>State</strong> <strong>Oil</strong> Producers Association<br />
37 Elm St., P.O. Box 364<br />
Eldred, PA 16731<br />
(814) 225-4659<br />
Northern Alliance of Independent Producers<br />
P.O. Box 2422<br />
Bismarck, ND 58502<br />
(701) 224-5037<br />
(701) 224-5038<br />
Ohio <strong>Oil</strong> & <strong>Gas</strong> Association<br />
P.O. Box 535/1718 Columbus Rd., SW<br />
Granville, OH 43023-0535<br />
(740) 587-0444<br />
(740) 587-0446 Fax<br />
http://www.ooga.org<br />
Oklahoma Independent Petroleum Association<br />
3555 Northwest 58th St., Suite 400<br />
Oklahoma City, OK 73112<br />
(405) 942-2334<br />
(405) 942-4636 Fax<br />
http://www.oipa.com<br />
Panhandle Producers & Royalty Owners Assoc.<br />
3131 Bell #209<br />
Amarillo, TX 79106<br />
(806) 352-5637<br />
(806) 359-1274 Fax<br />
http://www.pproa.org<br />
COMPILED BY <strong>IPAA</strong> FEBRUARY 2009 AMERICA’S INDEPENDENT 9<br />
COOPERATING OIL & GAS ASSOCIATIONS
COOPERATING OIL & GAS ASSOCIATIONS<br />
COOPERATING OIL & GAS ASSOCIATIONS<br />
Pennsylvania <strong>Oil</strong> & <strong>Gas</strong> Association<br />
106 Locust Grove Rd./P.O. Box 349<br />
Ba<strong>in</strong>bridge, PA 17405<br />
(717) 426-0067<br />
(717) 426-3010 Fax<br />
Permian Bas<strong>in</strong> Petroleum Association<br />
P.O. Box 132/415 W. Wall, 1st Floor<br />
Midland, TX 79701<br />
(432) 684-6345<br />
(432) 684-7836 Fax<br />
http://www.pbpa.<strong>in</strong>fo/<br />
Petroleum Association of Wyom<strong>in</strong>g<br />
951 Werner Court, Suite 100<br />
Casper, WY 82601<br />
(307) 234-5333<br />
http://www.pawyo.org<br />
Petroleum Equipment Suppliers Association<br />
9225 Katy Freeway, Suite 310<br />
Houston, TX 77024<br />
(713) 932-0168<br />
(713) 932-0497 Fax<br />
http://www.pesa.org/<br />
Petroleum Technology Transfer Council<br />
16010 Barkers Po<strong>in</strong>t Lane, Suite 220<br />
Houston, Texas 77079<br />
(888) THE-PTTC/(281) 921-1720<br />
(281) 921-1723 Fax<br />
http://www.pttc.org<br />
Society of Indep. Professional Earth Scientists<br />
4925 Greenville Avenue, Suite 1106<br />
Dallas, TX 75206<br />
(214) 363-1780<br />
(214) 363-8195 Fax<br />
http://www.sipes.org<br />
Tennessee <strong>Oil</strong> & <strong>Gas</strong> Association<br />
750 Old Hickory Blvd., #285<br />
Brentwood, TN 37027<br />
(615) 263-1291<br />
(615) 263-1282 Fax<br />
http://www.tennoil.com<br />
Texas Alliance of <strong>Energy</strong> Producers<br />
726 Scott Ave., Ste. 500<br />
Wichita Falls, TX 76301<br />
(800) 299-2998<br />
(940) 723-4132 Fax<br />
http://www.texasalliance.org<br />
Texas Independent Producers & Royalty<br />
Owners Association<br />
515 Congress Avenue, Suite 910<br />
Aust<strong>in</strong>, TX 78701<br />
(512) 477-4452<br />
(512) 476-8070 Fax<br />
http://www.tipro.org<br />
Virg<strong>in</strong>ia <strong>Oil</strong> & <strong>Gas</strong> Association<br />
1007 East Watauga Ave.<br />
Johnson City, TN 37601<br />
(423) 926-2536<br />
(423) 378-1723 Fax<br />
Wyom<strong>in</strong>g Independent Producers Association<br />
P.O. Box 2325<br />
Gillette, WY 82717-2325<br />
(307) 686-1081<br />
(307) 686-0560 Fax<br />
http://www.energyconnect.com/wipa<br />
Network<strong>in</strong>g Associations<br />
Alaska <strong>Oil</strong> & <strong>Gas</strong> Association<br />
121 W. Fireweed, Suite 207<br />
Anchorage, AK 99503<br />
(907) 272-1481<br />
(907) 279-8114 Fax<br />
http://www.aoga.org<br />
American Association of Petroleum Geologists<br />
1444 S. Boulder Ave./ P.O. Box 979<br />
Tulsa, OK 74101<br />
(800) 364-2274<br />
(981) 560-2694<br />
http://www.aapg.org<br />
American Petroleum Institute<br />
1220 L St. NW<br />
Wash<strong>in</strong>gton, DC 20005-4070<br />
(202) 682-8000<br />
(202) 962-4776 Fax<br />
http://www.api.org<br />
Canadian Association of Petroleum Producers<br />
Suite 2100, 350 7th Avenue S.W.<br />
Calgary, Alberta<br />
Canada T2P 3N9<br />
(403) 267-1100<br />
(403) 261-4622 Fax<br />
http://www.capp.ca<br />
Ill<strong>in</strong>ois Petroleum Resources Board<br />
P.O. Box 491<br />
Mount Vernon, IL 62864<br />
(618) 242-2861<br />
(618) 242-3418 Fax<br />
International Association of<br />
Drill<strong>in</strong>g Contractors<br />
P.O. Box 4287/10370 Richmond Ave., Ste. 760<br />
Houston, TX 77210-4287/77042<br />
(713) 292-1945<br />
(713) 292-1946<br />
http://www.iadc.org<br />
Louisiana Mid-Cont<strong>in</strong>ent <strong>Oil</strong> & <strong>Gas</strong> Association<br />
801 North Blvd.<br />
Baton Rouge, LA 70802<br />
(225) 387-3205<br />
(225) 344-5502 Fax<br />
http://www.lmoga.com<br />
Mid-Cont<strong>in</strong>ent <strong>Oil</strong> & <strong>Gas</strong> Association of OK<br />
6701 N. Broadway, Suite 300<br />
Oklahoma City, OK 73116<br />
(405) 843-5741<br />
(405) 843-5746 Fax<br />
http://www.okmoga.com<br />
Nebraska Independent <strong>Oil</strong> & <strong>Gas</strong> Association<br />
P.O. Box 427<br />
Kimball, NE 69145<br />
(308) 235-2906<br />
(308) 235-2108 Fax<br />
North Dakota Petroleum Council<br />
120 N 3rd St., P.O. Box 1395<br />
Bismarck, ND 58502-1395<br />
(701) 223-6380<br />
(701) 222-0006 Fax<br />
http://www.ndoil.org<br />
Public Lands Advocacy<br />
1410 Grant St., Suite C-307<br />
Denver, CO 80203<br />
(303) 860-0212<br />
(303) 860-0310 Fax<br />
http://www.publiclandsadvocacy.org<br />
Society of Petroleum Eng<strong>in</strong>eers<br />
P.O. Box 833836/222 Palisades Creek Drive<br />
Richardson, TX 75083<br />
(800) 456-6863<br />
(972) 952-9435<br />
http://www.spe.org<br />
Southeastern Ohio <strong>Oil</strong> & <strong>Gas</strong> Association<br />
Rt. 1, Box 55-P<br />
Marietta, OH 45750<br />
(740) 374-3203<br />
(740) 374-2840 Fax<br />
http://www.sooga.org<br />
Southwest Kansas Royalty Owners Association<br />
209 East 6th, Box 250<br />
Hugoton, KS 67951<br />
(620) 544-4333<br />
(620) 544-2230 Fax<br />
http://www.swkroa.com<br />
Texas <strong>Oil</strong> & <strong>Gas</strong> Association<br />
304 W. 13th St.<br />
Aust<strong>in</strong>, TX 78701<br />
(512) 478-6631<br />
(512) 472-3859 Fax<br />
http://www.txoga.org<br />
Utah Petroleum Association<br />
533 West 2600 South, Suite 270<br />
Bountiful, UT 84010<br />
(801) 295-5399<br />
(801) 295-5477 Fax<br />
http://www.utahpetroleum.org<br />
Western <strong>State</strong>s Petroleum Association<br />
1415 L St., Ste. 600<br />
Sacramento, CA 95814<br />
(916) 444-9981<br />
http://www.wspa.org<br />
West Virg<strong>in</strong>ia <strong>Oil</strong> & Natural <strong>Gas</strong> Association<br />
P.O. Box 3231<br />
Charleston, WV 25332-3231<br />
(304) 343-1609<br />
http://www.wvonga.com<br />
American <strong>Oil</strong> & <strong>Gas</strong> Historical Society. For additional<br />
details, visit www.aoghs.org.<br />
10 AMERICA’S INDEPENDENT COMPILED BY <strong>IPAA</strong> FEBRUARY 2009
STATE EDUCATION PROGRAMS<br />
In 2006, <strong>IPAA</strong> launched its Education Center <strong>in</strong> Houston. The Education Center is dedicated to coord<strong>in</strong>at<strong>in</strong>g <strong>in</strong>itiatives <strong>in</strong> public<br />
education and workforce expansion. The center’s full-time director (Doris Richardson) is a former educator with over 15 years<br />
of public affairs experience both <strong>in</strong> the petroleum <strong>in</strong>dustry and private sector, and is chaired by Halliburton’s Galen Cobb. <strong>IPAA</strong><br />
cont<strong>in</strong>ues to expand upon its commitment to education outreach through a variety of <strong>in</strong>itiatives and programs <strong>in</strong>clud<strong>in</strong>g the<br />
Academy of Petroleum Exploration & Production Technology.<br />
S<strong>in</strong>ce 2007, <strong>IPAA</strong> Education Center Director, Doris Richardson has established two high school eng<strong>in</strong>eer<strong>in</strong>g & geosciences<br />
academies, plus one global energy management program with<strong>in</strong> the Houston Independent School District (HISD). HISD has<br />
committed to a total of fi ve <strong>IPAA</strong> sponsored academies; with 2 more open<strong>in</strong>g by fall 2010.<br />
For more <strong>in</strong>formation, please visit the <strong>IPAA</strong> Education Center onl<strong>in</strong>e at:<br />
http://www.ipaa.org/education/default.asp<br />
CONTACT INFORMATION FOR PARTICIPATING <strong>IPAA</strong><br />
HIGH SCHOOL ENERGY MAGNET SCHOOLS:<br />
UNIVERSITY ENERGY AND GEOLOGY PROGRAMS<br />
(NON AFFILIATED):<br />
California<br />
Global <strong>Energy</strong> Management Academy<br />
- Lamar High School – International<br />
Baccalaureate World School<br />
3325 Westheimer<br />
Houston, TX 77098-1099<br />
713-522-5960<br />
713-535-3769 Fax<br />
http://hs.houstonisd.org/lamarHS<br />
Academy of Petroleum E & P Technology -<br />
Milby High School<br />
1601 Broadway<br />
Houston, TX 77012-3789<br />
713-928-7401<br />
713-928-7474 Fax<br />
http://hs.houstonisd.org/milbyhs/<br />
Westside Eng<strong>in</strong>eer<strong>in</strong>g & Geosciences<br />
Academy<br />
14201 Briar Forest Dr.<br />
Houston, TX 77077-1806<br />
281-920-8000<br />
281-920-8059 Fax<br />
http://hs.houstonisd.org/westsideHS/<br />
Memorial High School<br />
935 Echo Lane<br />
Houston, TX 77024<br />
713-365-5110<br />
713-365-5138 Fax<br />
http://mhs.spr<strong>in</strong>gbranchisd.com/<br />
Western Hills International Baccalaureate<br />
High School<br />
3600 Boston Avenue<br />
Fort Worth, Texas 76116<br />
817-560-5600<br />
817-560-5644 Fax<br />
http://schools.fortworthisd.net/education/school<br />
Taft <strong>Oil</strong> Technology Academy<br />
701 7th Street<br />
Taft, CA 93268<br />
661.763.2300<br />
661.763.1445 Fax<br />
http://www.taft.k12.ca.us/programs/oil<br />
Alabama<br />
The University of Alabama<br />
Department of Geological Sciences-Geology<br />
Ernest Manc<strong>in</strong>i, Geology Professor<br />
Office: (205) 348-4319<br />
Fax: (205) 348-0818<br />
Email: faculty@geo.ua.edu<br />
Website: http://www.geo.ua.edu/<strong>in</strong>dex.php<br />
Alaska<br />
University of Alaska-Fairbanks<br />
College of Eng<strong>in</strong>eer<strong>in</strong>g and M<strong>in</strong>es-Geological<br />
Eng<strong>in</strong>eer<strong>in</strong>g<br />
Professor Gang Chen, Department Chair<br />
Office: (907) 474-7388<br />
Fax: (907) 474-6635<br />
Email: fym<strong>in</strong>ge@uaf.edu<br />
Website: http://www.alaska.edu/uaf/cem/ge/<br />
College of Eng<strong>in</strong>eer<strong>in</strong>g and M<strong>in</strong>es-Petroleum<br />
Eng<strong>in</strong>eer<strong>in</strong>g<br />
Professor Shirish Patil, Department Chair<br />
Office: (907) 474-7734<br />
Fax: (907) 474-5912<br />
Email: fyipete@uaf.edu<br />
Website: http://www.alaska.edu/uaf/cem/pete/<br />
Arkansas<br />
Arkansas Tech University<br />
Department of Physical Sciences-Geology<br />
Richard Cohoon, Dean and Professor of<br />
Geology<br />
Office: (479) 964-0816<br />
Fax: (479) 964-0837<br />
Email: rcohoon@atu.edu<br />
Website: http://pls.atu.edu/physci/geology<br />
University of Arkansas Community College<br />
at Morrilton<br />
Petroleum Technology Degree Program-<br />
Technical Certifi cate and A.A.S<br />
Jeff Lambert, Petroleum Technology Professor<br />
Office: (501) 977-2178<br />
Fax: (501) 977-2134<br />
Email: lambert@uaccm.edu<br />
Website: http://www.uaccm.edu/Academics/<br />
Academics.htm<br />
University of Southern California<br />
Viterbi School of Eng<strong>in</strong>eer<strong>in</strong>g-Petroleum<br />
Eng<strong>in</strong>eer<strong>in</strong>g<br />
Iraj Ershaghi, Ph.D., P.E., Program Director<br />
Offi ce: (213) 740-0322<br />
Fax: (213) 740-0324<br />
Email: peteng@usc.edu<br />
Website: http://www.usc.edu/dept/peteng/<br />
Stanford University<br />
Department of <strong>Energy</strong> Resources Eng<strong>in</strong>eer<strong>in</strong>g<br />
Louis Durlofsky, Chairman and Professor<br />
Offi ce: (650) 723-4142<br />
Fax: (650) 725-2099<br />
Email: lou@stanford.edu<br />
Website: http://pangea.stanford.edu/ERE/about/<br />
California <strong>State</strong> University, Long Beach<br />
Department of Geological Sciences-Petroleum<br />
Geology<br />
Stan F<strong>in</strong>ney, Department Chair<br />
Offi ce: (562) 985-8637<br />
Fax: (562) 985-8638<br />
Email: scfi nney@csulb.edu<br />
Website: http://www.cnsm.csulb.edu/<br />
departments/geology/programs/graduate/<br />
petroleumgeology.shtml<br />
California <strong>State</strong> University, Bakersfield<br />
Department of Geology-Petroleum Geology<br />
Dr. Dick Baron, Department Chair<br />
Offi ce: (661) 654-3044<br />
Fax: (661) 654-2040<br />
Email: dbaron@csub.edu<br />
Website: http://www.csub.edu/geology/<br />
Colorado<br />
Colorado School of M<strong>in</strong>es<br />
Department of Petroleum Eng<strong>in</strong>eer<strong>in</strong>g-<br />
Petroleum Eng<strong>in</strong>eer<strong>in</strong>g<br />
Dr. Craig W. Van Kirk, Department Head<br />
Offi ce: (303) 273-3740<br />
Fax: (303) 273-3189<br />
Email: cvankirk@m<strong>in</strong>es.edu<br />
Website: http://www.m<strong>in</strong>es.edu/academic/<br />
petroleum/<br />
STATE EDUCATION PROGRAMS<br />
COMPILED BY <strong>IPAA</strong> FEBRUARY 2009 AMERICA’S INDEPENDENT 11
STATE EDUCATION PROGRAMS<br />
STATE EDUCATION PROGRAMS<br />
Department of Geology and Geological<br />
Eng<strong>in</strong>eer<strong>in</strong>g-Petroleum Exploration and<br />
Development<br />
John D. Humphrey, Interim Department Head<br />
Offi ce: (303) 273-3819<br />
Fax: (303) 273-3859<br />
Email: juhumphre@m<strong>in</strong>es.edu<br />
Website: http://www.m<strong>in</strong>es.edu/academic/<br />
geology/<br />
Colorado Mounta<strong>in</strong> College<br />
Process Technology-Petroleum Technology<br />
(Certifi cate)<br />
John Prater, Associate Professor of <strong>Energy</strong><br />
Offi ce: (970) 625-6947<br />
Fax: (970) 625-6927<br />
Email: jprater@coloradomtn.edu<br />
Website: http://catalog.coloradomtn.edu/<br />
docs/0809/AAS_Cert_ProcessTech.pdf<br />
Mesa <strong>State</strong> College<br />
Department of Bus<strong>in</strong>ess-Landman/<strong>Energy</strong><br />
Management Concentration<br />
Dr. Morgan Bridge, Bus<strong>in</strong>ess Department<br />
Head<br />
Offi ce: (970) 248-1169<br />
Fax: (970) 248-1730<br />
Email: mbridge@mesastate.edu<br />
Website: https://www.mesastate.edu/schools/<br />
sbps/busadm/Index.htm<br />
Western <strong>State</strong> College<br />
Department of Bus<strong>in</strong>ess Adm<strong>in</strong>istration,<br />
Professional Land and Resource Management<br />
Ed Grauke, Director and Moncrief Chair<br />
Offi ce: (970) 943-2538<br />
Fax: (970) 943-7042<br />
Email: egrauke@western.edu<br />
Website: http://www.western.edu/bus<strong>in</strong>ess/<br />
PLRM.html<br />
Department of Geology-Petroleum Geology<br />
Ronald J. Hill, Moncrief Chair <strong>in</strong> Petroleum<br />
Geology<br />
Offi ce: (970) 943-2145<br />
Fax: (970) 943-7120<br />
Email: rhill@western.edu<br />
Website: http://www.western.edu/geology/<br />
program.html<br />
Colorado Northwestern Community College<br />
Process Technology-<strong>Oil</strong> and <strong>Gas</strong> Associates<br />
Degree<br />
Conrad Stanley, Program Director<br />
Offi ce: (970) 675-3375<br />
Fax: (970) 675-5046<br />
Email: Conrad.stanley@cncc.edu<br />
Website: http://www.cncc.edu/programs/<br />
process_technology/default.html<br />
Kansas<br />
The University of Kansas<br />
Department of Eng<strong>in</strong>eer<strong>in</strong>g-Petroleum<br />
Eng<strong>in</strong>eer<strong>in</strong>g<br />
Laurence R. Weatherley PhD, Department<br />
Chair<br />
Offi ce: (785) 864-3553<br />
Fax: (785) 864-4967<br />
Email: lweather@ku.edu<br />
Website: http://cpe.engr.ku.edu/petro/<br />
Fort Hays <strong>State</strong> University<br />
Department of Geosciences-Petroleum<br />
Geology<br />
Dr. Ken Neuhauser, Program Director<br />
Office: (785) 628-5349<br />
Department Fax: (785) 628-4096<br />
Email: kneuhaus@fhsu.edu<br />
Website: http://www.fhsu.edu/geo/geology/<br />
petroleumgeology.shtml<br />
Louisiana<br />
Louisiana <strong>State</strong> University<br />
Department of Petroleum Eng<strong>in</strong>eer<strong>in</strong>g-<br />
Petroleum Eng<strong>in</strong>eer<strong>in</strong>g<br />
Stephen O. Sears, Department Chair<br />
Office: (225) 578-6055<br />
Fax: (225) 578-6039<br />
Email: sosears@lsu.edu<br />
Website: http://www.pete.lsu.edu/<br />
University of Louisiana at Lafayette<br />
Management Department-Professional Land<br />
and Resource Management<br />
Dr. Steve Knouse, Department Head<br />
Office: (337) 482-6087<br />
Fax: (337) 482-5898<br />
Email: sbk4151@louisiana.edu<br />
Website: http://cobweb.louisiana.edu/New/<br />
academics/plrm_home.htm<br />
College of Eng<strong>in</strong>eer<strong>in</strong>g-Petroleum Eng<strong>in</strong>eer<strong>in</strong>g<br />
Ali Ghalambor, Ph.D., Department Head<br />
Office: (337) 482-5748<br />
Fax: (337) 482-6848<br />
Email: axq8302@louisiana.edu<br />
Website: http://petroleum.louisiana.edu/<strong>in</strong>dex.<br />
shtml<br />
Nicholls <strong>State</strong> University<br />
Department of Applied Sciences-Petroleum<br />
Technology<br />
Michael Gautreaux, Program Director<br />
Office: (985) 448-4740<br />
Fax: (985) 448-4475<br />
Email: michael.gautreaux@nicholls.edu<br />
Website: http://www.nicholls.edu/doas/degreeprograms/petroleum-services/<br />
Tulane University<br />
Freeman School of Bus<strong>in</strong>ess-<strong>Energy</strong><br />
Specialization (Certifi cate)<br />
Eric Smith, Associate Director of <strong>Energy</strong><br />
Institute<br />
Office: (504) 865-5031<br />
Fax: (504) 862-8327<br />
Email: esmith11@tulane.edu<br />
Website: http://www.freeman.tulane.edu/<br />
energy/about.htm<br />
Missouri<br />
University of Missouri-Rolla<br />
Department of Geological Sciences and<br />
Eng<strong>in</strong>eer<strong>in</strong>g-Petroleum Eng<strong>in</strong>eer<strong>in</strong>g<br />
Dr. Daopu T. Numbere, Program Head<br />
Office: (573) 341-4758<br />
Fax: (573) 341-6935<br />
Email: numbere@mst.edu<br />
Website: http://gse.mst.edu/<br />
academicprograms/petroleumeng<strong>in</strong>eer<strong>in</strong>g.html<br />
Montana<br />
Montana Tech-University of Montana<br />
School of M<strong>in</strong>es and Eng<strong>in</strong>eer<strong>in</strong>g-Petroleum<br />
Eng<strong>in</strong>eer<strong>in</strong>g<br />
Leo Heath, Department Head<br />
Offi ce: (406) 496-4507<br />
Fax: (406) 496-4417<br />
Email: lheath@mtech.edu<br />
Website: http://www.mtech.edu/m<strong>in</strong>es/pet_eng/<br />
New Mexico<br />
New Mexico Institute of M<strong>in</strong><strong>in</strong>g &<br />
Technology<br />
Department of Petroleum and Natural <strong>Gas</strong><br />
Eng<strong>in</strong>eer<strong>in</strong>g<br />
Her-Yuan Chen, Ph.D., Department Chair<br />
Offi ce: (575) 835-5743<br />
Fax: (575) 835-5210<br />
Email: her@nmt.edu<br />
Website: http://<strong>in</strong>fohost.nmt.edu/~petro/<strong>in</strong>dex.<br />
html<br />
North Dakota<br />
University of North Dakota<br />
Department of Geology and Geological<br />
Eng<strong>in</strong>eer<strong>in</strong>g-Geological Eng<strong>in</strong>eer<strong>in</strong>g<br />
William Gosnold, Department Chair<br />
Offi ce: (701) 777-2631<br />
Fax: (701) 777-4449<br />
Email: willgosnold@mail.und.nodak.edu<br />
Website: http://www.geology.und.edu/geoE_<br />
ugdegreedirectory.php<br />
Ohio<br />
Marietta College<br />
Department of Petroleum Eng<strong>in</strong>eer<strong>in</strong>g-<br />
Petroleum Eng<strong>in</strong>eer<strong>in</strong>g<br />
Dr. Robert Chase, Professor<br />
Offi ce: (740) 376-4776<br />
Fax: (740) 376-4777<br />
Email: chaser@marietta.edu<br />
Website: http://www.marietta.edu/~petr/<strong>in</strong>dex.<br />
html<br />
Oklahoma<br />
University of Oklahoma<br />
Price College of Bus<strong>in</strong>ess Department of<br />
Management-<strong>Energy</strong> Management<br />
Steve Long, Program Director<br />
Offi ce: (405) 325-0758<br />
Fax: (405) 325-7499<br />
Email: slong@ou.edu<br />
Website: http://price.ou.edu/academics/<br />
energymgmt.aspx<br />
ConocoPhillips School of Geology and<br />
Geophysics-Petroleum Geology<br />
Doug Elmore, Director and Eberly Chair<br />
Offi ce: (405) 325-4493<br />
Fax: (405) 325-3140<br />
Email: delmore@ou.edu<br />
Website: http://geology.ou.edu/<strong>in</strong>dex.html<br />
12 AMERICA’S INDEPENDENT COMPILED BY <strong>IPAA</strong> FEBRUARY 2009
STATE EDUCATION PROGRAMS<br />
Mewbourne School of Petroleum and<br />
Geological Eng<strong>in</strong>eer<strong>in</strong>g- Petroleum<br />
Eng<strong>in</strong>eer<strong>in</strong>g<br />
Chandra Rai, Director and Eberly Chair<br />
Offi ce: (405) 325-6866<br />
Fax: (405) 325-7477<br />
Email: crai@ou.edu<br />
Website: http://mpge.ou.edu/<br />
University of Tulsa<br />
Coll<strong>in</strong>s College of Bus<strong>in</strong>ess Department of<br />
<strong>Energy</strong> Management-<strong>Energy</strong> Management<br />
Ted Jacobs, Program Director<br />
Offi ce: (918) 631-3588<br />
Fax: (918) 631-3584<br />
Email: ted-jacobs@utulsa.edu<br />
Website: http://www.cba.utulsa.edu/Depts/<br />
<strong>Energy</strong>/<br />
Department of Petroleum Eng<strong>in</strong>eer<strong>in</strong>g-<br />
Petroleum Eng<strong>in</strong>eer<strong>in</strong>g<br />
Mohan Kelkar, Department Chair<br />
Offi ce: (918) 631-3036<br />
Fax: (918) 631-2533<br />
Email: mohan@utulsa.edu<br />
Website: http://www.pe.utulsa.edu/<br />
Pennsylvania<br />
Pennsylvania <strong>State</strong> University<br />
Department of <strong>Energy</strong> and M<strong>in</strong>eral<br />
Eng<strong>in</strong>eer<strong>in</strong>g-Petroleum and Natural <strong>Gas</strong><br />
Eng<strong>in</strong>eer<strong>in</strong>g<br />
Turgay Ertekt<strong>in</strong>, Program Officer and<br />
Professor<br />
Offi ce: (814) 865-6082<br />
Fax: (814) 863-1875<br />
Email: eur@psu.edu<br />
Website: http://www.pnge.psu.edu/<strong>in</strong>dex.<br />
html<br />
Department of <strong>Energy</strong> and M<strong>in</strong>eral<br />
Eng<strong>in</strong>eer<strong>in</strong>g-<strong>Energy</strong> Bus<strong>in</strong>ess and F<strong>in</strong>ance<br />
Andrew N. Kleit, Program Officer and<br />
Professor<br />
Offi ce: (814) 865-0711<br />
Fax: (814) 865-3663<br />
Email: ank1@psu.edu<br />
Website: http://www.eme.psu.edu/ebf/<br />
<strong>in</strong>dex.html<br />
South Dakota<br />
South Dakota School of M<strong>in</strong>es &<br />
Technology<br />
Geology and Geological Eng<strong>in</strong>eer<strong>in</strong>g<br />
Department- Geological Eng<strong>in</strong>eer<strong>in</strong>g<br />
Maribeth Price, Department Chair<br />
Office: (605) 394-1290<br />
Fax: (605) 394-2461<br />
Email: maribeth.price@sdsmt.edu<br />
Website: http://geology.sdsmt.edu/<br />
Texas<br />
Texas A&M<br />
Harold Vance Department of Petroleum<br />
Eng<strong>in</strong>eer<strong>in</strong>g-Petroleum Eng<strong>in</strong>eer<strong>in</strong>g<br />
Betty Rob<strong>in</strong>s, Program Assistant<br />
Office: (979) 845-2241<br />
Fax: (979) 862-6579<br />
Email: betty@pe.tamu.edu<br />
Website: http://www.pe.tamu.edu/<br />
Texas A&M-K<strong>in</strong>gsville<br />
Department of Chemical and Natural <strong>Gas</strong><br />
Eng<strong>in</strong>eer<strong>in</strong>g-Natural <strong>Gas</strong> Eng<strong>in</strong>eer<strong>in</strong>g<br />
Ali A. Pilehvari, Department Chair<br />
Office: (361) 593-2089<br />
Fax: (361) 593-4026<br />
Email: a-pilehvari@tamuk.edu<br />
Website: http://www.eng<strong>in</strong>eer.tamuk.edu/<br />
departments/ngen/<strong>in</strong>dex.html<br />
Texas Tech University<br />
Rawls College of Bus<strong>in</strong>ess-<strong>Energy</strong><br />
Commerce<br />
Terry McInturff, Program Director<br />
Office: (806) 742-1609<br />
Fax: (806) 742-4535<br />
Email: t.mc<strong>in</strong>turff@ttu.edu<br />
Website: http://plm.ba.ttu.edu/<strong>in</strong>dex.html<br />
Department of Petroleum Eng<strong>in</strong>eer<strong>in</strong>g-<br />
Petroleum Eng<strong>in</strong>eer<strong>in</strong>g<br />
George Asquith, Department Chair<br />
Office: (806) 742-3573<br />
Fax: (806) 742-3502<br />
Email: george.asquith@ttu.edu<br />
Website: http://www.depts.ttu.edu/peWeb/<br />
<strong>in</strong>dex.php<br />
University of Texas-Aust<strong>in</strong> Kilgore<br />
College<br />
Department of Petroleum and Geosystems<br />
Eng<strong>in</strong>eer<strong>in</strong>g-Petroleum Eng<strong>in</strong>eer<strong>in</strong>g<br />
Gary Pope, Department Director and<br />
Professor<br />
Offi ce: (512) 471-3235<br />
Fax: (512) 471-9605<br />
Email: gpope@mail.utexas.edu<br />
Website: http://www.pge.utexas.edu/<strong>in</strong>dex.<br />
cfm<br />
Kilgore College<br />
Department of Cont<strong>in</strong>u<strong>in</strong>g Education-<br />
Petroleum Technology<br />
Bill Brantly, Course Coord<strong>in</strong>ator<br />
Offi ce: (903) 983-8680<br />
Fax: (903) 988-7506<br />
Email: bbrantley@kilgore.edu<br />
Website: http://www.kilgore.edu/petro_tech.<br />
asp<br />
Panola College<br />
Department of Applied Sciences-Petroleum<br />
Technology<br />
Gary Hughes, Division Director<br />
Offi ce: (903) 693-1130<br />
Fax: (903) 693-1144<br />
Email: ghughes@panola.edu<br />
Website: http://www.panola.edu/<strong>in</strong>struction/<br />
srtc/<strong>in</strong>dex.html<br />
Midland College<br />
Petroleum Professional Development<br />
Center-Various Studies/Certifi cations<br />
Hoxie Smith, Director<br />
Offi ce: (432) 683-2832<br />
Fax: (432) 686-8089<br />
Email: hsmith@midland.edu<br />
Website: http://www.midland.edu/~ppdc/<br />
Del Mar College<br />
Technology Education Department-Process<br />
Technology<br />
Denise Rector, Assistant Professor<br />
Offi ce: (361) 698-1713<br />
Fax: (361) 698-1868<br />
Email: drector@delmar.edu<br />
Website: http://www.delmar.edu/teched/<br />
process.php<br />
University of Pittsburgh<br />
Swanson School of Eng<strong>in</strong>eer<strong>in</strong>g-Chemical<br />
and Petroleum Eng<strong>in</strong>eer<strong>in</strong>g<br />
Badie Morsi, Program Director and<br />
Professor<br />
Offi ce: (412) 624-9650<br />
Fax: (412) 624-9639<br />
Email: morsi@engr.pitt.edu<br />
Website: http://www.engr.pitt.edu/chemical/<br />
<strong>in</strong>dex.html<br />
University of Houston<br />
Department of Chemical and Biomolecular<br />
Eng<strong>in</strong>eer<strong>in</strong>g-Petroleum Eng<strong>in</strong>eer<strong>in</strong>g<br />
Dr. Kishore Mohanty, Program Director<br />
Office: (713) 743-4331<br />
Fax: (713) 743-4323<br />
Email: mohanty@uh.edu<br />
Website: http://www.chee.uh.edu/<br />
petroleum/<br />
University of Houston-Downtown<br />
Department of Management, Market<strong>in</strong>g,<br />
and Bus<strong>in</strong>ess-<strong>Energy</strong> Management (M<strong>in</strong>or)<br />
Forrest Aven Jr., Department Chair<br />
Office: (713) 221-8593<br />
Fax: (713) 221-8632<br />
Email: avenf@uhd.edu<br />
Website: http://www.uhd.edu/academic/<br />
colleges/bus<strong>in</strong>ess/mmba/energy_m<strong>in</strong>_<br />
<strong>in</strong>dex.htm<br />
West Virg<strong>in</strong>ia<br />
Glenville <strong>State</strong> College<br />
Department of Land Resources-Landman<br />
Technology<br />
Charles Sypolt, Department Chair<br />
Offi ce: (304) 462-4135<br />
Fax: (304) 462-8709<br />
Email: Charles.Sypolt@glenville.edu<br />
Website: http://www.glenville.wvnet.edu/<br />
NRMLandmanTech_BS3.asp<br />
STATE EDUCATION PROGRAMS<br />
COMPILED BY <strong>IPAA</strong> FEBRUARY 2009 AMERICA’S INDEPENDENT 13
STATE EDUCATION PROGRAMS<br />
West Virg<strong>in</strong>ia University<br />
College of Eng<strong>in</strong>eer<strong>in</strong>g and M<strong>in</strong>eral<br />
Resources-Petroleum and Natural <strong>Gas</strong><br />
Eng<strong>in</strong>eer<strong>in</strong>g<br />
Sam Ameri, Department Chair and<br />
Professor<br />
Offi ce: (304) 293-7682<br />
Fax: (304) 293-5708<br />
Email: samuel.ameri@mail.wvu.edu<br />
Website: http://www.pnge.cemr.wvu.edu/<br />
welcome/<br />
Wyom<strong>in</strong>g<br />
Western Wyom<strong>in</strong>g Community College<br />
Division of Technology and <strong>Industry</strong>-<strong>Oil</strong> and<br />
<strong>Gas</strong> Technology<br />
Paul Johnson, Division Chair<br />
Offi ce: (307) 382-1718<br />
Fax: (307) 382-1872<br />
Email: pjohnson@wwcc.wy.edu<br />
Website: http://www.wwcc.wy.edu/1.htm<br />
Canada<br />
University of Calgary<br />
Haskayne School of Bus<strong>in</strong>ess-Petroleum<br />
Land Management<br />
Bob Schulz, Program Director<br />
Office: (403) 220-6591<br />
Fax: (403) 282-0095<br />
Email: bob.schulz@haskayne.ucalgary.ca<br />
Website: http://haskayne.ucalgary.ca/<br />
undergrad/plma<br />
Acknowledgement: List compiled by<br />
Keelen Hauptman for <strong>IPAA</strong> - Summer<br />
Internship 2008.<br />
University of Wyom<strong>in</strong>g<br />
Department of Chemical and Petroleum<br />
Eng<strong>in</strong>eer<strong>in</strong>g-Petroleum Eng<strong>in</strong>eer<strong>in</strong>g<br />
H. Gordon Harris, Department Head and<br />
Professor<br />
Offi ce: (307) 766-6558<br />
Fax: (307) 766-5769<br />
Email: harrishg@uwyo.edu<br />
Website: http://wwweng.uwyo.edu/<br />
chemical/<br />
STATE EDUCATION PROGRAMS<br />
14 AMERICA’S INDEPENDENT COMPILED BY <strong>IPAA</strong> FEBRUARY 2009
ADDITIONAL ENERGY EDUCATION RESOURCES<br />
Campbell Creek Science Center<br />
Bureau of Land Management (BLM),<br />
Alaska<br />
222 W 7th Avenue, #13<br />
Anchorage Alaska 99513<br />
(907)271-5960<br />
Fax: (907)271-3684<br />
www.blm.gov/ak/getenergized.html<br />
California <strong>Energy</strong> Commission<br />
“<strong>Energy</strong> Quest”<br />
1516 9th Street, MS-29<br />
Sacramento, CA 95814<br />
(916) 654-4989<br />
Fax: (916) 653-5590<br />
www.energyquest.ca.gov/<br />
BP - California Community Relations<br />
“A+ for <strong>Energy</strong>”<br />
6 Centerpo<strong>in</strong>te Drive<br />
La Palma, CA 90623<br />
http://www.aplusforenergy.org/California/<br />
Western <strong>State</strong>s Petroleum<br />
Association (WSPA)<br />
“Derricks to Desks”<br />
1415 L Street, Suite 600<br />
Sacramento, CA 95814<br />
(916) 498-7750<br />
(916) 444-5745 Fax.<br />
http://www.wspa.org/news/<br />
derrickstodesksreg.htm<br />
Colorado School of M<strong>in</strong>es<br />
“Denver Earth Science Project”<br />
Offi ce of Special Programs & Cont<strong>in</strong>u<strong>in</strong>g<br />
Education<br />
Golden, CO 80401<br />
(303) 273-3621<br />
Fax: (303) 273-3314<br />
www.m<strong>in</strong>es.edu/Outreach/Cont_Ed/<br />
desp/desp.html<br />
Northern Montana Independent <strong>Oil</strong><br />
and <strong>Gas</strong> Association<br />
P.O. Box 488<br />
Cut Bank, MT 59427<br />
(406) 873-9000<br />
Fax: (406) 873-5207<br />
Environmental Education Council of<br />
Ohio<br />
P.O. Box 1004<br />
Lancaster, OH 43130<br />
(740) 653-2649<br />
Fax: (740) 653-6100<br />
www.eeco-onl<strong>in</strong>e.org<br />
The NEED Project<br />
8408 Kao Circle<br />
Manassas, VA 20110<br />
(703) 257-1117<br />
http://www.need.org<br />
Ohio <strong>Energy</strong> Project (OEP)<br />
670 Enterprise Drive, Suite A<br />
Lewis Center, OH 43035<br />
(614) 785-1717<br />
Fax: (614) 785-1731<br />
www.ohioenergy.org<br />
Ohio <strong>Oil</strong> & <strong>Gas</strong> <strong>Energy</strong> Education<br />
Program (OOGEEP)<br />
1718 Columbus Road, S.W.<br />
P.O. Box 187<br />
Granville, OH 43023-0535<br />
(740) 587-0444<br />
Fax: (740) 587-0446<br />
www.oogeep.org<br />
Oklahoma Commission on Marg<strong>in</strong>ally<br />
<strong>Produc<strong>in</strong>g</strong> <strong>Oil</strong> and <strong>Gas</strong> Wells<br />
3535 Northwest 58th Street, Suite 870<br />
Oklahoma City, OK 73112<br />
(405) 604-0460 or (800) 390-0460<br />
Fax: (405) 604-0461<br />
http://www.marg<strong>in</strong>alwells.com<br />
Oklahoma <strong>Energy</strong> Resources Board<br />
(OERB)<br />
3555 N.W. 58th, Suite 430<br />
Oklahoma City, OK 73112<br />
(405) 942-5323 or (800) 664-1301<br />
Fax: (405) 942-3435<br />
www.oerb.com<br />
A+ for <strong>Energy</strong> (Texas)<br />
BP America Inc.<br />
3401 Palmer Highway, Room 445D<br />
Texas City, TX 77590<br />
www.aplusforenergy.org/Texas<br />
Offshore <strong>Energy</strong> Center (OEC)<br />
200 North Dairy Ashford, Suite 6220<br />
Houston, TX 77079<br />
(281) 679-8040<br />
Fax: (281) 544-2441<br />
www.oceanstaroec.com<br />
Wiscons<strong>in</strong> K-12 <strong>Energy</strong> Education<br />
Program (KEEP)<br />
403 LRC, UWSP<br />
Stevens Po<strong>in</strong>t, WI 54481<br />
(715) 346-4770<br />
Fax: (715) 346.4698<br />
http://www.uwsp.edu/cnr/wcee/keep/<br />
<strong>in</strong>dex.htm<br />
Federal <strong>Energy</strong> Regulatory<br />
Commission: A Students’ Corner<br />
www.ferc.gov/students/<strong>in</strong>dex.htm<br />
Center for <strong>Energy</strong> Studies<br />
Louisiana <strong>State</strong> University, <strong>Energy</strong>,<br />
Coast and Environment Build<strong>in</strong>g,<br />
Nicholson Drive Extension, Baton<br />
Rouge, LA 70803.<br />
(225) 578-4400.<br />
http://www.enrg.lsu.edu/<br />
Sarkeys <strong>Energy</strong> Center, University of<br />
Oklahoma<br />
100 East Boyd, Room 510 Norman, OK<br />
73019<br />
(405) 325-3821<br />
http://www.sec.ou.edu/<strong>in</strong>dex.php<br />
East Texas Historical Association<br />
http://www.easttexashistorical.org/<br />
Wyom<strong>in</strong>g <strong>State</strong> Historical Society<br />
PMB #184 1740H Dell Range Blvd.<br />
Cheyenne, WY 82009<br />
http://wyshs.org/<strong>in</strong>dex.html<br />
ADDITIONAL EDUCATION RESOURCES<br />
COMPILED BY <strong>IPAA</strong> FEBRUARY 2009 AMERICA’S INDEPENDENT 15
YOUNG PROFESSIONALS IN ENERGY CHAPTERS<br />
YOUNG PROFESSIONALS IN ENERGY CHAPTERS<br />
Young Professionals <strong>in</strong> <strong>Energy</strong><br />
Chapters Founded <strong>in</strong> 2005, YPE is a<br />
global network of young professionals<br />
who seek to engage with peers <strong>in</strong> the<br />
energy <strong>in</strong>dustry.<br />
www.ypenergy.org<br />
Aust<strong>in</strong><br />
Director - Code Williams<br />
(512) 328-2953 ext. 255<br />
cwilliams1@jonesenergy.com<br />
Director - David Watson<br />
(512) 475-9023<br />
davewatson@aust<strong>in</strong>.utexas.edu<br />
Bay Area<br />
Director - Kelsey Lynn<br />
(650) 743-3739<br />
kelsey@lakefi recapital.com<br />
Director - Alicia Stevenson<br />
(818) 223-1924<br />
alicia@recurrentenergy.com<br />
Boston<br />
Director - Stacey DeF<strong>in</strong>o<br />
(512) 217-4174<br />
stacey.defi no@sloan.mit.edu<br />
Calgary<br />
Director - Sarah Phillips<br />
(403) 645-7816<br />
sarah.phillips@encana.com<br />
Chicago<br />
Director - Greg Gleason<br />
(847) 604-6121<br />
ggleason@wynnchurch.com<br />
Director - Joseph Elberts<br />
(312) 462-6417<br />
jelberts@hlhz.com<br />
Ch<strong>in</strong>a<br />
Director - Scott Hou<br />
(713) 478-3123<br />
hous@stoneenergy.com<br />
Dallas<br />
Director - Garrett Mayer<br />
(214) 442-8404<br />
gmayer@drill<strong>in</strong>g<strong>in</strong>fo.com<br />
Denver<br />
Director - Marcus Krembs<br />
(720) 946-6373<br />
mkrembs@sterl<strong>in</strong>gplanet.com<br />
Director - Parker Heikes<br />
(303) 864-7343<br />
pheikes@bokf.com<br />
Dubai<br />
Director - Will Mart<strong>in</strong><br />
(971-50) 557 0273<br />
will.mart<strong>in</strong>@nov.com<br />
Ft. Worth<br />
Director - Gregg Frasure<br />
(817) 284-3492<br />
gregg@welltec-us.com<br />
Director - Rand W<strong>in</strong>frey<br />
(817) 665-4980<br />
rw<strong>in</strong>frey@qr<strong>in</strong>c.com<br />
Houston<br />
Director – Preston Carr<br />
(713) 877-8975<br />
pcarr@mcgriff.com<br />
Director – Alicia Dodge<br />
(713) 954-3825<br />
adodge@mar<strong>in</strong>er-energy.com<br />
London<br />
Director - Roman Batichtchev<br />
+44 (0) 20 7930 2120<br />
rbatichtchev@fi rstreserve.com<br />
Midland Odessa<br />
Director - Leah Rudnicki<br />
(432) 570-6898<br />
lrudnicki@treyresources.net<br />
Moscow<br />
Director - Sergei Kurilov<br />
+7-495-777-7707<br />
svkurilov@tnk-bp.com<br />
Director - Wiley Long<br />
+7-919-967-0574<br />
cwlong@smith.com<br />
New Orleans<br />
Director - J.D. Estes<br />
(504) 281-1409<br />
john.d.estes@exxonmobil.com<br />
New York City<br />
Director - Steve Gudovic<br />
(847) 644-9038<br />
steve.gudovic@aig.com<br />
Oklahoma City<br />
Director - Amanda Trood<br />
(405) 935-6808<br />
amanda.trood@chk.com<br />
Philadelphia<br />
Director – Jessica Maizel<br />
(215) 255-2364<br />
jlmaizel@del<strong>in</strong>vest.com<br />
Assistant Director – Chris Moon<br />
(215) 255-2364<br />
chmoon@lcpim.com<br />
Shreveport<br />
Director - William Bowdon<br />
(318) 746-1691<br />
william@bowdonnr.com<br />
Director - Matthew Huffty<br />
(318) 425-4789<br />
mhuffty@petrohawk.com<br />
Tulsa<br />
Director - Denver McPhail<br />
(918) 760-3645<br />
dmcphail@samson.com<br />
Wash<strong>in</strong>gton, DC<br />
Director - Cortney Hazen<br />
(202) 857-4702<br />
chazen@ipaa.org<br />
16 AMERICA’S INDEPENDENT COMPILED BY <strong>IPAA</strong> FEBRUARY 2009
OIL AND GAS MUSEUMS<br />
<strong>Oil</strong> and <strong>Gas</strong> Museums<br />
Arkansas Museum of Natural Resources<br />
(870) 863-6113<br />
http://www.amnr.org/<br />
Arkansas Museum of Natural Science<br />
(870) 725-2877<br />
http://www.msstate.edu/dept/geosciences<br />
Brea Museum and Heritage Center - CA<br />
(714) 256-2283<br />
http://www.breamuseum.org/<br />
California <strong>Oil</strong> Museum<br />
(805) 933-0076<br />
http://www.oilmuseum.net/<br />
Kern County Museum - CA<br />
(661) 852-5000<br />
http://www.kcmuseum.org/<br />
Ol<strong>in</strong>da Historic Museum and Park - CA<br />
(714) 990-7600<br />
http://www.ci.brea.ca.us/<br />
West Kern County Museum - CA<br />
(661) 765-6664<br />
http://www.westkern-oilmuseum.org/<br />
Denver Museum of Nature & Science<br />
(303) 322-7009<br />
http://www.dmns.org/ma<strong>in</strong>/en/<br />
Ill<strong>in</strong>ois <strong>Oil</strong>field Museum & Resource<br />
Center<br />
http://www.theonlyoblong.com/oil_field/<br />
oblong_oilfield.html<br />
Museum of Science & <strong>Industry</strong> - IL<br />
Chicago -IL<br />
(773) 684-1414<br />
http://www.msichicago.org/<strong>in</strong>dex.html<br />
Wood County Historical Center &<br />
Museum - OH<br />
(419) 352-0967<br />
http://www.woodcountyhistory.org<br />
Anadarko Bas<strong>in</strong> Museum of Natural<br />
History - OK<br />
(580) 243-0437<br />
http://www1.itlnet.net/web/route66/page4.<br />
html<br />
Bartlesville Area History Museum - OK<br />
(918) 337-5336<br />
http://www.bartlesvillehistory.com/<br />
Healdton <strong>Oil</strong> Museum-OK<br />
(405) 229-0317<br />
http://www.brightok.net/chickasaw/<br />
ardmore/county/ healdoil.html<br />
Oklahoma Historical Society<br />
(405) 521-2491<br />
http://www.okhistory.org/<br />
Greater Sem<strong>in</strong>ole Area <strong>Oil</strong> &<br />
Historical Museum - OK<br />
(405) 382-1500<br />
http://www.sem<strong>in</strong>oleoklahoma.com/<br />
museum/<br />
Drake Well Museum - PA<br />
(814) 827-2797<br />
http://www.drakewell.org/<strong>in</strong>dex.htm<br />
The <strong>Oil</strong> Heritage Region - PA<br />
(800) 483-6264, Ext. 18<br />
http://www.oilregion.org/<br />
Penn-Brad <strong>Oil</strong> Museum - PA<br />
(814) 368-5574<br />
http://pennbradoilmuseum.com/<br />
Petroleum History Institute - PA<br />
http://www.petroleumhistory.org/<br />
West Virg<strong>in</strong>ia <strong>Oil</strong> & <strong>Gas</strong> Museum<br />
(304) 485-5446<br />
http://www.little-mounta<strong>in</strong>.com/<br />
oilandgasmuseum<br />
Choctaw County Historical Museum - AL<br />
http://www.ohwy.com/al/c/choccohm.htm<br />
Hathaway Ranch and <strong>Oil</strong> Museum - CA<br />
(562) 777-3444<br />
http://www.hathaworld.com/hrm/<strong>in</strong>dex.html<br />
Santa Barbara Maritime Museum - CA<br />
(805) 962-8404<br />
http://www.sbmm.org/<strong>in</strong>dex.php<br />
Wabash County Museum - IL<br />
(618) 262-8774<br />
http://www.museum.wabash.il.us/<br />
Wood River Ref<strong>in</strong>ery History Museum - IL<br />
(618) 255-3718<br />
http://www.wrrhm.org/<strong>in</strong>dex.htm<br />
Red Crown M<strong>in</strong>i-Museum - IN<br />
http://www.oldgas.com/<strong>in</strong>fo/redcrown.htm<br />
Trump’s Texaco Museum - IN<br />
http://www.southern<strong>in</strong>.com/Pages/archives/<br />
april_00/ henry_county.html<br />
Butler County Historical Center &<br />
Kansas <strong>Oil</strong> Museum<br />
(316) 321-9333<br />
http://kansasoilmuseum.org/<strong>in</strong>dex.cfm<br />
Hill City <strong>Oil</strong> Museum - KS<br />
(785) 421-2854<br />
http://www.geocities.com/Ra<strong>in</strong>Forest/<br />
V<strong>in</strong>es/5320/oil .html<br />
Independence Historical Museum - KS<br />
(620) 331-3515<br />
http://www.comgen.com/~museum/<br />
Kansas <strong>Oil</strong> Museum and Hall of Fame<br />
(316) 321-9333<br />
http://www.kansasoilmuseum.org/<br />
<strong>Oil</strong> Patch Museum - KS<br />
(785) 483-3637<br />
http://www.rchs.russellks.net/<br />
The Kansas <strong>Oil</strong> & <strong>Gas</strong> Hall of Fame<br />
Museum<br />
(620) 793-5742<br />
http://greatbend.com/gbconven/oilgas.htm<br />
Louisiana <strong>State</strong> <strong>Oil</strong> and <strong>Gas</strong> Museum<br />
(318) 995-6845<br />
http://www.sos.louisiana.gov/museums/oil/<br />
International Petroleum Museum &<br />
Exposition - LA<br />
(985) 384-3744<br />
http://www.rigmuseum.com/<br />
Pioneer <strong>Oil</strong> Museum - NY<br />
(585) 373-6035<br />
http://www.pioneer-oil-museum.<br />
com/about-us.html<br />
East Texas <strong>Oil</strong> Museum - TX<br />
(903) 983-8295<br />
http://www.easttexasoilmuseum.com/<strong>in</strong>dex.<br />
html<br />
Houston Museum of Natural Science<br />
(713) 639-4629<br />
http://www.hmns.org/Index.asp<br />
Panhandle-Pla<strong>in</strong>s Historical Museum - TX<br />
(806) 651-2244<br />
http://www.panhandlepla<strong>in</strong>s.org/<br />
Sp<strong>in</strong>dletop - Gladys City Boomtown<br />
Museum - TX<br />
(409) 835-0823<br />
http://sp<strong>in</strong>dletop.org/default.htm<br />
Texas <strong>Energy</strong> Museum<br />
(409) 833-5100<br />
http://www.texasenergymuseum.org/front2.<br />
htm<br />
Ocean Star Offshore Drill<strong>in</strong>g Rig and<br />
Museum - TX<br />
(409) 766-STAR<br />
http://www.oceanstaroec.com/Default.htm<br />
Norman No. 1 Museum - KS<br />
http://www.neodygrads.com/pages/<br />
museum/norman.html<br />
Stevens County <strong>Gas</strong> & Historical<br />
Museum - KS<br />
http://skyways.lib.ks.us/towns/Hugoton/<br />
museum.html<br />
Henry Ford Museum & Benson Ford<br />
Research Center - MI<br />
(313) 982-6070<br />
http://www.hfmgv.org/museum/default.asp<br />
Farm<strong>in</strong>gton Museum - NM<br />
(505) 599-1174<br />
http://www.farm<strong>in</strong>gtonmuseum.org/<br />
Allen County Museum - OH<br />
(419) 222-9426<br />
http://www.allencountymuseum.org/<br />
Hancock Historical Museum - OH<br />
(419) 423-4433<br />
http://www.hancockhistoricalmuseum.org/<br />
OIL AND GAS MUSEUMS<br />
COMPILED BY <strong>IPAA</strong> FEBRUARY 2009 AMERICA’S INDEPENDENT 17
OIL AND GAS MUSEUMS<br />
OIL AND GAS MUSEUMS<br />
Ken Miller Supply’s <strong>Oil</strong>, <strong>Gas</strong>, Car, Truck<br />
and Agriculture Museum - OH<br />
(330) 496-4024 or (330) 567-5930<br />
http://www.shreveohio.com/thisweek.htm<br />
<strong>Oil</strong> Field Eng<strong>in</strong>e Society - OH<br />
(937) 456-9387<br />
http://www.oilfi eldeng<strong>in</strong>e.com<br />
Ames Astrobleme Museum - OK<br />
http://amescrater.com/about.htm<br />
Cherokee Strip Regional Heritage<br />
Center - OK<br />
(580) 237-1907<br />
http://www.regionalheritagecenter.org./01.<br />
htm<br />
Conoco Museum - OK<br />
(580) 765-8687<br />
http://www.conocomuseum.com/<strong>in</strong>dex.htm<br />
Drumright Community Historical<br />
Museum - OK<br />
(918) 352-3002<br />
http://drumrighthistoricalsociety.org/<br />
Frank Phillips Home - OK<br />
(918) 336-2491<br />
http://www.frankphillipshome.org/<br />
Greater Southwest Historical Museum<br />
- OK<br />
(580) 226-3857<br />
http://visitors.ardmore.org/<br />
Kerr Conference Center & Museum - OK<br />
(918) 647-9579<br />
http://www.carlalbert.edu/kerr_center/<br />
Marland <strong>Oil</strong> Museum - OK<br />
http://www.marlandmansion.com/<br />
Nowata County Historical Museum - OK<br />
(918) 273-1191<br />
http://www.ohwy.com/ok/y/ynowhimu.htm<br />
Oklahoma History Center<br />
(405) 522-5248<br />
http://www.okhistorycenter.org/<br />
Oklahoma <strong>Oil</strong> Museum<br />
(405) 382-1500<br />
http://www.sem<strong>in</strong>oleoklahoma.com/<br />
museum/<br />
Phillips Petroleum Company Museum<br />
- OK<br />
(918) 661-1305<br />
http://www.phillips66museum.com/<strong>in</strong>dex.htm<br />
Sam Noble Oklahoma Museum of<br />
Natural History<br />
(405) 325-4712<br />
http://www.snomnh.ou.edu/<strong>in</strong>dex.shtml<br />
Sarkeys <strong>Energy</strong> Center, University of OK<br />
(405) 325-3821<br />
http://www.sec.ou.edu/<strong>in</strong>dex.php<br />
SEG Geoscience Center & Virtual<br />
Museum - OK<br />
(918) 497-5566<br />
http://www.mssu.edu/seg-vm/<br />
Stephens County Historical Museum<br />
- OK<br />
(580) 252-0717<br />
http://www.shopoklahoma.com/museums.<br />
htm<br />
Tulsa Historical Society - OK<br />
(918) 712-9484<br />
http://www.tulsahistory.org/learn/earlytulsa/<br />
oil.h tm<br />
Woolaroc Museum - OK<br />
http://www.woolaroc.org/<br />
Barbara Morgan Harvey Center for the<br />
Study of <strong>Oil</strong> Heritage - PA<br />
http://www.clarion.edu/library/<br />
HarveyCenter/BMHCol lection.htm<br />
Coolspr<strong>in</strong>g Power Musuem - PA<br />
http://www.coolspr<strong>in</strong>gpowermuseum.org/<br />
<strong>Oil</strong> Region Alliance of Bus<strong>in</strong>ess,<br />
<strong>Industry</strong> & Tourism, Inc - PA<br />
(800) 483-6264<br />
http://www.oilregion.org/<br />
Pump<strong>in</strong>g Jack Museum - PA<br />
(724) 867-0030<br />
http://www.pump<strong>in</strong>gjack.org/<br />
Simpler Times Museum - PA<br />
(814) 484-3483<br />
http://www.navr.org/museums.html<br />
Venango Museum of Art, Science and<br />
<strong>Industry</strong> - PA<br />
http://www.venangomuseum.org/<br />
Bob Bullock Texas <strong>State</strong> History<br />
Museum - TX<br />
(866) 369-7108<br />
http://www.thestoryoftexas.com/<br />
Carson Country Square House Museum<br />
- TX<br />
(805) 537-3524<br />
http://www.squarehousemuseum.org/<br />
Central Texas <strong>Oil</strong> Patch Museum - TX<br />
(830) 875-1922<br />
http://www.oilmuseum.org/Welcome.html<br />
Depot Museum - TX<br />
(903) 657-4303<br />
http://www.depotmuseum.com/<strong>in</strong>dex.html<br />
Felty Outdoor <strong>Oil</strong> Museum - TX<br />
http://www.trailsandtales.org/<strong>in</strong>dex.htm<br />
Fort Worth Museum of Science and<br />
History - TX<br />
(817) 255-9300<br />
http://www.fwmuseum.org/home/<strong>in</strong>dex.html<br />
<strong>Gas</strong>ton Museum - TX<br />
(903) 847-2205<br />
http://www.gastonmuseum.org/<br />
Heritage Museum of Montgomery<br />
County - TX<br />
(936) 539-6873<br />
http://www.heritagemuseum.us/<br />
Hutch<strong>in</strong>son County Historical Museum - TX<br />
http://www.hutch<strong>in</strong>soncountymuseum.org/<br />
<strong>in</strong>dex.html<br />
London Museum - TX<br />
(903) 895-4602<br />
http://www.nlse.org/museum.html<br />
Million Barrel Museum - TX<br />
http://www.monahans.org/new/chamber/<br />
museums.html<br />
Museum of the Pla<strong>in</strong>s - TX<br />
(806) 435-6400<br />
http://www.museumofthepla<strong>in</strong>s.com/<br />
Panhandle-Pla<strong>in</strong>s Historical Museum - TX<br />
http://www.panhandlepla<strong>in</strong>s.org<br />
Petroleum Museum - TX<br />
http://www.petroleummuseum.org/<strong>in</strong>dex.html<br />
Ranger Historical Preservation Society<br />
- TX<br />
(254) 647-5353<br />
http://www.txbus<strong>in</strong>ess.com/rhps/<br />
Van Area <strong>Oil</strong> & Historical Museum - TX<br />
(903) 963-5435<br />
http://www.vantexas.com/history.html<br />
W. K. Gordon Center for Industrial<br />
History of Texas - TX<br />
(254) 968-1886<br />
http://www.tarleton.edu/~gordoncenter/<br />
<strong>in</strong>dex.html<br />
Hot Spr<strong>in</strong>gs County Museum & Cultural<br />
Center - WY<br />
(307) 864-5183<br />
http://thermopolis.com/Attractions/<br />
Museums/County+ Museum.htm<br />
Pioneer Association Museum of the<br />
American West - WY<br />
(307) 332-4137<br />
http://wyshs.org/mus-pioneerassoc.htm<br />
Salt Creek Museum - WY<br />
(307) 437-6513<br />
http://wyshs.org/mus-saltcreek.htm<br />
Tate Geological Museum - WY<br />
(307) 268-2447<br />
http://www.caspercollege.edu/community/<br />
campus/tate /tate_new/<strong>in</strong>dex.htm<br />
<strong>Oil</strong> and <strong>Gas</strong> museum <strong>in</strong>formation complied by the<br />
American <strong>Oil</strong> and <strong>Gas</strong> Historical Society. For<br />
additional details, visit www.aoghs.org.<br />
18 AMERICA’S INDEPENDENT COMPILED BY <strong>IPAA</strong> FEBRUARY 2009
The American <strong>Oil</strong> & <strong>Gas</strong> Historical Society (AOGHS) believes the fasc<strong>in</strong>at<strong>in</strong>g history of the nation’s petroleum<br />
<strong>in</strong>dustry offers a vital context for teach<strong>in</strong>g today’s young people. AOGHS, a 501(c)-3 nonprofit organization, is<br />
dedicated to preserv<strong>in</strong>g the history of U.S. exploration and production by provid<strong>in</strong>g advocacy for organizations that<br />
preserve that history through exhibition, material preservation – and especially educational programm<strong>in</strong>g. AOGHS<br />
publishes a quarterly newsletter, the Petroleum Age, and hosts an annual <strong>Energy</strong> Education Conference & Field Trip.<br />
The conference br<strong>in</strong>gs together education program practitioners – those who teach the teachers. Become an AOGHS<br />
member and help us promote state and national energy education programs. To support this effort, please copy and<br />
mail this form with your contribution to AOGHS, 1201 15th St., NW, Suite 300, Wash<strong>in</strong>gton, DC 20005, or fax it to<br />
(202) 857-4799. Questions? Call Bruce Wells, Executive Director at (202) 857-4785.<br />
____ NEW ____ RENEWAL<br />
____ GIFT Provide recipient <strong>in</strong>formation; we will <strong>in</strong>clude a letter acknowledg<strong>in</strong>g your gift.<br />
MEMBERSHIP CATEGORIES<br />
Student $50<br />
Annual $75<br />
Patron $200-$999<br />
Benefactor $1,000 & Above<br />
www.aoghs.org<br />
Benefactors will be acknowledged <strong>in</strong> the Petroleum Age<br />
Change of address? Please check here ____<br />
and send us your new address.<br />
Name ________________________________________________ Title _______________________________________________________<br />
Company/Organization _____________________________________________________________________________________________<br />
Address __________________________________________________________________________________________________________<br />
City _____________________________________________ <strong>State</strong> _____________ Zip Code ____________________________________<br />
Phone ___________________________________________ Email __________________________________________________________<br />
Credit Card Payment : Please check the appropriate credit card:<br />
__ Visa __ MasterCard __ American Express<br />
Credit Card No. __________________________________________________________<br />
Expiration Date (MM/YY) ______/_______<br />
Name as appears on card: ________________________________________<br />
Signature: _______________________________________<br />
<strong>Your</strong> contributions are 100% tax deductible. Federal Tax ID No. 52-184-9282<br />
COMPILED BY <strong>IPAA</strong> FEBRUARY 2009 AMERICA’S INDEPENDENT 19
STATE RANKINGS<br />
Crude <strong>Oil</strong> Natural <strong>Gas</strong> Crude <strong>Oil</strong> Natural <strong>Gas</strong><br />
Wells Drilled Wells Drilled Production Production<br />
1 Texas<br />
1 Texas<br />
1 Federal Offshore<br />
1 Texas<br />
2 Oklahoma<br />
2 Oklahoma<br />
2 Texas<br />
2 Federal Offshore<br />
3 California<br />
3 West Virg<strong>in</strong>ia<br />
3 Alaska<br />
3 Wyom<strong>in</strong>g<br />
4 Kansas<br />
4 Lousiana<br />
4 California<br />
4 Oklahoma<br />
5 Louisiana<br />
5 Pennsylvania<br />
5 Louisiana<br />
5 New Mexico<br />
6 Ill<strong>in</strong>ois<br />
6 Wyom<strong>in</strong>g<br />
6 Oklahoma<br />
6 Louisiana<br />
7 New Mexico<br />
7 New Mexico<br />
7 New Mexico<br />
7 Colorado<br />
8 Ohio<br />
8 Colorado<br />
8 Wyom<strong>in</strong>g<br />
8 Alaska<br />
9 Wyom<strong>in</strong>g<br />
9 Kansas<br />
9 North Dakota<br />
9 Kansas<br />
10 Pennsylvania<br />
10 Federal Offshore<br />
10 Montana<br />
10 Michigan<br />
11 Federal Offshore<br />
11 Ohio<br />
11 Kansas<br />
11 Utah<br />
12 Kentucky<br />
12 Kentucky<br />
12 Colorado<br />
12 California<br />
13 Michigan<br />
13 Michigan<br />
13 Utah<br />
13 Alabama<br />
14 Montana<br />
14 Montana<br />
14 Mississippi<br />
14 West Virg<strong>in</strong>ia<br />
15 New York<br />
15 New York<br />
15 Ill<strong>in</strong>ois<br />
15 Arkansas<br />
16 West Virg<strong>in</strong>ia<br />
16 Alabama<br />
16 Alabama<br />
16 Pennsylvania<br />
17 Arkansas<br />
17 Arkansas<br />
17 Arkansas<br />
17 Montana<br />
18 Colorado<br />
18 California<br />
18 Ohio<br />
18 Virg<strong>in</strong>ia<br />
19 Mississippi<br />
19 Utah<br />
19 Michigan<br />
19 Kentucky<br />
20 North Dakota<br />
20 Virg<strong>in</strong>ia<br />
20 Pennsylvania<br />
20 Ohio<br />
21 Utah<br />
21 Mississippi<br />
21 Florida<br />
21 Mississippi<br />
22 Indiana<br />
22 Tennessee<br />
22 Kentucky<br />
22 New York<br />
23 Nebraska<br />
23 Ill<strong>in</strong>ois<br />
23 Nebraska<br />
23 North Dakota<br />
24 Alaska<br />
24 Indiana<br />
24 West Virg<strong>in</strong>ia<br />
24 Indiana<br />
25 Tennessee<br />
25 Nebraska<br />
25 Indiana<br />
25 Florida<br />
26 Alabama<br />
26 North Dakota<br />
26 South Dakota<br />
26 Tennessee<br />
27 Missouri<br />
27 Alaska<br />
27 Nevada<br />
27 Nebraska<br />
28 South Dakota<br />
28 South Dakota<br />
28 New York<br />
28 South Dakota<br />
29 Florida<br />
29 Maryland<br />
29 Tennessee<br />
29 Oregon<br />
STATE RANKINGS<br />
30 Nevada<br />
31 Arizona<br />
32 Virg<strong>in</strong>ia<br />
33 Iowa<br />
34 Wash<strong>in</strong>gton<br />
30 Missouri<br />
31 Oregon<br />
32 Arizona<br />
33 Wash<strong>in</strong>gton<br />
34 Florida<br />
30 Missouri<br />
31 Arizona<br />
32 Virg<strong>in</strong>ia<br />
30 Arizona<br />
31 Ill<strong>in</strong>ois<br />
32 Maryland<br />
33 Nevada<br />
Sources: IHS for wells drilled and EIA for production.<br />
20 AMERICA’S INDEPENDENT COMPILED BY <strong>IPAA</strong> FEBRUARY 2009
CRUDE OIL SUMMARY<br />
Year Production Imports Supply Exports* Demand Crude Reserves Price<br />
Crude <strong>Oil</strong>* NGL* Total Total* Other Total Domestic Total Proved* New* <strong>Oil</strong><br />
Reserves Reserves Wellhead<br />
(thous. b/d) (mill. bbls.) ($/bbl.)<br />
1960 7,035 929 7,964 1,815 147 9,926 202 9,798 10,000 31,613 2,365 2.88<br />
1961 7,183 991 8,174 1,917 179 10,270 174 9,976 10,150 31,759 2,658 2.89<br />
1962 7,332 1,021 8,353 2,082 175 10,610 168 10,400 10,568 31,389 2,181 2.90<br />
1963 7,542 1,098 8,640 2,123 202 10,965 208 10,743 10,951 30,970 2,174 2.89<br />
1964 7,614 1,155 8,769 2,258 217 11,244 202 11,023 11,225 30,991 2,665 2.88<br />
1965 7,804 1,210 9,014 2,468 220 11,702 187 11,513 11,700 31,352 3,048 2.88<br />
1966 8,295 1,284 9,579 2,573 246 12,398 198 12,085 12,283 31,452 2,964 2.88<br />
1967 8,810 1,409 10,219 2,537 293 13,049 307 12,560 12,867 31,377 2,962 2.92<br />
1968 9,096 1,504 10,600 2,840 347 13,787 231 13,393 13,624 30,707 2,455 2.94<br />
1969 9,238 1,590 10,828 3,166 339 14,333 233 14,137 14,370 29,632 2,120 3.09<br />
1970 9,637 1,660 11,297 3,419 355 15,071 259 14,697 14,956 39,001 2,689 3.18<br />
1971 9,463 1,694 11,157 3,925 438 15,520 224 15,213 15,437 38,063 2,318 3.39<br />
1972 9,441 1,744 11,185 4,741 431 16,357 222 16,367 16,589 36,339 1,558 3.39<br />
1973 9,208 1,738 10,946 6,256 472 17,674 231 17,308 17,539 35,300 2,146 3.89<br />
1974 8,774 1,688 10,462 6,112 478 17,052 221 16,652 16,873 34,250 1,994 6.87<br />
1975 8,375 1,632 10,007 6,056 631 16,694 209 16,322 16,531 32,682 1,318 7.67<br />
1976 8,132 1,604 9,736 7,313 577 17,626 223 17,461 17,684 30,942 1,085 8.19<br />
1977 8,245 1,618 9,863 8,808 531 19,202 243 18,431 18,674 31,780 1,140 8.57<br />
1978 8,707 1,567 10,274 8,364 315 18,953 362 18,847 19,209 31,355 2,583 9.00<br />
1979 8,552 1,583 10,135 8,456 503 19,094 471 18,516 18,987 29,810 1,410 12.64<br />
1980 8,597 1,573 10,170 6,909 616 17,695 544 17,056 17,600 29,805 2,970 21.59<br />
1981 8,572 1,609 10,181 5,995 392 16,568 595 16,058 16,653 29,426 2,570 31.77<br />
1982 8,649 1,550 10,199 5,113 478 15,790 815 15,296 16,111 27,858 1,382 28.52<br />
1983 8,688 1,559 10,247 5,051 503 15,801 739 15,231 15,970 27,735 2,897 26.19<br />
1984 8,879 1,630 10,509 5,437 587 16,533 722 15,726 16,448 28,446 3,748 25.88<br />
1985 8,971 1,609 10,580 5,067 640 16,287 781 15,726 16,507 28,416 3,022 24.09<br />
1986 8,680 1,551 10,231 6,223 764 17,218 785 16,281 17,066 26,889 1,446 12.51<br />
1987 8,349 1,595 9,944 6,678 768 17,390 764 16,665 17,429 27,256 3,240 15.40<br />
1988 8,151 1,625 9,776 7,402 840 18,018 815 17,283 18,098 26,825 2,380 12.58<br />
1989 7,626 1,546 9,172 8,060 853 18,085 859 17,325 18,184 26,501 2,262 15.86<br />
1990 7,335 1,559 8,894 8,017 1,025 17,936 857 16,988 17,845 26,254 2,258 20.03<br />
1991 7,417 1,659 9,076 7,626 1,047 17,749 1,001 16,714 17,715 24,682 940 16.54<br />
1992 7,171 1,697 8,868 7,888 1,114 17,870 949 17,033 17,953 23,745 1,509 15.99<br />
1993 6,847 1,736 8,583 8,620 1,152 18,355 1,003 17,237 18,240 22,957 1,551 14.25<br />
1994 6,662 1,727 8,389 8,996 1,291 18,676 942 17,718 18,660 22,457 1,768 13.19<br />
1995 6,560 1,762 8,322 8,835 1,517 18,674 949 17,725 18,674 22,351 2,107 14.62<br />
1996 6,465 1,830 8,295 9,478 1,516 19,290 981 18,309 19,215 22,017 1,839 18.46<br />
1997 6,452 1,817 8,253 10,162 1,193 19,623 1,003 18,620 19,623 22,546 2,667 17.23<br />
1998 6,252 1,759 8,011 10,708 1,143 19,862 945 18,917 19,862 21,034 479 10.87<br />
1999 5,881 1,850 7,731 10,852 1,876 20,459 940 19,519 20,459 21,765 2,683 15.56<br />
2000 5,822 1,911 7,733 11,459 1,549 20,741 1,040 19,701 20,741 22,045 2,160 26.72<br />
2001 5,801 1,868 7,669 11,871 1,080 20,620 971 19,649 20,620 22,446 2,316 21.84<br />
2002 5,746 1,880 7,626 11,530 1,589 20,745 984 19,761 20,745 22,677 2,106 22.51<br />
2003 5,681 1,719 7,400 12,264 1,397 21,061 1,027 20,034 21,061 21,891 1,091 27.56<br />
2004 5,419 1,809 7,228 13,145 1,406 21,779 1,048 20,731 21,779 21,371 1,299 36.77<br />
2005 5,178 1,717 6,895 13,714 1,358 21,967 1,165 20,802 21,967 21,757 2,119 50.28<br />
2006 5,102 1,739 6,841 13,707 1,456 22,004 1,317 20,687 22,004 20,972 867 59.69<br />
Sources: <strong>Energy</strong> Information Adm<strong>in</strong>istration* and IHS.<br />
Note: Reserves estimated as of December 31 each year. Imports to Strategic Petroleum Reserve are excluded.<br />
CRUDE OIL SUMMARY<br />
COMPILED BY <strong>IPAA</strong> FEBRUARY 2009 AMERICA’S INDEPENDENT 21
NATURAL GAS SUMMARY<br />
NATURAL GAS SUMMARY<br />
Year Production Extraction Imports Supply Exports Consumption <strong>Gas</strong> Reserves Price<br />
Marketed Dry Loss Other Total Proved New <strong>Gas</strong><br />
Reserves Reserves Wellhead<br />
(Bcf)<br />
($/Mcf.)<br />
1960 12,771 12,228 543 156 701 13,096 11 11,967 263,759 14,253 .14<br />
1961 13,254 12,662 592 219 686 13,578 11 12,489 267,728 17,421 .15<br />
1962 13,877 13,253 624 402 838 14,509 16 13,267 273,766 19,750 .16<br />
1963 14,747 14,077 670 406 899 15,399 17 13,970 276,151 18,418 .16<br />
1964 15,547 14,824 723 443 866 16,153 20 14,814 281,251 20,447 .15<br />
1965 16,040 15,287 753 456 934 16,703 26 15,280 286,469 21,470 .16<br />
1966 17,207 16,468 739 480 1,116 18,089 25 16,452 289,333 20,355 .16<br />
1967 18,171 17,386 785 564 1,052 19,084 82 17,388 292,908 21,956 .16<br />
1968 19,322 18,494 828 652 1,236 20,476 94 18,632 287,350 13,816 .16<br />
1969 20,698 19,831 867 727 1,329 21,938 51 20,056 275,109 8,482 .17<br />
1970 21,921 21,015 906 821 1,388 23,294 70 21,139 290,746 37,598 .17<br />
1971 22,493 21,610 883 935 1,427 24,052 80 21,793 278,806 10,136 .18<br />
1972 22,532 21,624 908 1,019 1,679 24,400 78 22,101 266,085 9,791 .19<br />
1973 22,648 21,731 917 1,033 1,456 24,297 77 22,049 249,950 6,471 .22<br />
1974 21,601 20,713 887 959 1,624 23,373 77 21,223 237,132 8,501 .30<br />
1975 20,109 19,236 872 953 1,687 21,949 73 19,538 228,200 10,786 .45<br />
1976 19,952 19,098 854 964 1,640 21,767 65 19,946 216,026 7,368 .58<br />
1977 20,025 19,163 863 1,011 1,654 21,884 56 19,521 207,413 12,978 .79<br />
1978 19,974 19,122 852 966 1,817 21,958 53 19,627 208,033 19,425 .91<br />
1979 20,471 19,663 808 1,253 1,620 22,592 56 20,241 200,997 12,221 1.18<br />
1980 20,180 19,403 777 985 1,385 21,822 49 19,877 199,021 16,723 1.59<br />
1981 19,956 19,181 775 904 1,499 21,643 59 19,404 201,730 21,446 1.98<br />
1982 18,582 17,820 762 933 1,647 20,452 52 18,001 201,512 17,288 2.46<br />
1983 16,884 16,094 790 918 1,523 18,590 55 16,835 200,247 14,523 2.59<br />
1984 18,304 17,466 838 843 1,894 20,258 55 17,951 197,463 14,409 2.66<br />
1985 17,270 16,454 816 950 2,005 19,464 55 17,281 193,369 11,891 2.51<br />
1986 16,859 16,059 800 750 1,364 18,234 61 16,221 191,586 13,827 1.94<br />
1987 17,433 16,621 812 993 1,484 19,152 54 17,211 187,211 11,739 1.67<br />
1988 17,918 17,103 816 1,294 1,807 20,278 74 18,030 168,024 -2,517 1.69<br />
1989 18,095 17,311 785 1,382 2,917 21,717 107 19,119 167,116 16,075 1.69<br />
1990 18,594 17,810 784 1,532 2,265 21,693 86 19,174 169,346 19,463 1.71<br />
1991 18,532 17,698 835 1,773 2,699 22,299 129 19,562 167,062 14,918 1.64<br />
1992 18,712 17,840 872 2,138 2,805 22,999 216 20,228 165,015 15,376 1.74<br />
1993 18,982 18,095 886 2,350 3,105 23,690 140 20,790 162,415 15,189 2.04<br />
1994 19,710 18,821 889 2,624 2,598 24,205 162 21,247 163,837 19,744 1.85<br />
1995 19,506 18,599 908 2,841 3,333 24,927 154 22,207 165,146 19,275 1.55<br />
1996 19,751 18,854 958 2,937 3,725 25,669 153 22,610 166,474 21,456 2.17<br />
1997 19,866 18,902 964 2,994 3,641 25,694 157 22,737 167,223 19,960 2.32<br />
1998 19,961 19,024 938 3,152 2,975 25,310 159 22,246 164,041 15,538 1.96<br />
1999 19,805 18,832 973 3,585 2,585 25,166 163 22,405 167,406 22,293 2.19<br />
2000 20,198 19,182 1,016 3,782 3,053 26,261 244 23,333 177,427 29,240 3.68<br />
2001 20,570 19,616 954 3,977 2,110 26,076 373 22,239 183,460 25,812 4.00<br />
2002 19,885 18,928 957 4,015 2,734 26,193 516 23,007 186,946 22,839 2.95<br />
2003 19,974 19,099 876 3,996 2,526 26,249 680 22,277 189,044 21,523 4.88<br />
2004 19,517 18,591 927 4,259 2,689 26,393 854 22,389 192,513 22,637 5.46<br />
2005 18,927 18,051 876 4,341 2,621 25,742 729 22,011 204,385 30,330 7.33<br />
2006 19,381 18,476 906 4,186 1,915 25,301 724 21,653 211,085 25,245 6.40<br />
Sources: <strong>Energy</strong> Information Adm<strong>in</strong>istration.<br />
Note: Reserves estimated as of December 31 each year. Imports to Strategic Petroleum Reserve are excluded.<br />
22 AMERICA’S INDEPENDENT COMPILED BY <strong>IPAA</strong> FEBRUARY 2009
DRILLING SUMMARY<br />
Year Seismic Crews Rotary Rigs Exploratory Wells Total Well Completions Footage<br />
Work<strong>in</strong>g Active New-Field Total <strong>Oil</strong> <strong>Gas</strong> Dry Service Total Total Drilled<br />
Wildcats Exploratory Wells Wells Wells Holes Wells (mill. ft.)<br />
1960 4,625 1,750 7,320 11,704 21,186 5,258 17,574 2,733 46,751 190.7<br />
1961 4,557 1,760 6,909 10,992 21,101 5,664 17,106 3,091 46,962 192.1<br />
1962 3,915 1,637 6,794 10,797 21,249 5,848 16,682 2,400 46,179 198.6<br />
1963 3,966 1,500 6,570 10,664 20,288 4,751 16,347 2,267 43,653 184.4<br />
1964 4,102 1,502 6,623 10,747 20,620 4,855 17,488 2,273 45,236 189.9<br />
1965 4,247 1,387 6,175 9,466 18,761 4,724 16,025 1,913 41,423 181.5<br />
1966 3,672 1,273 6,158 10,313 16,447 4,167 15,770 2,152 38,536 165.5<br />
1967 3,337 1,134 5,260 8,878 15,329 3,659 13,246 1,584 33,818 144.7<br />
1968 3,268 1,169 5,205 8,879 14,331 3,456 12,812 2,315 32,914 149.3<br />
1969 3,156 1,194 5,956 9,701 14,368 4,083 13,736 1,866 34,053 161.0<br />
1970 2,340 1,028 4,829 7,436 13,043 4,031 11,099 1,369 29,542 142.0<br />
1971 2,655 976 4,636 7,131 11,903 3,983 10,382 1,414 27,682 130.7<br />
1972 3,016 1,107 5,011 7,551 11,437 5,484 11,013 1,486 29,420 142.5<br />
1973 2,999 1,195 5,096 7,771 10,251 6,975 10,466 970 28,662 141.9<br />
1974 3,662 1,471 5,946 8,969 13,644 7,168 12,205 1,398 34,415 153.8<br />
1975 3,416 1,660 6,234 9,459 16,979 8,169 13,736 1,920 40,804 184.9<br />
1976 3,140 1,656 5,856 9,317 17,697 9,438 13,805 1,674 42,614 187.3<br />
1977 3,063 2,001 6,162 10,140 18,700 12,119 15,036 1,453 47,308 215.7<br />
1978 4,148 2,255 6,731 11,030 19,065 14,405 16,591 1,610 51,671 238.4<br />
1979 4,400 2,176 6,423 10,735 20,689 15,166 16,035 1,472 53,362 243.7<br />
1980 4,962 2,910 7,332 12,870 32,120 17,132 20,234 2,076 71,562 311.4<br />
1981 5,877 3,970 9,151 17,430 42,520 19,742 26,972 2,366 91,600 406.5<br />
1982 5,676 3,105 7,386 15,882 39,252 18,810 25,827 2,212 86,101 375.4<br />
1983 4,944 2,229 6,057 13,845 37,396 14,505 23,837 2,047 77,785 316.7<br />
1984 4,655 2,428 6,528 15,138 44,472 14,962 25,549 2,251 87,234 368.8<br />
1985 3,494 1,969 5,630 12,208 36,458 12,917 21,431 1,736 75,542 316.8<br />
1986 2,016 964 3,484 7,156 18,598 8,055 12,362 834 39,849 177.6<br />
1987 1,561 936 3,515 6,903 16,441 8,114 11,698 890 37,143 163.8<br />
1988 1,512 936 3,271 6,350 13,508 8,446 10,284 953 33,191 155.2<br />
1989 1,392 869 2,644 5,251 10,412 9,483 8,468 672 29,035 135.0<br />
1990 1,493 1,010 2,685 5,074 12,104 10,242 8,359 802 31,417 149.5<br />
1991 1,251 862 2,195 4,399 11,733 9,020 7,664 1,070 29,487 141.4<br />
1992 847 721 1,762 3,525 8,821 7,854 6,394 989 24,058 121.3<br />
1993 952 755 1,683 3,603 9,144 10,285 6,594 716 25,724 138.5<br />
1994 1,087 775 1,613 3,787 7,704 10,044 5,568 669 23,985 130.6<br />
1995 1,253 723 1,605 3,402 8,736 8,923 5,425 885 23,969 124.5<br />
1996 1,307 779 1,676 3,342 9,937 10,118 5,698 791 26,544 138.7<br />
1997 1,336 943 1,757 3,155 12,028 11,838 6,354 1,017 31,237 165.4<br />
1998 1,566 827 1,478 2,445 8,389 12,233 5,202 838 26,662 143.6<br />
1999 1,125 625 1,244 1,842 5,419 12,663 3,930 478 22,490 110.0<br />
2000 727 918 1,505 2,231 8,860 17,283 4,721 930 31,794 148.9<br />
2001 717 1,156 1,765 3,018 9,581 21,601 4,667 786 36,635 184.0<br />
2002 674 830 1,452 2,233 7,222 16,801 3,771 747 28,541 145.0<br />
2003 481 1,032 1,711 2,484 8,710 20,715 4,011 815 34,251 178.5<br />
2004 563 1,192 1,951 2,891 9,303 23,377 3,979 1,447 36,777 202.6<br />
2005 655 1,383 1,936 3,729 10,882 26,809 4,005 1,596 41,696 226.6<br />
2006 728 1,649 2,275 4,368 13,150 30,349 4,674 1,946 48,173 266.9<br />
Sources: EIA & IHS, World <strong>Oil</strong>, Baker-Hughes & American Petroleum Institute (wells drilled data pre-2005).<br />
Notes: Total well completions <strong>in</strong>clude exploratory and development wells. API historical data may not match IHS data used for recent decade on state and summary<br />
pages.<br />
DRILLING SUMMARY<br />
COMPILED BY <strong>IPAA</strong> FEBRUARY 2009 AMERICA’S INDEPENDENT 23
UNITED STATES<br />
<strong>State</strong>s with oil and/or gas production<br />
Background Information<br />
<strong>State</strong>s<br />
Number of states 50<br />
With oil and/or gas production 33<br />
First year of production<br />
Crude oil (Pennsylvania) 1859<br />
Natural gas (Pennsylvania) 1881<br />
Year and amount of peak production<br />
Crude oil — 3,517,450 thous. bbls. 1970<br />
Natural gas — 22,647,549 MMcf 1973<br />
Deepest produc<strong>in</strong>g well (ft.)<br />
Crude oil (GOM) 31,481<br />
Natural gas (Texas) 30,712<br />
Year and depth of deepest well drilled (ft.)<br />
2003 (GOM) 31,824<br />
Value of <strong>Oil</strong> and <strong>Gas</strong><br />
Average wellhead price<br />
(2006)<br />
Crude oil ($/bbl.) $ 59.69<br />
Natural gas ($Mcf) $ 6.40<br />
Wellhead value of production<br />
(2006, <strong>in</strong> thous. $)<br />
Crude oil $ 111,158,240<br />
Natural gas $ 124,044,128<br />
Total $235,202,368<br />
Average natural gas price<br />
(2006, $/Mcf)<br />
Residential consumers $ 13.75<br />
Commercial consumers $ 11.99<br />
Industrial consumers $ 7.86<br />
Electric utilities $ 7.11<br />
City Gate $ 8.61<br />
Severance taxes paid $9,711,307<br />
(2006, <strong>in</strong> thous. $)<br />
Cumulative number of total wells drilled<br />
as of 12/31/06 (exclud<strong>in</strong>g service wells)<br />
<strong>Oil</strong> wells 1,507,245 48%<br />
<strong>Gas</strong> wells 664,079 21%<br />
Dry holes 982,167 31%<br />
Total 3,153,496 100%<br />
UNITED STATES<br />
Cumulative crude oil wellhead value<br />
as of 12/31/06 (thous. $) $2,005,238,242<br />
Cumulative production & new reserves<br />
as of 12/31/06<br />
Crude NGL Natural<br />
<strong>Oil</strong> (mill. bbls.) Total <strong>Gas</strong> (Bcf)<br />
Reserves 209,623 49,337 258,960 1,273,956<br />
Production 188,741 37,674 226,415 1,065,570<br />
24 AMERICA’S INDEPENDENT COMPILED BY <strong>IPAA</strong> FEBRUARY 2009
2006 <strong>Industry</strong> Statistics<br />
Number of wells drilled<br />
Exploratory Development Total<br />
<strong>Oil</strong> 805 12,345 13,150<br />
<strong>Gas</strong> 2,254 28,095 30,349<br />
Dry 1,309 3,365 4,674<br />
Total 4,368 43,805 48,173<br />
Total footage drilled<br />
(thous. ft.)<br />
Exploratory Development Total<br />
<strong>Oil</strong> 5,685.6 55,315.7 61,001.3<br />
<strong>Gas</strong> 12,813.2 169.558.0 182,371.2<br />
Dry 7,358.5 16,131.2 23,489.8<br />
Total 25,857.3 241,004.9 266,862.2<br />
(Note: Totals may not add due to round<strong>in</strong>g.)<br />
New-field wildcats drilled 2,275<br />
Footage (thous. ft.) 13,497.8<br />
Average rotary rigs active 1,649<br />
Permits 75,455<br />
World-wide rank<br />
Crude <strong>Oil</strong> Natural <strong>Gas</strong><br />
Wells drilled 1st 1st<br />
Production 3rd 2nd<br />
Reserves (2006) 12th 5th<br />
Number of operators 16,013<br />
Number of produc<strong>in</strong>g wells<br />
(12/31/06)<br />
Crude oil 400,741<br />
Natural gas 369,586<br />
Total 773,069<br />
Average production<br />
Crude oil (thous. b/d) 4,482<br />
Natural gas 48,867<br />
Total 54,349<br />
Natural gas marketed production<br />
(MMcf) 19,409,674<br />
Average output per produc<strong>in</strong>g well<br />
Crude oil (bbls.) 3,071<br />
Natural gas (Mcf) 42,219<br />
2006 Latest Available Data<br />
Petroleum reserves<br />
as of 12/31/06 (mill. bbls.)<br />
Crude <strong>Oil</strong> NGL Total<br />
New reserves 867 1,118 1,985<br />
Production 1,652 811 2,463<br />
Net annual change -785 307 -478<br />
Proved reserves 20,972 8,472 29,444<br />
Natural gas reserves<br />
as of 12/31/06 (Bcf)<br />
Associated Non- Dry<br />
Dissolved Associated <strong>Gas</strong><br />
New reserves 3,685 22,796 25,245<br />
Production 2,281 17,092 18,545<br />
Net annual change 1,404 5,704 6,700<br />
Proved reserves 29,640 190,776 211,085<br />
Cost of drill<strong>in</strong>g and equipp<strong>in</strong>g wells<br />
Cost/ft. Cost/ Total Cost<br />
($) well ($) (thous. $)<br />
<strong>Oil</strong> 305 1,413,215 18,583,779<br />
<strong>Gas</strong> 332 1,996,884 60,603,424<br />
Dry 268 1,347,775 6,299,501<br />
Marg<strong>in</strong>al oil wells<br />
<strong>Produc<strong>in</strong>g</strong> marg<strong>in</strong>al wells 355,177<br />
Crude oil production <strong>in</strong> bbls. (thous.) 359,339<br />
Crude oil production b/d (thous.) 984<br />
Marg<strong>in</strong>al natural gas wells<br />
as of 12/31/06<br />
<strong>Produc<strong>in</strong>g</strong> marg<strong>in</strong>al wells 261,437<br />
Natural gas production (MMcf) 2,450,958<br />
Federal onshore m<strong>in</strong>eral lease royalties<br />
<strong>Oil</strong> $ 4,262,953,675<br />
<strong>Gas</strong> $ 5,765,932,458<br />
Total Royalties $ 12,616,328,035<br />
Average number of employees<br />
<strong>Oil</strong> and natural gas extraction 403,358<br />
Refi n<strong>in</strong>g 69,124<br />
Transportation 231,809<br />
Wholesale 191,759<br />
Retail 862,064<br />
Pipel<strong>in</strong>e construction 83,408<br />
<strong>Oil</strong>fi eld mach<strong>in</strong>ery 52,382<br />
Total petroleum <strong>in</strong>dustry 1,825,703<br />
Source: EIA for production and IHS for wells drilled.<br />
UNITED STATES<br />
COMPILED BY <strong>IPAA</strong> FEBRUARY 2009 AMERICA’S INDEPENDENT 25
FEDERAL OFFSHORE<br />
Southern<br />
California<br />
<strong>State</strong>s and Federal Offshore areas<br />
with oil and/or gas production<br />
Western<br />
Gulf of<br />
Mexico<br />
Central<br />
Gulf of<br />
Mexico<br />
Background Information<br />
Plann<strong>in</strong>g Areas<br />
Number of areas 25<br />
With oil and/or gas production 3<br />
First year of production<br />
Crude oil 1946<br />
Natural gas 1946<br />
Year and amount of peak production<br />
Crude oil — 591,589 thous. bbls. 2001<br />
Natural gas — 5,248,041 MMcf 1997<br />
Deepest produc<strong>in</strong>g well (ft.)<br />
Water depth 10,062<br />
Natural gas 26,712<br />
Year and depth of deepest well drilled (ft.)<br />
Water depth (2004) 10,062<br />
Well depth (2005) 30,505<br />
Value of <strong>Oil</strong> and <strong>Gas</strong><br />
Average wellhead price<br />
(2006)<br />
Crude oil ($/bbl.) $60.41<br />
Natural gas ($Mcf) $ 6.40<br />
Wellhead value of production<br />
(2006, <strong>in</strong> thous. $)<br />
Crude oil $30,211,826<br />
Natural gas $18,909,043<br />
Total $49,120,870<br />
Federal Reserves<br />
(2006, <strong>in</strong> thous. $)<br />
Bonuses $ 865.26<br />
Rents $ 224.01<br />
Royalties $6,559.00<br />
Total $7,606.77<br />
FEDERAL OFFSHORE<br />
Cumulative number of total wells drilled<br />
as of 12/31/06 (exclud<strong>in</strong>g service wells)<br />
<strong>Oil</strong> wells 20,973 33%<br />
<strong>Gas</strong> wells 25,421 39%<br />
Dry holes 18,161 28%<br />
Total 64,555 100%<br />
Cumulative crude oil wellhead value<br />
as of 12/31/06 (thous. $) $289,157,519<br />
Cumulative production & new reserves<br />
as of 12/31/06<br />
Crude NGL Natural<br />
<strong>Oil</strong> (mill. bbls.) Total <strong>Gas</strong> (Bcf)<br />
Reserves 21,314 4,700 21,314 103,401<br />
Production 15,160 2,747 17,907 63,032<br />
26 AMERICA’S INDEPENDENT COMPILED BY <strong>IPAA</strong> FEBRUARY 2009
2006 <strong>Industry</strong> Statistics<br />
Number of wells drilled<br />
Exploratory Development Total<br />
<strong>Oil</strong> 1 127 128<br />
<strong>Gas</strong> 28 265 293<br />
Dry 126 91 217<br />
Total 155 483 638<br />
Total footage drilled<br />
(thous. ft.)<br />
Exploratory Development Total<br />
<strong>Oil</strong> 15.4 1,306.9 1,322.3<br />
<strong>Gas</strong> 254.9 2,780.2 3,035.1<br />
Dry 1,623.0 939.9 2,562.9<br />
Total 1,893.3 5,027.0 6,920.3<br />
(Note: Totals may not add due to round<strong>in</strong>g.)<br />
New-field wildcats drilled 146<br />
Footage (thous. ft.) 1,752.3<br />
Average rotary rigs active 90<br />
Permits 1,177<br />
2006 Latest Available Data<br />
Petroleum reserves<br />
as of 12/31/06 (mill. bbls.)<br />
Crude <strong>Oil</strong> NGL Total<br />
New reserves 44 82 126<br />
Production 431 125 556<br />
Net annual change -387 -43 -430<br />
Proved reserves 4,096 653 4,749<br />
Natural gas reserves<br />
as of 12/31/06 (Bcf)<br />
Associated Non- Dry<br />
Dissolved Associated <strong>Gas</strong><br />
New reserves -434 773 304<br />
Production 635 2,206 2,775<br />
Net annual change -1,069 -1,433 -2,471<br />
Proved reserves 4,835 10,915 15,360<br />
Cost of drill<strong>in</strong>g and equipp<strong>in</strong>g wells<br />
Cost/ft. Cost/ Total Cost<br />
($) well ($) (thous. $)<br />
<strong>Oil</strong> 3,352 34,624,729 4,431,965<br />
<strong>Gas</strong> 3,509 36,346,199 10,649,436<br />
Dry 3,576 42,234,002 9,164,778<br />
<strong>State</strong>-wide rank<br />
Crude <strong>Oil</strong> Natural <strong>Gas</strong><br />
Wells drilled 11th 10th<br />
Production 1st 2nd<br />
Reserves (2006) 2nd 6th<br />
Number of produc<strong>in</strong>g wells<br />
(12/31/06)<br />
Crude oil 3,146<br />
Natural gas 3,367<br />
Total 6,513<br />
Average production<br />
Crude oil (thous. b/d) 1,182<br />
NGL (est.) 181<br />
Natural gas (MMcf/day) 1,612<br />
Natural gas marketed production<br />
(MMcf) 19,381,895<br />
Average output per produc<strong>in</strong>g well<br />
Crude oil (bbls.) 137,101<br />
Natural gas (Mcf) 705,489<br />
<strong>Produc<strong>in</strong>g</strong> well depth<br />
<strong>Oil</strong> Wells <strong>Gas</strong> Wells<br />
Shelf (wd 5,000 ft) 35 22<br />
Total 3,146 3,368<br />
Number of operators<br />
<strong>Produc<strong>in</strong>g</strong> oil 71<br />
<strong>Produc<strong>in</strong>g</strong> natural gas 103<br />
Source: EIA for production and IHS for wells drilled.<br />
2006 Lease Statistics<br />
G&G permits 105<br />
Platform <strong>in</strong>stallations 109<br />
Platform removals 102<br />
Platform <strong>in</strong> place 3,922<br />
Lease characteristics<br />
Exist<strong>in</strong>g leases<br />
900 meters of water 112<br />
<strong>Oil</strong> & natural gas fields<br />
<strong>Produc<strong>in</strong>g</strong> 830<br />
Non-produc<strong>in</strong>g 390<br />
Federal onshore m<strong>in</strong>eral lease royalties<br />
<strong>Oil</strong> $ 3,398,971,818<br />
<strong>Gas</strong> $ 3,160,028,663<br />
Total Royalties $ 7,606,767,938<br />
The Kermac No. 16 discovery well<br />
struck oil <strong>in</strong> the Gulf of Mexico on Nov. 14,<br />
1947 — the fi rst successful well out of sight<br />
of land. Brown & Root built the freestand<strong>in</strong>g<br />
platform 10 miles from shore for Kerr-McGee<br />
<strong>Oil</strong> Industries and partners Phillips Petroleum<br />
and Stanol<strong>in</strong>d.<br />
FEDERAL OFFSHORE<br />
COMPILED BY <strong>IPAA</strong> FEBRUARY 2009 AMERICA’S INDEPENDENT 27
ALABAMA<br />
Lauderdale<br />
Limestone<br />
Madison Jackson<br />
Colbert<br />
Lawrence<br />
Frankl<strong>in</strong><br />
Morgan<br />
DeKalb<br />
Marshall<br />
Marion W<strong>in</strong>ston<br />
Cherokee<br />
Cullman<br />
Etowah<br />
Blount<br />
Lamar<br />
Walker<br />
Calhoun<br />
Fayette<br />
St. Clair<br />
Cleburne<br />
Jefferson<br />
Pickens<br />
Tuscaloosa<br />
Shelby<br />
Talladega<br />
Clay<br />
Randolph<br />
Bibb<br />
Coosa<br />
Chambers<br />
Greene<br />
Chilton<br />
Tallapoosa<br />
Hale<br />
Sumter<br />
Perry<br />
Autauga<br />
Elmore<br />
Lee<br />
Macon<br />
Marengo<br />
Dallas<br />
Montgomery<br />
Russell<br />
Lowndes<br />
Bullock<br />
Choctaw<br />
Wilcox<br />
Pike<br />
Barbour<br />
Butler Crenshaw<br />
Clarke<br />
Monroe<br />
Henry<br />
Wash<strong>in</strong>gton<br />
Conecuh<br />
Coffee Dale<br />
Escambia<br />
Cov<strong>in</strong>gton<br />
Geneva<br />
Houston<br />
Mobile<br />
Baldw<strong>in</strong><br />
Counties with oil and/or gas production<br />
Background Information<br />
Counties<br />
Number of counties 67<br />
With oil and/or gas production 21<br />
First year of production<br />
Crude oil 1944<br />
Natural gas 1904<br />
Year and amount of peak production<br />
Crude oil — 22,153 thous. bbls. 1980<br />
Natural gas —378,877 MMcf 1996<br />
Deepest produc<strong>in</strong>g well (ft.)<br />
Crude oil 19,000<br />
Natural gas 23,505<br />
Year and depth of deepest well drilled (ft.)<br />
1995 24,275<br />
Cumulative number of total wells drilled<br />
as of 12/31/06 (exclud<strong>in</strong>g service wells)<br />
<strong>Oil</strong> wells 1,365 10%<br />
<strong>Gas</strong> wells 7,802 57%<br />
Dry holes 4,583 33%<br />
Total 13,750 100%<br />
Value of <strong>Oil</strong> and <strong>Gas</strong><br />
Average wellhead price<br />
(2006)<br />
Crude oil ($/bbl.) $ 63.16<br />
Natural gas ($Mcf) $ 7.57<br />
Wellhead value of production<br />
(2006, <strong>in</strong> thous. $)<br />
Crude oil $ 475,658<br />
Natural gas $ 2,166,685<br />
Total $ 2,642,343<br />
Average natural gas price<br />
(2006, $/Mcf)<br />
Residential consumers $ 18.80<br />
Commercial consumers $ 15.82<br />
Industrial consumers $ 9.46<br />
Electric utilities $ 7.32<br />
City Gate $ 10.26<br />
Severance taxes paid $177,280<br />
(2006 <strong>in</strong> thous. $)<br />
Cumulative crude oil wellhead value<br />
as of 12/31/06 (thous. $) $11,131,033<br />
ALABAMA<br />
Cumulative production & new reserves<br />
as of 12/31/06<br />
Crude NGL Natural<br />
<strong>Oil</strong> (mill. bbls.) Total <strong>Gas</strong> (Bcf)<br />
Reserves 510 406 916 8,512<br />
Production 482 370 852 6,887<br />
28 AMERICA’S INDEPENDENT COMPILED BY <strong>IPAA</strong> FEBRUARY 2009
2006 <strong>Industry</strong> Statistics<br />
Number of wells drilled<br />
Exploratory Development Total<br />
<strong>Oil</strong> 3 13 16<br />
<strong>Gas</strong> 7 373 380<br />
Dry 23 21 44<br />
Total 33 407 440<br />
Total footage drilled<br />
(thous. ft.)<br />
Exploratory Development Total<br />
<strong>Oil</strong> 37.5 153.2 190.5<br />
<strong>Gas</strong> 23.8 1,016.6 1,040.4<br />
Dry 198.2 94 292.2<br />
Total 259.3 1,263.8 1,523.1<br />
(Note: Totals may not add due to round<strong>in</strong>g.)<br />
New-field wildcats drilled 24<br />
Footage (thous. ft.) 189.8<br />
Average rotary rigs active 5<br />
Permits 708<br />
<strong>State</strong>-wide rank<br />
Crude <strong>Oil</strong> Natural <strong>Gas</strong><br />
Wells drilled 26th 16th<br />
Production 16th 13th<br />
Reserves (2006) 18th 12th<br />
Number of operators 85<br />
Number of produc<strong>in</strong>g wells<br />
(12/31/06)<br />
Crude oil 493<br />
Natural gas 5,523<br />
Total 6,016<br />
Average production<br />
Crude oil (thous. b/d) 14<br />
NGL (thous. b/d) 6.3<br />
Natural gas (MMcf/d) 796<br />
Natural gas marketed production<br />
(MMcf) 286,220<br />
Average output per produc<strong>in</strong>g well<br />
Crude oil (bbls.) 10,703<br />
Natural gas (Mcf) 52,604<br />
Coalbed methane (YTD MMcf) 116,940<br />
<strong>Oil</strong> Wells 3<br />
<strong>Gas</strong> Wells 5,060<br />
Daily Average (MMcf) / Well 320<br />
2006 Latest Available Data<br />
Petroleum reserves<br />
as of 12/31/06 (mill. bbls.)<br />
Crude <strong>Oil</strong> NGL Total<br />
New reserves -5 0 -5<br />
Production 5 5 10<br />
Net annual change -10 -5 15<br />
Proved reserves 45 56 101<br />
Natural gas reserves<br />
as of 12/31/06 (Bcf)<br />
Associated Non- Dry<br />
Dissolved Associated <strong>Gas</strong><br />
New reserves -7 254 233<br />
Production 4 286 287<br />
Net annual change -11 -32 -54<br />
Proved reserves 18 3,945 3,911<br />
Cost of drill<strong>in</strong>g and equipp<strong>in</strong>g wells<br />
Cost/ft Cost Total Cost<br />
($) well ($) (thous. $)<br />
<strong>Oil</strong> 454 5,412,007 86,592<br />
<strong>Gas</strong> 211 577,847 219,582<br />
Dry 276 1,834,373 80,712<br />
Marg<strong>in</strong>al oil wells<br />
<strong>Produc<strong>in</strong>g</strong> marg<strong>in</strong>al wells 320<br />
Crude oil production <strong>in</strong> bbls. (thous.) 706<br />
Crude oil production b/d (thous.) 2<br />
Marg<strong>in</strong>al natural gas wells<br />
as of 12/31/06<br />
<strong>Produc<strong>in</strong>g</strong> marg<strong>in</strong>al wells 4,165<br />
Natural gas production (MMcf) 60,255<br />
Federal onshore m<strong>in</strong>eral lease royalties<br />
<strong>Oil</strong> $ 729,991<br />
<strong>Gas</strong> $ 915,536<br />
Total Royalties $1,981,892<br />
Horizontal wells data<br />
Horizontal wells drilled 13<br />
Average number of employees<br />
<strong>Oil</strong> and natural gas extraction 1,957<br />
Refi n<strong>in</strong>g 948<br />
Transportation 3,329<br />
Wholesale 3,145<br />
Retail 19,001<br />
Pipel<strong>in</strong>e construction 3,329<br />
<strong>Oil</strong>fi eld mach<strong>in</strong>ery 0<br />
Total petroleum <strong>in</strong>dustry 29,437<br />
Heavy oil (YTD BBls, <strong>in</strong> thous.) NA<br />
Wells<br />
NA<br />
Av. Bbls per day<br />
NA<br />
Av. Bbls per well/d<br />
NA<br />
Source: EIA for production and IHS for wells drilled.<br />
Hunt <strong>Oil</strong> company drilled the A.R. Jackson<br />
Well No. 1 near Gilbertown <strong>in</strong> January 1944. The<br />
well found commercial quantities of oil at a depth<br />
of 2, 580 feet. The <strong>State</strong> <strong>Oil</strong> and <strong>Gas</strong> Board of<br />
Alabama was formed the follow<strong>in</strong>g year.<br />
ALABAMA<br />
COMPILED BY <strong>IPAA</strong> FEBRUARY 2009 AMERICA’S INDEPENDENT 29
North Slope<br />
ALASKA<br />
Northwest Arctic<br />
Nome<br />
Yukon-Koyukuk<br />
Fairbanks<br />
North Star<br />
Southeast Fairbanks<br />
Wade Hampton<br />
Matanuska-Susitna<br />
Valdez-Cordova<br />
Bethel<br />
Dill<strong>in</strong>gham<br />
Kenai<br />
Cook<br />
Kenai<br />
Pen<strong>in</strong>sula<br />
Anchorage<br />
Skagway-Yakutat-Angoon<br />
Ha<strong>in</strong>es<br />
Juneau<br />
Bristol Bay<br />
Kodiak<br />
Sitka<br />
Wrangell-<br />
Petersburg<br />
Ketchikan<br />
Gateway<br />
Pr<strong>in</strong>ce of Wales-Outer Ketchikan<br />
Aleutians Islands<br />
Areas with oil and/or gas production<br />
Background Information<br />
Value of <strong>Oil</strong> and <strong>Gas</strong><br />
Areas<br />
Number of areas 15<br />
With oil and/or gas production 8<br />
First year of production<br />
Crude oil 1905<br />
Natural gas 1945<br />
Year and amount of peak production<br />
Crude oil — 738,143 thous. bbls. 1988<br />
Natural gas — 555,402 MMcf 1994<br />
Deepest produc<strong>in</strong>g well (ft.)<br />
Crude oil 22,261<br />
Natural gas 17,864<br />
Year and depth of deepest well drilled (ft.)<br />
2002 23,885<br />
Cumulative number of total wells drilled<br />
as of 12/31/06 (exclud<strong>in</strong>g service wells)<br />
<strong>Oil</strong> wells 4,535 78%<br />
<strong>Gas</strong> wells 298 5%<br />
Dry holes 986 17%<br />
Total 5,819 100%<br />
Average wellhead price<br />
(2006)<br />
Crude oil ($/bbl.) $ 57.03<br />
Natural gas ($Mcf) $ 5.79<br />
Wellhead value of production<br />
(2006, <strong>in</strong> thous. $)<br />
Crude oil $ 15,425,817<br />
Natural gas $ 2,574,952<br />
Total $ 18,000,769<br />
Average natural gas price<br />
(2006, $/Mcf)<br />
Residential consumers $ 6.84<br />
Commercial consumers $ 4.75<br />
Industrial consumers $ 3.70<br />
Electric utilities $ 3.65<br />
City Gate $ 5.25<br />
Severance taxes paid $ 1,061,672<br />
(2006, <strong>in</strong> thous. $)<br />
Cumulative crude oil wellhead value<br />
as of 12/31/06 (thous. $) $241,769,045<br />
ALASKA<br />
Cumulative production & new reserves<br />
as of 12/31/06<br />
Crude NGL Natural<br />
<strong>Oil</strong> (mill. bbls.) Total <strong>Gas</strong> (Bcf)<br />
Reserves 19,942 510 20,452 22,830<br />
Production 15,654 368 16,022 11,733<br />
30 AMERICA’S INDEPENDENT COMPILED BY <strong>IPAA</strong> FEBRUARY 2009
2006 <strong>Industry</strong> Statistics<br />
Number of wells drilled<br />
Exploratory Development Total<br />
<strong>Oil</strong> 1 112 113<br />
<strong>Gas</strong> 1 6 7<br />
Dry 9 3 12<br />
Total 11 121 132<br />
Total footage drilled<br />
(thous. ft.)<br />
Exploratory Development Total<br />
<strong>Oil</strong> 11.5 835.6 847.2<br />
<strong>Gas</strong> 8.2 42.5 50.7<br />
Dry 60.4 12.3 72.7<br />
Total 80.1 890.4 970.5<br />
(Note: Totals may not add due to round<strong>in</strong>g.)<br />
New-field wildcats drilled 5<br />
Footage (thous. ft.) 37.7<br />
Average rotary rigs active 8<br />
Permits 187<br />
<strong>State</strong>-wide rank<br />
Crude <strong>Oil</strong> Natural <strong>Gas</strong><br />
Wells drilled 24th 27th<br />
Production 3rd 8th<br />
Reserves (2006) 3rd 8th<br />
Number of operators 6<br />
Number of produc<strong>in</strong>g wells<br />
(12/31/06)<br />
Crude oil 2,465<br />
Natural gas 193<br />
Total 2,658<br />
Average production<br />
Crude oil (thous. b/d) 737<br />
NGL (thous. b/d) 3.9<br />
Natural gas (MMcf/day) 796<br />
Natural gas marketed production<br />
(MMcf) 444,724<br />
Average output per produc<strong>in</strong>g well<br />
Crude oil (bbls.) 109,189<br />
Natural gas (Mcf) 1,040,335<br />
Coalbed methane (YTD MMcf)<br />
<strong>Oil</strong> Wells<br />
<strong>Gas</strong> Wells<br />
Daily Average (MMcf) / Well<br />
Heavy oil (YTD BBls, <strong>in</strong> thous.)<br />
Wells<br />
Av. Bbls per day<br />
Av. Bbls per well/d<br />
NA<br />
NA<br />
NA<br />
NA<br />
NA<br />
NA<br />
NA<br />
Source: EIA for production and IHS for wells drilled.<br />
2006 Latest Available Data<br />
Petroleum reserves<br />
as of 12/31/06 (mill. bbls.)<br />
Crude <strong>Oil</strong> NGL Total<br />
New reserves -50 0 -50<br />
Production 242 14 256<br />
Net annual change -292 -14 -306<br />
Proved reserves 3,979 338 4,317<br />
Natural gas reserves<br />
as of 12/31/06 (Bcf)<br />
Associated Non- Dry<br />
Dissolved Associated <strong>Gas</strong><br />
New reserves 2,742 -236 2,482<br />
Production 218 192 408<br />
Net annual change 2,524 -428 2,074<br />
Proved reserves 8,886 1,447 10,245<br />
Cost of drill<strong>in</strong>g and equipp<strong>in</strong>g wells<br />
Cost/ft. Cost/ Total Cost<br />
($) well ($) (thous. $)<br />
<strong>Oil</strong> 3,410 25,564,678 2,888,809<br />
<strong>Gas</strong> 2,120 15,350,642 107,454<br />
Dry 2,799 16,946,151 203,354<br />
Marg<strong>in</strong>al oil wells<br />
<strong>Produc<strong>in</strong>g</strong> marg<strong>in</strong>al wells 154<br />
Crude oil production <strong>in</strong> bbls. (thous.) 326<br />
Crude oil production b/d (thous.) 1<br />
Marg<strong>in</strong>al natural gas wells<br />
as of 12/31/06<br />
<strong>Produc<strong>in</strong>g</strong> marg<strong>in</strong>al wells 0<br />
Natural gas production (MMcf) 0<br />
Federal onshore m<strong>in</strong>eral lease royalties<br />
<strong>Oil</strong> $ 3,096,217<br />
<strong>Gas</strong> $ 15,133,069<br />
Total Royalties $24,144,428<br />
Horizontal wells data<br />
Horizontal wells drilled 81<br />
Average number of employees<br />
<strong>Oil</strong> and natural gas extraction 10,434<br />
Refi n<strong>in</strong>g 414<br />
Transportation 0<br />
Wholesale 1,355<br />
Retail 1,804<br />
Pipel<strong>in</strong>e construction 481<br />
<strong>Oil</strong>fi eld mach<strong>in</strong>ery 0<br />
Total petroleum <strong>in</strong>dustry 14,488<br />
Discovery of Alaska’s first commercial<br />
oilfield took place near Katella <strong>in</strong> 1902. The<br />
Trans-Alaska pipel<strong>in</strong>e was completed <strong>in</strong> 1977.<br />
ALASKA<br />
COMPILED BY <strong>IPAA</strong> FEBRUARY 2009 AMERICA’S INDEPENDENT 31
ARIZONA<br />
Mohave<br />
Cocon<strong>in</strong>o<br />
Navajo<br />
Apache<br />
Yavapai<br />
La Paz<br />
Gila<br />
Maricopa<br />
Greenlee<br />
Yuma<br />
P<strong>in</strong>al<br />
Graham<br />
Pima<br />
Cochise<br />
Counties with oil and/or gas production<br />
Santa Cruz<br />
Background Information<br />
Counties<br />
Number of counties 15<br />
With oil and/or gas production 1<br />
First year of production<br />
Crude oil 1958<br />
Natural gas 1955<br />
Year and amount of peak production<br />
Crude oil — 3,370 thous. bbls. 1968<br />
Natural gas —3,161 MMcf 1966<br />
Deepest produc<strong>in</strong>g well (ft.)<br />
Crude oil 6,382<br />
Natural gas 5,771<br />
Year and depth of deepest well drilled (ft.)<br />
1981 18,013<br />
Cumulative number of total wells drilled<br />
as of 12/31/06 (exclud<strong>in</strong>g service wells)<br />
<strong>Oil</strong> wells 71 6%<br />
<strong>Gas</strong> wells 52 5%<br />
Dry holes 985 89%<br />
Total 1,108 100%<br />
Value of <strong>Oil</strong> and <strong>Gas</strong><br />
Average wellhead price*<br />
(2006)<br />
Crude oil ($/bbl.) $61.51<br />
Natural gas ($Mcf) $ 5.88<br />
Wellhead value of production<br />
(2006, <strong>in</strong> thous. $)<br />
Crude oil $ 3,383<br />
Natural gas $3,593<br />
Total $ 6,976<br />
Average natural gas price<br />
(2006, $/Mcf)<br />
Residential consumers $ 16.32<br />
Commercial consumers $ 12.11<br />
Industrial consumers $ 9.90<br />
Electric utilities $ 6.48<br />
City Gate $ 7.67<br />
Severance taxes paid $7,979<br />
(2006, <strong>in</strong> thous. $)<br />
Cumulative crude oil wellhead value<br />
as of 12/31/06 (thous. $) $70,805,188<br />
ARIZONA<br />
Cumulative production & new reserves<br />
as of 12/31/06<br />
Crude NGL Natural<br />
<strong>Oil</strong> (mill. bbls.) Total <strong>Gas</strong> (Bcf)<br />
Reserves NA 0 NA NA<br />
Production NA 0 NA NA<br />
32 AMERICA’S INDEPENDENT COMPILED BY <strong>IPAA</strong> FEBRUARY 2009
2006 <strong>Industry</strong> Statistics<br />
Number of wells drilled<br />
Exploratory Development Total<br />
<strong>Oil</strong> NA NA NA<br />
<strong>Gas</strong> NA NA NA<br />
Dry 1 NA 1<br />
Total 1 NA 1<br />
Total footage drilled<br />
(thous. ft.)<br />
Exploratory Development Total<br />
<strong>Oil</strong> NA NA NA<br />
<strong>Gas</strong> NA NA NA<br />
Dry 7.0 NA 7.0<br />
Total 7.0 NA 7.0<br />
(Note: Totals may not add due to round<strong>in</strong>g.)<br />
New-field wildcats drilled 1<br />
Footage (thous. ft.) 7.0<br />
Average rotary rigs active 0<br />
Permits 12<br />
<strong>State</strong>-wide rank<br />
Crude <strong>Oil</strong> Natural <strong>Gas</strong><br />
Wells drilled 31st 32nd<br />
Production 31st 30th<br />
Reserves (2006) NA NA<br />
Number of operators 3<br />
Number of produc<strong>in</strong>g wells<br />
(12/31/06)<br />
Crude oil 25<br />
Natural gas 5<br />
Total 30<br />
Average production<br />
Crude oil (thous. b/d) 0<br />
NGL (thous. b/d) 0<br />
Natural gas (MMcf/day) 1<br />
Natural gas marketed production<br />
(MMcf) 611<br />
Average output per produc<strong>in</strong>g well<br />
Crude oil (bbls.) 2,121<br />
Natural gas (Mcf) 104,379<br />
Coalbed methane (YTD MMcf)<br />
<strong>Oil</strong> Wells<br />
<strong>Gas</strong> Wells<br />
Daily Average (MMcf) / Well<br />
Heavy oil (YTD BBls, <strong>in</strong> thous.)<br />
Wells<br />
Av. Bbls per day<br />
Av. Bbls per well/d<br />
NA<br />
NA<br />
NA<br />
NA<br />
NA<br />
NA<br />
NA<br />
Source: EIA for production and IHS for wells drilled.<br />
* <strong>State</strong> Data.<br />
2006 Latest Available Data<br />
Petroleum reserves<br />
as of 12/31/06 (mill. bbls.)<br />
Crude <strong>Oil</strong> NGL Total<br />
New reserves NA NA NA<br />
Production NA NA NA<br />
Net annual change NA NA NA<br />
Proved reserves NA NA NA<br />
Natural gas reserves<br />
as of 12/31/06 (Bcf)<br />
Associated Non- Dry<br />
Dissolved Associated <strong>Gas</strong><br />
New reserves NA NA NA<br />
Production NA NA NA<br />
Net annual change NA NA NA<br />
Proved reserves NA NA NA<br />
Cost of drill<strong>in</strong>g and equipp<strong>in</strong>g wells<br />
Cost/ft. Cost/ Total Cost<br />
($) well ($) (thous. $)<br />
<strong>Oil</strong> NA NA NA<br />
<strong>Gas</strong> NA NA NA<br />
Dry 146 1,021,580 1,022<br />
Marg<strong>in</strong>al oil wells<br />
<strong>Produc<strong>in</strong>g</strong> marg<strong>in</strong>al wells 24<br />
Crude oil production <strong>in</strong> bbls. (thous.) 40<br />
Crude oil production b/d (thous.) 0<br />
Marg<strong>in</strong>al natural gas wells<br />
as of 12/31/06<br />
<strong>Produc<strong>in</strong>g</strong> marg<strong>in</strong>al wells 2<br />
Natural gas production (MMcf) 26<br />
Federal onshore m<strong>in</strong>eral lease royalties<br />
<strong>Oil</strong> $ 510,100<br />
<strong>Gas</strong> $ 53,591<br />
Total Royalties $ 69,493,470<br />
Horizontal wells data<br />
Horizontal wells drilled 0<br />
Average number of employees<br />
<strong>Oil</strong> and natural gas extraction 268<br />
Refi n<strong>in</strong>g 215<br />
Transportation 429<br />
Wholesale 1,935<br />
Retail 16,582<br />
Pipel<strong>in</strong>e construction 779<br />
<strong>Oil</strong>fi eld mach<strong>in</strong>ery 0<br />
Total petroleum <strong>in</strong>dustry 20,208<br />
In 1902, Joseph Heslet drilled northern<br />
Arizona’s fi rst oil well near Paulden oil seeps.<br />
Although it was a dry hole, prospectors<br />
and speculators swarmed <strong>in</strong>. By 1918, no<br />
commercial oil deposits were found, and the<br />
boom was over.<br />
ARIZONA<br />
COMPILED BY <strong>IPAA</strong> FEBRUARY 2009 AMERICA’S INDEPENDENT 33
ARKANSAS<br />
Benton<br />
Fulton<br />
Carroll<br />
Boone<br />
Randolph<br />
Marion Baxter<br />
Sharp<br />
Izard<br />
Madison<br />
Lawrence<br />
Wash<strong>in</strong>gton<br />
Newton Searcy<br />
Stone<br />
Independence<br />
Crawford<br />
Johnson<br />
Van Buren<br />
Frankl<strong>in</strong><br />
Cleburne<br />
Pope<br />
Conway<br />
White<br />
Sebastian Logan<br />
Faulkner<br />
Yell<br />
Perry<br />
Scott<br />
Prairie<br />
Pulaski Lonoke<br />
Polk Montgomery<br />
Pike<br />
Howard<br />
Sevier<br />
Little River Hempstead<br />
Sal<strong>in</strong>e<br />
Garland<br />
Hot Spr<strong>in</strong>g Grant Jefferson<br />
Arkansas<br />
Clark<br />
Dallas<br />
L<strong>in</strong>coln<br />
Cleveland<br />
Desha<br />
Nevada<br />
Ouachita<br />
Calhoun<br />
Drew<br />
Bradley<br />
Miller<br />
Columbia<br />
Union<br />
Ashley<br />
Chicot<br />
Lafayette<br />
Jackson<br />
Clay<br />
Greene<br />
Craighead<br />
Mississippi<br />
Po<strong>in</strong>sett<br />
Cross<br />
Woodruff<br />
Crittenden<br />
St. Francis<br />
Lee<br />
Monroe<br />
Phillips<br />
Counties with oil and/or gas production<br />
Background Information<br />
Counties<br />
Number of counties 75<br />
With oil and/or gas production 25<br />
First year of production<br />
Crude oil 1921<br />
Natural gas 1889<br />
Year and amount of peak production<br />
Crude oil — 77,398 thous. bbls. 1925<br />
Natural gas — 224,446 MMcf 1996<br />
Deepest produc<strong>in</strong>g well (ft.)<br />
Crude oil 12,500<br />
Natural gas 19,850<br />
Year and depth of deepest well drilled (ft.)<br />
1992 20,661<br />
Cumulative number of total wells drilled<br />
as of 12/31/06 (exclud<strong>in</strong>g service wells)<br />
<strong>Oil</strong> wells 14,259 40%<br />
<strong>Gas</strong> wells 6,804 19%<br />
Dry holes 14,600 41%<br />
Total 35,763 100%<br />
Value of <strong>Oil</strong> and <strong>Gas</strong><br />
Average wellhead price<br />
(2006)<br />
Crude oil ($/bbl.) $ 58.67<br />
Natural gas ($Mcf) $ 6.43<br />
Wellhead value of production<br />
(2006, <strong>in</strong> thous. $)<br />
Crude oil $ 358,112<br />
Natural gas $ 1,242,649<br />
Total $ 1,600,761<br />
Average natural gas price<br />
(2006, $/Mcf)<br />
Residential consumers $ 14.15<br />
Commercial consumers $ 10.72<br />
Industrial consumers $ 9.51<br />
Electric utilities $ 6.38<br />
City Gate $ 7.96<br />
Severance taxes paid $15,078<br />
(2006, <strong>in</strong> thous. $)<br />
Cumulative crude oil wellhead value<br />
as of 12/31/06 (thous. $) $11,084,981<br />
ARKANSAS<br />
Cumulative production & new reserves<br />
as of 12/31/06<br />
Crude NGL Natural<br />
<strong>Oil</strong> (mill. bbls.) Total <strong>Gas</strong> (Bcf)<br />
Reserves 1,827 94 1,921 10,307<br />
Production 1,756 89 1,845 7,758<br />
34 AMERICA’S INDEPENDENT COMPILED BY <strong>IPAA</strong> FEBRUARY 2009
2006 <strong>Industry</strong> Statistics<br />
Number of wells drilled<br />
Exploratory Development Total<br />
<strong>Oil</strong> 1 38 39<br />
<strong>Gas</strong> 53 342 395<br />
Dry 24 37 61<br />
Total 78 417 495<br />
Total footage drilled<br />
(thous. ft.)<br />
Exploratory Development Total<br />
<strong>Oil</strong> 5.0 136.1 141.1<br />
<strong>Gas</strong> 343.0 2,058.9 2,401.9<br />
Dry 144.3 194.5 338.8<br />
Total 492.3 2,389.5 2,881.8<br />
(Note: Totals may not add due to round<strong>in</strong>g.)<br />
New-field wildcats drilled 55<br />
Footage (thous. ft.) 348.7<br />
Average rotary rigs active 24<br />
Permits 801<br />
<strong>State</strong>-wide rank<br />
Crude <strong>Oil</strong> Natural <strong>Gas</strong><br />
Wells drilled 17th 17th<br />
Production 17th 15th<br />
Reserves (2006) 19th 18th<br />
Number of operators 315<br />
Number of produc<strong>in</strong>g wells<br />
(12/31/06)<br />
Crude oil 2,505<br />
Natural gas 4,481<br />
Total 6,986<br />
Average production<br />
Crude oil (thous. b/d) 14<br />
NGL (thous. b/d) 0<br />
Natural gas (MMcf/day) 529<br />
Natural gas marketed production<br />
(MMcf) 193,258<br />
Average output per produc<strong>in</strong>g well<br />
Crude oil (bbls.) 2,113<br />
Natural gas (Mcf) 43,069<br />
Coalbed methane (YTD MMcf) 2,268<br />
<strong>Oil</strong> Wells 0<br />
<strong>Gas</strong> Wells 45<br />
Daily Average (MMcf) / Well 6<br />
Heavy oil (YTD BBls, <strong>in</strong> thous.)<br />
Wells<br />
Av. Bbls per day<br />
Av. Bbls per well/d<br />
NA<br />
NA<br />
NA<br />
NA<br />
Source: EIA for production and IHS for wells drilled.<br />
2006 Latest Available Data<br />
Petroleum reserves<br />
as of 12/31/06 (mill. bbls.)<br />
Crude <strong>Oil</strong> NGL Total<br />
New reserves 3 1 4<br />
Production 6 0 6<br />
Net annual change -3 1 -2<br />
Proved reserves 37 4 41<br />
Natural gas reserves<br />
as of 12/31/06 (Bcf)<br />
Associated Non- Dry<br />
Dissolved Associated <strong>Gas</strong><br />
New reserves 3 489 493<br />
Production 5 183 188<br />
Net annual change -2 306 305<br />
Proved reserves 44 2,227 2,269<br />
Cost of drill<strong>in</strong>g and equipp<strong>in</strong>g wells<br />
Cost/ft. Cost/ Total Cost<br />
($) well ($) (thous. $)<br />
<strong>Oil</strong> 140 505,825 19,727<br />
<strong>Gas</strong> 216 1,311,007 517,848<br />
Dry 153 852,125 51,980<br />
Marg<strong>in</strong>al oil wells<br />
<strong>Produc<strong>in</strong>g</strong> marg<strong>in</strong>al wells 2,883<br />
Crude oil production <strong>in</strong> bbls. (thous.) 2,259<br />
Crude oil production b/d (thous.) 8<br />
Marg<strong>in</strong>al natural gas wells<br />
as of 12/31/06<br />
<strong>Produc<strong>in</strong>g</strong> marg<strong>in</strong>al wells 2,888<br />
Natural gas production (MMcf) 38,001<br />
Federal onshore m<strong>in</strong>eral lease royalties<br />
<strong>Oil</strong> $ 244<br />
<strong>Gas</strong> $ 8,974,165<br />
Total Royalties $ 16,514,329<br />
Horizontal wells data<br />
Horizontal wells drilled 107<br />
Average number of employees<br />
<strong>Oil</strong> and natural gas extraction 2,926<br />
Refi n<strong>in</strong>g 633<br />
Transportation 1,879<br />
Wholesale 2,234<br />
Retail 12,586<br />
Pipel<strong>in</strong>e construction 402<br />
<strong>Oil</strong>fi eld mach<strong>in</strong>ery 0<br />
Total petroleum <strong>in</strong>dustry 20,660<br />
The Busey-Armstrong No. 1 well came<br />
<strong>in</strong> on Jan. 10, 1921, and quickly catapulted the<br />
population of El Dorado from 4,000 to 25,000.<br />
H. L. Hunt arrived with a borrowed $50 and<br />
jo<strong>in</strong>ed lease traders and speculators at the<br />
Garrett Hotel — where fortunes were made<br />
and lost.<br />
ARKANSAS<br />
COMPILED BY <strong>IPAA</strong> FEBRUARY 2009 AMERICA’S INDEPENDENT 35
Del Norte<br />
Siskiyou<br />
Modoc<br />
CALIFORNIA<br />
Humboldt<br />
Shasta<br />
Tr<strong>in</strong>ity<br />
Lassen<br />
Tehama<br />
Plumas<br />
Butte<br />
Glenn<br />
Sierra<br />
Mendoc<strong>in</strong>o<br />
Yuba Nevada<br />
Colusa<br />
Placer<br />
Lake Sutter<br />
El Dorado<br />
Yolo<br />
Sonoma<br />
Alp<strong>in</strong>e<br />
Napa SacramentoAmador<br />
Solano<br />
Calaveras<br />
Mar<strong>in</strong><br />
Tuolumne<br />
Contra CostaSan Joaqu<strong>in</strong><br />
San Francisco<br />
Alameda<br />
Stanislaus Mariposa<br />
San Mateo<br />
Santa Clara Merced Madera<br />
Santa Cruz<br />
Mono<br />
San Benito<br />
Monterey<br />
Fresno<br />
K<strong>in</strong>gs<br />
Tulare<br />
Inyo<br />
San Luis Obispo<br />
Kern<br />
Santa Barbara<br />
San Bernard<strong>in</strong>o<br />
Ventura<br />
Los Angeles<br />
Orange<br />
Riverside<br />
Counties with oil and/or gas production<br />
San Diego<br />
Imperial<br />
Background Information<br />
Counties<br />
Number of counties 58<br />
With oil and/or gas production 29<br />
First year of production<br />
Crude oil 1861<br />
Natural gas 1889<br />
Year and amount of peak production<br />
Crude oil —423,877 thous. bbls. 1985<br />
Natural gas —714,893 MMcf 1968<br />
Deepest produc<strong>in</strong>g well (ft.)<br />
Crude oil 15,177<br />
Natural gas 18,114<br />
Year and depth of deepest well drilled (ft.)<br />
1993 24,426<br />
Cumulative number of total wells drilled<br />
as of 12/31/06 (exclud<strong>in</strong>g service wells)<br />
<strong>Oil</strong> wells 145,055 79%<br />
<strong>Gas</strong> wells 6,098 3%<br />
Dry holes 33,224 18%<br />
Total 184,377 100%<br />
Value of <strong>Oil</strong> and <strong>Gas</strong><br />
Average wellhead price<br />
(2006)<br />
Crude oil ($/bbl.) $ 54.78<br />
Natural gas ($Mcf) $ 6.47<br />
Wellhead value of production<br />
(2006, <strong>in</strong> thous. $)<br />
Crude oil $ 12,240,536<br />
Natural gas $ 2,039,402<br />
Total $ 14,279,938<br />
Average natural gas price<br />
(2006, $/Mcf)<br />
Residential consumers $ 11.79<br />
Commercial consumers $ 10.43<br />
Industrial consumers $ 9.30<br />
Electric utilities $ 6.71<br />
City Gate $ 6.76<br />
Severance taxes paid $328,876<br />
(2006, <strong>in</strong> thous. $)<br />
CALIFORNIA<br />
Cumulative crude oil wellhead value<br />
as of 12/31/06 (thous. $) $210,900,625<br />
Cumulative production & new reserves<br />
as of 12/31/06<br />
Crude NGL Natural<br />
<strong>Oil</strong> (mill. bbls.) Total <strong>Gas</strong> (Bcf)<br />
Reserves 31,029 1,553 32,582 46,221<br />
Production 24,608 1,391 25,999 36,493<br />
36 AMERICA’S INDEPENDENT COMPILED BY <strong>IPAA</strong> FEBRUARY 2009
2006 <strong>Industry</strong> Statistics<br />
Number of wells drilled<br />
Exploratory Development Total<br />
<strong>Oil</strong> 4 2,286 2,290<br />
<strong>Gas</strong> 5 124 129<br />
Dry 21 54 75<br />
Total 30 2,464 2,494<br />
Total footage drilled<br />
(thous. ft.)<br />
Exploratory Development Total<br />
<strong>Oil</strong> 11.4 5,474.4 5,485.8<br />
<strong>Gas</strong> 25.1 772.9 798.0<br />
Dry 140.9 275.0 415.9<br />
Total 177.5 6,522.3 6,699.8<br />
(Note: Totals may not add due to round<strong>in</strong>g.)<br />
New-field wildcats drilled 13<br />
Footage (thous. ft.) 80.9<br />
Average rotary rigs active 33<br />
Permits 4,149<br />
<strong>State</strong>-wide rank<br />
Crude <strong>Oil</strong> Natural <strong>Gas</strong><br />
Wells drilled 3rd 18th<br />
Production 4th 12th<br />
Reserves (2006) 4th 15th<br />
Number of operators 396<br />
Number of produc<strong>in</strong>g wells<br />
(12/31/06)<br />
Crude oil 49,705<br />
Natural gas 1,715<br />
Total 51,420<br />
Average production<br />
Crude oil (thous. b/d) 611<br />
NGL (thous. b/d) 0.6<br />
Natural gas (MMcf/day) 248<br />
Natural gas marketed production<br />
(MMcf) 315,209<br />
Average output per produc<strong>in</strong>g well<br />
Crude oil (bbls.) 4,484<br />
Natural gas (Mcf) 52,772<br />
Coalbed methane (YTD MMcf)<br />
<strong>Oil</strong> Wells<br />
<strong>Gas</strong> Wells<br />
Daily Average (MMcf) / Well<br />
NA<br />
NA<br />
NA<br />
Heavy oil (YTD BBls, <strong>in</strong> thous.) 214,134<br />
Wells 45,095<br />
Av. Bbls per day 586.7<br />
Av. Bbls per well/d 4,749<br />
Source: EIA for production and IHS for wells drilled.<br />
2006 Latest Available Data<br />
Petroleum reserves<br />
as of 12/31/06 (mill. bbls.)<br />
Crude <strong>Oil</strong> NGL Total<br />
New reserves 176 6 182<br />
Production 222 11 233<br />
Net annual change -46 -5 -51<br />
Proved reserves 3,389 132 3,521<br />
Natural gas reserves<br />
as of 12/31/06 (Bcf)<br />
Associated Non- Dry<br />
Dissolved Associated <strong>Gas</strong><br />
New reserves -250 69 -179<br />
Production 180 88 255<br />
Net annual change -439 -19 -434<br />
Proved reserves 2,155 780 2,794<br />
Cost of drill<strong>in</strong>g and equipp<strong>in</strong>g wells<br />
Cost/ft. Cost/ Total Cost<br />
($) well ($) (thous. $)<br />
<strong>Oil</strong> 471 1,128,932 2,585,255<br />
<strong>Gas</strong> 176 1,087,583 140,298<br />
Dry 283 1,566,758 177,507<br />
Marg<strong>in</strong>al oil wells<br />
<strong>Produc<strong>in</strong>g</strong> marg<strong>in</strong>al wells 36,126<br />
Crude oil production <strong>in</strong> bbls. (thous.) 69,591<br />
Crude oil production b/d (thous.) 191<br />
Marg<strong>in</strong>al natural gas wells<br />
as of 12/31/06<br />
<strong>Produc<strong>in</strong>g</strong> marg<strong>in</strong>al wells 835<br />
Natural gas production (MMcf) 10,121<br />
Federal onshore m<strong>in</strong>eral lease royalties<br />
<strong>Oil</strong> $ 81,483,968<br />
<strong>Gas</strong> $ 5,719,014<br />
Total Royalties $ 87,202,982<br />
Horizontal wells data<br />
Horizontal wells drilled 150<br />
Average number of employees<br />
<strong>Oil</strong> and natural gas extraction 17,988<br />
Refi n<strong>in</strong>g 12,992<br />
Transportation 3,740<br />
Wholesale 4,843<br />
Retail 54,180<br />
Pipel<strong>in</strong>e construction 1,854<br />
<strong>Oil</strong>fi eld mach<strong>in</strong>ery 6,480<br />
Total petroleum <strong>in</strong>dustry 102,077<br />
In the early 1860s, Josiah Stanford dug<br />
about 30 tunnels <strong>in</strong>to Sulphur Mounta<strong>in</strong> near<br />
Santa Paula, slant<strong>in</strong>g them upwards so oil<br />
would fl ow down to the entrances. Stanford’s<br />
tunnels produced more oil <strong>in</strong> California than<br />
any other production method of the day.<br />
CALIFORNIA<br />
COMPILED BY <strong>IPAA</strong> FEBRUARY 2009 AMERICA’S INDEPENDENT 37
Sedgwick<br />
COLORADO<br />
Moffat<br />
Rio Blanco<br />
Routt<br />
Jackson<br />
Grand<br />
Larimer<br />
Gilp<strong>in</strong><br />
Boulder<br />
Broomfield<br />
Weld<br />
Adams<br />
Morgan<br />
Logan<br />
Wash<strong>in</strong>gton<br />
Phillips<br />
Yuma<br />
Garfield<br />
Eagle<br />
Clear Creek Denver<br />
Summit<br />
Jefferson<br />
Arapahoe<br />
Mesa<br />
Delta<br />
Pitk<strong>in</strong><br />
Gunnison<br />
Lake<br />
Chaffee<br />
Park<br />
Teller<br />
Douglas<br />
El Paso<br />
Elbert<br />
L<strong>in</strong>coln<br />
Kit Carson<br />
Cheyenne<br />
Montrose<br />
Fremont<br />
Crowley<br />
Kiowa<br />
San Miguel<br />
Ouray<br />
H<strong>in</strong>sdale<br />
Saguache<br />
Custer<br />
Pueblo<br />
Otero<br />
Bent<br />
Prowers<br />
Dolores<br />
San Juan<br />
M<strong>in</strong>eral<br />
Rio Grande<br />
Alamosa<br />
Huerfano<br />
Montezuma<br />
La Plata<br />
Archuleta<br />
Conejos<br />
Costilla<br />
Las Animas<br />
Baca<br />
Counties with oil and/or gas production<br />
Background Information<br />
Counties<br />
Number of counties 63<br />
With oil and/or gas production 37<br />
First year of production<br />
Crude oil 1887<br />
Natural gas 1893<br />
Year and amount of peak production<br />
Crude oil — 58,516 thous. bbls. 1956<br />
Natural gas — 1,217,865 MMcf 2006<br />
Deepest produc<strong>in</strong>g well (ft.)<br />
Crude oil 12,651<br />
Natural gas 18,535<br />
Year and depth of deepest well drilled (ft.)<br />
1987 22,092<br />
Cumulative number of total wells drilled<br />
as of 12/31/06 (exclud<strong>in</strong>g service wells)<br />
<strong>Oil</strong> wells 13,504 18%<br />
<strong>Gas</strong> wells 34,025 47%<br />
Dry holes 25,426 35%<br />
Total 72,955 100%<br />
Value of <strong>Oil</strong> and <strong>Gas</strong><br />
Average wellhead price<br />
(2006)<br />
Crude oil ($/bbl.) $ 63.80<br />
Natural gas ($Mcf) $ 6.12<br />
Wellhead value of production<br />
(2006, <strong>in</strong> thous. $)<br />
Crude oil $ 1,492,282<br />
Natural gas $ 7,361,265<br />
Total $ 8,853,547<br />
Average natural gas price<br />
(2006, $/Mcf)<br />
Residential consumers $ 10.45<br />
Commercial consumers $ 9.61<br />
Industrial consumers $ 11.53<br />
Electric utilities $ 6.22<br />
City Gate $ 7.61<br />
Severance taxes paid $196,668<br />
(2006, <strong>in</strong> thous. $)<br />
COLORADO<br />
Cumulative crude oil wellhead value<br />
as of 12/31/06 (thous. $) $22,780,004<br />
Cumulative production & new reserves<br />
as of 12/31/06<br />
Crude NGL Natural<br />
<strong>Oil</strong> (mill. bbls.) Total <strong>Gas</strong> (Bcf)<br />
Reserves 2,200 1,014 3,214 34,404<br />
Production 1,950 523 2,473 16,494<br />
38 AMERICA’S INDEPENDENT COMPILED BY <strong>IPAA</strong> FEBRUARY 2009
2006 <strong>Industry</strong> Statistics<br />
Number of wells drilled<br />
Exploratory Development Total<br />
<strong>Oil</strong> 3 36 39<br />
<strong>Gas</strong> 104 2,730 2,834<br />
Dry 51 79 130<br />
Total 158 2,845 3,003<br />
Total footage drilled<br />
(thous. ft.)<br />
Exploratory Development Total<br />
<strong>Oil</strong> 15.1 236.6 251.7<br />
<strong>Gas</strong> 560.9 15,843.9 16,404.8<br />
Dry 271.7 329.9 601.6<br />
Total 847.8 16,410.4 17,258.2<br />
(Note: Totals may not add due to round<strong>in</strong>g.)<br />
New-field wildcats drilled 101<br />
Footage (thous. ft.) 512.8<br />
Average rotary rigs active 89<br />
Permits 5,888<br />
<strong>State</strong>-wide rank<br />
Crude <strong>Oil</strong> Natural <strong>Gas</strong><br />
Wells drilled 18th 8th<br />
Production 12th 7th<br />
Reserves (2006) 12th 5th<br />
Number of operators 353<br />
Number of produc<strong>in</strong>g wells<br />
(12/31/06)<br />
Crude oil 5,049<br />
Natural gas 28,407<br />
Total 33,456<br />
Average production<br />
Crude oil (thous. b/d) 31<br />
NGL (thous. b/d) 34.6<br />
Natural gas (MMcf/day) 3,337<br />
Natural gas marketed production<br />
(MMcf) 1,202,821<br />
Average output per produc<strong>in</strong>g well<br />
Crude oil (bbls.) 2,249<br />
Natural gas (Mcf) 42,872<br />
Coalbed methane (YTD MMcf) 517,561<br />
<strong>Oil</strong> Wells 8<br />
<strong>Gas</strong> Wells 4,052<br />
Daily Average (MMcf) / Well 1,418<br />
Heavy oil (YTD BBls, <strong>in</strong> thous.) 22<br />
Wells 23<br />
Av. Bbls per day 0.1<br />
Av. Bbls per well/d 978<br />
Source: EIA for production and IHS for wells drilled.<br />
2006 Latest Available Data<br />
Petroleum reserves<br />
as of 12/31/06 (mill. bbls.)<br />
Crude <strong>Oil</strong> NGL Total<br />
New reserves 42 26 68<br />
Production 18 32 50<br />
Net annual change 24 -6 18<br />
Proved reserves 274 478 752<br />
Natural gas reserves<br />
as of 12/31/06 (Bcf)<br />
Associated Non- Dry<br />
Dissolved Associated <strong>Gas</strong><br />
New reserves 311 1,460 1,727<br />
Production 96 1,115 1,174<br />
Net annual change 215 345 553<br />
Proved reserves 1,541 16,141 17,149<br />
Cost of drill<strong>in</strong>g and equipp<strong>in</strong>g wells<br />
Cost/ft. Cost/ Total Cost<br />
($) well ($) (thous. $)<br />
<strong>Oil</strong> 218 1,407,770 54,903<br />
<strong>Gas</strong> 374 2,164,209 133,367<br />
Dry 196 905,546 17,721<br />
Marg<strong>in</strong>al oil wells<br />
<strong>Produc<strong>in</strong>g</strong> marg<strong>in</strong>al wells 4,318<br />
Crude oil production <strong>in</strong> bbls. (thous.) 3,970<br />
Crude oil production b/d (thous.) 11<br />
Marg<strong>in</strong>al natural gas wells<br />
as of 12/31/06<br />
<strong>Produc<strong>in</strong>g</strong> marg<strong>in</strong>al wells 20,404<br />
Natural gas production (MMcf) 243,647<br />
Federal onshore m<strong>in</strong>eral lease royalties<br />
<strong>Oil</strong> $ 39,293,385<br />
<strong>Gas</strong> $ 399,527,690<br />
Total Royalties $526,645,502<br />
Horizontal wells data<br />
Horizontal wells drilled 29<br />
Average number of employees<br />
<strong>Oil</strong> and natural gas extraction 15,589<br />
Refi n<strong>in</strong>g 0<br />
Transportation 2,139<br />
Wholesale 2,049<br />
Retail 12,559<br />
Pipel<strong>in</strong>e construction 2,988<br />
<strong>Oil</strong>fi eld mach<strong>in</strong>ery 148<br />
Total petroleum <strong>in</strong>dustry 35,472<br />
On a coal lease near Florence, <strong>in</strong> 1881,<br />
Alexander Cassidy drilled for water but hit oil<br />
<strong>in</strong>stead at 1,445 feet. At the height of the boom,<br />
25 oil companies and three refi neries operated<br />
out of Florence.<br />
COLORADO<br />
COMPILED BY <strong>IPAA</strong> FEBRUARY 2009 AMERICA’S INDEPENDENT 39
FLORIDA<br />
Santa Rosa<br />
Escambia<br />
Okaloosa<br />
Holmes<br />
Jackson<br />
Walton Wash<strong>in</strong>gton<br />
Gadsden<br />
Calhoun<br />
Leon<br />
Bay<br />
Liberty<br />
Wakulla<br />
Gulf Frankl<strong>in</strong><br />
Nassau<br />
Hamilton<br />
Jefferson<br />
Madison<br />
Baker<br />
Duval<br />
SuwanneeColumbia<br />
Taylor<br />
Union<br />
Clay<br />
Bradford<br />
Lafayette<br />
St. Johns<br />
Gilchrist<br />
Alachua Putnam<br />
Dixie<br />
Flagler<br />
Levy<br />
Marion<br />
Citrus<br />
Sumter Lake<br />
Hernando<br />
Pasco<br />
Volusia<br />
Sem<strong>in</strong>ole<br />
Orange<br />
P<strong>in</strong>ellas<br />
Hillsborough<br />
Polk<br />
Osceola<br />
Brevard<br />
Indian River<br />
Manatee Hardee<br />
DeSoto<br />
Sarasota<br />
Charlotte<br />
Okeechobee<br />
Highlands<br />
St. Lucie<br />
Mart<strong>in</strong><br />
Glades<br />
Lee<br />
Hendry<br />
Palm Beach<br />
Collier<br />
Broward<br />
Monroe<br />
Miami-Dade<br />
Counties with oil and/or gas production<br />
Background Information<br />
Counties<br />
Number of counties 67<br />
With oil and/or gas production 6<br />
First year of production<br />
Crude oil 1943<br />
Natural gas 1943<br />
Year and amount of peak production<br />
Crude oil — 47,536 thous. bbls. 1978<br />
Natural gas — 51,595 MMcf 1978<br />
Deepest produc<strong>in</strong>g well (ft.)<br />
Crude oil 18,806<br />
Natural gas 17,452<br />
Year and depth of deepest well drilled (ft.)<br />
2002 18,806<br />
Cumulative number of total wells drilled<br />
as of 12/31/06 (exclud<strong>in</strong>g service wells)<br />
<strong>Oil</strong> wells 319 27%<br />
<strong>Gas</strong> wells 3 0%<br />
Dry holes 889 73%<br />
Total 1,211 100%<br />
Value of <strong>Oil</strong> and <strong>Gas</strong><br />
Average wellhead price<br />
(2006)<br />
Crude oil ($/bbl.)<br />
Natural gas ($Mcf)<br />
Wellhead value of production<br />
(2006, <strong>in</strong> thous. $)<br />
Crude oil<br />
Natural gas<br />
Total<br />
Average natural gas price<br />
(2006, $/Mcf)<br />
NA<br />
NA<br />
NA<br />
NA<br />
NA<br />
Residential consumers $ 21.54<br />
Commercial consumers $ 13.91<br />
Industrial consumers $ 11.66<br />
Electric utilities $ 8.62<br />
City Gate $ 8.32<br />
Severance taxes paid $9,527<br />
(2006, <strong>in</strong> thous. $)<br />
Cumulative crude oil wellhead value<br />
as of 12/31/06 (thous. $) $9,352,458<br />
FLORIDA<br />
Cumulative production & new reserves<br />
as of 12/31/06<br />
Crude NGL Natural<br />
<strong>Oil</strong> (mill. bbls.) Total <strong>Gas</strong> (Bcf)<br />
Reserves 717 83 800 652<br />
Production 678 86 764 596<br />
40 AMERICA’S INDEPENDENT COMPILED BY <strong>IPAA</strong> FEBRUARY 2009
2006 <strong>Industry</strong> Statistics<br />
Number of wells drilled<br />
Exploratory Development Total<br />
<strong>Oil</strong> NA NA NA<br />
<strong>Gas</strong> NA NA NA<br />
Dry NA NA NA<br />
Total NA NA NA<br />
Total footage drilled<br />
(thous. ft.)<br />
Exploratory Development Total<br />
<strong>Oil</strong> NA NA NA<br />
<strong>Gas</strong> NA NA NA<br />
Dry NA NA NA<br />
Total NA NA NA<br />
(Note: Totals may not add due to round<strong>in</strong>g.)<br />
New-field wildcats drilled<br />
Footage (thous. ft.)<br />
NA<br />
NA<br />
Average rotary rigs active 0<br />
Permits 0<br />
<strong>State</strong>-wide rank<br />
Crude <strong>Oil</strong> Natural <strong>Gas</strong><br />
Wells drilled 29th 34th<br />
Production 21st 24th<br />
Reserves (2006) 20th 24th<br />
Number of operators 5<br />
Number of produc<strong>in</strong>g wells<br />
(12/31/06)<br />
Crude oil 65<br />
Natural gas 0<br />
Total 65<br />
Average production<br />
Crude oil (thous. b/d) 6<br />
NGL (thous. b/d) 0<br />
Natural gas (MMcf/day) 0<br />
Natural gas marketed production<br />
(MMcf) 2,540<br />
Average output per produc<strong>in</strong>g well<br />
Crude oil (bbls.) 36,146<br />
Natural gas (Mcf) 0<br />
Coalbed methane (YTD MMcf)<br />
<strong>Oil</strong> Wells<br />
<strong>Gas</strong> Wells<br />
Daily Average (MMcf) / Well<br />
NA<br />
NA<br />
NA<br />
2006 Latest Available Data<br />
Petroleum reserves<br />
as of 12/31/06 (mill. bbls.)<br />
Crude <strong>Oil</strong> NGL Total<br />
New reserves -19 -4 -23<br />
Production 2 0 2<br />
Net annual change -21 -4 -25<br />
Proved reserves 38 3 41<br />
Natural gas reserves<br />
as of 12/31/06 (Bcf)<br />
Associated Non- Dry<br />
Dissolved Associated <strong>Gas</strong><br />
New reserves -34 0 -30<br />
Production 3 0 2<br />
Net annual change -37 0 -32<br />
Proved reserves 50 0 45<br />
Cost of drill<strong>in</strong>g and equipp<strong>in</strong>g wells<br />
Cost/ft. Cost/ Total Cost<br />
($) well ($) (thous. $)<br />
<strong>Oil</strong> NA NA NA<br />
<strong>Gas</strong> NA NA NA<br />
Dry NA NA NA<br />
Marg<strong>in</strong>al oil wells<br />
<strong>Produc<strong>in</strong>g</strong> marg<strong>in</strong>al wells 8<br />
Crude oil production <strong>in</strong> bbls. (thous.) 20<br />
Crude oil production b/d (thous.) 0<br />
Marg<strong>in</strong>al natural gas wells<br />
as of 12/31/06<br />
<strong>Produc<strong>in</strong>g</strong> marg<strong>in</strong>al wells 0<br />
Natural gas production (MMcf)<br />
Federal onshore m<strong>in</strong>eral lease royalties<br />
<strong>Oil</strong> --<br />
<strong>Gas</strong> --<br />
Total Royalties $ 28,736<br />
Horizontal wells data<br />
Horizontal wells drilled<br />
Average number of employees<br />
NA<br />
<strong>Oil</strong> and natural gas extraction 1,513<br />
Refi n<strong>in</strong>g 465<br />
Transportation 3,540<br />
Wholesale 6,919<br />
Retail 39,969<br />
Pipel<strong>in</strong>e construction 722<br />
<strong>Oil</strong>fi eld mach<strong>in</strong>ery 0<br />
Total petroleum <strong>in</strong>dustry 53,128<br />
Heavy oil (YTD BBls, <strong>in</strong> thous.)<br />
Wells<br />
Av. Bbls per day<br />
Av. Bbls per well/d<br />
NA<br />
NA<br />
NA<br />
NA<br />
Source: EIA for production and IHS for wells drilled.<br />
Florida’s first produc<strong>in</strong>g well came <strong>in</strong><br />
on Sept. 26, 1943. Humble <strong>Oil</strong> Co. drilled<br />
to 11,626 feet with its Sunniland No. 1 well.<br />
The site is by the present day Big Cypress<br />
Preserve and a 30-m<strong>in</strong>ute drive from the resort<br />
city of Naples.<br />
FLORIDA<br />
COMPILED BY <strong>IPAA</strong> FEBRUARY 2009 AMERICA’S INDEPENDENT 41
Jo Daviess<br />
Stephenson<br />
W<strong>in</strong>nebago<br />
Boone<br />
McHenry<br />
Lake<br />
ILLINOIS<br />
Rock Island<br />
Mercer<br />
HendersonWarren<br />
Carroll<br />
Whiteside<br />
Henry<br />
Stark<br />
Knox<br />
Peoria<br />
Ogle<br />
DeKalb<br />
Lee<br />
Bureau<br />
La Salle<br />
Putnam<br />
Marshall<br />
Woodford Liv<strong>in</strong>gston<br />
Kane<br />
DuPage Cook<br />
Kendall<br />
Grundy<br />
Will<br />
Kankakee<br />
Iroquois<br />
Hancock<br />
McDonough<br />
Fulton<br />
Tazewell<br />
McLean<br />
Ford<br />
Mason<br />
Schuyler<br />
De Witt<br />
Logan<br />
Vermilion<br />
Champaign<br />
Brown Cass Menard<br />
Adams<br />
Piatt<br />
Macon<br />
Sangamon<br />
Douglas<br />
Pike Scott Morgan<br />
Moultrie<br />
Edgar<br />
Christian<br />
Coles<br />
Shelby<br />
Greene Macoup<strong>in</strong><br />
Cumberland Clark<br />
Calhoun<br />
Montgomery<br />
Jersey<br />
Eff<strong>in</strong>gham Jasper<br />
Fayette<br />
Crawford<br />
Bond<br />
Madison<br />
Clay<br />
Lawrence<br />
Cl<strong>in</strong>ton Marion<br />
Richland<br />
Monroe<br />
St. Clair<br />
Wash<strong>in</strong>gton<br />
Jefferson<br />
Wayne Wabash<br />
Edwards<br />
Randolph<br />
Perry<br />
Frankl<strong>in</strong><br />
Hamilton<br />
White<br />
Counties with oil and/or gas production<br />
Jackson<br />
Sal<strong>in</strong>e Gallat<strong>in</strong><br />
Williamson<br />
Hard<strong>in</strong><br />
Union Johnson<br />
Pope<br />
AlexanderPulaski<br />
Massac<br />
Background Information<br />
Counties<br />
Number of counties 102<br />
With oil and/or gas production 43<br />
First year of production<br />
Crude oil 1889<br />
Natural gas 1882<br />
Year and amount of peak production<br />
Crude oil — 147,647 thous. bbls. 1940<br />
Natural gas — 18,137 MMcf 1944<br />
Deepest produc<strong>in</strong>g well (ft.)<br />
Crude oil<br />
Natural gas<br />
NA<br />
NA<br />
Year and depth of deepest well drilled (ft.)<br />
1976 14,942<br />
Cumulative number of total wells drilled<br />
as of 12/31/06 (exclud<strong>in</strong>g service wells)<br />
<strong>Oil</strong> wells 64,519 55%<br />
<strong>Gas</strong> wells 1,164 1%<br />
Dry holes 51,534 44%<br />
Total 117,220 100%<br />
Value of <strong>Oil</strong> and <strong>Gas</strong><br />
Average wellhead price<br />
(2006)<br />
Crude oil ($/bbl.) $59.70<br />
Natural gas ($Mcf)<br />
NA<br />
Wellhead value of production<br />
(2006, <strong>in</strong> thous. $)<br />
Crude oil $616,283<br />
Natural gas<br />
NA<br />
Total $616,283<br />
Average natural gas price<br />
(2006, $/Mcf)<br />
Residential consumers $ 11.18<br />
Commercial consumers $ 10.91<br />
Industrial consumers $ 9.44<br />
Electric utilities $ 7.14<br />
City Gate $ 8.26<br />
Severance taxes paid --<br />
(2006, <strong>in</strong> thous. $)<br />
Cumulative crude oil wellhead value<br />
as of 12/31/06 (thous. $) $21,417,762<br />
ILLINOIS<br />
Cumulative production & new reserves<br />
as of 12/31/06<br />
Crude NGL Natural<br />
<strong>Oil</strong> (mill. bbls.) Total <strong>Gas</strong> (Bcf)<br />
Reserves 3,595 NA 3,595 NA<br />
Production 3,546 NA 3,546 NA<br />
42 AMERICA’S INDEPENDENT COMPILED BY <strong>IPAA</strong> FEBRUARY 2009
2006 <strong>Industry</strong> Statistics<br />
Number of wells drilled<br />
Exploratory Development Total<br />
<strong>Oil</strong> 8 257 265<br />
<strong>Gas</strong> NA 44 44<br />
Dry 59 110 169<br />
Total 67 411 478<br />
Total footage drilled<br />
(thous. ft.)<br />
Exploratory Development Total<br />
<strong>Oil</strong> 20.9 629.6 650.4<br />
<strong>Gas</strong> NA 41.2 41.2<br />
Dry 156.5 248.8 405.3<br />
Total 177.3 919.6 1,096.9<br />
(Note: Totals may not add due to round<strong>in</strong>g.)<br />
New-field wildcats drilled 31<br />
Footage (thous. ft.) 68.5<br />
Average rotary rigs active 0<br />
Permits 747<br />
<strong>State</strong>-wide rank<br />
Crude <strong>Oil</strong> Natural <strong>Gas</strong><br />
Wells drilled 6th 23rd<br />
Production 15th 30th<br />
Reserves (2006) 15th NA<br />
Number of operators 843<br />
Number of produc<strong>in</strong>g wells*<br />
(12/31/06)<br />
Crude oil 16,228<br />
Natural gas 43<br />
Total 16,271<br />
Average production<br />
Crude oil (thous. b/d) 28<br />
NGL (thous. b/d) 0<br />
Natural gas (MMcf/day) 0<br />
Natural gas marketed production<br />
(MMcf) 170<br />
Average output per produc<strong>in</strong>g well<br />
Crude oil (bbls.) 0<br />
Natural gas (Mcf) 0<br />
Coalbed methane (YTD MMcf)<br />
<strong>Oil</strong> Wells<br />
<strong>Gas</strong> Wells<br />
Daily Average (MMcf) / Well<br />
Heavy oil (YTD BBls, <strong>in</strong> thous.)<br />
Wells<br />
Av. Bbls per day<br />
Av. Bbls per well/d<br />
NA<br />
NA<br />
NA<br />
NA<br />
NA<br />
NA<br />
NA<br />
Source: EIA for production and IHS for wells drilled<br />
* World <strong>Oil</strong> for Number of produc<strong>in</strong>g wells.<br />
2006 Latest Available Data<br />
Petroleum reserves<br />
as of 12/31/06 (mill. bbls.)<br />
Crude <strong>Oil</strong> NGL Total<br />
New reserves 4 NA 4<br />
Production 10 NA 10<br />
Net annual change -6 NA -6<br />
Proved reserves 89 NA 89<br />
Natural gas reserves<br />
as of 12/31/06 (Bcf)<br />
Associated Non- Dry<br />
Dissolved Associated <strong>Gas</strong><br />
New reserves NA NA NA<br />
Production NA NA NA<br />
Net annual change NA NA NA<br />
Proved reserves NA NA NA<br />
Cost of drill<strong>in</strong>g and equipp<strong>in</strong>g wells<br />
Cost/ft. Cost/ Total Cost<br />
($) well ($) (thous. $)<br />
<strong>Oil</strong> 190 466,920 123,734<br />
<strong>Gas</strong> 459 430,422 18,939<br />
Dry 183 439,450 74,267<br />
Marg<strong>in</strong>al oil wells<br />
<strong>Produc<strong>in</strong>g</strong> marg<strong>in</strong>al wells 5,269<br />
Crude oil production <strong>in</strong> bbls. (thous.) 5,153<br />
Crude oil production b/d (thous.) 14<br />
Marg<strong>in</strong>al natural gas wells<br />
as of 12/31/06<br />
<strong>Produc<strong>in</strong>g</strong> marg<strong>in</strong>al wells 0<br />
Natural gas production (MMcf) 0<br />
Federal onshore m<strong>in</strong>eral lease royalties<br />
<strong>Oil</strong> $ 264,449<br />
<strong>Gas</strong> --<br />
Total Royalties $ 264,449<br />
Horizontal wells data<br />
Horizontal wells drilled 2<br />
Average number of employees<br />
<strong>Oil</strong> and natural gas extraction 2,610<br />
Refi n<strong>in</strong>g 4,519<br />
Transportation 5,896<br />
Wholesale 5,714<br />
Retail 26,326<br />
Pipel<strong>in</strong>e construction 1,120<br />
<strong>Oil</strong>fi eld mach<strong>in</strong>ery 20<br />
Total petroleum <strong>in</strong>dustry 46,205<br />
In 1882, drillers found commercial quantities<br />
of natural gas at Litchfi eld <strong>in</strong> Montgomery<br />
County. Total output from the fi eld by 1902 was<br />
only 6,576 barrels, but by 1940, Ill<strong>in</strong>ois Bas<strong>in</strong><br />
discoveries ranked Ill<strong>in</strong>ois 4th among produc<strong>in</strong>g<br />
states.<br />
ILLINOIS<br />
COMPILED BY <strong>IPAA</strong> FEBRUARY 2009 AMERICA’S INDEPENDENT 43
Lake<br />
Porter<br />
LaPorte<br />
Starke<br />
St. Joseph<br />
Marshall<br />
Elkhart<br />
Kosciusko<br />
LaGrange<br />
Noble<br />
Steuben<br />
DeKalb<br />
INDIANA<br />
Newton<br />
Jasper Pulaski<br />
White<br />
Fulton<br />
Cass Miami<br />
Whitley<br />
Allen<br />
Wabash Hunt<strong>in</strong>gton<br />
Wells Adams<br />
Counties with oil and/or gas production<br />
Benton<br />
Tippecanoe<br />
Warren<br />
Founta<strong>in</strong><br />
Montgomery<br />
Vermillion<br />
Parke<br />
Putnam<br />
Vigo<br />
Clay<br />
Owen<br />
Sullivan<br />
Greene<br />
Knox Daviess Mart<strong>in</strong><br />
Pike Dubois<br />
Gibson<br />
Carroll<br />
Cl<strong>in</strong>ton<br />
Boone<br />
Hendricks<br />
Morgan<br />
Howard<br />
Tipton<br />
Hamilton<br />
Marion<br />
Shelby<br />
Johnson<br />
Grant<br />
Blackford<br />
Delaware<br />
Madison<br />
Hancock<br />
Henry<br />
Rush<br />
Decatur<br />
Brown Bartholomew<br />
Monroe<br />
Ripley<br />
Jenn<strong>in</strong>gs<br />
Jackson<br />
Lawrence<br />
Jefferson<br />
Scott<br />
Wash<strong>in</strong>gton<br />
Orange<br />
Clark<br />
Floyd<br />
Crawford<br />
Harrison<br />
Jay<br />
Randolph<br />
Wayne<br />
Fayette Union<br />
Frankl<strong>in</strong><br />
Dearborn<br />
Ohio<br />
Switzerland<br />
VanderburghWarrick<br />
Posey<br />
Spencer<br />
Perry<br />
Background Information<br />
Counties<br />
Number of counties 92<br />
With oil and/or gas production 16<br />
First year of production<br />
Crude oil 1889<br />
Natural gas 1885<br />
Year and amount of peak production<br />
Crude oil — 12,833 thous. bbls. 1953<br />
Natural gas — 3,401 MMcf 2004<br />
Deepest produc<strong>in</strong>g well (ft.)<br />
Crude oil<br />
Natural gas<br />
NA<br />
NA<br />
Year and depth of deepest well drilled (ft.)<br />
1998 8,429<br />
Cumulative number of total wells drilled<br />
as of 12/31/06 (exclud<strong>in</strong>g service wells)<br />
<strong>Oil</strong> wells 6,312 36%<br />
<strong>Gas</strong> wells 1,144 6%<br />
Dry holes 10,274 58%<br />
Total 17,730 100%<br />
Value of <strong>Oil</strong> and <strong>Gas</strong><br />
Average wellhead price<br />
(2006)<br />
Crude oil ($/bbl.) $ 59.31<br />
Natural gas ($Mcf) $ 6.01<br />
Wellhead value of production<br />
(2006, <strong>in</strong> thous. $)<br />
Crude oil $102,666<br />
Natural gas $ 17,555<br />
Total $ 120,221<br />
Average natural gas price<br />
(2006, $/Mcf)<br />
Residential consumers $ 13.07<br />
Commercial consumers $ 1.55<br />
Industrial consumers $ 9.38<br />
Electric utilities $ 7.63<br />
City Gate $ 8.31<br />
Severance taxes paid $1,215<br />
(2006, <strong>in</strong> thous. $)<br />
Cumulative crude oil wellhead value<br />
as of 12/31/06 (thous. $) $3,549,726<br />
INDIANA<br />
Cumulative production & new reserves<br />
as of 12/31/06<br />
Crude NGL Natural<br />
<strong>Oil</strong> (mill. bbls.) Total <strong>Gas</strong> (Bcf)<br />
Reserves 552 NA 552 NA<br />
Production 546 NA 546 NA<br />
44 AMERICA’S INDEPENDENT COMPILED BY <strong>IPAA</strong> FEBRUARY 2009
2006 <strong>Industry</strong> Statistics<br />
Number of wells drilled<br />
Exploratory Development Total<br />
<strong>Oil</strong> 1 37 38<br />
<strong>Gas</strong> 9 13 22<br />
Dry 35 22 57<br />
Total 45 72 117<br />
Total footage drilled<br />
(thous. ft.)<br />
Exploratory Development Total<br />
<strong>Oil</strong> 3.9 62.4 66.3<br />
<strong>Gas</strong> 14.5 14.5 29.0<br />
Dry 64.7 36.2 100.9<br />
Total 83.0 113.1 196.2<br />
(Note: Totals may not add due to round<strong>in</strong>g.)<br />
New-field wildcats drilled 32<br />
Footage (thous. ft.) 54.2<br />
Average rotary rigs active 0<br />
Permits 341<br />
<strong>State</strong>-wide rank<br />
Crude <strong>Oil</strong> Natural <strong>Gas</strong><br />
Wells drilled 22nd 24th<br />
Production 25th 23rd<br />
Reserves (2006) 25th NA<br />
Number of operators 231<br />
Number of produc<strong>in</strong>g wells*<br />
(12/31/06)<br />
Crude oil 5,044<br />
Natural gas 1,059<br />
Total 6,103<br />
Average production<br />
Crude oil (thous. b/d) 5<br />
NGL (thous. b/d) 0<br />
Natural gas (MMcf/day) 0<br />
Natural gas marketed production<br />
(MMcf) 2,921<br />
Average output per produc<strong>in</strong>g well<br />
Crude oil (bbls.) 0<br />
Natural gas (Mcf) 0<br />
Coalbed methane (YTD MMcf)<br />
<strong>Oil</strong> Wells<br />
<strong>Gas</strong> Wells<br />
Daily Average (MMcf) / Well<br />
Heavy oil (YTD BBls, <strong>in</strong> thous.)<br />
Wells<br />
Av. Bbls per day<br />
Av. Bbls per well/d<br />
NA<br />
NA<br />
NA<br />
NA<br />
NA<br />
NA<br />
NA<br />
Source: EIA for production and IHS for wells drilled.<br />
* World <strong>Oil</strong> for Number of produc<strong>in</strong>g wells.<br />
2006 Latest Available Data<br />
Petroleum reserves<br />
as of 12/31/06 (mill. bbls.)<br />
Crude <strong>Oil</strong> NGL Total<br />
New reserves -3 NA -3<br />
Production 1 NA 1<br />
Net annual change -4 NA -4<br />
Proved reserves 12 NA 12<br />
Natural gas reserves<br />
as of 12/31/06 (Bcf)<br />
Associated Non- Dry<br />
Dissolved Associated <strong>Gas</strong><br />
New reserves NA NA NA<br />
Production NA NA NA<br />
Net annual change NA NA NA<br />
Proved reserves NA NA NA<br />
Cost of drill<strong>in</strong>g and equipp<strong>in</strong>g wells<br />
Cost/ft. Cost/ Total Cost<br />
($) well ($) (thous. $)<br />
<strong>Oil</strong> 162 282,700 10,743<br />
<strong>Gas</strong> 464 611,798 13,460<br />
Dry 229 404,725 23,069<br />
Marg<strong>in</strong>al oil wells<br />
<strong>Produc<strong>in</strong>g</strong> marg<strong>in</strong>al wells 1,061<br />
Crude oil production <strong>in</strong> bbls. (thous.) 1,085<br />
Crude oil production b/d (thous.) 3<br />
Marg<strong>in</strong>al natural gas wells<br />
as of 12/31/06<br />
<strong>Produc<strong>in</strong>g</strong> marg<strong>in</strong>al wells 0<br />
Natural gas production (MMcf) 0<br />
Federal onshore m<strong>in</strong>eral lease royalties<br />
<strong>Oil</strong> --<br />
<strong>Gas</strong> --<br />
Total Royalties $479<br />
Horizontal wells data<br />
Horizontal wells drilled 1<br />
Average number of employees<br />
<strong>Oil</strong> and natural gas extraction 394<br />
Refi n<strong>in</strong>g 0<br />
Transportation 3,597<br />
Wholesale 3,497<br />
Retail 23,590<br />
Pipel<strong>in</strong>e construction 1,030<br />
<strong>Oil</strong>fi eld mach<strong>in</strong>ery 0<br />
Total petroleum <strong>in</strong>dustry 32,108<br />
South of Francesville, Granville Bates<br />
fund natural gas while drill<strong>in</strong>g for oil <strong>in</strong> 1867.<br />
His discovery prompted little excitement at the<br />
time, s<strong>in</strong>ce the commercial potential of natural<br />
gas was years <strong>in</strong> the future.<br />
INDIANA<br />
COMPILED BY <strong>IPAA</strong> FEBRUARY 2009 AMERICA’S INDEPENDENT 45
KANSAS<br />
Cheyenne Rawl<strong>in</strong>s<br />
Decatur Norton<br />
Sherman<br />
Thomas<br />
Sheridan<br />
Graham<br />
Wallace Logan Gove Trego<br />
Greeley<br />
Wichita<br />
Scott<br />
Lane<br />
Ness<br />
Hodgeman<br />
Hamilton Kearny<br />
F<strong>in</strong>ney<br />
Gray Ford<br />
Stanton<br />
Grant<br />
Haskell<br />
Stevens Seward<br />
Meade<br />
Morton<br />
Clark<br />
Phillips<br />
Smith<br />
Rooks Osborne<br />
Ellis Russell<br />
Rush Barton<br />
Pawnee<br />
Stafford<br />
Edwards<br />
Pratt<br />
Kiowa<br />
Barber<br />
Comanche<br />
Republic<br />
Nemaha<br />
Jewell<br />
Marshall<br />
Brown Doniphan<br />
Wash<strong>in</strong>gton<br />
Atchison<br />
Cloud<br />
Mitchell<br />
Jackson<br />
Clay Pottawatomie<br />
Jefferson<br />
Riley<br />
Leavenworth<br />
Ottawa<br />
Wyandotte<br />
L<strong>in</strong>coln<br />
Geary WabaunseeShawnee<br />
Dick<strong>in</strong>son<br />
Douglas Johnson<br />
Sal<strong>in</strong>e<br />
Ellsworth<br />
Morris<br />
Osage Frankl<strong>in</strong> Miami<br />
Lyon<br />
McPherson<br />
Rice<br />
Marion<br />
Chase<br />
Anderson<br />
Coffey<br />
L<strong>in</strong>n<br />
Harvey<br />
Reno<br />
Greenwood Woodson<br />
Butler<br />
Allen<br />
Bourbon<br />
Sedgwick<br />
Wilson<br />
K<strong>in</strong>gman<br />
Neosho Crawford<br />
Elk<br />
Harper Sumner Cowley Chautauqua Montgomery Cherokee<br />
Labette<br />
Counties with oil and/or gas production<br />
Background Information<br />
Counties<br />
Number of counties 105<br />
With oil and/or gas production 90<br />
First year of production<br />
Crude oil 1889<br />
Natural gas 1882<br />
Year and amount of peak production<br />
Crude oil —124,204 thous. bbls. 1956<br />
Natural gas — 899,955 MMcf 1970<br />
Deepest produc<strong>in</strong>g well (ft.)<br />
Crude oil 8,480<br />
Natural gas 28,780<br />
Year and depth of deepest well drilled (ft.)<br />
1984 11,301<br />
Cumulative number of total wells drilled<br />
as of 12/31/06 (exclud<strong>in</strong>g service wells)<br />
<strong>Oil</strong> wells 126,766 47%<br />
<strong>Gas</strong> wells 32,613 12%<br />
Dry holes 108,641 41%<br />
Total 268,020 100%<br />
Value of <strong>Oil</strong> and <strong>Gas</strong><br />
Average wellhead price<br />
(2006)<br />
Crude oil ($/bbl.) $ 60.74<br />
Natural gas ($Mcf) $ 5.61<br />
Wellhead value of production<br />
(2006, <strong>in</strong> thous. $)<br />
Crude oil $ 2,165,442<br />
Natural gas $ 2,081,557<br />
Total $ 4,246,999<br />
Average natural gas price<br />
(2006, $/Mcf)<br />
Residential consumers $ 13.19<br />
Commercial consumers $ 12.44<br />
Industrial consumers $ 6.83<br />
Electric utilities $ 6.32<br />
City Gate $ 9.08<br />
Severance taxes paid $148,855<br />
(2006, <strong>in</strong> thous. $)<br />
Cumulative crude oil wellhead value<br />
as of 12/31/06 (thous. $) $48,764,204<br />
KANSAS<br />
Cumulative production & new reserves<br />
as of 12/31/06<br />
Crude NGL Natural<br />
<strong>Oil</strong> (mill. bbls.) Total <strong>Gas</strong> (Bcf)<br />
Reserves 6,418 1,452 7,870 44,549<br />
Production 6,151 1,303 7,454 40,389<br />
46 AMERICA’S INDEPENDENT COMPILED BY <strong>IPAA</strong> FEBRUARY 2009
2006 <strong>Industry</strong> Statistics<br />
Number of wells drilled<br />
Exploratory Development Total<br />
<strong>Oil</strong> 165 964 1,129<br />
<strong>Gas</strong> 54 1,161 1,215<br />
Dry 233 584 817<br />
Total 452 2,709 3,161<br />
Total footage drilled<br />
(thous. ft.)<br />
Exploratory Development Total<br />
<strong>Oil</strong> 699.7 3,133.9 3,833.6<br />
<strong>Gas</strong> 197.9 2,231.0 2,428.9<br />
Dry 958.1 2,161.5 3,119.7<br />
Total 1,855.7 7,526.5 9,382.1<br />
(Note: Totals may not add due to round<strong>in</strong>g.)<br />
New-field wildcats drilled 277<br />
Footage (thous. ft.) 1,112.5<br />
Average rotary rigs active 10<br />
Permits 5,524<br />
<strong>State</strong>-wide rank<br />
Crude <strong>Oil</strong> Natural <strong>Gas</strong><br />
Wells drilled 4th 9th<br />
Production 11th 9th<br />
Reserves (2006) 13th 11th<br />
Number of operators 2,084<br />
Number of produc<strong>in</strong>g wells<br />
(12/31/06)<br />
Crude oil 40,349<br />
Natural gas 19,891<br />
Total 60,240<br />
Average production<br />
Crude oil (thous. b/d) 98<br />
NGL (thous. b/d) 0<br />
Natural gas (MMcf/day) 1,036<br />
Natural gas marketed production<br />
(MMcf) 371,044<br />
Average output per produc<strong>in</strong>g well<br />
Crude oil (bbls.) 883<br />
Natural gas (Mcf) 19,005<br />
Coalbed methane (YTD MMcf) 23,687<br />
<strong>Oil</strong> Wells 6<br />
<strong>Gas</strong> Wells 2,374<br />
Daily Average (MMcf) / Well 65<br />
Heavy oil (YTD BBls, <strong>in</strong> thous.)<br />
Wells<br />
Av. Bbls per day<br />
Av. Bbls per well/d<br />
NA<br />
NA<br />
NA<br />
NA<br />
Source: EIA for production and IHS for wells drilled.<br />
2006 Latest Available Data<br />
Petroleum reserves<br />
as of 12/31/06 (mill. bbls.)<br />
Crude <strong>Oil</strong> NGL Total<br />
New reserves 17 4 21<br />
Production 35 19 54<br />
Net annual change -18 -15 -33<br />
Proved reserves 263 209 472<br />
Natural gas reserves<br />
as of 12/31/06 (Bcf)<br />
Associated Non- Dry<br />
Dissolved Associated <strong>Gas</strong><br />
New reserves 8 -35 -33<br />
Production 9 365 350<br />
Net annual change -1 -400 -383<br />
Proved reserves 82 4,115 3,931<br />
Cost of drill<strong>in</strong>g and equipp<strong>in</strong>g wells<br />
Cost/ft. Cost/ Total Cost<br />
($) well ($) (thous. $)<br />
<strong>Oil</strong> 100 340,005 383,866<br />
<strong>Gas</strong> 140 280,759 341,122<br />
Dry 66 252,030 205,908<br />
Marg<strong>in</strong>al oil wells<br />
<strong>Produc<strong>in</strong>g</strong> marg<strong>in</strong>al wells 39,543<br />
Crude oil production <strong>in</strong> bbls. (thous.) 25,250<br />
Crude oil production b/d (thous.) 69<br />
Marg<strong>in</strong>al natural gas wells<br />
as of 12/31/06<br />
<strong>Produc<strong>in</strong>g</strong> marg<strong>in</strong>al wells 17,185<br />
Natural gas production (MMcf) 240,025<br />
Federal onshore m<strong>in</strong>eral lease royalties<br />
<strong>Oil</strong> $ 4,083,140<br />
<strong>Gas</strong> $ 5,697,953<br />
Total Royalties $ 9,850,753<br />
Horizontal wells data<br />
Horizontal wells drilled 24<br />
Average number of employees<br />
<strong>Oil</strong> and natural gas extraction 7,723<br />
Refi n<strong>in</strong>g 1,856<br />
Transportation 2,600<br />
Wholesale 2,174<br />
Retail 10,318<br />
Pipel<strong>in</strong>e construction 1,289<br />
<strong>Oil</strong>fi eld mach<strong>in</strong>ery 61<br />
Total petroleum <strong>in</strong>dustry 26,021<br />
Norman No. 1 came <strong>in</strong> on Nov. 28, 1892<br />
— the fi rst oil well west of the Mississippi River<br />
to produce a commercial quantity. It was also<br />
the fi rst well drilled <strong>in</strong> the vast Mid-Cont<strong>in</strong>ent<br />
oil fi eld that covers parts of Kansas, Nebraska,<br />
Oklahoma, Arkansas, Louisiana and Texas.<br />
KANSAS<br />
COMPILED BY <strong>IPAA</strong> FEBRUARY 2009 AMERICA’S INDEPENDENT 47
KENTUCKY<br />
Counties with oil and/or gas production<br />
Background Information<br />
Counties<br />
Number of counties 120<br />
With oil and/or gas production 51<br />
First year of production<br />
Crude oil 1860<br />
Natural gas 1888<br />
Year and amount of peak production<br />
Crude oil — 27,272 thous. bbls. 1959<br />
Natural gas — 96,459 MMcf 1947<br />
Deepest produc<strong>in</strong>g well (ft.)<br />
Crude oil<br />
NA<br />
Natural gas 10,608<br />
Year and depth of deepest well drilled (ft.)<br />
2000 24,591<br />
Cumulative number of total wells drilled<br />
as of 12/31/06 (exclud<strong>in</strong>g service wells)<br />
<strong>Oil</strong> wells 18,183 29%<br />
<strong>Gas</strong> wells 15,674 25%<br />
Dry holes 28,275 45%<br />
Total 62,132 100%<br />
Value of <strong>Oil</strong> and <strong>Gas</strong><br />
Average wellhead price<br />
(2006)<br />
Crude oil ($/bbl.) $ 58.33<br />
Natural gas ($Mcf) $ 8.83<br />
Wellhead value of production<br />
(2006, <strong>in</strong> thous. $)<br />
Crude oil $ 136,492<br />
Natural gas $ 841,676<br />
Total $ 978,168<br />
Average natural gas price<br />
(2006, $/Mcf)<br />
Residential consumers $ 14.14<br />
Commercial consumers $ 13.22<br />
Industrial consumers $ 9.64<br />
Electric utilities $ 7.96<br />
City Gate $ 9.07<br />
Severance taxes paid $42,586<br />
(2006, <strong>in</strong> thous. $)<br />
Cumulative crude oil wellhead value<br />
as of 12/31/06 (thous. $) $17,555,333<br />
KENTUCKY<br />
Cumulative production & new reserves<br />
as of 12/31/06<br />
Crude NGL Natural<br />
<strong>Oil</strong> (mill. bbls.) Total <strong>Gas</strong> (Bcf)<br />
Reserves 769 272 1,041 7,329<br />
Production 758 155 913 5,277<br />
48 AMERICA’S INDEPENDENT COMPILED BY <strong>IPAA</strong> FEBRUARY 2009
2006 <strong>Industry</strong> Statistics<br />
Number of wells drilled<br />
Exploratory Development Total<br />
<strong>Oil</strong> 23 186 209<br />
<strong>Gas</strong> 411 495 906<br />
Dry 55 124 179<br />
Total 489 805 1,294<br />
Total footage drilled<br />
(thous. ft.)<br />
Exploratory Development Total<br />
<strong>Oil</strong> 26.2 275.8 302.0<br />
<strong>Gas</strong> 1,378.4 1,662.6 3,041.0<br />
Dry 69.4 168.9 238.3<br />
Total 1,474.0 2,107.3 3,581.3<br />
(Note: Totals may not add due to round<strong>in</strong>g.)<br />
New-field wildcats drilled 239<br />
Footage (thous. ft.) 685.6<br />
Average rotary rigs active 7<br />
Permits 2,181<br />
<strong>State</strong>-wide rank<br />
Crude <strong>Oil</strong> Natural <strong>Gas</strong><br />
Wells drilled 12th 12th<br />
Production 22nd 18th<br />
Reserves (2006) 21st 16th<br />
Number of operators 591<br />
Number of produc<strong>in</strong>g wells<br />
(12/31/06)<br />
Crude oil* 17,988<br />
Natural gas 14,641<br />
Total* 32,629<br />
Average production<br />
Crude oil (thous. b/d) 3<br />
NGL (thous. b/d) 0<br />
Natural gas (MMcf/day) 235<br />
Natural gas marketed production<br />
(MMcf) 95,320<br />
Average output per produc<strong>in</strong>g well<br />
Crude oil (bbls.) 0<br />
Natural gas (Mcf) 6,721<br />
Coalbed methane (YTD MMcf)<br />
<strong>Oil</strong> Wells<br />
<strong>Gas</strong> Wells<br />
Daily Average (MMcf) / Well<br />
Heavy oil (YTD BBls, <strong>in</strong> thous.)<br />
Wells<br />
Av. Bbls per day<br />
Av. Bbls per well/d<br />
NA<br />
NA<br />
NA<br />
NA<br />
NA<br />
NA<br />
NA<br />
Source: EIA for production and IHS for wells drilled.<br />
* World <strong>Oil</strong> for Number of produc<strong>in</strong>g wells.<br />
2006 Latest Available Data<br />
Petroleum reserves<br />
as of 12/31/06 (mill. bbls.)<br />
Crude <strong>Oil</strong> NGL Total<br />
New reserves 4 38 42<br />
Production 2 3 5<br />
Net annual change 2 35 37<br />
Proved reserves 25 105 130<br />
Natural gas reserves<br />
as of 12/31/06 (Bcf)<br />
Associated Non- Dry<br />
Dissolved Associated <strong>Gas</strong><br />
New reserves 6 193 142<br />
Production 0 70 66<br />
Net annual change 6 123 76<br />
Proved reserves 36 2,333 2,227<br />
Cost of drill<strong>in</strong>g and equipp<strong>in</strong>g wells<br />
Cost/ft. Cost/ Total Cost<br />
($) well ($) (thous. $)<br />
<strong>Oil</strong> 158 228,001 47,652<br />
<strong>Gas</strong> 107 358,088 324,427<br />
Dry 190 252,788 45,249<br />
Marg<strong>in</strong>al oil wells<br />
<strong>Produc<strong>in</strong>g</strong> marg<strong>in</strong>al wells 994<br />
Crude oil production <strong>in</strong> bbls. (thous.) 671<br />
Crude oil production b/d (thous.) 2<br />
Marg<strong>in</strong>al natural gas wells<br />
as of 12/31/06<br />
<strong>Produc<strong>in</strong>g</strong> marg<strong>in</strong>al wells 12,617<br />
Natural gas production (MMcf) 78,304<br />
Federal onshore m<strong>in</strong>eral lease royalties<br />
<strong>Oil</strong> $ 7,333<br />
<strong>Gas</strong> $ 259,146<br />
Total Royalties $ 2,070,084<br />
Horizontal wells data<br />
Horizontal wells drilled 2<br />
Average number of employees<br />
<strong>Oil</strong> and natural gas extraction 2,299<br />
Refi n<strong>in</strong>g 1,177<br />
Transportation 1,782<br />
Wholesale 3,107<br />
Retail 19,134<br />
Pipel<strong>in</strong>e construction 706<br />
<strong>Oil</strong>fi eld mach<strong>in</strong>ery 0<br />
Total petroleum <strong>in</strong>dustry 28,205<br />
Bor<strong>in</strong>g for salt water near Burkesville<br />
<strong>in</strong> March 1829, drillers hit an oil gusher. <strong>Oil</strong><br />
from this well was sold as patent medic<strong>in</strong>e for<br />
decades before kerosene distilation created<br />
the petroleum <strong>in</strong>dustry.<br />
KENTUCKY<br />
COMPILED BY <strong>IPAA</strong> FEBRUARY 2009 AMERICA’S INDEPENDENT 49
LOUISIANA<br />
Claiborne<br />
Bossier Webster<br />
Caddo<br />
Bienville<br />
Red River<br />
De Soto<br />
Natchitoches<br />
Sab<strong>in</strong>e<br />
Union Morehouse<br />
West Carroll<br />
East Carroll<br />
L<strong>in</strong>coln<br />
Ouachita<br />
Richland<br />
Madison<br />
Jackson<br />
Caldwell Frankl<strong>in</strong><br />
Tensas<br />
W<strong>in</strong>n<br />
Catahoula<br />
La Salle<br />
Grant<br />
Concordia<br />
Rapides<br />
Vernon<br />
Avoyelles<br />
West FelicianaEast Feliciana<br />
St. Helena<br />
Wash<strong>in</strong>gton<br />
Evangel<strong>in</strong>e<br />
Allen<br />
Po<strong>in</strong>te Coupee<br />
Tangipahoa<br />
Beauregard<br />
St. Landry<br />
East Baton Rouge<br />
West Baton Rouge Liv<strong>in</strong>gston<br />
St. Tammany<br />
Jefferson Davis Acadia<br />
Iberville<br />
Calcasieu<br />
Lafayette St. Mart<strong>in</strong><br />
Ascension<br />
St. John the Baptist<br />
Orleans<br />
St. James<br />
Iberia<br />
St. Charles<br />
Assumption<br />
Cameron<br />
Jefferson<br />
Vermilion<br />
St. Mart<strong>in</strong><br />
St. Bernard<br />
Lafourche<br />
St. Mary<br />
Iberia<br />
Plaquem<strong>in</strong>es<br />
Counties with oil and/or gas production<br />
Terrebonne<br />
Background Information<br />
Counties<br />
Number of counties 64<br />
With oil and/or gas production 60<br />
First year of production<br />
Crude oil 1902<br />
Natural gas 1905<br />
Year and amount of peak production<br />
Crude oil —935,243 thous. bbls. 1971<br />
Natural gas — 8,242,423 MMcf 1973<br />
Deepest produc<strong>in</strong>g well (ft.)<br />
Crude oil 22,856<br />
Natural gas 22,235<br />
Year and depth of deepest well drilled (ft.)<br />
1981 25,703<br />
Cumulative number of total wells drilled<br />
as of 12/31/06 (exclud<strong>in</strong>g service wells)<br />
<strong>Oil</strong> wells 99,771 40%<br />
<strong>Gas</strong> wells 67,336 27%<br />
Dry holes 84,817 33%<br />
Total 251,924 100%<br />
Value of <strong>Oil</strong> and <strong>Gas</strong><br />
Average wellhead price<br />
(2006)<br />
Crude oil ($/bbl.) $ 64.23<br />
Natural gas ($Mcf) $ 6.93<br />
Wellhead value of production<br />
(2006, <strong>in</strong> thous. $)<br />
Crude oil $ 4,745,055<br />
Natural gas $ 9,432,555<br />
Total $ 14,177,610<br />
Average natural gas price<br />
(2006, $/Mcf)<br />
Residential consumers $ 14.67<br />
Commercial consumers $ 11.84<br />
Industrial consumers $ 7.43<br />
Electric utilities $ 7.66<br />
City Gate $ 7.67<br />
Severance taxes paid $ 885,402<br />
(2006, <strong>in</strong> thous. $)<br />
Cumulative crude oil wellhead value<br />
as of 12/31/06 (thous. $) $260,395,812<br />
LOUISIANA<br />
Cumulative production & new reserves<br />
as of 12/31/06<br />
Crude NGL Natural<br />
<strong>Oil</strong> (mill. bbls.) Total <strong>Gas</strong> (Bcf)<br />
Reserves 27,738 6,305 34,043 267,301<br />
Production 18,654 4,555 23,209 146,353<br />
50 AMERICA’S INDEPENDENT COMPILED BY <strong>IPAA</strong> FEBRUARY 2009
2006 <strong>Industry</strong> Statistics<br />
Number of wells drilled<br />
Exploratory Development Total<br />
<strong>Oil</strong> 2 310 312<br />
<strong>Gas</strong> 23 979 1,002<br />
Dry 39 280 319<br />
Total 64 1,569 1,633<br />
Total footage drilled<br />
(thous. ft.)<br />
Exploratory Development Total<br />
<strong>Oil</strong> 11.8 1,534.5 1,546.3<br />
<strong>Gas</strong> 234.3 9,861.1 10,095.7<br />
Dry 326.8 2,415.8 2,742.6<br />
Total 573.2 13,811.4 14,384.5<br />
(Note: Totals may not add due to round<strong>in</strong>g.)<br />
New-field wildcats drilled 51<br />
Footage (thous. ft.) 479.5<br />
Average rotary rigs active 188<br />
Permits 2,331<br />
<strong>State</strong>-wide rank<br />
Crude <strong>Oil</strong> Natural <strong>Gas</strong><br />
Wells drilled 5th 4th<br />
Production 5th 6th<br />
Reserves (2006) 8th 7th<br />
Number of operators 1,019<br />
Number of produc<strong>in</strong>g wells<br />
(12/31/06)<br />
Crude oil 17,999<br />
Natural gas 10,679<br />
Total 28,678<br />
Average production<br />
Crude oil (thous. b/d) 135<br />
NGL (thous. b/d) 67.8<br />
Natural gas (MMcf/day) 3,535<br />
Natural gas marketed production<br />
(MMcf) 1,361,119<br />
Average output per produc<strong>in</strong>g well<br />
Crude oil (bbls.) 2,747<br />
Natural gas (Mcf) 120,812<br />
Coalbed methane (YTD MMcf)<br />
<strong>Oil</strong> Wells<br />
<strong>Gas</strong> Wells<br />
Daily Average (MMcf) / Well<br />
NA<br />
NA<br />
NA<br />
Heavy oil (YTD BBls, <strong>in</strong> thous.) 22,659<br />
Wells 11,199<br />
Av. Bbls per day 62.1<br />
Av. Bbls per well/d 2,023<br />
Source: EIA for production and IHS for wells drilled.<br />
2005 Latest Available Data<br />
Petroleum reserves<br />
as of 12/31/06 (mill. bbls.)<br />
Crude <strong>Oil</strong> NGL Total<br />
New reserves 49 38 87<br />
Production 53 50 103<br />
Net annual change -4 -12 -16<br />
Proved reserves 428 280 708<br />
Natural gas reserves<br />
as of 12/31/06 (Bcf)<br />
Associated Non- Dry<br />
Dissolved Associated <strong>Gas</strong><br />
New reserves 37 1,340 1,336<br />
Production 64 1,282 1,309<br />
Net annual change -27 58 27<br />
Proved reserves 561 10,149 10,474<br />
Cost of drill<strong>in</strong>g and equipp<strong>in</strong>g wells<br />
Cost/ft. Cost/ Total Cost<br />
($) well ($) (thous. $)<br />
<strong>Oil</strong> 516 2,555,325 797,261<br />
<strong>Gas</strong> 473 4,765,617 4,775,148<br />
Dry 512 4,401,509 1,404,081<br />
Marg<strong>in</strong>al oil wells<br />
<strong>Produc<strong>in</strong>g</strong> marg<strong>in</strong>al wells 15,671<br />
Crude oil production <strong>in</strong> bbls. (thous.) 9,494<br />
Crude oil production b/d (thous.) 26<br />
Marg<strong>in</strong>al natural gas wells<br />
as of 12/31/06<br />
<strong>Produc<strong>in</strong>g</strong> marg<strong>in</strong>al wells 4,851<br />
Natural gas production (MMcf) 47,268<br />
Federal onshore m<strong>in</strong>eral lease royalties<br />
<strong>Oil</strong> $ 4,300,928<br />
<strong>Gas</strong> $ 41,990,018<br />
Total Royalties $ 46,767,664<br />
Horizontal wells data<br />
Horizontal wells drilled 27<br />
Average number of employees<br />
<strong>Oil</strong> and natural gas extraction 45,031<br />
Refi n<strong>in</strong>g 10,152<br />
Transportation 3,961<br />
Wholesale 1,461<br />
Retail 17,832<br />
Pipel<strong>in</strong>e construction 14,236<br />
<strong>Oil</strong>fi eld mach<strong>in</strong>ery 0<br />
Total petroleum <strong>in</strong>dustry 92,673<br />
In September 1901, Louisiana’s oil <strong>in</strong>dustry<br />
began when the Heywood well came <strong>in</strong> near<br />
the communities of Evangel<strong>in</strong>e and Jenn<strong>in</strong>gs.<br />
LOUISIANA<br />
COMPILED BY <strong>IPAA</strong> FEBRUARY 2009 AMERICA’S INDEPENDENT 51
MARYLAND<br />
Garrett<br />
Allegany<br />
Wash<strong>in</strong>gton<br />
Frederick<br />
Carroll<br />
Baltimore<br />
Harford<br />
Cecil<br />
Baltimore City<br />
Howard<br />
Kent<br />
Montgomery<br />
Queen Anne's<br />
Anne Arundel<br />
Counties with oil and/or gas production<br />
Queen Anne's<br />
Pr<strong>in</strong>ce George's<br />
Carol<strong>in</strong>e<br />
Talbot<br />
Charles<br />
Calvert<br />
Dorchester<br />
St. Mary's<br />
Wicomico<br />
Somerset<br />
Worcester<br />
Background Information<br />
Counties<br />
Number of counties 23<br />
With oil and/or gas production 2<br />
First year of production<br />
Crude oil --<br />
Natural gas 1950<br />
Year and amount of peak production<br />
Crude oil — --<br />
Natural gas —4,543 MMcf 1959<br />
Deepest produc<strong>in</strong>g well (ft.)<br />
Crude oil 10,376<br />
Natural gas 8,658<br />
Year and depth of deepest well drilled (ft.)<br />
1973 11,617<br />
Cumulative number of total wells drilled<br />
as of 12/31/06 (exclud<strong>in</strong>g service wells)<br />
<strong>Oil</strong> wells NA NA<br />
<strong>Gas</strong> wells 71 49%<br />
Dry holes 75 51%<br />
Total 146 100%<br />
Value of <strong>Oil</strong> and <strong>Gas</strong><br />
Average wellhead price<br />
(2006)<br />
Crude oil ($/bbl.)<br />
NA<br />
Natural gas ($Mcf) $7.63<br />
Wellhead value of production<br />
(2006, <strong>in</strong> thous. $)<br />
Crude oil<br />
NA<br />
Natural gas $ 366<br />
Total $ 366<br />
Average natural gas price<br />
(2006, $/Mcf)<br />
Residential consumers $ 16.36<br />
Commercial consumers $ 13.28<br />
Industrial consumers $ 12.86<br />
Electric utilities $ 7.80<br />
City Gate $ 10.62<br />
Severance taxes paid $4<br />
(2006, <strong>in</strong> thous. $)<br />
MARYLAND<br />
Cumulative crude oil wellhead value<br />
as of 12/31/06 (thous. $)<br />
NA<br />
Cumulative production & new reserves<br />
as of 12/31/06<br />
Crude NGL Natural<br />
<strong>Oil</strong> (mill. bbls.) Total <strong>Gas</strong> (Bcf)<br />
Reserves 0 NA NA NA<br />
Production 0 NA NA NA<br />
52 AMERICA’S INDEPENDENT COMPILED BY <strong>IPAA</strong> FEBRUARY 2009
2006 <strong>Industry</strong> Statistics<br />
Number of wells drilled<br />
Exploratory Development Total<br />
<strong>Oil</strong> NA NA NA<br />
<strong>Gas</strong> NA NA NA<br />
Dry NA NA NA<br />
Total NA NA NA<br />
Total footage drilled<br />
(thous. ft.)<br />
Exploratory Development Total<br />
<strong>Oil</strong> NA NA NA<br />
<strong>Gas</strong> NA NA NA<br />
Dry NA NA NA<br />
Total NA NA NA<br />
New-field wildcats drilled<br />
Footage (thous. ft.)<br />
NA<br />
NA<br />
Average rotary rigs active 0<br />
Permits 1<br />
<strong>State</strong>-wide rank<br />
Crude <strong>Oil</strong> Natural <strong>Gas</strong><br />
Wells drilled NA 29th<br />
Production NA 31st<br />
Reserves (2006) NA NA<br />
Number of operators --<br />
Number of produc<strong>in</strong>g wells<br />
(12/31/06)<br />
Crude oil<br />
Natural gas<br />
Total<br />
Average production<br />
Crude oil (thous. b/d)<br />
NGL (thous. b/d)<br />
Natural gas (MMcf/day)<br />
NA<br />
NA<br />
NA<br />
NA<br />
NA<br />
NA<br />
Natural gas marketed production<br />
(MMcf) 48<br />
Average output per produc<strong>in</strong>g well<br />
Crude oil (bbls.)<br />
Natural gas (Mcf)<br />
Coalbed methane (YTD MMcf)<br />
<strong>Oil</strong> Wells<br />
<strong>Gas</strong> Wells<br />
Daily Average (MMcf) / Well<br />
Heavy oil (YTD BBls, <strong>in</strong> thous.)<br />
Wells<br />
Av. Bbls per day<br />
Av. Bbls per well/d<br />
NA<br />
NA<br />
NA<br />
NA<br />
NA<br />
NA<br />
NA<br />
NA<br />
NA<br />
Source: EIA for production and IHS for wells drilled.<br />
2006 Latest Available Data<br />
Petroleum reserves<br />
as of 12/31/06 (mill. bbls.)<br />
Crude <strong>Oil</strong> NGL Total<br />
New reserves NA NA NA<br />
Production NA NA NA<br />
Net annual change NA NA NA<br />
Proved reserves NA NA NA<br />
Natural gas reserves<br />
as of 12/31/06 (Bcf)<br />
Associated Non- Dry<br />
Dissolved Associated <strong>Gas</strong><br />
New reserves NA NA NA<br />
Production NA NA NA<br />
Net annual change NA NA NA<br />
Proved reserves NA NA NA<br />
Cost of drill<strong>in</strong>g and equipp<strong>in</strong>g wells<br />
Cost/ft. Cost/ Total Cost<br />
($) well ($) (thous. $)<br />
<strong>Oil</strong> NA NA NA<br />
<strong>Gas</strong> NA NA NA<br />
Dry NA NA NA<br />
Marg<strong>in</strong>al oil wells<br />
<strong>Produc<strong>in</strong>g</strong> marg<strong>in</strong>al wells<br />
Crude oil production <strong>in</strong> bbls. (thous.)<br />
Crude oil production b/d (thous.)<br />
NA<br />
NA<br />
NA<br />
Marg<strong>in</strong>al natural gas wells<br />
as of 12/31/06<br />
<strong>Produc<strong>in</strong>g</strong> marg<strong>in</strong>al wells 0<br />
Natural gas production (MMcf) 0<br />
Federal onshore m<strong>in</strong>eral lease royalties<br />
<strong>Oil</strong> --<br />
<strong>Gas</strong> --<br />
Total Royalties $7,656<br />
Horizontal wells data<br />
Horizontal wells drilled<br />
NA<br />
Average number of employees<br />
<strong>Oil</strong> and natural gas extraction 763<br />
Refi n<strong>in</strong>g 0<br />
Transportation 737<br />
Wholesale 3,435<br />
Retail 10,545<br />
Pipel<strong>in</strong>e construction 772<br />
<strong>Oil</strong>fi eld mach<strong>in</strong>ery 0<br />
Total petroleum <strong>in</strong>dustry 16,252<br />
For more <strong>in</strong>formation please contact:<br />
Information Services Department<br />
Independent Petroleum Association of America<br />
1201 15th St., N.W., Suite 300<br />
Wash<strong>in</strong>gton, D.C. 20005<br />
T: 202-857-4722 • FAX: 202-857-4799<br />
MARYLAND<br />
COMPILED BY <strong>IPAA</strong> FEBRUARY 2009 AMERICA’S INDEPENDENT 53
Keweenaw<br />
MICHIGAN<br />
Houghton<br />
Ontonagon<br />
Baraga<br />
Gogebic<br />
Marquette<br />
Iron<br />
Dick<strong>in</strong>son<br />
Alger<br />
Schoolcraft<br />
Delta<br />
Luce<br />
Chippewa<br />
Mack<strong>in</strong>ac<br />
Menom<strong>in</strong>ee<br />
Counties with oil and/or gas production<br />
Emmet<br />
Cheboygan<br />
Presque Isle<br />
Charlevoix<br />
Antrim Otsego<br />
Alpena<br />
Leelanau<br />
Montmorency<br />
Benzie KalkaskaCrawford Oscoda Alcona<br />
Grand Traverse<br />
WexfordMissaukee<br />
Ogemaw Iosco<br />
Manistee<br />
Roscommon<br />
Mason Lake Osceola Clare<br />
Arenac<br />
Gladw<strong>in</strong><br />
Huron<br />
Bay<br />
Oceana Mecosta Isabella Midland<br />
Newaygo<br />
Tuscola<br />
Montcalm<br />
Sanilac<br />
Gratiot Sag<strong>in</strong>aw<br />
Muskegon<br />
Ottawa<br />
Kent<br />
Ionia<br />
Lapeer<br />
Genesee<br />
Cl<strong>in</strong>ton<br />
Shiawassee<br />
St. Clair<br />
Allegan Barry Eaton<br />
Oakland Macomb<br />
InghamLiv<strong>in</strong>gston<br />
Kalamazoo<br />
Van Buren Calhoun Jackson Washtenaw Wayne<br />
Berrien<br />
Monroe<br />
Cass St. JosephBranch<br />
Hillsdale Lenawee<br />
Background Information<br />
Counties<br />
Number of counties 83<br />
With oil and/or gas production 57<br />
First year of production<br />
Crude oil 1900<br />
Natural gas 1909<br />
Year and amount of peak production<br />
Crude oil — 34,862 thous. bbls. 1979<br />
Natural gas —311,616 MMcf 1997<br />
Deepest produc<strong>in</strong>g well (ft.)<br />
Crude oil 12,742<br />
Natural gas 14,716<br />
Year and depth of deepest well drilled (ft.)<br />
1975 17,466<br />
Cumulative number of total wells drilled<br />
as of 12/31/06 (exclud<strong>in</strong>g service wells)<br />
<strong>Oil</strong> wells 15,243 28%<br />
<strong>Gas</strong> wells 13,532 24%<br />
Dry holes 26,630 48%<br />
Total 55,405 100%<br />
Value of <strong>Oil</strong> and <strong>Gas</strong><br />
Average wellhead price<br />
(2006)<br />
Crude oil ($/bbl.) $60.89<br />
Natural gas ($Mcf)<br />
NA<br />
Wellhead value of production<br />
(2006, <strong>in</strong> thous. $)<br />
Crude oil $310,113<br />
Natural gas<br />
NA<br />
Total $310,113<br />
Average natural gas price<br />
(2006, $/Mcf)<br />
Residential consumers $ 11.97<br />
Commercial consumers $10.75<br />
Industrial consumers $ 9.90<br />
Electric utilities $ 6.01<br />
City Gate $ 8.34<br />
Severance taxes paid $88,143<br />
(2006, <strong>in</strong> thous. $)<br />
Cumulative crude oil wellhead value<br />
as of 12/31/06 (thous. $) $14,798,985<br />
MICHIGAN<br />
Cumulative production & new reserves<br />
as of 12/31/06<br />
Crude NGL Natural<br />
<strong>Oil</strong> (mill. bbls.) Total <strong>Gas</strong> (Bcf)<br />
Reserves 1,289 292 1,581 9,412<br />
Production 1,237 235 1,472 5,560<br />
54 AMERICA’S INDEPENDENT COMPILED BY <strong>IPAA</strong> FEBRUARY 2009
2006 <strong>Industry</strong> Statistics<br />
Number of wells drilled<br />
Exploratory Development Total<br />
<strong>Oil</strong> 3 22 25<br />
<strong>Gas</strong> 3 450 453<br />
Dry 28 52 80<br />
Total 34 524 558<br />
Total footage drilled<br />
(thous. ft.)<br />
Exploratory Development Total<br />
<strong>Oil</strong> 18.9 82.0 100.9<br />
<strong>Gas</strong> 15.3 655.2 670.5<br />
Dry 125.4 140.7 266.1<br />
Total 159.6 877.9 1,037.5<br />
(Note: Totals may not add due to round<strong>in</strong>g.)<br />
New-field wildcats drilled 28<br />
Footage (thous. ft.) 124.4<br />
Average rotary rigs active 2<br />
Permits 990<br />
<strong>State</strong>-wide rank<br />
Crude <strong>Oil</strong> Natural <strong>Gas</strong><br />
Wells drilled 13th 13th<br />
Production 19th 10th<br />
Reserves (2006) 16th 13th<br />
Number of operators 174<br />
Number of produc<strong>in</strong>g wells<br />
(12/31/06)<br />
Crude oil 3,847<br />
Natural gas 9,444<br />
Total 13,291<br />
Average production<br />
Crude oil (thous. b/d) 16<br />
NGL (thous. b/d) 2.1<br />
Natural gas (MMcf/day) 436<br />
Natural gas marketed production<br />
(MMcf) 263,009<br />
Average output per produc<strong>in</strong>g well<br />
Crude oil (bbls.) 1,478<br />
Natural gas (Mcf) 16,867<br />
Coalbed methane (YTD MMcf)<br />
<strong>Oil</strong> Wells<br />
<strong>Gas</strong> Wells<br />
Daily Average (MMcf) / Well<br />
Heavy oil (YTD BBls, <strong>in</strong> thous.)<br />
Wells<br />
Av. Bbls per day<br />
Av. Bbls per well/d<br />
NA<br />
NA<br />
NA<br />
NA<br />
NA<br />
NA<br />
NA<br />
Source: EIA for production and IHS for wells drilled.<br />
2006 Latest Available Data<br />
Petroleum reserves<br />
as of 12/31/06 (mill. bbls.)<br />
Crude <strong>Oil</strong> NGL Total<br />
New reserves 6 6 12<br />
Production 5 3 8<br />
Net annual change 1 3 4<br />
Proved reserves 63 42 105<br />
Natural gas reserves<br />
as of 12/31/06 (Bcf)<br />
Associated Non- Dry<br />
Dissolved Associated <strong>Gas</strong><br />
New reserves 57 300 352<br />
Production 18 183 197<br />
Net annual change 39 117 155<br />
Proved reserves 192 2,925 3,065<br />
Cost of drill<strong>in</strong>g and equipp<strong>in</strong>g wells<br />
Cost/ft. Cost/ Total Cost<br />
($) well ($) (thous. $)<br />
<strong>Oil</strong> 518 2,088,335 52,208<br />
<strong>Gas</strong> 523 773,803 350,533<br />
Dry 336 1,117,661 89,413<br />
Marg<strong>in</strong>al oil wells<br />
<strong>Produc<strong>in</strong>g</strong> marg<strong>in</strong>al wells 3,617<br />
Crude oil production <strong>in</strong> bbls. (thous.) 3,297<br />
Crude oil production b/d (thous.) 9<br />
Marg<strong>in</strong>al natural gas wells<br />
as of 12/31/06<br />
<strong>Produc<strong>in</strong>g</strong> marg<strong>in</strong>al wells 1,122<br />
Natural gas production (MMcf) 15,088<br />
Federal onshore m<strong>in</strong>eral lease royalties<br />
<strong>Oil</strong> $ 297,144<br />
<strong>Gas</strong> $ 2,451,832<br />
Total Royalties $ 2,804,281<br />
Horizontal wells data<br />
Horizontal wells drilled 110<br />
Average number of employees<br />
<strong>Oil</strong> and natural gas extraction 2,550<br />
Refi n<strong>in</strong>g 784<br />
Transportation 4,255<br />
Wholesale 3,146<br />
Retail 25,487<br />
Pipel<strong>in</strong>e construction 1,283<br />
<strong>Oil</strong>fi eld mach<strong>in</strong>ery 0<br />
Total petroleum <strong>in</strong>dustry 37,505<br />
In 1860, Michigan <strong>State</strong> Geologist Alexander<br />
W<strong>in</strong>chell reported that oil and natural<br />
gas deposits lay under Michigan’s surface.<br />
First commercial production began <strong>in</strong> 1886<br />
near Port Huron. In 1928, Mt. Pleasant’s oilfi eld<br />
made it the “<strong>Oil</strong> Capital of MIchigan.”<br />
MICHIGAN<br />
COMPILED BY <strong>IPAA</strong> FEBRUARY 2009 AMERICA’S INDEPENDENT 55
MISSISSIPPI<br />
Counties with oil and/or gas production<br />
Background Information<br />
Counties<br />
Number of counties 82<br />
With oil and/or gas production 41<br />
First year of production<br />
Crude oil 1889<br />
Natural gas 1923<br />
Year and amount of peak production<br />
Crude oil —65,119 thous. bbls. 1970<br />
Natural gas — 221,331 MMcf 1988<br />
Deepest produc<strong>in</strong>g well (ft.)<br />
Crude oil 21,533<br />
Natural gas 23,894<br />
Year and depth of deepest well drilled (ft.)<br />
1986 25,500<br />
Value of <strong>Oil</strong> and <strong>Gas</strong><br />
Average wellhead price<br />
(2006)<br />
Crude oil ($/bbl.) $ 59.35<br />
Natural gas ($Mcf) $ 6.84<br />
Wellhead value of production<br />
(2006, <strong>in</strong> thous. $)<br />
Crude oil $ 1,030,079<br />
Natural gas $ 414,032<br />
Total $ 1,444,111<br />
Average natural gas price<br />
(2006, $/Mcf)<br />
Residential consumers $ 14.65<br />
Commercial consumers $ 12.25<br />
Industrial consumers $ 9.27<br />
Electric utilities $ 7.20<br />
City Gate $ 9.13<br />
Severance taxes paid $6,809<br />
(2006, <strong>in</strong> thous. $)<br />
Cumulative number of total wells drilled<br />
as of 12/31/06 (exclud<strong>in</strong>g service wells)<br />
<strong>Oil</strong> wells 10,586 33%<br />
<strong>Gas</strong> wells 3,924 12%<br />
Dry holes 17,834 55%<br />
Total 32,344 100%<br />
MISSISSIPPI<br />
Cumulative crude oil wellhead value<br />
as of 12/31/06 (thous. $) $20,943,376<br />
Cumulative production & new reserves<br />
as of 12/31/06<br />
Crude NGL Natural<br />
<strong>Oil</strong> (mill. bbls.) Total <strong>Gas</strong> (Bcf)<br />
Reserves 2,701 130 2,831 9,711<br />
Production 2,540 149 2,689 8,963<br />
56 AMERICA’S INDEPENDENT COMPILED BY <strong>IPAA</strong> FEBRUARY 2009
2006 <strong>Industry</strong> Statistics<br />
Number of wells drilled<br />
Exploratory Development Total<br />
<strong>Oil</strong> 2 46 48<br />
<strong>Gas</strong> 15 162 177<br />
Dry 23 45 68<br />
Total 40 253 293<br />
Total footage drilled<br />
(thous. ft.)<br />
Exploratory Development Total<br />
<strong>Oil</strong> 22.8 333.8 356.6<br />
<strong>Gas</strong> 55.4 1,263.1 1,318.4<br />
Dry 179.4 279.9 459.3<br />
Total 257.6 1,876.7 2,134.3<br />
(Note: Totals may not add due to round<strong>in</strong>g.)<br />
New-field wildcats drilled 30<br />
Footage (thous. ft.) 176.3<br />
Average rotary rigs active 10<br />
Permits 577<br />
<strong>State</strong>-wide rank<br />
Crude <strong>Oil</strong> Natural <strong>Gas</strong><br />
Wells drilled 19th 21st<br />
Production 14th 20th<br />
Reserves (2006) 14th 21st<br />
Number of operators 211<br />
Number of produc<strong>in</strong>g wells<br />
(12/31/06)<br />
Crude oil 1,788<br />
Natural gas 1,574<br />
Total 3,362<br />
Average production<br />
Crude oil (thous. b/d) 44<br />
NGL (thous. b/d) 3.8<br />
Natural gas (MMcf/day) 565<br />
Natural gas marketed production<br />
(MMcf) 60,531<br />
Average output per produc<strong>in</strong>g well<br />
Crude oil (bbls.) 9,006<br />
Natural gas (Mcf) 131,048<br />
Coalbed methane (YTD MMcf)<br />
<strong>Oil</strong> Wells<br />
<strong>Gas</strong> Wells<br />
Daily Average (MMcf) / Well<br />
NA<br />
NA<br />
NA<br />
2006 Latest Available Data<br />
Petroleum reserves<br />
as of 12/31/06 (mill. bbls.)<br />
Crude <strong>Oil</strong> NGL Total<br />
New reserves 12 2 14<br />
Production 15 1 16<br />
Net annual change -3 1 -2<br />
Proved reserves 186 8 194<br />
Natural gas reserves<br />
as of 12/31/06 (Bcf)<br />
Associated Non- Dry<br />
Dissolved Associated <strong>Gas</strong><br />
New reserves 4 138 141<br />
Production 3 81 83<br />
Net annual change 1 57 58<br />
Proved reserves 21 795 813<br />
Cost of drill<strong>in</strong>g and equipp<strong>in</strong>g wells<br />
Cost/ft. Cost/ Total Cost<br />
($) well ($) (thous. $)<br />
<strong>Oil</strong> 384 2,851,759 136,884<br />
<strong>Gas</strong> 438 3,263,258 577,597<br />
Dry 410 2,771,576 188,467<br />
Marg<strong>in</strong>al oil wells<br />
<strong>Produc<strong>in</strong>g</strong> marg<strong>in</strong>al wells 964<br />
Crude oil production <strong>in</strong> bbls. (thous.) 2,202<br />
Crude oil production b/d (thous.) 6<br />
Marg<strong>in</strong>al natural gas wells<br />
as of 12/31/06<br />
<strong>Produc<strong>in</strong>g</strong> marg<strong>in</strong>al wells 1,063<br />
Natural gas production (MMcf) 14,679<br />
Federal onshore m<strong>in</strong>eral lease royalties<br />
<strong>Oil</strong> $ 2,156,274<br />
<strong>Gas</strong> $ 502,252<br />
Total Royalties $ 4,173,855<br />
Horizontal wells data<br />
Horizontal wells drilled 7<br />
Average number of employees<br />
<strong>Oil</strong> and natural gas extraction 4,982<br />
Refi n<strong>in</strong>g 1,794<br />
Transportation 1,475<br />
Wholesale 2,348<br />
Retail 15,600<br />
Pipel<strong>in</strong>e construction 871<br />
<strong>Oil</strong>fi eld mach<strong>in</strong>ery 62<br />
Total petroleum <strong>in</strong>dustry 27,132<br />
Heavy oil (YTD BBls, <strong>in</strong> thous.) 1,843<br />
Wells 242<br />
Av. Bbls per day 5.1<br />
Av. Bbls per well/d 7,616<br />
Source: EIA for production and IHS for wells drilled.<br />
Near T<strong>in</strong>sley and Yazoo City,<br />
Union <strong>Produc<strong>in</strong>g</strong> Co. brought <strong>in</strong> the No. 1<br />
Woodruff well at 5,500 feet <strong>in</strong> September<br />
of 1939. With<strong>in</strong> 15-months, there were 133<br />
produc<strong>in</strong>g wells. The T<strong>in</strong>sley fi eld has yielded<br />
230 million barrels of oil.<br />
MISSISSIPPI<br />
COMPILED BY <strong>IPAA</strong> FEBRUARY 2009 AMERICA’S INDEPENDENT 57
MISSOURI<br />
Worth<br />
Putnam Schuyler<br />
Mercer<br />
Clark<br />
Atchison Nodaway<br />
Scotland<br />
Harrison<br />
Gentry<br />
Holt<br />
Andrew<br />
DeKalb<br />
Grundy Sullivan Adair<br />
Knox Lewis<br />
Daviess<br />
L<strong>in</strong>n<br />
Macon<br />
Liv<strong>in</strong>gston<br />
Shelby<br />
Marion<br />
Buchanan Caldwell<br />
Cl<strong>in</strong>ton<br />
Monroe<br />
Chariton Randolph<br />
Ralls<br />
Platte<br />
Carroll<br />
Pike<br />
Ray<br />
Clay<br />
Audra<strong>in</strong><br />
Sal<strong>in</strong>e Howard<br />
Jackson Lafayette<br />
Boone<br />
Montgomery L<strong>in</strong>coln<br />
Callaway<br />
St. Charles<br />
Cooper<br />
Warren<br />
Johnson Pettis Moniteau<br />
Cass<br />
St. LouisSt. Louis City<br />
Morgan<br />
Henry<br />
Cole Osage<strong>Gas</strong>conade<br />
Frankl<strong>in</strong><br />
Bates<br />
Benton<br />
Jefferson<br />
Miller Maries<br />
St. Clair<br />
Camden<br />
Hickory<br />
Crawford Wash<strong>in</strong>gton<br />
Phelps<br />
Ste. Genevieve<br />
Vernon<br />
St. Francois<br />
Pulaski<br />
Cedar<br />
Dallas<br />
Perry<br />
Dent<br />
Polk<br />
Laclede<br />
Barton<br />
Iron<br />
Dade<br />
Reynolds Madison Cape Girardeau<br />
Boll<strong>in</strong>ger<br />
Texas<br />
Greene Webster Wright<br />
Jasper<br />
Lawrence<br />
Shannon<br />
Wayne<br />
Scott<br />
Christian Douglas<br />
Newton<br />
Carter<br />
Stoddard Mississippi<br />
Stone<br />
Howell<br />
Barry<br />
Ozark<br />
Butler<br />
Taney<br />
Oregon<br />
Ripley<br />
McDonald<br />
New Madrid<br />
Counties with oil and/or gas production<br />
Dunkl<strong>in</strong><br />
Pemiscot<br />
Background Information<br />
Counties<br />
Number of counties 114<br />
With oil and/or gas production 5<br />
First year of production<br />
Crude oil 1889<br />
Natural gas 1887<br />
Year and amount of peak production<br />
Crude oil —285 thous. bbls. 1984<br />
Natural gas —1,368 MMcf 1938<br />
Deepest produc<strong>in</strong>g well (ft.)<br />
Crude oil 3,680<br />
Natural gas 765<br />
Year and depth of deepest well drilled (ft.)<br />
1988 10,089<br />
Cumulative number of total wells drilled<br />
as of 12/31/06 (exclud<strong>in</strong>g service wells)<br />
<strong>Oil</strong> wells 675 32%<br />
<strong>Gas</strong> wells 78 4%<br />
Dry holes 1,335 64%<br />
Total 2,088 100%<br />
Value of <strong>Oil</strong> and <strong>Gas</strong><br />
Average wellhead price<br />
(2006)<br />
Crude oil ($/bbl.) $57.34<br />
Natural gas ($Mcf)<br />
NA<br />
Wellhead value of production<br />
(2006, <strong>in</strong> thous. $)<br />
Crude oil $4,989<br />
Natural gas<br />
NA<br />
Total $4,989<br />
Average natural gas price<br />
(2006, $/Mcf)<br />
Residential consumers $ 14.25<br />
Commercial consumers $ 12.94<br />
Industrial consumers $ 12.40<br />
Electric utilities<br />
NA<br />
City Gate $ 8.53<br />
Severance taxes paid --<br />
(2006, <strong>in</strong> thous. $)<br />
Cumulative crude oil wellhead value<br />
as of 12/31/06 (thous. $) $105,046<br />
MISSOURI<br />
Cumulative production & new reserves<br />
as of 12/31/06<br />
Crude NGL Natural<br />
<strong>Oil</strong> (mill. bbls.) Total <strong>Gas</strong> (Bcf)<br />
Reserves NA NA NA NA<br />
Production 7 NA 7 15<br />
58 AMERICA’S INDEPENDENT COMPILED BY <strong>IPAA</strong> FEBRUARY 2009
2006 <strong>Industry</strong> Statistics<br />
Number of wells drilled<br />
Exploratory Development Total<br />
<strong>Oil</strong> NA NA NA<br />
<strong>Gas</strong> NA NA NA<br />
Dry NA NA NA<br />
Total NA NA NA<br />
Total footage drilled<br />
(thous. ft.)<br />
Exploratory Development Total<br />
<strong>Oil</strong> NA NA NA<br />
<strong>Gas</strong> NA NA NA<br />
Dry NA NA NA<br />
Total NA NA NA<br />
(Note: Totals may not add due to round<strong>in</strong>g.)<br />
New-field wildcats drilled<br />
Footage (thous. ft.)<br />
NA<br />
NA<br />
Average rotary rigs active 0<br />
Permits 0<br />
<strong>State</strong>-wide rank<br />
Crude <strong>Oil</strong> Natural <strong>Gas</strong><br />
Wells drilled 27th 30th<br />
Production 30th NA<br />
Reserves (2006) NA NA<br />
Number of operators --<br />
Number of produc<strong>in</strong>g wells<br />
(12/31/06)<br />
Crude oil<br />
Natural gas<br />
Total<br />
Average production<br />
Crude oil (thous. b/d)<br />
NGL (thous. b/d)<br />
Natural gas (MMcf/day)<br />
NA<br />
NA<br />
NA<br />
NA<br />
NA<br />
NA<br />
Natural gas marketed production<br />
(MMcf) 0<br />
Average output per produc<strong>in</strong>g well<br />
Crude oil (bbls.)<br />
Natural gas (Mcf)<br />
Coalbed methane (YTD MMcf)<br />
<strong>Oil</strong> Wells<br />
<strong>Gas</strong> Wells<br />
Daily Average (MMcf) / Well<br />
Heavy oil (YTD BBls, <strong>in</strong> thous.)<br />
Wells<br />
Av. Bbls per day<br />
Av. Bbls per well/d<br />
NA<br />
NA<br />
NA<br />
NA<br />
NA<br />
NA<br />
NA<br />
NA<br />
NA<br />
Source: EIA for production and IHS for wells drilled.<br />
2006 Latest Available Data<br />
Petroleum reserves<br />
as of 12/31/06 (mill. bbls.)<br />
Crude <strong>Oil</strong> NGL Total<br />
New reserves NA NA NA<br />
Production NA NA NA<br />
Net annual change NA NA NA<br />
Proved reserves NA NA NA<br />
Natural gas reserves<br />
as of 12/31/06 (Bcf)<br />
Associated Non- Dry<br />
Dissolved Associated <strong>Gas</strong><br />
New reserves NA NA NA<br />
Production NA NA NA<br />
Net annual change NA NA NA<br />
Proved reserves NA NA NA<br />
Cost of drill<strong>in</strong>g and equipp<strong>in</strong>g wells<br />
Cost/ft. Cost/ Total Cost<br />
($) well ($) (thous. $)<br />
<strong>Oil</strong> NA NA NA<br />
<strong>Gas</strong> NA NA NA<br />
Dry NA NA NA<br />
Marg<strong>in</strong>al oil wells<br />
<strong>Produc<strong>in</strong>g</strong> marg<strong>in</strong>al wells<br />
Crude oil production <strong>in</strong> bbls. (thous.)<br />
Crude oil production b/d (thous.)<br />
Marg<strong>in</strong>al natural gas wells<br />
as of 12/31/06<br />
NA<br />
NA<br />
NA<br />
<strong>Produc<strong>in</strong>g</strong> marg<strong>in</strong>al wells 0<br />
Natural gas production (MMcf) 0<br />
Federal onshore m<strong>in</strong>eral lease royalties<br />
<strong>Oil</strong> --<br />
<strong>Gas</strong> --<br />
Total Royalties $8,515,935<br />
Horizontal wells data<br />
Horizontal wells drilled<br />
NA<br />
Average number of employees<br />
<strong>Oil</strong> and natural gas extraction 109<br />
Refi n<strong>in</strong>g 446<br />
Transportation 3,469<br />
Wholesale 4,290<br />
Retail 25,237<br />
Pipel<strong>in</strong>e construction 475<br />
<strong>Oil</strong>fi eld mach<strong>in</strong>ery 0<br />
Total petroleum <strong>in</strong>dustry 34,026<br />
<strong>Oil</strong> and natural gas were discovered <strong>in</strong><br />
Missouri soon after the Civil War. By the early<br />
1930s, more than 2,500 wells had been drilled.<br />
MISSOURI<br />
COMPILED BY <strong>IPAA</strong> FEBRUARY 2009 AMERICA’S INDEPENDENT 59
MONTANA<br />
L<strong>in</strong>coln<br />
Flathead<br />
Glacier<br />
Pondera<br />
Toole<br />
Liberty<br />
Hill<br />
Bla<strong>in</strong>e<br />
Phillips<br />
Valley<br />
Daniels<br />
Roosevelt<br />
Sheridan<br />
Sanders<br />
M<strong>in</strong>eral<br />
Teton<br />
Chouteau<br />
Richland<br />
Lake<br />
McCone<br />
Cascade<br />
Fergus<br />
Garfield<br />
Dawson<br />
Lewis and Clark<br />
Petroleum<br />
Judith Bas<strong>in</strong><br />
Missoula<br />
Wibaux<br />
Powell<br />
Prairie<br />
Meagher<br />
Granite<br />
Wheatland Musselshell<br />
Broadwater<br />
Golden Valley<br />
Rosebud Custer<br />
Fallon<br />
Ravalli<br />
Jefferson<br />
Treasure<br />
Deer Lodge<br />
Silver Bow<br />
Sweet Grass<br />
Yellowstone<br />
Gallat<strong>in</strong> Park<br />
Stillwater<br />
Big Horn<br />
Carter<br />
Powder River<br />
Madison<br />
Carbon<br />
Beaverhead<br />
Counties with oil and/or gas production<br />
Background Information<br />
Counties<br />
Number of counties 56<br />
With oil and/or gas production 33<br />
First year of production<br />
Crude oil 1916<br />
Natural gas 1915<br />
Year and amount of peak production<br />
Crude oil —48,460 thous. bbls. 1968<br />
Natural gas — 107,918 MMcf 2005<br />
Deepest produc<strong>in</strong>g well (ft.)<br />
Crude oil 22,625<br />
Natural gas 20,250<br />
Year and depth of deepest well drilled (ft.)<br />
2006 22,037<br />
Cumulative number of total wells drilled<br />
as of 12/31/06 (exclud<strong>in</strong>g service wells)<br />
<strong>Oil</strong> wells 14,546 35%<br />
<strong>Gas</strong> wells 9,704 23%<br />
Dry holes 17,281 42%<br />
Total 41,531 100%<br />
Value of <strong>Oil</strong> and <strong>Gas</strong><br />
Average wellhead price<br />
(2006)<br />
Crude oil ($/bbl.) $ 56.69<br />
Natural gas ($Mcf) $ 5.53<br />
Wellhead value of production<br />
(2006, <strong>in</strong> thous. $)<br />
Crude oil $ 2,055,693<br />
Natural gas $ 624,033<br />
Total $ 2,679,726<br />
Average natural gas price<br />
(2006, $/Mcf)<br />
Residential consumers $ 11.26<br />
Commercial consumers $ 11.12<br />
Industrial consumers $ 11.63<br />
Electric utilities<br />
NA<br />
City Gate $ 7.25<br />
Severance taxes paid $204,129<br />
(2006, <strong>in</strong> thous. $)<br />
Cumulative crude oil wellhead value<br />
as of 12/31/06 (thous. $) $19,699,705<br />
MONTANA<br />
Cumulative production & new reserves<br />
as of 12/31/06<br />
Crude NGL Natural<br />
<strong>Oil</strong> (mill. bbls.) Total <strong>Gas</strong> (Bcf)<br />
Reserves 2,020 54 2,074 4,463<br />
Production 1,613 45 1,658 3,342<br />
60 AMERICA’S INDEPENDENT COMPILED BY <strong>IPAA</strong> FEBRUARY 2009
2006 <strong>Industry</strong> Statistics<br />
Number of wells drilled<br />
Exploratory Development Total<br />
<strong>Oil</strong> 166 206 372<br />
<strong>Gas</strong> 43 615 658<br />
Dry 46 42 88<br />
Total 255 863 1,118<br />
Total footage drilled<br />
(thous. ft.)<br />
Exploratory Development Total<br />
<strong>Oil</strong> 1,786.8 2,246.3 4,033.1<br />
<strong>Gas</strong> 83.6 794.1 877.6<br />
Dry 204.6 94.3 298.8<br />
Total 2,075.0 3,134.6 5,209.6<br />
(Note: Totals may not add due to round<strong>in</strong>g.)<br />
New-field wildcats drilled 138<br />
Footage (thous. ft.) 1,065.4<br />
Average rotary rigs active 22<br />
Permits 1,291<br />
<strong>State</strong>-wide rank<br />
Crude <strong>Oil</strong> Natural <strong>Gas</strong><br />
Wells drilled 14th 14th<br />
Production 10th 17th<br />
Reserves (2006) 9th 19th<br />
Number of operators 231<br />
Number of produc<strong>in</strong>g wells<br />
(12/31/06)<br />
Crude oil 4,272<br />
Natural gas 6,200<br />
Total 10,472<br />
Average production<br />
Crude oil (thous. b/d) 99<br />
NGL (thous. b/d) 0.5<br />
Natural gas (MMcf/day) 255<br />
Natural gas marketed production<br />
(MMcf) 112,845<br />
Average output per produc<strong>in</strong>g well<br />
Crude oil (bbls.) 8,433<br />
Natural gas (Mcf) 15,032<br />
Coalbed methane (YTD MMcf) 11,825<br />
<strong>Oil</strong> Wells 2<br />
<strong>Gas</strong> Wells 841<br />
Daily Average (MMcf) / Well 32<br />
Heavy oil (YTD BBls, <strong>in</strong> thous.) 192<br />
Wells 82<br />
Av. Bbls per day 0.5<br />
Av. Bbls per well/d 2,388<br />
Source: EIA for production and IHS for wells drilled.<br />
2006 Latest Available Data<br />
Petroleum reserves<br />
as of 12/31/06 (mill. bbls.)<br />
Crude <strong>Oil</strong> NGL Total<br />
New reserves 28 2 30<br />
Production 36 1 37<br />
Net annual change -8 1 -7<br />
Proved reserves 419 10 429<br />
Natural gas reserves<br />
as of 12/31/06 (Bcf)<br />
Associated Non- Dry<br />
Dissolved Associated <strong>Gas</strong><br />
New reserves 53 137 188<br />
Production 19 100 117<br />
Net annual change 34 37 71<br />
Proved reserves 195 874 1,057<br />
Cost of drill<strong>in</strong>g and equipp<strong>in</strong>g wells<br />
Cost/ft. Cost/ Total Cost<br />
($) well ($) (thous. $)<br />
<strong>Oil</strong> 360 3,897,889 1,450,015<br />
<strong>Gas</strong> 331 442,153 290,937<br />
Dry 368 1,250,303 110,027<br />
Marg<strong>in</strong>al oil wells<br />
<strong>Produc<strong>in</strong>g</strong> marg<strong>in</strong>al wells 2,938<br />
Crude oil production <strong>in</strong> bbls. (thous.) 3,519<br />
Crude oil production b/d (thous.) 10<br />
Marg<strong>in</strong>al natural gas wells<br />
as of 12/31/06<br />
<strong>Produc<strong>in</strong>g</strong> marg<strong>in</strong>al wells 5,276<br />
Natural gas production (MMcf) 43,617<br />
Federal onshore m<strong>in</strong>eral lease royalties<br />
<strong>Oil</strong> $ 27,874,390<br />
<strong>Gas</strong> $ 24,876,809<br />
Total Royalties $94,440,805<br />
Horizontal wells data<br />
Horizontal wells drilled 342<br />
Average number of employees<br />
<strong>Oil</strong> and natural gas extraction 2,711<br />
Refi n<strong>in</strong>g 0<br />
Transportation 720<br />
Wholesale 996<br />
Retail 5,095<br />
Pipel<strong>in</strong>e construction 385<br />
<strong>Oil</strong>fi eld mach<strong>in</strong>ery 0<br />
Total petroleum <strong>in</strong>dustry 9,907<br />
Montana’s first substantial oil production<br />
began <strong>in</strong> 1915 from wells drilled <strong>in</strong> the northern<br />
Elk Bas<strong>in</strong>, southeast of Belfry. Over the next<br />
40 years, more oil fi elds were developed <strong>in</strong> the<br />
Williston Bas<strong>in</strong>, Sweetgrass Arch, Big Snowy<br />
Uplift, Powder River Bas<strong>in</strong>, and northern<br />
extensions of the Big Horn Bas<strong>in</strong>.<br />
MONTANA<br />
COMPILED BY <strong>IPAA</strong> FEBRUARY 2009 AMERICA’S INDEPENDENT 61
NEBRASKA<br />
Keya Paha<br />
Boyd<br />
Dawes<br />
Sioux<br />
Cherry<br />
Knox<br />
Sheridan<br />
Holt<br />
Cedar Dixon<br />
Brown<br />
Rock<br />
Dakota<br />
Box Butte<br />
Antelope Pierce Wayne Thurston<br />
Scotts Bluff<br />
Banner<br />
Morrill<br />
Garden<br />
Kimball Cheyenne Deuel<br />
Hooker<br />
Bla<strong>in</strong>e<br />
Grant<br />
Thomas<br />
Loup<br />
Arthur McPherson Logan<br />
Custer<br />
Keith<br />
L<strong>in</strong>coln<br />
Perk<strong>in</strong>s<br />
Dawson<br />
Garfield Wheeler MadisonStanton<br />
Cum<strong>in</strong>g<br />
Boone<br />
Burt<br />
Platte Colfax Dodge<br />
Valley Greeley<br />
Wash<strong>in</strong>gton<br />
Nance<br />
Douglas<br />
ShermanHoward<br />
Merrick Polk Saunders<br />
Butler<br />
Sarpy<br />
Hamilton<br />
Buffalo Hall<br />
York SewardLancaster<br />
Hayes<br />
Gosper Phelps Kearney Adams Clay<br />
Chase<br />
Frontier<br />
Fillmore Sal<strong>in</strong>e<br />
Cass<br />
Otoe<br />
JohnsonNemaha<br />
HitchcockRed Willow<br />
WebsterNuckolls<br />
ThayerJefferson<br />
Gage<br />
Dundy<br />
Furnas Harlan Frankl<strong>in</strong><br />
PawneeRichardson<br />
Counties with oil and/or gas production<br />
Background Information<br />
Counties<br />
Number of counties 93<br />
With oil and/or gas production 18<br />
First year of production<br />
Crude oil 1939<br />
Natural gas 1950<br />
Year and amount of peak production<br />
Crude oil —24,894 thous. bbls. 1962<br />
Natural gas —15,743 MMcf 1961<br />
Deepest produc<strong>in</strong>g well (ft.)<br />
Crude oil 11,761<br />
Natural gas 5,832<br />
Year and depth of deepest well drilled (ft.)<br />
1997 13,128<br />
Cumulative number of total wells drilled<br />
as of 12/31/06 (exclud<strong>in</strong>g service wells)<br />
<strong>Oil</strong> wells 6,055 30%<br />
<strong>Gas</strong> wells 342 2%<br />
Dry holes 13,388 68%<br />
Total 19,785 100%<br />
Value of <strong>Oil</strong> and <strong>Gas</strong><br />
Average wellhead price<br />
(2006)<br />
Crude oil ($/bbl.) $ 57.77<br />
Natural gas ($Mcf)<br />
NA<br />
Wellhead value of production<br />
(2006, <strong>in</strong> thous. $)<br />
Crude oil $ 133,622<br />
Natural gas<br />
NA<br />
Total $ 133,622<br />
Average natural gas price<br />
(2006, $/Mcf)<br />
Residential consumers $ 11.30<br />
Commercial consumers $ 9.62<br />
Industrial consumers $ 8.37<br />
Electric utilities $ 7.31<br />
City Gate $ 8.27<br />
Severance taxes paid $2,796<br />
(2006, <strong>in</strong> thous. $)<br />
Cumulative crude oil wellhead value<br />
as of 12/31/06 (thous. $) $4,370,062<br />
NEBRASKA<br />
Cumulative production & new reserves<br />
as of 12/31/06<br />
Crude NGL Natural<br />
<strong>Oil</strong> (mill. bbls.) Total <strong>Gas</strong> (Bcf)<br />
Reserves 514 NA 514 NA<br />
Production 504 NA 504 NA<br />
62 AMERICA’S INDEPENDENT COMPILED BY <strong>IPAA</strong> FEBRUARY 2009
2006 <strong>Industry</strong> Statistics<br />
Number of wells drilled<br />
Exploratory Development Total<br />
<strong>Oil</strong> 6 19 25<br />
<strong>Gas</strong> 3 1 4<br />
Dry 22 14 36<br />
Total 31 34 65<br />
Total footage drilled<br />
(thous. ft.)<br />
Exploratory Development Total<br />
<strong>Oil</strong> 22.6 79.6 102.3<br />
<strong>Gas</strong> 12.9 5.6 18.5<br />
Dry 88.4 71.5 159.9<br />
Total 123.9 156.8 280.6<br />
(Note: Totals may not add due to round<strong>in</strong>g.)<br />
New-field wildcats drilled 20<br />
Footage (thous. ft.) 78.7<br />
Average rotary rigs active 0<br />
Permits 118<br />
<strong>State</strong>-wide rank<br />
Crude <strong>Oil</strong> Natural <strong>Gas</strong><br />
Wells drilled 23rd 25th<br />
Production 23rd 26th<br />
Reserves (2006) 24th NA<br />
Number of operators 99<br />
Number of produc<strong>in</strong>g wells<br />
(12/31/06)<br />
Crude oil 1,229<br />
Natural gas 117<br />
Total 1,346<br />
Average production<br />
Crude oil (thous. b/d) 6<br />
NGL (thous. b/d) 0<br />
Natural gas (MMcf/day) 2<br />
Natural gas marketed production<br />
(MMcf) 1,200<br />
Average output per produc<strong>in</strong>g well<br />
Crude oil (bbls.) 1,869<br />
Natural gas (Mcf) 7,671<br />
Coalbed methane (YTD MMcf)<br />
<strong>Oil</strong> Wells<br />
<strong>Gas</strong> Wells<br />
Daily Average (MMcf) / Well<br />
Heavy oil (YTD BBls, <strong>in</strong> thous.)<br />
Wells<br />
Av. Bbls per day<br />
Av. Bbls per well/d<br />
NA<br />
NA<br />
NA<br />
NA<br />
NA<br />
NA<br />
NA<br />
Source: EIA for production and IHS for wells drilled.<br />
2006 Latest Available Data<br />
Petroleum reserves<br />
as of 12/31/06 (mill. bbls.)<br />
Crude <strong>Oil</strong> NGL Total<br />
New reserves 0 NA 0<br />
Production 2 NA 2<br />
Net annual change -2 NA -2<br />
Proved reserves 14 NA 14<br />
Natural gas reserves<br />
as of 12/31/06 (Bcf)<br />
Associated Non- Dry<br />
Dissolved Associated <strong>Gas</strong><br />
New reserves NA NA NA<br />
Production NA NA NA<br />
Net annual change NA NA NA<br />
Proved reserves NA NA NA<br />
Cost of drill<strong>in</strong>g and equipp<strong>in</strong>g wells<br />
Cost/ft. Cost/ Total Cost<br />
($) well ($) (thous. $)<br />
<strong>Oil</strong> 140 572,814 14,320<br />
<strong>Gas</strong> 133 614,662 2,459<br />
Dry 131 579,814 20,873<br />
Marg<strong>in</strong>al oil wells<br />
<strong>Produc<strong>in</strong>g</strong> marg<strong>in</strong>al wells 1,181<br />
Crude oil production <strong>in</strong> bbls. (thous.) 1,676<br />
Crude oil production b/d (thous.) 5<br />
Marg<strong>in</strong>al natural gas wells<br />
as of 12/31/06<br />
<strong>Produc<strong>in</strong>g</strong> marg<strong>in</strong>al wells 103<br />
Natural gas production (MMcf) 774<br />
Federal onshore m<strong>in</strong>eral lease royalties<br />
<strong>Oil</strong> $ 230,422<br />
<strong>Gas</strong> --<br />
Total Royalties $ 270,774<br />
Horizontal wells data<br />
Horizontal wells drilled 0<br />
Average number of employees<br />
<strong>Oil</strong> and natural gas extraction 236<br />
Refi n<strong>in</strong>g 0<br />
Transportation 1,744<br />
Wholesale 1,251<br />
Retail 8,838<br />
Pipel<strong>in</strong>e construction 132<br />
<strong>Oil</strong>fi eld mach<strong>in</strong>ery 0<br />
Total petroleum <strong>in</strong>dustry 12,201<br />
The Nebraska legislature awarded a<br />
$15,000 bonus to the Pawnee Royalty Co. for<br />
the Bucholz Well No. 1, the fi rst oil well <strong>in</strong> the<br />
state to produce at least 50 barrels daily for 60<br />
consecutive days. The well began produc<strong>in</strong>g<br />
on May 29, 1940.<br />
NEBRASKA<br />
COMPILED BY <strong>IPAA</strong> FEBRUARY 2009 AMERICA’S INDEPENDENT 63
Humboldt<br />
NEVADA<br />
Washoe<br />
Persh<strong>in</strong>g<br />
Elko<br />
Lander<br />
Eureka<br />
Storey<br />
Churchill<br />
White P<strong>in</strong>e<br />
Carson City<br />
Douglas<br />
Lyon<br />
M<strong>in</strong>eral<br />
Nye<br />
Esmeralda<br />
L<strong>in</strong>coln<br />
Clark<br />
Counties with oil and/or gas production<br />
Background Information<br />
Counties<br />
Number of counties 17<br />
With oil and/or gas production 2<br />
First year of production<br />
Crude oil 1954<br />
Natural gas<br />
NA<br />
Year and amount of peak production<br />
Crude oil —3,230 thous. bbls. 1988<br />
Natural gas —<br />
NA<br />
Deepest produc<strong>in</strong>g well (ft.)<br />
Crude oil 8,050<br />
Natural gas<br />
NA<br />
Year and depth of deepest well drilled (ft.)<br />
1980 19,562<br />
Cumulative number of total wells drilled<br />
as of 12/31/06 (exclud<strong>in</strong>g service wells)<br />
<strong>Oil</strong> wells 121 14%<br />
<strong>Gas</strong> wells 2 0%<br />
Dry holes 774 86%<br />
Total 897 100%<br />
Value of <strong>Oil</strong> and <strong>Gas</strong><br />
Average wellhead price<br />
(2006)<br />
Crude oil ($/bbl.) $58.30<br />
Natural gas ($Mcf)<br />
NA<br />
Wellhead value of production<br />
(2006, <strong>in</strong> thous. $)<br />
Crude oil $24,836<br />
Natural gas<br />
NA<br />
Total $24,836<br />
Average natural gas price<br />
(2006, $/Mcf)<br />
Residential consumers $ 14.31<br />
Commercial consumers $ 12.12<br />
Industrial consumers $ 12.00<br />
Electric utilities $ 6.79<br />
City Gate $ 8.64<br />
Severance taxes paid $42<br />
(2006, <strong>in</strong> thous. $)<br />
Cumulative crude oil wellhead value<br />
as of 12/31/06 (thous. $) $847,349<br />
NEVADA<br />
Cumulative production & new reserves<br />
as of 12/31/06<br />
Crude NGL Natural<br />
<strong>Oil</strong> (mill. bbls.) Total <strong>Gas</strong> (Bcf)<br />
Reserves NA NA NA NA<br />
Production NA NA NA NA<br />
64 AMERICA’S INDEPENDENT COMPILED BY <strong>IPAA</strong> FEBRUARY 2009
2006 <strong>Industry</strong> Statistics<br />
Number of wells drilled<br />
Exploratory Development Total<br />
<strong>Oil</strong> NA NA NA<br />
<strong>Gas</strong> NA NA NA<br />
Dry 1 NA 1<br />
Total 1 NA 1<br />
Total footage drilled<br />
(thous. ft.)<br />
Exploratory Development Total<br />
<strong>Oil</strong> NA NA NA<br />
<strong>Gas</strong> NA NA NA<br />
Dry 7.4 NA 7.4<br />
Total 7.4 NA 7.4<br />
(Note: Totals may not add due to round<strong>in</strong>g.)<br />
New-field wildcats drilled 1<br />
Footage (thous. ft.) 7.4<br />
Average rotary rigs active 1<br />
Permits 7<br />
<strong>State</strong>-wide rank<br />
Crude <strong>Oil</strong> Natural <strong>Gas</strong><br />
Wells drilled 34th 35th<br />
Production 27th 32nd<br />
Reserves (2006) NA NA<br />
Number of operators 7<br />
Number of produc<strong>in</strong>g wells<br />
(12/31/06)<br />
Crude oil 68<br />
Natural gas 0<br />
Total 68<br />
Average production<br />
Crude oil (thous. b/d) 1<br />
NGL (thous. b/d) 0<br />
Natural gas (MMcf/day) 0<br />
Natural gas marketed production<br />
(MMcf) 5<br />
Average output per produc<strong>in</strong>g well<br />
Crude oil (bbls.) 6,261<br />
Natural gas (Mcf) 0<br />
Coalbed methane (YTD MMcf)<br />
<strong>Oil</strong> Wells<br />
<strong>Gas</strong> Wells<br />
Daily Average (MMcf) / Well<br />
NA<br />
NA<br />
NA<br />
2006 Latest Available Data<br />
Petroleum reserves<br />
as of 12/31/06 (mill. bbls.)<br />
Crude <strong>Oil</strong> NGL Total<br />
New reserves NA NA NA<br />
Production NA NA NA<br />
Net annual change NA NA NA<br />
Proved reserves NA NA NA<br />
Natural gas reserves<br />
as of 12/31/06 (Bcf)<br />
Associated Non- Dry<br />
Dissolved Associated <strong>Gas</strong><br />
New reserves NA NA NA<br />
Production NA NA NA<br />
Net annual change NA NA NA<br />
Proved reserves NA NA NA<br />
Cost of drill<strong>in</strong>g and equipp<strong>in</strong>g wells<br />
Cost/ft. Cost/ Total Cost<br />
($) well ($) (thous. $)<br />
<strong>Oil</strong> NA NA NA<br />
<strong>Gas</strong> NA NA NA<br />
Dry 146 1,079,956 1,080<br />
Marg<strong>in</strong>al oil wells<br />
<strong>Produc<strong>in</strong>g</strong> marg<strong>in</strong>al wells 45<br />
Crude oil production <strong>in</strong> bbls. (thous.) 117<br />
Crude oil production b/d (thous.) 0<br />
Marg<strong>in</strong>al natural gas wells<br />
as of 12/31/06<br />
<strong>Produc<strong>in</strong>g</strong> marg<strong>in</strong>al wells 0<br />
Natural gas production (MMcf) 0<br />
Federal onshore m<strong>in</strong>eral lease royalties<br />
<strong>Oil</strong> $ 2,734,895<br />
<strong>Gas</strong> --<br />
Total Royalties $15,542,861<br />
Horizontal wells data<br />
Horizontal wells drilled 0<br />
Average number of employees<br />
<strong>Oil</strong> and natural gas extraction 130<br />
Refi n<strong>in</strong>g 0<br />
Transportation 20<br />
Wholesale 761<br />
Retail 8,619<br />
Pipel<strong>in</strong>e construction 743<br />
<strong>Oil</strong>fi eld mach<strong>in</strong>ery 0<br />
Total petroleum <strong>in</strong>dustry 10,273<br />
Heavy oil (YTD BBls, <strong>in</strong> thous.)<br />
NA<br />
Wells<br />
NA<br />
Av. Bbls per day<br />
NA<br />
Av. Bbls per well/d<br />
NA<br />
Source: EIA for production and IHS for wells drilled.<br />
On Feb. 12, 1954, Shell <strong>Oil</strong> Co. drilled<br />
the Eagle Spr<strong>in</strong>gs No.1 — the discovery well<br />
for the Railroad Valley fi eld and the state’s fi rst<br />
producer.<br />
NEVADA<br />
COMPILED BY <strong>IPAA</strong> FEBRUARY 2009 AMERICA’S INDEPENDENT 65
San Juan<br />
Rio Arriba<br />
Taos<br />
Colfax<br />
Union<br />
NEW MEXICO<br />
McK<strong>in</strong>ley<br />
Sandoval<br />
Los Alamos<br />
Santa Fe<br />
Mora<br />
San Miguel<br />
Hard<strong>in</strong>g<br />
Cibola<br />
Bernalillo<br />
Guadalupe<br />
Quay<br />
Valencia<br />
Torrance<br />
Curry<br />
De Baca<br />
Catron<br />
Socorro<br />
L<strong>in</strong>coln<br />
Roosevelt<br />
Chaves<br />
Sierra<br />
Grant<br />
Dona Ana<br />
Otero<br />
Eddy<br />
Lea<br />
Luna<br />
Hidalgo<br />
Counties with oil and/or gas production<br />
Background Information<br />
Counties<br />
Number of counties 33<br />
With oil and/or gas production 9<br />
First year of production<br />
Crude oil 1911<br />
Natural gas 1924<br />
Year and amount of peak production<br />
Crude oil — 129,227 thous. bbls. 1969<br />
Natural gas — 1,689,125 MMcf 2001<br />
Deepest produc<strong>in</strong>g well (ft.)<br />
Crude oil 18,380<br />
Natural gas 26,579<br />
Year and depth of deepest well drilled (ft.)<br />
1969 22,926<br />
Cumulative number of total wells drilled<br />
as of 12/31/06 (exclud<strong>in</strong>g service wells)<br />
<strong>Oil</strong> wells 49,229 47%<br />
<strong>Gas</strong> wells 38,115 36%<br />
Dry holes 18,370 17%<br />
Total 105,789 100%<br />
Value of <strong>Oil</strong> and <strong>Gas</strong><br />
Average wellhead price<br />
(2006)<br />
Crude oil ($/bbl.) $ 61.74<br />
Natural gas ($Mcf) $ 6.18<br />
Wellhead value of production<br />
(2006, <strong>in</strong> thous. $)<br />
Crude oil $ 3,693,163<br />
Natural gas $ 9,944,998<br />
Total $ 13,638,161<br />
Average natural gas price<br />
(2006, $/Mcf)<br />
Residential consumers $ 12.64<br />
Commercial consumers $10.65<br />
Industrial consumers $ 8.92<br />
Electric utilities<br />
NA<br />
City Gate $ 6.82<br />
Severance taxes paid $ 1,169,271<br />
(2006, <strong>in</strong> thous. $)<br />
NEW MEXICO<br />
Cumulative crude oil wellhead value<br />
as of 12/31/06 (thous. $) $57,682,580<br />
Cumulative production & new reserves<br />
as of 12/31/06<br />
Crude NGL Natural<br />
<strong>Oil</strong> (mill. bbls.) Total <strong>Gas</strong> (Bcf)<br />
Reserves 7,123 3,268 10,391 81,824<br />
Production 6,486 2,302 8,788 63,887<br />
66 AMERICA’S INDEPENDENT COMPILED BY <strong>IPAA</strong> FEBRUARY 2009
2006 <strong>Industry</strong> Statistics<br />
Number of wells drilled<br />
Exploratory Development Total<br />
<strong>Oil</strong> 25 599 624<br />
<strong>Gas</strong> 53 1,250 1,303<br />
Dry 36 65 101<br />
Total 114 1,914 2,028<br />
Total footage drilled<br />
(thous. ft.)<br />
Exploratory Development Total<br />
<strong>Oil</strong> 108.3 3,632.4 3,740.7<br />
<strong>Gas</strong> 384.0 7,512.2 7,896.2<br />
Dry 132.9 308.4 441.3<br />
Total 625.1 11,453.0 12,078.1<br />
(Note: Totals may not add due to round<strong>in</strong>g.)<br />
New-field wildcats drilled 65<br />
Footage (thous. ft.) 287.4<br />
Average rotary rigs active 94<br />
Permits 3,195<br />
<strong>State</strong>-wide rank<br />
Crude <strong>Oil</strong> Natural <strong>Gas</strong><br />
Wells drilled 7th 7th<br />
Production 7th 5th<br />
Reserves (2006) 6th 3rd<br />
Number of operators 568<br />
Number of produc<strong>in</strong>g wells<br />
(12/31/06)<br />
Crude oil 21,219<br />
Natural gas 31,246<br />
Total 52,465<br />
Average production<br />
Crude oil (thous. b/d) 147<br />
NGL (thous. b/d) 18<br />
Natural gas (MMcf/day) 3,705<br />
Natural gas marketed production<br />
(MMcf) 1,609,223<br />
Average output per produc<strong>in</strong>g well<br />
Crude oil (bbls.) 2,529<br />
Natural gas (Mcf) 43,277<br />
Coalbed methane (YTD MMcf) 511,856<br />
<strong>Oil</strong> Wells 0<br />
<strong>Gas</strong> Wells 4,988<br />
Daily Average (MMcf) / Well 1,402<br />
Heavy oil (YTD BBls, <strong>in</strong> thous.) 18<br />
Wells 34<br />
Av. Bbls per day 0.1<br />
Av. Bbls per well/d 537<br />
Source: EIA for production and IHS for wells drilled.<br />
2006 Latest Available Data<br />
Petroleum reserves<br />
as of 12/31/06 (mill. bbls.)<br />
Crude <strong>Oil</strong> NGL Total<br />
New reserves 71 99 170<br />
Production 56 78 134<br />
Net annual change 15 21 36<br />
Proved reserves 705 861 1,566<br />
Natural gas reserves<br />
as of 12/31/06 (Bcf)<br />
Associated Non- Dry<br />
Dissolved Associated <strong>Gas</strong><br />
New reserves 304 981 1,159<br />
Production 193 1,332 1,426<br />
Net annual change 111 -351 -267<br />
Proved reserves 1,772 17,332 17,934<br />
Cost of drill<strong>in</strong>g and equipp<strong>in</strong>g wells<br />
Cost/ft. Cost/ Total Cost<br />
($) well ($) (thous. $)<br />
<strong>Oil</strong> 217 1,302,743 812,912<br />
<strong>Gas</strong> 202 1,222,989 1,593,555<br />
Dry 327 1,430,211 144,451<br />
Marg<strong>in</strong>al oil wells<br />
<strong>Produc<strong>in</strong>g</strong> marg<strong>in</strong>al wells 17,759<br />
Crude oil production <strong>in</strong> bbls. (thous.) 22,253<br />
Crude oil production b/d (thous.) 61<br />
Marg<strong>in</strong>al natural gas wells<br />
as of 12/31/06<br />
<strong>Produc<strong>in</strong>g</strong> marg<strong>in</strong>al wells 20,461<br />
Natural gas production <strong>in</strong> MMcf (thous.) 261,711<br />
Federal onshore m<strong>in</strong>eral lease royalties<br />
<strong>Oil</strong> $ 287,445,113<br />
<strong>Gas</strong> $ 810,013,305<br />
Total Royalties $ 1,268,142,550<br />
Horizontal wells data<br />
Horizontal wells drilled 148<br />
Average number of employees<br />
<strong>Oil</strong> and natural gas extraction 14,402<br />
Refi n<strong>in</strong>g 716<br />
Transportation 1,626<br />
Wholesale 1,607<br />
Retail 7,814<br />
Pipel<strong>in</strong>e construction 214<br />
<strong>Oil</strong>fi eld mach<strong>in</strong>ery 0<br />
Total petroleum <strong>in</strong>dustry 26,379<br />
Twenty miles west of Farm<strong>in</strong>gton,<br />
Midwest Refi n<strong>in</strong>g brought <strong>in</strong> New Mexico’s<br />
fi rst commercially successful oil well <strong>in</strong><br />
September 1922.<br />
NEW MEXICO<br />
COMPILED BY <strong>IPAA</strong> FEBRUARY 2009 AMERICA’S INDEPENDENT 67
NEW YORK<br />
Jefferson<br />
St. Lawrence<br />
Frankl<strong>in</strong><br />
Cl<strong>in</strong>ton<br />
Essex<br />
Chautauqua<br />
Lewis<br />
Oswego<br />
Niagara<br />
Orleans<br />
Oneida<br />
Monroe Wayne<br />
Genesee<br />
Onondaga<br />
Ontario<br />
Erie<br />
Seneca<br />
Madison<br />
Cayuga<br />
Wyom<strong>in</strong>gLiv<strong>in</strong>gston<br />
Yates<br />
CortlandChenango<br />
Tompk<strong>in</strong>s<br />
Schuyler<br />
Cattaraugus Allegany Steuben<br />
Chemung Tioga<br />
Broome<br />
Hamilton<br />
Warren<br />
Herkimer<br />
Wash<strong>in</strong>gton<br />
Fulton Saratoga<br />
Montgomery<br />
Schenectady<br />
Rensselaer<br />
Otsego<br />
Schoharie Albany<br />
Greene<br />
Delaware<br />
Columbia<br />
Counties with oil and/or gas production<br />
Sullivan<br />
Ulster<br />
Dutchess<br />
Orange<br />
Putnam<br />
RocklandWestchester<br />
New YorkBronx<br />
QueensNassau<br />
RichmondK<strong>in</strong>gsQueens<br />
Suffolk<br />
Background Information<br />
Counties<br />
Number of counties 62<br />
With oil and/or gas production 21<br />
First year of production<br />
Crude oil 1865<br />
Natural gas 1821<br />
Year and amount of peak production<br />
Crude oil — 6,685 thous. bbls. 1882<br />
Natural gas — 55,980 MMcf 2006<br />
Deepest produc<strong>in</strong>g well (ft.)<br />
Crude oil 11,193<br />
Natural gas 11,329<br />
Year and depth of deepest well drilled (ft.)<br />
2002 15,000<br />
Cumulative number of total wells drilled<br />
as of 12/31/06 (exclud<strong>in</strong>g service wells)<br />
<strong>Oil</strong> wells 2,614 20%<br />
<strong>Gas</strong> wells 7,910 61%<br />
Dry holes 2,453 19%<br />
Total 12,977 100%<br />
Value of <strong>Oil</strong> and <strong>Gas</strong><br />
Average wellhead price<br />
(2006)<br />
Crude oil ($/bbl.) $ 63.51<br />
Natural gas ($Mcf) $ 7.13<br />
Wellhead value of production<br />
(2006, <strong>in</strong> thous. $)<br />
Crude oil $ 20,260<br />
Natural gas $ 399,137<br />
Total $ 419,397<br />
Average natural gas price<br />
(2006, $/Mcf)<br />
Residential consumers $ 15.35<br />
Commercial consumers $ 11.91<br />
Industrial consumers $ 10.56<br />
Electric utilities $ 7.75<br />
City Gate $ 9.22<br />
Severance taxes paid --<br />
(2006, <strong>in</strong> thous. $)<br />
NEW YORK<br />
Cumulative crude oil wellhead value<br />
as of 12/31/06 (thous. $) $1,150,450<br />
Cumulative production & new reserves<br />
as of 12/31/06<br />
Crude NGL Natural<br />
<strong>Oil</strong> (mill. bbls.) Total <strong>Gas</strong> (Bcf)<br />
Reserves NA NA NA 1,556<br />
Production NA NA NA 1,207<br />
68 AMERICA’S INDEPENDENT COMPILED BY <strong>IPAA</strong> FEBRUARY 2009
2006 <strong>Industry</strong> Statistics<br />
Number of wells drilled<br />
Exploratory Development Total<br />
<strong>Oil</strong> 1 107 108<br />
<strong>Gas</strong> 12 119 131<br />
Dry 2 1 3<br />
Total 15 227 242<br />
Total footage drilled<br />
(thous. ft.)<br />
Exploratory Development Total<br />
<strong>Oil</strong> 2.8 184.3 187.1<br />
<strong>Gas</strong> 65.9 375.9 441.7<br />
Dry 18.0 3.7 21.67<br />
Total 86.6 563.8 650.5<br />
(Note: Totals may not add due to round<strong>in</strong>g.)<br />
New-field wildcats drilled 13<br />
Footage (thous. ft.) 69.2<br />
Average rotary rigs active 6<br />
Permits 578<br />
<strong>State</strong>-wide rank<br />
Crude <strong>Oil</strong> Natural <strong>Gas</strong><br />
Wells drilled 15th 15th<br />
Production 28th 21st<br />
Reserves (2006) NA 23rd<br />
Number of operators 427<br />
Number of produc<strong>in</strong>g wells<br />
(12/31/06)<br />
Crude oil 2,395<br />
Natural gas 6,764<br />
Total 9,159<br />
Average production<br />
Crude oil (thous. b/d) 1<br />
NGL (thous. b/d) 0.3<br />
Natural gas (MMcf/day) 109<br />
Natural gas marketed production<br />
(MMcf) 55,980<br />
Average output per produc<strong>in</strong>g well<br />
Crude oil (bbls.) 79<br />
Natural gas (Mcf) 5,875<br />
Coalbed methane (YTD MMcf)<br />
<strong>Oil</strong> Wells<br />
<strong>Gas</strong> Wells<br />
Daily Average (MMcf) / Well<br />
Heavy oil (YTD BBls, <strong>in</strong> thous.)<br />
Wells<br />
Av. Bbls per day<br />
Av. Bbls per well/d<br />
NA<br />
NA<br />
NA<br />
NA<br />
NA<br />
NA<br />
NA<br />
Source: EIA for production and IHS for wells drilled.<br />
2006 Latest Available Data<br />
Petroleum reserves<br />
as of 12/31/06 (mill. bbls.)<br />
Crude <strong>Oil</strong> NGL Total<br />
New reserves NA NA NA<br />
Production NA NA NA<br />
Net annual change NA NA NA<br />
Proved reserves NA NA NA<br />
Natural gas reserves<br />
as of 12/31/06 (Bcf)<br />
Associated Non- Dry<br />
Dissolved Associated <strong>Gas</strong><br />
New reserves -1 64 64<br />
Production 0 49 50<br />
Net annual change -1 15 14<br />
Proved reserves 2 361 363<br />
Cost of drill<strong>in</strong>g and equipp<strong>in</strong>g wells<br />
Cost/ft. Cost/ Total Cost<br />
($) well ($) (thous. $)<br />
<strong>Oil</strong> 128 222,446 24,024<br />
<strong>Gas</strong> 147 496,064 64,984<br />
Dry 283 2,046,736 6,140<br />
Marg<strong>in</strong>al oil wells<br />
<strong>Produc<strong>in</strong>g</strong> marg<strong>in</strong>al wells 2,073<br />
Crude oil production <strong>in</strong> bbls. (thous.) 188<br />
Crude oil production b/d (thous.) 1<br />
Marg<strong>in</strong>al natural gas wells<br />
as of 12/31/06<br />
<strong>Produc<strong>in</strong>g</strong> marg<strong>in</strong>al wells 6,512<br />
Natural gas production (MMcf) 10,828<br />
Federal onshore m<strong>in</strong>eral lease royalties<br />
<strong>Oil</strong> --<br />
<strong>Gas</strong> $22,688<br />
Total Royalties $22,688<br />
Horizontal wells data<br />
Horizontal wells drilled 0<br />
Average number of employees<br />
<strong>Oil</strong> and natural gas extraction 930<br />
Refi n<strong>in</strong>g 466<br />
Transportation 3,963<br />
Wholesale 13,762<br />
Retail 28,314<br />
Pipel<strong>in</strong>e construction 1,398<br />
<strong>Oil</strong>fi eld mach<strong>in</strong>ery 0<br />
Total petroleum <strong>in</strong>dustry 48,833<br />
In November 1865, Job Moses and his<br />
Hall Farm Petroleum Co. found oil <strong>in</strong> Carrollton<br />
Township, Cattaraugus County. The Moses No. 1<br />
well was drilled to 1,165 feet. Initial production was<br />
seven barrels per day, but the well was on the edge<br />
of what would become the giant Bradford oilfi eld.<br />
NEW YORK<br />
COMPILED BY <strong>IPAA</strong> FEBRUARY 2009 AMERICA’S INDEPENDENT 69
NORTH DAKOTA<br />
Divide<br />
Burke<br />
Renville<br />
Bott<strong>in</strong>eau<br />
Rolette<br />
Towner<br />
Cavalier<br />
Pemb<strong>in</strong>a<br />
Williams<br />
Mountrail<br />
Ward<br />
McHenry<br />
Pierce<br />
Benson<br />
Ramsey<br />
Nelson<br />
Walsh<br />
Grand Forks<br />
McKenzie<br />
Dunn<br />
Mercer<br />
McLean<br />
Sheridan<br />
Wells<br />
Eddy<br />
Foster<br />
Griggs<br />
Steele<br />
Traill<br />
Bill<strong>in</strong>gs<br />
Golden Valley<br />
Stark<br />
Oliver<br />
Morton<br />
Burleigh<br />
Kidder<br />
Stutsman<br />
Barnes<br />
Cass<br />
Slope<br />
Bowman<br />
Hett<strong>in</strong>ger<br />
Adams<br />
Grant<br />
Sioux<br />
Emmons<br />
Logan<br />
McIntosh<br />
LaMoure<br />
Dickey<br />
Ransom<br />
Sargent<br />
Richland<br />
Counties with oil and/or gas production<br />
Background Information<br />
Counties<br />
Number of counties 53<br />
With oil and/or gas production 16<br />
First year of production<br />
Crude oil 1951<br />
Natural gas 1907<br />
Year and amount of peak production<br />
Crude oil — 52,654 thous. bbls. 1984<br />
Natural gas — 72,633 MMcf 1985<br />
Deepest produc<strong>in</strong>g well (ft.)<br />
Crude oil (25,828 MD horizontal) 16,510<br />
Natural gas (19,579 MD horizontal) 15,300<br />
Year and depth of deepest well drilled (ft.)<br />
2006 (18,262 MD horizontal-2000) 20,362<br />
Value of <strong>Oil</strong> and <strong>Gas</strong><br />
Average wellhead price<br />
(2006)<br />
Crude oil ($/bbl.) $ 56.69<br />
Natural gas ($Mcf) $ 6.52<br />
Wellhead value of production<br />
(2006, <strong>in</strong> thous. $)<br />
Crude oil $ 2,262,555<br />
Natural gas $ 360,380<br />
Total $ 2,622,935<br />
Average natural gas price<br />
(2006, $/Mcf)<br />
Residential consumers $ 10.80<br />
Commercial consumers $ 9.68<br />
Industrial consumers $ 6.54<br />
Electric utilities $ 10.93<br />
City Gate $ 7.82<br />
Severance taxes paid $ 166,147<br />
(2006, <strong>in</strong> thous. $)<br />
NORTH DAKOTA<br />
Cumulative number of total wells drilled<br />
as of 12/31/06 (exclud<strong>in</strong>g service wells)<br />
<strong>Oil</strong> wells 9,522 58%<br />
<strong>Gas</strong> wells 351 2%<br />
Dry holes 6,633 40%<br />
Total 16,506 100%<br />
Cumulative crude oil wellhead value<br />
as of 12/31/06 (thous. $) $27,438,844<br />
Cumulative production & new reserves<br />
as of 12/31/06<br />
Crude NGL Natural<br />
<strong>Oil</strong> (mill. bbls.) Total <strong>Gas</strong> (Bcf)<br />
Reserves 1,936 251 2,187 2,771<br />
Production 1,535 174 1,709 2,308<br />
70 AMERICA’S INDEPENDENT COMPILED BY <strong>IPAA</strong> FEBRUARY 2009
2006 <strong>Industry</strong> Statistics<br />
Number of wells drilled<br />
Exploratory Development Total<br />
<strong>Oil</strong> 137 243 380<br />
<strong>Gas</strong> 5 64 69<br />
Dry 23 15 38<br />
Total 165 322 487<br />
Total footage drilled<br />
(thous. ft.)<br />
Exploratory Development Total<br />
<strong>Oil</strong> 1,517.2 2,193.7 3,710.9<br />
<strong>Gas</strong> 47.9 144.8 192.7<br />
Dry 250.1 134.8 384.9<br />
Total 1,815.1 2,473.3 4,288.5<br />
(Note: Totals may not add due to round<strong>in</strong>g.)<br />
New-field wildcats drilled 104<br />
Footage (thous. ft.) 1,128.1<br />
Average rotary rigs active 32<br />
Permits 635<br />
<strong>State</strong>-wide rank<br />
Crude <strong>Oil</strong> Natural <strong>Gas</strong><br />
Wells drilled 20th 26th<br />
Production 9th 22nd<br />
Reserves (2006) 10th 22nd<br />
Number of operators 152<br />
Number of produc<strong>in</strong>g wells<br />
(12/31/06)<br />
Crude oil 3,512<br />
Natural gas 371<br />
Total 3,883<br />
Average production<br />
Crude oil (thous. b/d) 101<br />
NGL (thous. b/d) 7.7<br />
Natural gas (MMcf/day) 47<br />
Natural gas marketed production<br />
(MMcf) 55,273<br />
Average output per produc<strong>in</strong>g well<br />
Crude oil (bbls.) 10,468<br />
Natural gas (Mcf) 46,404<br />
Coalbed methane (YTD MMcf)<br />
<strong>Oil</strong> Wells<br />
<strong>Gas</strong> Wells<br />
Daily Average (MMcf) / Well<br />
Heavy oil (YTD BBls, <strong>in</strong> thous.)<br />
Wells<br />
Av. Bbls per day<br />
Av. Bbls per well/d<br />
NA<br />
NA<br />
NA<br />
NA<br />
NA<br />
NA<br />
NA<br />
Source: EIA for production and IHS for wells drilled.<br />
2006 Latest Available Data<br />
Petroleum reserves<br />
as of 12/31/06 (mill. bbls.)<br />
Crude <strong>Oil</strong> NGL Total<br />
New reserves 32 12 44<br />
Production 38 6 44<br />
Net annual change -6 6 0<br />
Proved reserves 412 55 467<br />
Natural gas reserves<br />
as of 12/31/06 (Bcf)<br />
Associated Non- Dry<br />
Dissolved Associated <strong>Gas</strong><br />
New reserves 54 35 78<br />
Production 40 18 52<br />
Net annual change 14 17 26<br />
Proved reserves 357 182 479<br />
Cost of drill<strong>in</strong>g and equipp<strong>in</strong>g wells<br />
Cost/ft. Cost/ Total Cost<br />
($) well ($) (thous. $)<br />
<strong>Oil</strong> 352 3,442,221 1,308,044<br />
<strong>Gas</strong> 439 1,227,356 84,688<br />
Dry 280 2,836,129 107,773<br />
Marg<strong>in</strong>al oil wells<br />
<strong>Produc<strong>in</strong>g</strong> marg<strong>in</strong>al wells 2,146<br />
Crude oil production <strong>in</strong> bbls. (thous.) 4,710<br />
Crude oil production b/d (thous.) 13<br />
Marg<strong>in</strong>al natural gas wells<br />
as of 12/31/06<br />
<strong>Produc<strong>in</strong>g</strong> marg<strong>in</strong>al wells 244<br />
Natural gas production (MMcf) 2,670<br />
Federal onshore m<strong>in</strong>eral lease royalties<br />
<strong>Oil</strong> $ 44,957,328<br />
<strong>Gas</strong> $ 6,193,948<br />
Total Royalties $ 69,146,231<br />
Horizontal wells data<br />
Horizontal wells drilled 375<br />
Average number of employees<br />
<strong>Oil</strong> and natural gas extraction 3,101<br />
Refi n<strong>in</strong>g 0<br />
Transportation 240<br />
Wholesale 1,671<br />
Retail 4,058<br />
Pipel<strong>in</strong>e construction 167<br />
<strong>Oil</strong>fi eld mach<strong>in</strong>ery 0<br />
Total petroleum <strong>in</strong>dustry 9,237<br />
On April 4, 1951, on the Clarence Iverson<br />
farm, eight miles south of Tioga, the Amerada<br />
Hess Petroleum Corp. brought <strong>in</strong> the discovery<br />
well for the Williston Bas<strong>in</strong>. The bas<strong>in</strong> extends<br />
from South Dakota to western Canada, and from<br />
central North Dakota to central Montana.<br />
NORTH DAKOTA<br />
COMPILED BY <strong>IPAA</strong> FEBRUARY 2009 AMERICA’S INDEPENDENT 71
OHIO<br />
Williams<br />
Defiance<br />
Fulton<br />
Henry<br />
Lucas<br />
Wood<br />
Ottawa<br />
Sandusky<br />
Erie<br />
Lora<strong>in</strong><br />
Cuyahoga<br />
Lake<br />
Geauga<br />
Ashtabula<br />
Trumbull<br />
Pauld<strong>in</strong>g<br />
Seneca<br />
Huron<br />
Med<strong>in</strong>a<br />
Summit<br />
Portage<br />
Putnam<br />
Hancock<br />
Mahon<strong>in</strong>g<br />
Van Wert<br />
Allen<br />
Wyandot<br />
Crawford<br />
Ashland<br />
Richland<br />
Wayne<br />
Stark<br />
Columbiana<br />
Hard<strong>in</strong><br />
Mercer<br />
Auglaize<br />
Marion<br />
Morrow<br />
Holmes<br />
Carroll<br />
Shelby<br />
Logan<br />
Union<br />
Delaware<br />
Knox<br />
Coshocton<br />
Tuscarawas<br />
Harrison<br />
Jefferson<br />
Darke<br />
Miami<br />
Champaign<br />
Clark<br />
Madison<br />
Frankl<strong>in</strong><br />
Lick<strong>in</strong>g<br />
Musk<strong>in</strong>gum<br />
Guernsey<br />
Belmont<br />
Preble Montgomery<br />
Butler Warren<br />
Hamilton<br />
Greene<br />
Fayette<br />
Cl<strong>in</strong>ton<br />
Highland<br />
Pickaway<br />
Ross<br />
Fairfield Perry<br />
Morgan<br />
Hock<strong>in</strong>g<br />
Athens<br />
V<strong>in</strong>ton<br />
Noble<br />
Wash<strong>in</strong>gton<br />
Monroe<br />
Clermont<br />
Brown<br />
Pike<br />
Jackson<br />
Meigs<br />
Adams<br />
Scioto<br />
Gallia<br />
Counties with oil and/or gas production<br />
Lawrence<br />
Background Information<br />
Counties<br />
Number of counties 88<br />
With oil and/or gas production 56<br />
First year of production<br />
Crude oil 1860<br />
Natural gas 1884<br />
Year and amount of peak production<br />
Crude oil — 23,941 thous. bbls. 1896<br />
Natural gas — 186,480 MMcf 1984<br />
Deepest produc<strong>in</strong>g well (ft.)<br />
Crude oil 9,002<br />
Natural gas 11,442<br />
Year and depth of deepest well drilled (ft.)<br />
1967 11,442<br />
Cumulative number of total wells drilled<br />
as of 12/31/06 (exclud<strong>in</strong>g service wells)<br />
<strong>Oil</strong> wells 46,952 58%<br />
<strong>Gas</strong> wells 22,273 28%<br />
Dry holes 11,097 14%<br />
Total 80,322 100%<br />
Value of <strong>Oil</strong> and <strong>Gas</strong><br />
Average wellhead price<br />
(2006)<br />
Crude oil ($/bbl.) $62.89<br />
Natural gas ($Mcf) $ 7.75<br />
Wellhead value of production<br />
(2006, <strong>in</strong> thous. $)<br />
Crude oil $ 340,990<br />
Natural gas $ 668,941<br />
Total $ 1,009,931<br />
Average natural gas price<br />
(2006, $/Mcf)<br />
Residential consumers $ 14.39<br />
Commercial consumers $12.83<br />
Industrial consumers $ 11.60<br />
Electric utilities $ 7.97<br />
City Gate $ 9.87<br />
Severance taxes paid $ 2,554<br />
(2006, <strong>in</strong> thous. $)<br />
Cumulative crude oil wellhead value<br />
as of 12/31/06 (thous. $) $8,692,106<br />
OHIO<br />
Cumulative production & new reserves<br />
as of 12/31/06<br />
Crude NGL Natural<br />
<strong>Oil</strong> (mill. bbls.) Total <strong>Gas</strong> (Bcf)<br />
Reserves 1,128 NA 1,128 9,629<br />
Production 1,092 NA 1,092 8,891<br />
72 AMERICA’S INDEPENDENT COMPILED BY <strong>IPAA</strong> FEBRUARY 2009
2006 <strong>Industry</strong> Statistics<br />
Number of wells drilled<br />
Exploratory Development Total<br />
<strong>Oil</strong> 12 366 378<br />
<strong>Gas</strong> 23 251 274<br />
Dry 12 20 32<br />
Total 47 637 684<br />
Total footage drilled<br />
(thous. ft.)<br />
Exploratory Development Total<br />
<strong>Oil</strong> 52.4 1,497.4 1,549.8<br />
<strong>Gas</strong> 85.2 891.2 976.4<br />
Dry 27.9 84.4 112.3<br />
Total 165.5 2,473.0 2,638.5<br />
(Note: Totals may not add due to round<strong>in</strong>g.)<br />
New-field wildcats drilled 16<br />
Footage (thous. ft.) 43.6<br />
Average rotary rigs active 8<br />
Permits 1,220<br />
<strong>State</strong>-wide rank<br />
Crude <strong>Oil</strong> Natural <strong>Gas</strong><br />
Wells drilled 8th 11th<br />
Production 18th 19th<br />
Reserves (2006) 17th 20th<br />
Number of operators 675<br />
Number of produc<strong>in</strong>g wells<br />
(12/31/06)<br />
Crude oil 17,867<br />
Natural gas 23,123<br />
Total 40,990<br />
Average production<br />
Crude oil (thous. b/d) 12<br />
NGL (thous. b/d) 1.9<br />
Natural gas (MMcf/day) 170<br />
Natural gas marketed production<br />
(MMcf) 86,315<br />
Average output per produc<strong>in</strong>g well<br />
Crude oil (bbls.) 245<br />
Natural gas (Mcf) 2,682<br />
Coalbed methane (YTD MMcf)<br />
<strong>Oil</strong> Wells<br />
<strong>Gas</strong> Wells<br />
Daily Average (MMcf) / Well<br />
NA<br />
NA<br />
NA<br />
2006 Latest Available Data<br />
Petroleum reserves<br />
as of 12/31/06 (mill. bbls.)<br />
Crude <strong>Oil</strong> NGL Total<br />
New reserves 7 NA 7<br />
Production 4 NA 4<br />
Net annual change 3 NA 3<br />
Proved reserves 49 NA 49<br />
Natural gas reserves<br />
as of 12/31/06 (Bcf)<br />
Associated Non- Dry<br />
Dissolved Associated <strong>Gas</strong><br />
New reserves 5 150 155<br />
Production 15 63 78<br />
Net annual change -10 87 77<br />
Proved reserves 174 801 975<br />
Cost of drill<strong>in</strong>g and equipp<strong>in</strong>g wells<br />
Cost/ft. Cost/ Total Cost<br />
($) well ($) (thous. $)<br />
<strong>Oil</strong> 80 328,872 124,314<br />
<strong>Gas</strong> 97 347,295 95,159<br />
Dry 126 441,036 14,113<br />
Marg<strong>in</strong>al oil wells<br />
<strong>Produc<strong>in</strong>g</strong> marg<strong>in</strong>al wells 15,570<br />
Crude oil production <strong>in</strong> bbls. (thous.) 3,709<br />
Crude oil production b/d (thous.) 10<br />
Marg<strong>in</strong>al natural gas wells<br />
as of 12/31/06<br />
<strong>Produc<strong>in</strong>g</strong> marg<strong>in</strong>al wells 22,628<br />
Natural gas production (MMcf) 52,003<br />
Federal onshore m<strong>in</strong>eral lease royalties<br />
<strong>Oil</strong> $ 195,146<br />
<strong>Gas</strong> $ 615,425<br />
Total Royalties $ 842,038<br />
Horizontal wells data<br />
Horizontal wells drilled 0<br />
Average number of employees<br />
<strong>Oil</strong> and natural gas extraction 4,962<br />
Refi n<strong>in</strong>g 2,158<br />
Transportation 4,470<br />
Wholesale 5,683<br />
Retail 35,401<br />
Pipel<strong>in</strong>e construction 1,340<br />
<strong>Oil</strong>fi eld mach<strong>in</strong>ery 197<br />
Total petroleum <strong>in</strong>dustry 54,211<br />
Heavy oil (YTD BBls, <strong>in</strong> thous.)<br />
Wells<br />
Av. Bbls per day<br />
Av. Bbls per well/d<br />
NA<br />
NA<br />
NA<br />
NA<br />
Source: EIA for production and IHS for wells drilled.<br />
On Jan 20, 1886, the spectacular “Karg<br />
Well” of F<strong>in</strong>dlay, Ohio, came <strong>in</strong> with an <strong>in</strong>itial<br />
fl ow of 12 million cubic feet per day — a<br />
pressure so great it could not be controlled.<br />
Its tower<strong>in</strong>g plume of fi re was a popular tourist<br />
attraction that burned for four months.<br />
OHIO<br />
COMPILED BY <strong>IPAA</strong> FEBRUARY 2009 AMERICA’S INDEPENDENT 73
OKLAHOMA<br />
Cimarron<br />
Texas<br />
Beaver<br />
Harper<br />
Woods<br />
Alfalfa<br />
Grant<br />
Kay<br />
Nowata Craig<br />
Osage Wash<strong>in</strong>gton<br />
Ottawa<br />
Woodward<br />
Garfield Noble<br />
Rogers Delaware<br />
Major<br />
Pawnee<br />
Mayes<br />
Ellis<br />
Payne<br />
Tulsa<br />
Dewey<br />
K<strong>in</strong>gfisher<br />
Bla<strong>in</strong>e<br />
Logan<br />
Creek Wagoner Cherokee<br />
Adair<br />
Roger Mills<br />
L<strong>in</strong>coln<br />
Custer<br />
OkmulgeeMuskogee<br />
Canadian Oklahoma<br />
Okfuskee<br />
Sequoyah<br />
Washita<br />
Cleveland<br />
McIntosh<br />
Beckham<br />
Caddo<br />
PottawatomieSem<strong>in</strong>ole<br />
Haskell<br />
GradyMcCla<strong>in</strong><br />
Hughes<br />
Greer Kiowa<br />
Pittsburg Latimer Le Flore<br />
Harmon<br />
Comanche<br />
Garv<strong>in</strong><br />
Pontotoc<br />
Jackson<br />
Coal<br />
Stephens Murray<br />
Tillman<br />
Atoka Pushmataha<br />
Cotton<br />
Carter Johnston<br />
Jefferson<br />
McCurta<strong>in</strong><br />
Love Marshall<br />
Choctaw<br />
Bryan<br />
Counties with oil and/or gas production<br />
Background Information<br />
Counties<br />
Number of counties 77<br />
With oil and/or gas production 71<br />
First year of production<br />
Crude oil 1891<br />
Natural gas 1902<br />
Year and amount of peak production<br />
Crude oil —277,775 thous. bbls. 1927<br />
Natural gas — 2,153,852 MMcf 1991<br />
Deepest produc<strong>in</strong>g well (ft.)<br />
Crude oil 19,912<br />
Natural gas 27,400<br />
Year and depth of deepest well drilled (ft.)<br />
1974 31,441<br />
Cumulative number of total wells drilled<br />
as of 12/31/06 (exclud<strong>in</strong>g service wells)<br />
<strong>Oil</strong> wells 240,364 53%<br />
<strong>Gas</strong> wells 81,076 18%<br />
Dry holes 135,308 29%<br />
Total 456,748 100%<br />
Value of <strong>Oil</strong> and <strong>Gas</strong><br />
Average wellhead price<br />
(2006)<br />
Crude oil ($/bbl.) $ 63.11<br />
Natural gas ($Mcf) $ 6.32<br />
Wellhead value of production<br />
(2006, <strong>in</strong> thous. $)<br />
Crude oil $ 3,965,896<br />
Natural gas $ 10,674,385<br />
Total $ 14,640,281<br />
Average natural gas price<br />
(2006, $/Mcf)<br />
Residential consumers $ 13.40<br />
Commercial consumers $ 12.17<br />
Industrial consumers $ 9.66<br />
Electric utilities $ 6.58<br />
City Gate $ 9.13<br />
Severance taxes paid $ 1,168,598<br />
(2006, <strong>in</strong> thous. $)<br />
OKLAHOMA<br />
Cumulative crude oil wellhead value<br />
as of 12/31/06 (thous. $) $107,432,146<br />
Cumulative production & new reserves<br />
as of 12/31/06<br />
Crude NGL Natural<br />
<strong>Oil</strong> (mill. bbls.) Total <strong>Gas</strong> (Bcf)<br />
Reserves 14,884 5,372 20,256 113,379<br />
Production 14,463 4,345 18,808 110,689<br />
74 AMERICA’S INDEPENDENT COMPILED BY <strong>IPAA</strong> FEBRUARY 2009
2006 <strong>Industry</strong> Statistics<br />
Number of wells drilled<br />
Exploratory Development Total<br />
<strong>Oil</strong> 37 866 903<br />
<strong>Gas</strong> 192 2,474 2,666<br />
Dry 95 331 426<br />
Total 324 3,671 3,995<br />
Total footage drilled<br />
(thous. ft.)<br />
Exploratory Development Total<br />
<strong>Oil</strong> 243.4 4,302.3 4,545.7<br />
<strong>Gas</strong> 1,853.7 16,788.3 18,641.9<br />
Dry 591.7 1,710.4 2,302.1<br />
Total 2,688.8 22,801.0 25,489.8<br />
(Note: Totals may not add due to round<strong>in</strong>g.)<br />
New-field wildcats drilled 181<br />
Footage (thous. ft.) 1,458.0<br />
Average rotary rigs active 179<br />
Permits 5,489<br />
<strong>State</strong>-wide rank<br />
Crude <strong>Oil</strong> Natural <strong>Gas</strong><br />
Wells drilled 2nd 2nd<br />
Production 6th 4th<br />
Reserves (2006) 7th 4th<br />
Number of operators 3,861<br />
Number of produc<strong>in</strong>g wells<br />
(12/31/06)<br />
Crude oil 54,408<br />
Natural gas 36,358<br />
Total 90,766<br />
Average production<br />
Crude oil (thous. b/d) 148<br />
NGL (thous. b/d) 25.8<br />
Natural gas (MMcf/day) 4,268<br />
Natural gas marketed production<br />
(MMcf) 1,688,985<br />
Average output per produc<strong>in</strong>g well<br />
Crude oil (bbls.) 992<br />
Natural gas (Mcf) 42,850<br />
Coalbed methane (YTD MMcf) 74,626<br />
<strong>Oil</strong> Wells 8<br />
<strong>Gas</strong> Wells 3,450<br />
Daily Average (MMcf) / Well 204<br />
Heavy oil (YTD BBls, <strong>in</strong> thous.)<br />
Wells<br />
Av. Bbls per day<br />
Av. Bbls per well/d<br />
NA<br />
NA<br />
NA<br />
NA<br />
Source: EIA for production and IHS for wells drilled.<br />
2006 Latest Available Data<br />
Petroleum reserves<br />
as of 12/31/06 (mill. bbls.)<br />
Crude <strong>Oil</strong> NGL Total<br />
New reserves -12 134 122<br />
Production 49 81 130<br />
Net annual change -61 53 -8<br />
Proved reserves 569 892 1,461<br />
Natural gas reserves<br />
as of 12/31/06 (Bcf)<br />
Associated Non- Dry<br />
Dissolved Associated <strong>Gas</strong><br />
New reserves 86 2,002 1,942<br />
Production 95 1,604 1,601<br />
Net annual change -9 398 341<br />
Proved reserves 800 17,735 17,464<br />
Cost of drill<strong>in</strong>g and equipp<strong>in</strong>g wells<br />
Cost/ft. Cost/ Total Cost<br />
($) well ($) (thous. $)<br />
<strong>Oil</strong> 200 1,007,809 910,052<br />
<strong>Gas</strong> 295 2,062,100 5,497,559<br />
Dry 222 1,197,746 510,240<br />
Marg<strong>in</strong>al oil wells<br />
<strong>Produc<strong>in</strong>g</strong> marg<strong>in</strong>al wells 48,234<br />
Crude oil production <strong>in</strong> bbls. (thous.) 35,018<br />
Crude oil production b/d (thous.) 96<br />
Marg<strong>in</strong>al natural gas wells<br />
as of 12/31/06<br />
<strong>Produc<strong>in</strong>g</strong> marg<strong>in</strong>al wells 24,955<br />
Natural gas production (MMcf) 303,692<br />
Federal onshore m<strong>in</strong>eral lease royalties<br />
<strong>Oil</strong> $ 12,139,225<br />
<strong>Gas</strong> $ 39,651,131<br />
Total Royalties $ 55,038,554<br />
Horizontal wells data<br />
Horizontal wells drilled 691<br />
Average number of employees<br />
<strong>Oil</strong> and natural gas extraction 40,017<br />
Refi n<strong>in</strong>g 1,795<br />
Transportation 4,475<br />
Wholesale 4,046<br />
Retail 13,271<br />
Pipel<strong>in</strong>e construction 1,843<br />
<strong>Oil</strong>fi eld mach<strong>in</strong>ery 6,644<br />
Total petroleum <strong>in</strong>dustry 72,091<br />
Curious onlookers gathered at the<br />
Nellie Johnstone No. 1 well on April 15, 1898. At<br />
3 p.m., George Keeler’s stepdaughter,<br />
Miss Jenni Cass, dropped a “go devil” down the<br />
well bore to set off the wait<strong>in</strong>g nitroglycer<strong>in</strong> —<br />
produc<strong>in</strong>g a gusher that marked the beg<strong>in</strong>n<strong>in</strong>g<br />
of Oklahoma’s oil era.<br />
OKLAHOMA<br />
COMPILED BY <strong>IPAA</strong> FEBRUARY 2009 AMERICA’S INDEPENDENT 75
OREGON<br />
Clatsop Columbia<br />
Wash<strong>in</strong>gton<br />
Tillamook<br />
Yamhill<br />
Multnomah<br />
Hood River<br />
Clackamas Wasco<br />
Sherman Gilliam<br />
Morrow<br />
Umatilla<br />
Union<br />
Wallowa<br />
L<strong>in</strong>coln<br />
Polk<br />
Benton<br />
Marion<br />
L<strong>in</strong>n<br />
Jefferson<br />
Wheeler<br />
Grant<br />
Baker<br />
Crook<br />
Lane<br />
Deschutes<br />
Coos<br />
Douglas<br />
Harney<br />
Malheur<br />
Klamath<br />
Lake<br />
Curry<br />
Joseph<strong>in</strong>e<br />
Jackson<br />
Counties with oil and/or gas production<br />
Background Information<br />
Counties<br />
Number of counties 36<br />
With oil and/or gas production 1<br />
First year of production<br />
Crude oil<br />
NA<br />
Natural gas 1979<br />
Year and amount of peak production<br />
Crude oil —<br />
NA<br />
Natural gas — 5,000 MMcf 1980/81<br />
Deepest produc<strong>in</strong>g well (ft.)<br />
Crude oil<br />
NA<br />
Natural gas 3,720<br />
Year and depth of deepest well drilled (ft.)<br />
1979 13,177<br />
Cumulative number of total wells drilled<br />
as of 12/31/06 (exclud<strong>in</strong>g service wells)<br />
<strong>Oil</strong> wells NA NA<br />
<strong>Gas</strong> wells 67 16%<br />
Dry holes 361 84%<br />
Total 428 100%<br />
Value of <strong>Oil</strong> and <strong>Gas</strong><br />
Average wellhead price<br />
(2006)<br />
Crude oil ($/bbl.)<br />
NA<br />
Natural gas ($Mcf) $4.42<br />
Wellhead value of production<br />
(2006, <strong>in</strong> thous. $)<br />
Crude oil<br />
NA<br />
Natural gas $ 2,745<br />
Total $ 2,745<br />
Average natural gas price<br />
(2006, $/Mcf)<br />
Residential consumers $ 14.53<br />
Commercial consumers $ 12.94<br />
Industrial consumers $ 9.16<br />
Electric utilities $ 5.95<br />
City Gate $ 8.10<br />
Severance taxes paid $ 90<br />
(2006, <strong>in</strong> thous. $)<br />
Cumulative crude oil wellhead value<br />
as of 12/31/06 (thous. $)<br />
NA<br />
OREGON<br />
Cumulative production & new reserves<br />
as of 12/31/06<br />
Crude NGL Natural<br />
<strong>Oil</strong> (mill. bbls.) Total <strong>Gas</strong> (Bcf)<br />
Reserves NA NA NA NA<br />
Production NA NA NA 72<br />
76 AMERICA’S INDEPENDENT COMPILED BY <strong>IPAA</strong> FEBRUARY 2009
2006 <strong>Industry</strong> Statistics<br />
Number of wells drilled<br />
Exploratory Development Total<br />
<strong>Oil</strong> NA NA NA<br />
<strong>Gas</strong> NA NA NA<br />
Dry NA NA NA<br />
Total NA NA NA<br />
Total footage drilled<br />
(thous. ft.)<br />
Exploratory Development Total<br />
<strong>Oil</strong> NA NA NA<br />
<strong>Gas</strong> NA NA NA<br />
Dry NA NA NA<br />
Total NA NA NA<br />
(Note: Totals may not add due to round<strong>in</strong>g.)<br />
New-field wildcats drilled<br />
Footage (thous. ft.)<br />
NA<br />
NA<br />
Average rotary rigs active 0<br />
Permits 8<br />
<strong>State</strong>-wide rank<br />
Crude <strong>Oil</strong> Natural <strong>Gas</strong><br />
Wells drilled NA 31st<br />
Production NA 28th<br />
Reserves (2006) NA NA<br />
Number of operators 2<br />
Number of produc<strong>in</strong>g wells<br />
(12/31/06)<br />
Crude oil 0<br />
Natural gas 13<br />
Total 13<br />
Average production<br />
Crude oil (thous. b/d) 0<br />
NGL (thous. b/d) 0<br />
Natural gas (MMcf/day) 2<br />
Natural gas marketed production<br />
(MMcf) 621<br />
Average output per produc<strong>in</strong>g well<br />
Crude oil (bbls.)<br />
NA<br />
Natural gas (Mcf) 48,015<br />
Coalbed methane (YTD MMcf)<br />
<strong>Oil</strong> Wells<br />
<strong>Gas</strong> Wells<br />
Daily Average (MMcf) / Well<br />
NA<br />
NA<br />
NA<br />
2006 Latest Available Data<br />
Petroleum reserves<br />
as of 12/31/06 (mill. bbls.)<br />
Crude <strong>Oil</strong> NGL Total<br />
New reserves NA NA NA<br />
Production NA NA NA<br />
Net annual change NA NA NA<br />
Proved reserves NA NA NA<br />
Natural gas reserves<br />
as of 12/31/06 (Bcf)<br />
Associated Non- Dry<br />
Dissolved Associated <strong>Gas</strong><br />
New reserves NA NA NA<br />
Production NA NA NA<br />
Net annual change NA NA NA<br />
Proved reserves NA NA NA<br />
Cost of drill<strong>in</strong>g and equipp<strong>in</strong>g wells<br />
Cost/ft. Cost/ Total Cost<br />
($) well ($) (thous. $)<br />
<strong>Oil</strong> NA NA NA<br />
<strong>Gas</strong> NA NA NA<br />
Dry NA NA NA<br />
Marg<strong>in</strong>al oil wells<br />
<strong>Produc<strong>in</strong>g</strong> marg<strong>in</strong>al wells<br />
Crude oil production <strong>in</strong> bbls. (thous.)<br />
Crude oil production b/d (thous.)<br />
Marg<strong>in</strong>al natural gas wells<br />
as of 12/31/06<br />
NA<br />
NA<br />
NA<br />
<strong>Produc<strong>in</strong>g</strong> marg<strong>in</strong>al wells 10<br />
Natural gas production (MMcf) 158<br />
Federal onshore m<strong>in</strong>eral lease royalties<br />
<strong>Oil</strong> --<br />
<strong>Gas</strong> --<br />
Total Royalties $1,318,016<br />
Horizontal wells data<br />
Horizontal wells drilled 0<br />
Average number of employees<br />
<strong>Oil</strong> and natural gas extraction 22<br />
Refi n<strong>in</strong>g 0<br />
Transportation 0<br />
Wholesale 1,797<br />
Retail 10,969<br />
Pipel<strong>in</strong>e construction 292<br />
<strong>Oil</strong>fi eld mach<strong>in</strong>ery 0<br />
Total petroleum <strong>in</strong>dustry 13,080<br />
Heavy oil (YTD BBls, <strong>in</strong> thous.) NA<br />
Wells<br />
NA<br />
Av. Bbls per day<br />
NA<br />
Av. Bbls per well/d<br />
NA<br />
Source: EIA for production and IHS for wells drilled.<br />
OREGON<br />
COMPILED BY <strong>IPAA</strong> FEBRUARY 2009 AMERICA’S INDEPENDENT 77
PENNSYLVANIA<br />
Erie<br />
Warren<br />
McKean<br />
Potter<br />
Tioga<br />
Bradford Susquehanna<br />
Crawford<br />
Wayne<br />
Forest<br />
Wyom<strong>in</strong>g<br />
Venango<br />
Elk Cameron<br />
Sullivan<br />
Lackawanna<br />
Lycom<strong>in</strong>g<br />
Mercer<br />
Pike<br />
Clarion<br />
Cl<strong>in</strong>ton<br />
Luzerne<br />
Jefferson<br />
Columbia<br />
Monroe<br />
Lawrence<br />
Montour<br />
Clearfield Centre<br />
Union<br />
Butler<br />
Carbon<br />
Armstrong<br />
Northumberland<br />
Snyder<br />
Northampton<br />
Beaver<br />
Schuylkill<br />
Indiana<br />
Miffl<strong>in</strong><br />
Lehigh<br />
Juniata<br />
Allegheny<br />
Cambria Blair<br />
Hunt<strong>in</strong>gdon<br />
Perry Dauph<strong>in</strong><br />
Berks<br />
Lebanon<br />
Westmoreland<br />
Bucks<br />
Wash<strong>in</strong>gton<br />
Montgomery<br />
Cumberland<br />
Lancaster<br />
Somerset Bedford<br />
Chester Philadelphia<br />
Fayette<br />
Fulton Frankl<strong>in</strong><br />
York<br />
Delaware<br />
Greene<br />
Adams<br />
Counties with oil and/or gas production<br />
Background Information<br />
Counties<br />
Number of counties 67<br />
With oil and/or gas production 31<br />
First year of production<br />
Crude oil 1859<br />
Natural gas 1881<br />
Year and amount of peak production<br />
Crude oil — 31,424 thous. bbls. 1891<br />
Natural gas — 200,907 MMcf 2000<br />
Deepest produc<strong>in</strong>g well (ft.)<br />
Crude oil 13,186<br />
Natural gas 8,484<br />
Year and depth of deepest well drilled (ft.)<br />
1974 21,432<br />
Value of <strong>Oil</strong> and <strong>Gas</strong><br />
Average wellhead price<br />
(2006)<br />
Crude oil ($/bbl.) $64.02<br />
Natural gas ($Mcf)<br />
NA<br />
Wellhead value of production<br />
(2006, <strong>in</strong> thous. $)<br />
Crude oil $ 232,137<br />
Natural gas<br />
NA<br />
Total $ 232,137<br />
Average natural gas price<br />
(2006, $/Mcf)<br />
Residential consumers $ 16.45<br />
Commercial consumers $ 14.30<br />
Industrial consumers $ 12.30<br />
Electric utilities $ 7.76<br />
City Gate $ 10.30<br />
Severance taxes paid --<br />
(2006, <strong>in</strong> thous. $)<br />
Cumulative number of total wells drilled<br />
as of 12/31/06 (exclud<strong>in</strong>g service wells)<br />
<strong>Oil</strong> wells 22,270 31%<br />
<strong>Gas</strong> wells 45,558 64%<br />
Dry holes 3,809 4%<br />
Total 71,637 100%<br />
PENNSYLVANIA<br />
Cumulative crude oil wellhead value<br />
as of 12/31/06 (thous. $) $5,277,711<br />
Cumulative production & new reserves<br />
as of 12/31/06<br />
Crude NGL Natural<br />
<strong>Oil</strong> (mill. bbls.) Total <strong>Gas</strong> (Bcf)<br />
Reserves 1,368 NA 1,368 15,949<br />
Production 1,357 NA 1,357 13,089<br />
78 AMERICA’S INDEPENDENT COMPILED BY <strong>IPAA</strong> FEBRUARY 2009
2006 <strong>Industry</strong> Statistics<br />
Number of wells drilled<br />
Exploratory Development Total<br />
<strong>Oil</strong> 71 742 813<br />
<strong>Gas</strong> 536 2,711 3,247<br />
Dry 42 158 200<br />
Total 649 3,611 4,260<br />
Total footage drilled<br />
(thous. ft.)<br />
Exploratory Development Total<br />
<strong>Oil</strong> 148.5 1,387.2 1,535.7<br />
<strong>Gas</strong> 2,225.4 10,290.9 12,516.3<br />
Dry 174.0 445.1 619.1<br />
Total 2,548.0 12,123.2 14,671.2<br />
(Note: Totals may not add due to round<strong>in</strong>g.)<br />
New-field wildcats drilled 217<br />
Footage (thous. ft.) 904.7<br />
Average rotary rigs active 16<br />
Permits 6,686<br />
<strong>State</strong>-wide rank<br />
Crude <strong>Oil</strong> Natural <strong>Gas</strong><br />
Wells drilled 10th 5th<br />
Production 29th 25th<br />
Reserves (2006) 23rd 14th<br />
Number of operators --<br />
Number of produc<strong>in</strong>g wells<br />
(12/31/06)<br />
Crude oil<br />
Natural gas<br />
Total<br />
Average production<br />
Crude oil (thous. b/d)<br />
NGL (thous. b/d)<br />
Natural gas (MMcf/day)<br />
NA<br />
NA<br />
NA<br />
NA<br />
NA<br />
NA<br />
Natural gas marketed production<br />
(MMcf) 158,355<br />
Average output per produc<strong>in</strong>g well<br />
Crude oil (bbls.)<br />
Natural gas (Mcf)<br />
Coalbed methane (YTD MMcf)<br />
<strong>Oil</strong> Wells<br />
<strong>Gas</strong> Wells<br />
Daily Average (MMcf) / Well<br />
Heavy oil (YTD BBls, <strong>in</strong> thous.)<br />
Wells<br />
Av. Bbls per day<br />
Av. Bbls per well/d<br />
NA<br />
NA<br />
NA<br />
NA<br />
NA<br />
NA<br />
NA<br />
NA<br />
NA<br />
Source: EIA for production and IHS for wells drilled.<br />
2006 Latest Available Data<br />
Petroleum reserves<br />
as of 12/31/06 (mill. bbls.)<br />
Crude <strong>Oil</strong> NGL Total<br />
New reserves 8 NA 8<br />
Production 2 NA 2<br />
Net annual change 6 NA 6<br />
Proved reserves 20 NA 20<br />
Natural gas reserves<br />
as of 12/31/06 (Bcf)<br />
Associated Non- Dry<br />
Dissolved Associated <strong>Gas</strong><br />
New reserves 28 420 444<br />
Production 11 166 176<br />
Net annual change 17 254 268<br />
Proved reserves 151 2,913 3,050<br />
Cost of drill<strong>in</strong>g and equipp<strong>in</strong>g wells<br />
Cost/ft. Cost/ Total Cost<br />
($) well ($) (thous. $)<br />
<strong>Oil</strong> 126 238,172 193,634<br />
<strong>Gas</strong> 89 343,607 1,115,691<br />
Dry 133 412,914 82,583<br />
Marg<strong>in</strong>al oil wells<br />
<strong>Produc<strong>in</strong>g</strong> marg<strong>in</strong>al wells<br />
Crude oil production <strong>in</strong> bbls. (thous.)<br />
Crude oil production b/d (thous.)<br />
Marg<strong>in</strong>al natural gas wells<br />
as of 12/31/06<br />
NA<br />
NA<br />
NA<br />
<strong>Produc<strong>in</strong>g</strong> marg<strong>in</strong>al wells 0<br />
Natural gas production (MMcf) 0<br />
Federal onshore m<strong>in</strong>eral lease royalties<br />
<strong>Oil</strong> --<br />
<strong>Gas</strong> $80,305<br />
Total Royalties $200,151<br />
Horizontal wells data<br />
Horizontal wells drilled 6<br />
Average number of employees<br />
<strong>Oil</strong> and natural gas extraction 5,233<br />
Refi n<strong>in</strong>g 4,839<br />
Transportation 5,678<br />
Wholesale 11,220<br />
Retail 36,425<br />
Pipel<strong>in</strong>e construction 1,929<br />
<strong>Oil</strong>fi eld mach<strong>in</strong>ery 288<br />
Total petroleum <strong>in</strong>dustry 65,612<br />
America’s petroleum <strong>in</strong>dustry began In<br />
Titusville when “Col.” Edw<strong>in</strong> Drake,” work<strong>in</strong>g for<br />
the Pennsylvania Rock <strong>Oil</strong> Co., struck oil at 69<br />
1/2 feet on Aug. 27, 1859. Drake sold the oil to<br />
Samuel Kier for $20 per barrel. Kier used a small<br />
still <strong>in</strong> Pittsburg to refi ne the oil <strong>in</strong>to kerosene for<br />
illum<strong>in</strong>ation.<br />
PENNSYLVANIA<br />
COMPILED BY <strong>IPAA</strong> FEBRUARY 2009 AMERICA’S INDEPENDENT 79
SOUTH DAKOTA<br />
Hard<strong>in</strong>g<br />
Perk<strong>in</strong>s<br />
Corson<br />
Campbell<br />
Walworth<br />
McPherson<br />
Edmunds<br />
Brown<br />
Marshall<br />
Day<br />
Roberts<br />
Lawrence<br />
Butte<br />
Meade<br />
Ziebach<br />
Haakon<br />
Dewey<br />
Stanley<br />
Potter<br />
Sully<br />
Hughes<br />
Hyde<br />
Faulk<br />
Hand<br />
Sp<strong>in</strong>k<br />
Beadle<br />
Grant<br />
Cod<strong>in</strong>gton<br />
Clark<br />
Deuel<br />
Haml<strong>in</strong><br />
K<strong>in</strong>gsbury Brook<strong>in</strong>gs<br />
Penn<strong>in</strong>gton<br />
Custer<br />
Shannon<br />
Fall River<br />
Jackson<br />
Bennett<br />
Buffalo Jerauld Sanborn M<strong>in</strong>er Lake Moody<br />
Jones<br />
Lyman<br />
Brule<br />
Mellette<br />
Tripp<br />
Todd<br />
Gregory<br />
Aurora DavisonHanson McCook M<strong>in</strong>nehaha<br />
Douglas<br />
Hutch<strong>in</strong>son Turner<br />
Charles Mix<br />
L<strong>in</strong>coln<br />
Bon HommeYankton<br />
Clay<br />
Counties with oil and/or gas production<br />
Union<br />
Background Information<br />
Counties<br />
Number of counties 66<br />
With oil and/or gas production 3<br />
First year of production<br />
Crude oil 1954<br />
Natural gas 1979<br />
Year and amount of peak production<br />
Crude oil — 1,668 thous. bbls. 1988<br />
Natural gas — 4,369 MMcf 1989<br />
Deepest produc<strong>in</strong>g well (ft.)<br />
Crude oil 15,159<br />
Natural gas 7,337<br />
Year and depth of deepest well drilled (ft.)<br />
2006 17,025<br />
Cumulative number of total wells drilled<br />
as of 12/31/06 (exclud<strong>in</strong>g service wells)<br />
<strong>Oil</strong> wells 374 22%<br />
<strong>Gas</strong> wells 115 7%<br />
Dry holes 1,176 71%<br />
Total 1,665 100%<br />
Value of <strong>Oil</strong> and <strong>Gas</strong><br />
Average wellhead price<br />
(2006)<br />
Crude oil ($/bbl.) $ 51.85<br />
Natural gas ($Mcf) $ 6.40<br />
Wellhead value of production<br />
(2006, <strong>in</strong> thous. $)<br />
Crude oil $ 72,279<br />
Natural gas $ 6,163<br />
Total $ 78,442<br />
Average natural gas price<br />
(2006, $/Mcf)<br />
Residential consumers $ 11.11<br />
Commercial consumers $ 9.46<br />
Industrial consumers $ 9.32<br />
Electric utilities<br />
NA<br />
City Gate $ 8.01<br />
Severance taxes paid $3,256<br />
(2006, <strong>in</strong> thous. $)<br />
SOUTH DAKOTA<br />
Cumulative crude oil wellhead value<br />
as of 12/31/06 (thous. $) $953,421<br />
Cumulative production & new reserves<br />
as of 12/31/06<br />
Crude NGL Natural<br />
<strong>Oil</strong> (mill. bbls.) Total <strong>Gas</strong> (Bcf)<br />
Reserves NA NA NA NA<br />
Production NA NA NA NA<br />
80 AMERICA’S INDEPENDENT COMPILED BY <strong>IPAA</strong> FEBRUARY 2009
2006 <strong>Industry</strong> Statistics<br />
Number of wells drilled<br />
Exploratory Development Total<br />
<strong>Oil</strong> 1 18 19<br />
<strong>Gas</strong> NA 3 3<br />
Dry 3 NA 3<br />
Total 4 21 25<br />
Total footage drilled<br />
(thous. ft.)<br />
Exploratory Development Total<br />
<strong>Oil</strong> 7.9 108.4 116.3<br />
<strong>Gas</strong> NA 5.5 5.5<br />
Dry 3.5 NA 3.5<br />
Total 11.5 113.9 125.3<br />
(Note: Totals may not add due to round<strong>in</strong>g.)<br />
New-field wildcats drilled 4<br />
Footage (thous. ft.) 11.5<br />
Average rotary rigs active 1<br />
Permits 50<br />
<strong>State</strong>-wide rank<br />
Crude <strong>Oil</strong> Natural <strong>Gas</strong><br />
Wells drilled 28th 28th<br />
Production 26th 27th<br />
Reserves (2006) NA NA<br />
Number of operators 16<br />
Number of produc<strong>in</strong>g wells<br />
(12/31/06)<br />
Crude oil 153<br />
Natural gas 62<br />
Total 215<br />
Average production<br />
Crude oil (thous. b/d) 4<br />
NGL (thous. b/d) 0<br />
Natural gas (MMcf/day) 1<br />
Natural gas marketed production<br />
(MMcf) 963<br />
Average output per produc<strong>in</strong>g well<br />
Crude oil (bbls.) 9,113<br />
Natural gas (Mcf) 7,058<br />
Coalbed methane (YTD MMcf)<br />
<strong>Oil</strong> Wells<br />
<strong>Gas</strong> Wells<br />
Daily Average (MMcf) / Well<br />
Heavy oil (YTD BBls, <strong>in</strong> thous.)<br />
Wells<br />
Av. Bbls per day<br />
Av. Bbls per well/d<br />
NA<br />
NA<br />
NA<br />
NA<br />
NA<br />
NA<br />
NA<br />
Source: EIA for production and IHS for wells drilled.<br />
2006 Latest Available Data<br />
Petroleum reserves<br />
as of 12/31/06 (mill. bbls.)<br />
Crude <strong>Oil</strong> NGL Total<br />
New reserves NA NA NA<br />
Production NA NA NA<br />
Net annual change NA NA NA<br />
Proved reserves NA NA NA<br />
Natural gas reserves<br />
as of 12/31/06 (Bcf)<br />
Associated Non- Dry<br />
Dissolved Associated <strong>Gas</strong><br />
New reserves NA NA NA<br />
Production NA NA NA<br />
Net annual change NA NA NA<br />
Proved reserves NA NA NA<br />
Cost of drill<strong>in</strong>g and equipp<strong>in</strong>g wells<br />
Cost/ft. Cost/ Total Cost<br />
($) well ($) (thous. $)<br />
<strong>Oil</strong> 401 2,453,380 46,614<br />
<strong>Gas</strong> 251 457,528 1,373<br />
Dry 159 186,925 561<br />
Marg<strong>in</strong>al oil wells<br />
<strong>Produc<strong>in</strong>g</strong> marg<strong>in</strong>al wells 71<br />
Crude oil production <strong>in</strong> bbls. (thous.) 212<br />
Crude oil production b/d (thous.) 1<br />
Marg<strong>in</strong>al natural gas wells<br />
as of 12/31/06<br />
<strong>Produc<strong>in</strong>g</strong> marg<strong>in</strong>al wells 62<br />
Natural gas production (MMcf) 438<br />
Federal onshore m<strong>in</strong>eral lease royalties<br />
<strong>Oil</strong> $ 1,403,517<br />
<strong>Gas</strong> $ 151,322<br />
Total Royalties $ 1,783,870<br />
Horizontal wells data<br />
Horizontal wells drilled 14<br />
Average number of employees<br />
<strong>Oil</strong> and natural gas extraction 7<br />
Refi n<strong>in</strong>g 0<br />
Transportation 288<br />
Wholesale 1,277<br />
Retail 5,759<br />
Pipel<strong>in</strong>e construction 44<br />
<strong>Oil</strong>fi eld mach<strong>in</strong>ery 0<br />
Total petroleum <strong>in</strong>dustry 7,415<br />
Shell <strong>Oil</strong> Co. drilled the discovery well for the<br />
Buffalo Field <strong>in</strong> October 1953 <strong>in</strong> Hard<strong>in</strong>g County.<br />
The well began produc<strong>in</strong>g at 9,332 feet on Jan.<br />
14, 1954. Over the last 50 years, the well has<br />
produced 341,169 barrels of oil.<br />
SOUTH DAKOTA<br />
COMPILED BY <strong>IPAA</strong> FEBRUARY 2009 AMERICA’S INDEPENDENT 81
TENNESSEE<br />
Counties with oil and/or gas production<br />
Background Information<br />
Counties<br />
Number of counties 95<br />
With oil and/or gas production 13<br />
First year of production<br />
Crude oil 1860<br />
Natural gas 1889<br />
Year and amount of peak production<br />
Crude oil — 1,132 thous. bbls. 1982<br />
Natural gas — 5,022 MMcf 1984<br />
Deepest produc<strong>in</strong>g well (ft.)<br />
Crude oil 3,297<br />
Natural gas 4,624<br />
Year and depth of deepest well drilled (ft.)<br />
1982 11,540<br />
Cumulative number of total wells drilled<br />
as of 12/31/06 (exclud<strong>in</strong>g service wells)<br />
<strong>Oil</strong> wells 2,797 23%<br />
<strong>Gas</strong> wells 3,244 27%<br />
Dry holes 5,912 50%<br />
Total 11,953 100%<br />
Value of <strong>Oil</strong> and <strong>Gas</strong><br />
Average wellhead price*<br />
(2006)<br />
Crude oil ($/bbl.) $57.06<br />
Natural gas ($Mcf) $ 6.78<br />
Wellhead value of production<br />
(2006, <strong>in</strong> thous. $)<br />
Crude oil $ 10,956<br />
Natural gas $ 12,157<br />
Total $ 23,112<br />
Average natural gas price<br />
(2006, $/Mcf)<br />
Residential consumers $ 14.74<br />
Commercial consumers $ 13.06<br />
Industrial consumers $ 10.00<br />
Electric utilities<br />
NA<br />
City Gate $ 9.00<br />
Severance taxes paid $1,041<br />
(2006, <strong>in</strong> thous. $)<br />
TENNESSEE<br />
Cumulative crude oil wellhead value<br />
as of 12/31/06 (thous. $) $423,426<br />
Cumulative production & new reserves<br />
as of 12/31/06)<br />
Crude NGL Natural<br />
<strong>Oil</strong> (mill. bbls.) Total <strong>Gas</strong> (Bcf)<br />
Reserves NA NA NA NA<br />
Production NA NA NA NA<br />
82 AMERICA’S INDEPENDENT COMPILED BY <strong>IPAA</strong> FEBRUARY 2009
2006 <strong>Industry</strong> Statistics<br />
Number of wells drilled<br />
Exploratory Development Total<br />
<strong>Oil</strong> 4 42 46<br />
<strong>Gas</strong> 105 55 160<br />
Dry 8 71 79<br />
Total 117 168 285<br />
Total footage drilled<br />
(thous. ft.)<br />
Exploratory Development Total<br />
<strong>Oil</strong> 10.4 65.9 76.3<br />
<strong>Gas</strong> 445.6 175.1 620.7<br />
Dry 13.1 117.4 130.4<br />
Total 469.0 358.3 827.4<br />
(Note: Totals may not add due to round<strong>in</strong>g.)<br />
New-field wildcats drilled 79<br />
Footage (thous. ft.) 334.4<br />
Average rotary rigs active 1<br />
Permits 386<br />
<strong>State</strong>-wide rank<br />
Crude <strong>Oil</strong> Natural <strong>Gas</strong><br />
Wells drilled 25th 22nd<br />
Production 29th 29th<br />
Reserves (2006) NA NA<br />
Number of operators --<br />
Number of produc<strong>in</strong>g wells<br />
(12/31/06)<br />
Crude oil<br />
Natural gas<br />
Total<br />
Average production<br />
Crude oil (thous. b/d)<br />
NGL (thous. b/d)<br />
Natural gas (MMcf/day)<br />
NA<br />
NA<br />
NA<br />
NA<br />
NA<br />
NA<br />
Natural gas marketed production<br />
(MMcf) 1,793<br />
Average output per produc<strong>in</strong>g well<br />
Crude oil (bbls.)<br />
Natural gas (Mcf)<br />
Coalbed methane (YTD MMcf)<br />
<strong>Oil</strong> Wells<br />
<strong>Gas</strong> Wells<br />
Daily Average (MMcf) / Well<br />
Heavy oil (YTD BBls, <strong>in</strong> thous.)<br />
Wells<br />
Av. Bbls per day<br />
Av. Bbls per well/d<br />
NA<br />
NA<br />
NA<br />
NA<br />
NA<br />
NA<br />
NA<br />
NA<br />
NA<br />
Source: EIA for production and IHS for wells drilled.<br />
2006 Latest Available Data<br />
Petroleum reserves<br />
as of 12/31/06 (mill. bbls.)<br />
Crude <strong>Oil</strong> NGL Total<br />
New reserves NA NA NA<br />
Production NA NA NA<br />
Net annual change NA NA NA<br />
Proved reserves NA NA NA<br />
Natural gas reserves<br />
as of 12/31/06 (Bcf)<br />
Associated Non- Dry<br />
Dissolved Associated <strong>Gas</strong><br />
New reserves NA NA NA<br />
Production NA NA NA<br />
Net annual change NA NA NA<br />
Proved reserves NA NA NA<br />
Cost of drill<strong>in</strong>g and equipp<strong>in</strong>g wells<br />
Cost/ft. Cost/ Total Cost<br />
($) well ($) (thous. $)<br />
<strong>Oil</strong> 167 276,901 12,737<br />
<strong>Gas</strong> 101 393,584 62,973<br />
Dry 161 265,202 20,951<br />
Marg<strong>in</strong>al oil wells<br />
<strong>Produc<strong>in</strong>g</strong> marg<strong>in</strong>al wells<br />
Crude oil production <strong>in</strong> bbls. (thous.)<br />
Crude oil production b/d (thous.)<br />
NA<br />
NA<br />
NA<br />
Marg<strong>in</strong>al natural gas wells<br />
as of 12/31/06<br />
<strong>Produc<strong>in</strong>g</strong> marg<strong>in</strong>al wells 0<br />
Natural gas production (MMcf) 0<br />
Federal onshore m<strong>in</strong>eral lease royalties<br />
<strong>Oil</strong> --<br />
<strong>Gas</strong> --<br />
Total Royalties --<br />
Horizontal wells data<br />
Horizontal wells drilled 0<br />
Average number of employees<br />
<strong>Oil</strong> and natural gas extraction 637<br />
Refi n<strong>in</strong>g 0<br />
Transportation 2,315<br />
Wholesale 3,629<br />
Retail 24,063<br />
Pipel<strong>in</strong>e construction 646<br />
<strong>Oil</strong>fi eld mach<strong>in</strong>ery 0<br />
Total petroleum <strong>in</strong>dustry 31,290<br />
Between 1859 and 1870, several exploratory<br />
wells were drilled <strong>in</strong> Overton County. The<br />
Gilbreath No. 1 on Bear Creek came <strong>in</strong> at a depth<br />
of only 20 feet <strong>in</strong> 1860. In 1866, the Newman No.<br />
1 well came <strong>in</strong> on Spr<strong>in</strong>g Creek and yielded about<br />
2,000 barrels of oil from a depth of only 19 feet.<br />
TENNESSEE<br />
COMPILED BY <strong>IPAA</strong> FEBRUARY 2009 AMERICA’S INDEPENDENT 83
TEXAS<br />
Counties with oil and/or gas production<br />
Background Information<br />
Counties<br />
Number of counties 254<br />
With oil and/or gas production 221<br />
First year of production<br />
Crude oil 1889<br />
Natural gas 1889<br />
Year and amount of peak production<br />
Crude oil — 1,301,685 thous. bbls. 1972<br />
Natural gas — 8,657,840 MMcf 1972<br />
Deepest produc<strong>in</strong>g well (ft.)<br />
Crude oil 27,011<br />
Natural gas 30,712<br />
Year and depth of deepest well drilled (ft.)<br />
1983 29,670<br />
Cumulative number of total wells drilled<br />
as of 12/31/06 (exclud<strong>in</strong>g service wells)<br />
<strong>Oil</strong> wells 557,017 53%<br />
<strong>Gas</strong> wells 179,448 17%<br />
Dry holes 321,885 30%<br />
Total 1,056,350 100%<br />
Value of <strong>Oil</strong> and <strong>Gas</strong><br />
Average wellhead price<br />
(2006)<br />
Crude oil ($/bbl.) $ 61.31<br />
Natural gas ($Mcf) $ 6.60<br />
Wellhead value of production<br />
(2006, <strong>in</strong> thous. $)<br />
Crude oil $ 24,353,558<br />
Natural gas $ 36,390,677<br />
Total $ 60,744,236<br />
Average natural gas price<br />
(2006, $/Mcf)<br />
Residential consumers $ 13.11<br />
Commercial consumers $ 10.25<br />
Industrial consumers $ 6.69<br />
Electric utilities $ 6.55<br />
City Gate $ 7.60<br />
Severance taxes paid $3,200,807<br />
(2006, <strong>in</strong> thous. $)<br />
Cumulative crude oil wellhead value<br />
as of 12/31/06 (thous. $) $581,877,278<br />
TEXAS<br />
Cumulative production & new reserves<br />
as of 12/31/06<br />
Crude NGL Natural<br />
<strong>Oil</strong> (mill. bbls.) Total <strong>Gas</strong> (Bcf)<br />
Reserves 72,645 20,608 93,253 431,376<br />
Production 68,597 16,770 85,367 419,831<br />
84 AMERICA’S INDEPENDENT COMPILED BY <strong>IPAA</strong> FEBRUARY 2009
2006 <strong>Industry</strong> Statistics<br />
Number of wells drilled<br />
Exploratory Development Total<br />
<strong>Oil</strong> 85 4,241 4,326<br />
<strong>Gas</strong> 265 7,359 7,624<br />
Dry 338 1,121 1,459<br />
Total 688 12,721 13,409<br />
Total footage drilled<br />
(thous. ft.)<br />
Exploratory Development Total<br />
<strong>Oil</strong> 563.7 23,336.4 23.900.1<br />
<strong>Gas</strong> 2,618.0 70,242.5 72,860.5<br />
Dry 2,605.6 6,354.9 8,960.5<br />
Total 5,787.2 99,933.8 105,721.1<br />
(Note: Totals may not add due to round<strong>in</strong>g.)<br />
New-field wildcats drilled 387<br />
Footage (thous. ft.) 3,022.4<br />
Average rotary rigs active 746<br />
Permits 19,291<br />
<strong>State</strong>-wide rank<br />
Crude <strong>Oil</strong> Natural <strong>Gas</strong><br />
Wells drilled 1st 1st<br />
Production 2nd 1st<br />
Reserves (2006) 1st 1st<br />
Number of operators 4,795<br />
Number of produc<strong>in</strong>g wells<br />
(12/31/06)<br />
Crude oil 153,455<br />
Natural gas 86,272<br />
Total 239,727<br />
Average production<br />
Crude oil (thous. b/d) 948<br />
NGL (thous. b/d) 123.4<br />
Natural gas (MMcf/day) 15,471<br />
Natural gas marketed production<br />
(MMcf) 5,513,739<br />
Average output per produc<strong>in</strong>g well<br />
Crude oil (bbls.) 2,255<br />
Natural gas (Mcf) 65,456<br />
Coalbed methane (YTD MMcf) 188<br />
<strong>Oil</strong> Wells 0<br />
<strong>Gas</strong> Wells 11<br />
Daily Average (MMcf) / Well 1<br />
Heavy oil (YTD BBls, <strong>in</strong> thous.)<br />
Wells<br />
Av. Bbls per day<br />
Av. Bbls per well/d<br />
NA<br />
NA<br />
NA<br />
NA<br />
Source: EIA for production and IHS for wells drilled.<br />
2006 Latest Available Data<br />
Petroleum reserves<br />
as of 12/31/06 (mill. bbls.)<br />
Crude <strong>Oil</strong> NGL Total<br />
New reserves 307 568 970<br />
Production 355 313 668<br />
Net annual change -48 255 207<br />
Proved reserves 4,871 3,335 8,206<br />
Natural gas reserves<br />
as of 12/31/06 (Bcf)<br />
Associated Non- Dry<br />
Dissolved Associated <strong>Gas</strong><br />
New reserves 660 10,931 10,937<br />
Production 594 5,370 5,608<br />
Net annual change 66 5,561 5,329<br />
Proved reserves 7,069 58,736 61,836<br />
Cost of drill<strong>in</strong>g and equipp<strong>in</strong>g wells<br />
Cost/ft. Cost/ Total Cost<br />
($) well ($) (thous. $)<br />
<strong>Oil</strong> 229 1,265,874 5,476,173<br />
<strong>Gas</strong> 367 3,507,603 26,741,969<br />
Dry 262 1,611,405 2,351,040<br />
Marg<strong>in</strong>al oil wells<br />
<strong>Produc<strong>in</strong>g</strong> marg<strong>in</strong>al wells 140,644<br />
Crude oil production <strong>in</strong> bbls. (thous.) 145,308<br />
Crude oil production b/d (thous.) 398<br />
Marg<strong>in</strong>al natural gas wells<br />
as of 12/31/06<br />
<strong>Produc<strong>in</strong>g</strong> marg<strong>in</strong>al wells 50,964<br />
Natural gas production (MMcf) 583,968<br />
Federal onshore m<strong>in</strong>eral lease royalties<br />
<strong>Oil</strong> $ 5,075,123<br />
<strong>Gas</strong> $ 24,639,763<br />
Total Royalties $ 37,798,496<br />
Horizontal wells data<br />
Horizontal wells drilled 2,200<br />
Average number of employees<br />
<strong>Oil</strong> and natural gas extraction 180,803<br />
Refi n<strong>in</strong>g 21,080<br />
Transportation 19,541<br />
Wholesale 16,636<br />
Retail 67,406<br />
Pipel<strong>in</strong>e construction 22,404<br />
<strong>Oil</strong>fi eld mach<strong>in</strong>ery 33,724<br />
Total petroleum <strong>in</strong>dustry 361,594<br />
Confederate veteran Lyne Taliaferro<br />
Barret’s Melrose Petroleum <strong>Oil</strong> Co. brought<br />
<strong>in</strong> the No. 1 Isaac C. Skillern well near Nacodoches,<br />
Texas, on Sept. 12, 1866. The Lone Star state’s first<br />
commercial producer yielded a modest ten barrels<br />
per day.<br />
TEXAS<br />
COMPILED BY <strong>IPAA</strong> FEBRUARY 2009 AMERICA’S INDEPENDENT 85
Box Elder<br />
Cache<br />
Rich<br />
UTAH<br />
Weber<br />
Morgan<br />
Davis<br />
Summit<br />
Daggett<br />
Salt Lake<br />
Tooele<br />
Wasatch<br />
Duchesne<br />
Utah<br />
U<strong>in</strong>tah<br />
Juab<br />
Carbon<br />
Sanpete<br />
Millard<br />
Emery<br />
Grand<br />
Sevier<br />
Beaver<br />
Piute<br />
Wayne<br />
Iron<br />
Garfield<br />
San Juan<br />
Wash<strong>in</strong>gton<br />
Kane<br />
Counties with oil and/or gas production<br />
Background Information<br />
Counties<br />
Number of counties 29<br />
With oil and/or gas production 11<br />
First year of production<br />
Crude oil 1907<br />
Natural gas 1886<br />
Year and amount of peak production<br />
Crude oil — 42,301 thous. bbls. 1975<br />
Natural gas — 348,140 MMcf 1994<br />
Deepest produc<strong>in</strong>g well (ft.)<br />
Crude oil 20,600<br />
Natural gas 18,607<br />
Year and depth of deepest well drilled (ft.)<br />
1982 21,874<br />
Cumulative number of total wells drilled<br />
as of 12/31/06 (exclud<strong>in</strong>g service wells)<br />
<strong>Oil</strong> wells 6,813 38%<br />
<strong>Gas</strong> wells 6,040 34%<br />
Dry holes 4,908 28%<br />
Total 17,761 100%<br />
Value of <strong>Oil</strong> and <strong>Gas</strong><br />
Average wellhead price<br />
(2006)<br />
Crude oil ($/bbl.) $ 59.70<br />
Natural gas ($Mcf) $ 5.70<br />
Wellhead value of production<br />
(2006, <strong>in</strong> thous. $)<br />
Crude oil $ 1,069,227<br />
Natural gas $ 1,983,828<br />
Total $ 3,053,055<br />
Average natural gas price<br />
(2006, $/Mcf)<br />
Residential consumers $ 11.02<br />
Commercial consumers $ 9.61<br />
Industrial consumers $ 8.02<br />
Electric utilities<br />
NA<br />
City Gate $ 8.42<br />
Severance taxes paid $ 77,074<br />
(2006, <strong>in</strong> thous. $)<br />
Cumulative crude oil wellhead value<br />
as of 12/31/06 (thous. $) $18,438,149<br />
UTAH<br />
Cumulative production & new reserves<br />
as of 12/31/06<br />
Crude NGL Natural<br />
<strong>Oil</strong> (mill. bbls.) Total <strong>Gas</strong> (Bcf)<br />
Reserves 1,480 1,483 2,963 11,482<br />
Production 1,193 385 1,578 6,276<br />
86 AMERICA’S INDEPENDENT COMPILED BY <strong>IPAA</strong> FEBRUARY 2009
2006 <strong>Industry</strong> Statistics<br />
Number of wells drilled<br />
Exploratory Development Total<br />
<strong>Oil</strong> 19 287 306<br />
<strong>Gas</strong> 79 570 649<br />
Dry 27 23 50<br />
Total 125 880 1,005<br />
Total footage drilled<br />
(thous. ft.)<br />
Exploratory Development Total<br />
<strong>Oil</strong> 124.1 1,763.8 1,887.9<br />
<strong>Gas</strong> 659.8 4,794.7 5,454.5<br />
Dry 186.8 75.2 262.0<br />
Total 970.8 6,633.6 7,604.4<br />
(Note: Totals may not add due to round<strong>in</strong>g.)<br />
New-field wildcats drilled 53<br />
Footage (thous. ft.) 404.8<br />
Average rotary rigs active 40<br />
Permits 2,127<br />
<strong>State</strong>-wide rank<br />
Crude <strong>Oil</strong> Natural <strong>Gas</strong><br />
Wells drilled 21st 19th<br />
Production 13th 11th<br />
Reserves (2005) 11th 9th<br />
Number of operators 122<br />
Number of produc<strong>in</strong>g wells<br />
(12/31/06)<br />
Crude oil 2,953<br />
Natural gas 4,781<br />
Total 7,734<br />
Average production<br />
Crude oil (thous. b/d) 44<br />
NGL (thous. b/d) 5.4<br />
Natural gas (MMcf/day) 881<br />
Natural gas marketed production<br />
(MMcf) 348,040<br />
Average output per produc<strong>in</strong>g well<br />
Crude oil (bbls.) 5,406<br />
Natural gas (Mcf) 67,272<br />
Coalbed methane (YTD MMcf) 77,632<br />
<strong>Oil</strong> Wells 2<br />
<strong>Gas</strong> Wells 865<br />
Daily Average (MMcf) / Well 213<br />
2006 Latest Available Data<br />
Petroleum reserves<br />
as of 12/31/06 (mill. bbls.)<br />
Crude <strong>Oil</strong> NGL Total<br />
New reserves 95 70 165<br />
Production 17 62 79<br />
Net annual change 78 8 86<br />
Proved reserves 334 887 1,221<br />
Natural gas reserves<br />
as of 12/31/06 (Bcf)<br />
Associated Non- Dry<br />
Dissolved Associated <strong>Gas</strong><br />
New reserves 39 1,166 1,200<br />
Production 30 323 349<br />
Net annual change 9 843 851<br />
Proved reserves 317 4,894 5,146<br />
Cost of drill<strong>in</strong>g and equipp<strong>in</strong>g wells<br />
Cost/ft. Cost/ Total Cost<br />
($) well ($) (thous. $)<br />
<strong>Oil</strong> 201 1,240,306 379,534<br />
<strong>Gas</strong> 443 3,721,826 2,415,465<br />
Dry 321 1,681,321 84,066<br />
Marg<strong>in</strong>al oil wells<br />
<strong>Produc<strong>in</strong>g</strong> marg<strong>in</strong>al wells 1,979<br />
Crude oil production <strong>in</strong> bbls. (thous.) 4,163<br />
Crude oil production b/d (thous.) 11<br />
Marg<strong>in</strong>al natural gas wells<br />
as of 12/31/06<br />
<strong>Produc<strong>in</strong>g</strong> marg<strong>in</strong>al wells 2,386<br />
Natural gas production (MMcf) 35,126<br />
Federal onshore m<strong>in</strong>eral lease royalties<br />
<strong>Oil</strong> $ 115,262,119<br />
<strong>Gas</strong> $ 184,611,613<br />
Total Royalties $ 430,783,951<br />
Horizontal wells data<br />
Horizontal wells drilled 4<br />
Average number of employees<br />
<strong>Oil</strong> and natural gas extraction 5,168<br />
Refi n<strong>in</strong>g 819<br />
Transportation 1,142<br />
Wholesale 910<br />
Retail 9,612<br />
Pipel<strong>in</strong>e construction 400<br />
<strong>Oil</strong>fi eld mach<strong>in</strong>ery 248<br />
Total petroleum <strong>in</strong>dustry 18,299<br />
Heavy oil (YTD BBls, <strong>in</strong> thous.) 188<br />
Wells 19<br />
Av. Bbls per day 0.5<br />
Av. Bbls per well/d 9,916<br />
Source: EIA for production and IHS for wells drilled.<br />
In 1907, Pat Holohan found oil sand <strong>in</strong><br />
Wash<strong>in</strong>gton County and a dozen companies<br />
rushed <strong>in</strong> to drill 14 more. The next year, L.L.<br />
Goodridge brought <strong>in</strong> a gusher at Mexican Hat<br />
<strong>in</strong> San Juan County.<br />
UTAH<br />
COMPILED BY <strong>IPAA</strong> FEBRUARY 2009 AMERICA’S INDEPENDENT 87
VIRGINIA<br />
Counties with oil and/or gas production<br />
Background Information<br />
Counties<br />
Number of counties 96<br />
With oil and/or gas production 7<br />
First year of production<br />
Crude oil 1943<br />
Natural gas 1931<br />
Year and amount of peak production<br />
Crude oil — 65 thous. bbls. 1983<br />
Natural gas — 102,798 MMcf 2006<br />
Deepest produc<strong>in</strong>g well (ft.)<br />
Crude oil<br />
NA<br />
Natural gas 10,134<br />
Year and depth of deepest well drilled (ft.)<br />
1977 17,003<br />
Cumulative number of total wells drilled<br />
as of 12/31/06 (exclud<strong>in</strong>g service wells)<br />
<strong>Oil</strong> wells 54 1%<br />
<strong>Gas</strong> wells 4,757 92%<br />
Dry holes 337 7%<br />
Total 5,148 100%<br />
Value of <strong>Oil</strong> and <strong>Gas</strong><br />
Average wellhead price<br />
(2006<br />
Crude oil ($/bbl.)<br />
Natural gas ($Mcf)<br />
Wellhead value of production<br />
(2006, <strong>in</strong> thous. $)<br />
Crude oil<br />
Natural gas<br />
Total<br />
Average natural gas price<br />
(2006, $/Mcf)<br />
NA<br />
NA<br />
NA<br />
NA<br />
NA<br />
Residential consumers $ 16.20<br />
Commercial consumers $ 12.46<br />
Industrial consumers $ 9.98<br />
Electric utilities $ 7.73<br />
City Gate $ 10.51<br />
Severance taxes paid --<br />
(2006, <strong>in</strong> thous. $)<br />
Cumulative crude oil wellhead value<br />
as of 12/31/06 (thous. $) $11,097<br />
VIRGINIA<br />
Cumulative production & new reserves<br />
as of 12/31/06<br />
Crude NGL Natural<br />
<strong>Oil</strong> (mill. bbls.) Total <strong>Gas</strong> (Bcf)<br />
Reserves NA NA NA 3,184<br />
Production NA NA NA 1,190<br />
88 AMERICA’S INDEPENDENT COMPILED BY <strong>IPAA</strong> FEBRUARY 2009
2006 <strong>Industry</strong> Statistics<br />
Number of wells drilled<br />
Exploratory Development Total<br />
<strong>Oil</strong> NA NA NA<br />
<strong>Gas</strong> 14 531 545<br />
Dry NA NA NA<br />
Total 14 531 545<br />
Total footage drilled<br />
(thous. ft.)<br />
Exploratory Development Total<br />
<strong>Oil</strong> NA NA NA<br />
<strong>Gas</strong> 80.5 1,422.7 1,503.2<br />
Dry NA NA NA<br />
Total 80.5 1,422.7 1,503.2<br />
(Note: Totals may not add due to round<strong>in</strong>g.)<br />
New-field wildcats drilled 6<br />
Footage (thous. ft.) 34.1<br />
Average rotary rigs active 1<br />
Permits 623<br />
<strong>State</strong>-wide rank<br />
Crude <strong>Oil</strong> Natural <strong>Gas</strong><br />
Wells drilled 32nd 20th<br />
Production 32nd 17th<br />
Reserves (2006) NA 17th<br />
Number of operators* 21<br />
Number of produc<strong>in</strong>g wells<br />
(12/31/06)<br />
Crude oil<br />
NA<br />
Natural gas 5,007<br />
Total 5,007<br />
Average production<br />
Crude oil (thous. b/d) 0<br />
NGL (thous. b/d) 0<br />
Natural gas (MMcf/day) 282<br />
Natural gas marketed production<br />
(MMcf) 103,027<br />
Average output per produc<strong>in</strong>g well<br />
Crude oil (bbls.)<br />
NA<br />
Natural gas (Mcf) 20,531<br />
Coalbed methane (YTD MMcf)<br />
<strong>Oil</strong> Wells<br />
<strong>Gas</strong> Wells<br />
Daily Average (MMcf) / Well<br />
NA<br />
NA<br />
NA<br />
2006 Latest Available Data<br />
Petroleum reserves<br />
as of 12/31/06 (mill. bbls.)<br />
Crude <strong>Oil</strong> NGL Total<br />
New reserves NA NA NA<br />
Production NA NA NA<br />
Net annual change NA NA NA<br />
Proved reserves NA NA NA<br />
Natural gas reserves<br />
as of 12/31/06 (Bcf)<br />
Associated Non- Dry<br />
Dissolved Associated <strong>Gas</strong><br />
New reserves 0 386 386<br />
Production 0 102 102<br />
Net annual change 0 284 284<br />
Proved reserves 0 2,302 2,302<br />
Cost of drill<strong>in</strong>g and equipp<strong>in</strong>g wells<br />
Cost/ft. Cost/ Total Cost<br />
($) well ($) (thous. $)<br />
<strong>Oil</strong> NA NA NA<br />
<strong>Gas</strong> 115 316,063 172,254<br />
Dry NA NA NA<br />
Marg<strong>in</strong>al oil wells<br />
<strong>Produc<strong>in</strong>g</strong> marg<strong>in</strong>al wells<br />
Crude oil production <strong>in</strong> bbls. (thous.)<br />
Crude oil production b/d (thous.)<br />
NA<br />
NA<br />
NA<br />
Marg<strong>in</strong>al natural gas wells<br />
as of 12/31/06<br />
<strong>Produc<strong>in</strong>g</strong> marg<strong>in</strong>al wells 4,117<br />
Natural gas production (MMcf) 53,268<br />
Federal onshore m<strong>in</strong>eral lease royalties<br />
<strong>Oil</strong> --<br />
<strong>Gas</strong> $ 440,161<br />
Total Royalties $478,497<br />
Horizontal wells data<br />
Horizontal wells drilled 0<br />
Average number of employees<br />
<strong>Oil</strong> and natural gas extraction 1,543<br />
Refi n<strong>in</strong>g 0<br />
Transportation 1,997<br />
Wholesale 4,900<br />
Retail 33,251<br />
Pipel<strong>in</strong>e construction 1,748<br />
<strong>Oil</strong>fi eld mach<strong>in</strong>ery 0<br />
Total petroleum <strong>in</strong>dustry 43,439<br />
Heavy oil (YTD BBls, <strong>in</strong> thous.)<br />
NA<br />
Wells<br />
Av. Bbls per day<br />
Av. Bbls per well/d<br />
NA<br />
NA<br />
NA<br />
Source: EIA for production and IHS for wells drilled.<br />
* <strong>State</strong> Data<br />
Report<strong>in</strong>g on the Ruffner brothers wells<br />
northwestern Virg<strong>in</strong>ia <strong>in</strong> 1833, the American Journal of<br />
Science noted, “The petroleum affords considerable<br />
profi t and is beg<strong>in</strong>n<strong>in</strong>g to be <strong>in</strong> demand for workshops<br />
and manufactories. It affords a clear, brisk light, when<br />
burned <strong>in</strong> this way, and will be a valuable article for<br />
light<strong>in</strong>g the street lamps <strong>in</strong> the future . . .”<br />
VIRGINIA<br />
COMPILED BY <strong>IPAA</strong> FEBRUARY 2009 AMERICA’S INDEPENDENT 89
Hancock<br />
WEST VIRGINIA<br />
Brooke<br />
Ohio<br />
Marshall<br />
Mason<br />
Wetzel<br />
Monongalia<br />
Morgan<br />
Marion<br />
Tyler<br />
Preston<br />
Berkeley<br />
Pleasants<br />
Taylor<br />
M<strong>in</strong>eral<br />
Hampshire<br />
Harrison<br />
Jefferson<br />
Doddridge<br />
Wood<br />
Ritchie<br />
Barbour Tucker Grant<br />
Wirt<br />
Lewis<br />
Hardy<br />
Gilmer<br />
Upshur<br />
Jackson Calhoun<br />
Randolph<br />
Roane<br />
Braxton<br />
Pendleton<br />
Putnam<br />
Cabell<br />
Kanawha<br />
L<strong>in</strong>coln<br />
Wayne<br />
Boone<br />
Logan<br />
M<strong>in</strong>go<br />
Wyom<strong>in</strong>g<br />
McDowell<br />
Clay<br />
Webster<br />
Pocahontas<br />
Nicholas<br />
Fayette<br />
Greenbrier<br />
Raleigh<br />
Summers<br />
Monroe<br />
Mercer<br />
Counties with oil and/or gas production<br />
Background Information<br />
Value of <strong>Oil</strong> and <strong>Gas</strong><br />
Counties<br />
Number of counties 55<br />
With oil and/or gas production 46<br />
First year of production<br />
Crude oil 1860<br />
Natural gas 1885<br />
Year and amount of peak production<br />
Crude oil — 16,196 thous. bbls. 1900<br />
Natural gas — 264,139 MMcf 2000<br />
Deepest produc<strong>in</strong>g well (ft.)<br />
Crude oil 8,381<br />
Natural gas 17,111<br />
Year and depth of deepest well drilled (ft.)<br />
1974 20,222<br />
Cumulative number of total wells drilled<br />
as of 12/31/06 (exclud<strong>in</strong>g service wells)<br />
<strong>Oil</strong> wells 13,934 17%<br />
<strong>Gas</strong> wells 57,058 73%<br />
Dry holes 7,609 10%<br />
Total 78,188 100%<br />
Average wellhead price<br />
(2006)<br />
Crude oil ($/bbl.) $ 63.07<br />
Natural gas ($Mcf) $7.17<br />
Wellhead value of production<br />
(2006, <strong>in</strong> thous. $)<br />
Crude oil $ 110,309<br />
Natural gas $ 1,617,050<br />
Total $ 1,727,359<br />
Average natural gas price<br />
(2006, $/Mcf)<br />
Residential consumers $ 15.74<br />
Commercial consumers $ 14.38<br />
Industrial consumers $ 8.98<br />
Electric utilities $ 8.03<br />
City Gate $ 8.93<br />
Severance taxes paid $84,947<br />
(2006, <strong>in</strong> thous. $)<br />
WEST VIRGINIA<br />
Cumulative crude oil wellhead value<br />
as of 12/31/06 (thous. $) $2,804,167<br />
Cumulative production & new reserves<br />
as of 12/31/06<br />
Crude NGL Natural<br />
<strong>Oil</strong> (mill. bbls.) Total <strong>Gas</strong> (Bcf)<br />
Reserves 607 492 1,099 24,446<br />
Production 614 412 1,026 20,091<br />
90 AMERICA’S INDEPENDENT COMPILED BY <strong>IPAA</strong> FEBRUARY 2009
2006 <strong>Industry</strong> Statistics<br />
Number of wells drilled<br />
Exploratory Development Total<br />
<strong>Oil</strong> 6 71 77<br />
<strong>Gas</strong> 193 1,502 1,695<br />
Dry 8 11 19<br />
Total 207 1,584 1,791<br />
Total footage drilled<br />
(thous. ft.)<br />
Exploratory Development Total<br />
<strong>Oil</strong> 25.0 244.8 269.8<br />
<strong>Gas</strong> 892.1 6,175.1 7,067.1<br />
Dry 32.0 24.4 56.4<br />
Total 949.0 6,444.3 7,393.3<br />
(Note: Totals may not add due to round<strong>in</strong>g.)<br />
New-field wildcats drilled 36<br />
Footage (thous. ft.) 165.8<br />
Average rotary rigs active 27<br />
Permits 2,593<br />
<strong>State</strong>-wide rank<br />
Crude <strong>Oil</strong> Natural <strong>Gas</strong><br />
Wells drilled 16th 3rd<br />
Production 24th 14th<br />
Reserves (2006) 22nd 10th<br />
Number of operators 492<br />
Number of produc<strong>in</strong>g wells<br />
(12/31/06)<br />
Crude oil 2,107<br />
Natural gas 41,364<br />
Total 43,471<br />
Average production<br />
Crude oil (thous. b/d) 2<br />
NGL (thous. b/d) 2.3<br />
Natural gas (MMcf/day) 562<br />
Natural gas marketed production<br />
(MMcf) 225,530<br />
Average output per produc<strong>in</strong>g well<br />
Crude oil (bbls.) 374<br />
Natural gas (Mcf) 4,957<br />
Coalbed methane (YTD MMcf) 1,183<br />
<strong>Oil</strong> Wells 0<br />
<strong>Gas</strong> Wells 88<br />
Daily Average (MMcf) / Well 3<br />
Heavy oil (YTD BBls, <strong>in</strong> thous.)<br />
Wells<br />
Av. Bbls per day<br />
Av. Bbls per well/d<br />
NA<br />
NA<br />
NA<br />
NA<br />
Source: EIA for production and IHS for wells drilled.<br />
2006 Latest Available Data<br />
Petroleum reserves<br />
as of 12/31/06 (mill. bbls.)<br />
Crude <strong>Oil</strong> NGL Total<br />
New reserves 4 30 34<br />
Production 2 5 7<br />
Net annual change 2 25 27<br />
Proved reserves 23 110 133<br />
Natural gas reserves<br />
as of 12/31/06 (Bcf)<br />
Associated Non- Dry<br />
Dissolved Associated <strong>Gas</strong><br />
New reserves -2 277 237<br />
Production 1 192 187<br />
Net annual change -3 85 50<br />
Proved reserves 16 4,638 4,509<br />
Cost of drill<strong>in</strong>g and equipp<strong>in</strong>g wells<br />
Cost/ft. Cost/ Total Cost<br />
($) well ($) (thous. $)<br />
<strong>Oil</strong> 89 311,421 23,979<br />
<strong>Gas</strong> 87 361,116 612,092<br />
Dry 140 415,749 7,899<br />
Marg<strong>in</strong>al oil wells<br />
<strong>Produc<strong>in</strong>g</strong> marg<strong>in</strong>al wells 1,689<br />
Crude oil production <strong>in</strong> bbls. (thous.) 463<br />
Crude oil production b/d (thous.) 1<br />
Marg<strong>in</strong>al natural gas wells<br />
as of 12/31/06<br />
<strong>Produc<strong>in</strong>g</strong> marg<strong>in</strong>al wells 40,544<br />
Natural gas production (MMcf) 167,499<br />
Federal onshore m<strong>in</strong>eral lease royalties<br />
<strong>Oil</strong> $ 996<br />
<strong>Gas</strong> $ 709,959<br />
Total Royalties $ 981,725<br />
Horizontal wells data<br />
Horizontal wells drilled 2<br />
Average number of employees<br />
<strong>Oil</strong> and natural gas extraction 4,493<br />
Refi n<strong>in</strong>g 900<br />
Transportation 2,297<br />
Wholesale 1,042<br />
Retail 9,233<br />
Pipel<strong>in</strong>e construction 826<br />
<strong>Oil</strong>fi eld mach<strong>in</strong>ery 0<br />
Total petroleum <strong>in</strong>dustry 18,791<br />
Confederate Gen. William “Grumble”<br />
Jones attacked Burn<strong>in</strong>g Spr<strong>in</strong>gs on May 9, 1863.<br />
Jones reported, “All the oil, the tanks, barrels,<br />
eng<strong>in</strong>es for pump<strong>in</strong>g, eng<strong>in</strong>e-houses, and wagons<br />
— <strong>in</strong> a word, everyth<strong>in</strong>g used for rais<strong>in</strong>g, hold<strong>in</strong>g, or<br />
send<strong>in</strong>g it off was burned.”<br />
WEST VIRGINIA<br />
COMPILED BY <strong>IPAA</strong> FEBRUARY 2009 AMERICA’S INDEPENDENT 91
WYOMING<br />
Counties with oil and/or gas production<br />
Background Information<br />
Counties<br />
Number of counties 23<br />
With oil and/or gas production 20<br />
First year of production<br />
Crude oil 1894<br />
Natural gas 1889<br />
Year and amount of peak production<br />
Crude oil — 160,345 thous. bbls. 1970<br />
Natural gas — 1,948,640 MMcf 2005<br />
Deepest produc<strong>in</strong>g well (ft.)<br />
Crude oil 17,750<br />
Natural gas 25,175<br />
Year and depth of deepest well drilled (ft.)<br />
2001 25,830<br />
Cumulative number of total wells drilled<br />
as of 12/31/06 (exclud<strong>in</strong>g service wells)<br />
<strong>Oil</strong> wells 33,311 33%<br />
<strong>Gas</strong> wells 38,559 38%<br />
Dry holes 29,858 29%<br />
Total 101,728 100%<br />
Value of <strong>Oil</strong> and <strong>Gas</strong><br />
Average wellhead price<br />
(2006)<br />
Crude oil ($/bbl.) $53.25<br />
Natural gas ($Mcf) $ 5.85<br />
Wellhead value of production<br />
(2006, <strong>in</strong> thous. $)<br />
Crude oil $ 2,817,138<br />
Natural gas $ 10,624,776<br />
Total $ 13,441,914<br />
Average natural gas price<br />
(2006, $/Mcf)<br />
Residential consumers $ 11.60<br />
Commercial consumers $ 10.30<br />
Industrial consumers $ 8.90<br />
Electric utilities<br />
NA<br />
City Gate $ 7.20<br />
Severance taxes paid $660,461<br />
(2006, <strong>in</strong> thous. $)<br />
Cumulative crude oil wellhead value<br />
as of 12/31/06 (thous. $) $70,085,007<br />
WYOMING<br />
Cumulative production & new reserves<br />
as of 12/31/06<br />
Crude NGL Natural<br />
<strong>Oil</strong> (mill. bbls.) Total <strong>Gas</strong> (Bcf)<br />
Reserves 7,297 1,956 9,253 53,046<br />
Production 6,732 1,263 7,995 31,633<br />
92 AMERICA’S INDEPENDENT COMPILED BY <strong>IPAA</strong> FEBRUARY 2009
2006 <strong>Industry</strong> Statistics<br />
Number of wells drilled<br />
Exploratory Development Total<br />
<strong>Oil</strong> 19 231 250<br />
<strong>Gas</strong> 46 3,711 3,757<br />
Dry 45 82 127<br />
Total 110 4,024 4,134<br />
Total footage drilled<br />
(thous. ft.)<br />
Exploratory Development Total<br />
<strong>Oil</strong> 187.8 1,385.4 1,573.2<br />
<strong>Gas</strong> 501.8 14,476.0 14,977.8<br />
Dry 320.0 349.3 669.2<br />
Total 1,009.6 16,210.6 17,220.2<br />
(Note: Totals may not add due to round<strong>in</strong>g.)<br />
New-field wildcats drilled 68<br />
Footage (thous. ft.) 594.6<br />
Average rotary rigs active 99<br />
Permits 5,542<br />
<strong>State</strong>-wide rank<br />
Crude <strong>Oil</strong> Natural gas<br />
Wells drilled 9th 6th<br />
Production 8th 3rd<br />
Reserves (2006) 5th 2nd<br />
Number of operators 463<br />
Number of produc<strong>in</strong>g wells<br />
(12/31/06)<br />
Crude oil 12,813<br />
Natural gas 29,875<br />
Total 42,688<br />
Average production<br />
Crude oil (thous. b/d) 116<br />
NGL (thous. b/d) 29.5<br />
Natural gas (MMcf/day) 5,339<br />
Natural gas marketed production<br />
(MMcf) 1,816,201<br />
Average output per produc<strong>in</strong>g well<br />
Crude oil (bbls.) 3,300<br />
Natural gas (Mcf) 65,226<br />
Coalbed methane (YTD MMcf) 385,031<br />
<strong>Oil</strong> Wells 3<br />
<strong>Gas</strong> Wells 19,879<br />
Daily Average (MMcf) / Well 1,055<br />
Heavy oil (YTD BBls, <strong>in</strong> thous.) 10,974<br />
Wells 2,047<br />
Av. Bbls per day 30.1<br />
Av. Bbls per well/d 5,361<br />
Source: EIA for production and IHS for wells drilled.<br />
2006 Latest Available Data<br />
Petroleum reserves<br />
as of 12/31/06 (mill. bbls.)<br />
Crude <strong>Oil</strong> NGL Total<br />
New reserves 45 70 115<br />
Production 43 62 105<br />
Net annual change 2 8 10<br />
Proved reserves 706 887 1,593<br />
Natural gas reserves<br />
as of 12/31/06 (Bcf)<br />
Associated Non- Dry<br />
Dissolved Associated <strong>Gas</strong><br />
New reserves 10 1,492 1,470<br />
Production 47 1,714 1,695<br />
Net annual change -37 -222 -225<br />
Proved reserves 347 24,116 23,549<br />
Cost of drill<strong>in</strong>g and equipp<strong>in</strong>g wells<br />
Cost/ft. Cost/ Total Cost<br />
($) well ($) (thous. $)<br />
<strong>Oil</strong> 394 2,479,171 619,793<br />
<strong>Gas</strong> 556 2,217,858 8,332,491<br />
Dry 351 1,850,028 234,954<br />
Marg<strong>in</strong>al oil wells<br />
<strong>Produc<strong>in</strong>g</strong> marg<strong>in</strong>al wells 10,520<br />
Crude oil production <strong>in</strong> bbls. (thous.) 13,316<br />
Crude oil production b/d (thous.) 36<br />
Marg<strong>in</strong>al natural gas wells<br />
as of 12/31/06<br />
<strong>Produc<strong>in</strong>g</strong> marg<strong>in</strong>al wells 18,043<br />
Natural gas production (MMcf) 187,793<br />
Federal onshore m<strong>in</strong>eral lease royalties<br />
<strong>Oil</strong> $ 230,457,579<br />
<strong>Gas</strong> $ 1,056,668,685<br />
Total Royalties $ 2,206,279,983<br />
Horizontal wells data<br />
Horizontal wells drilled 60<br />
Average number of employees<br />
<strong>Oil</strong> and natural gas extraction 17,523<br />
Refi n<strong>in</strong>g 861<br />
Transportation 909<br />
Wholesale 743<br />
Retail 4,052<br />
Pipel<strong>in</strong>e construction 3,823<br />
<strong>Oil</strong>fi eld mach<strong>in</strong>ery 149<br />
Total petroleum <strong>in</strong>dustry 28,060<br />
In 1832, Capta<strong>in</strong> B. L. E. Bonneville<br />
took the fi rst wagons through South Pass and<br />
recorded the presence of oil. Fifty years later,<br />
prospector Mike Murphy, bought an oil lease on<br />
the site of Capt. Bonneville’s “great tar spr<strong>in</strong>g”<br />
southeast of Lander.<br />
WYOMING<br />
COMPILED BY <strong>IPAA</strong> FEBRUARY 2009 AMERICA’S INDEPENDENT 93
ROTARY RIGS OPERATING<br />
1997 1998 1999 2000 2001 2002 2003 2004 2005 2006<br />
Alabama 4 6 6 4 5 3 3 3 4 5<br />
Alaska 11 12 5 8 13 11 10 10 9 8<br />
Arizona 0 0 0 0 0 0 0 0 0 0<br />
Arkansas 10 6 3 4 2 1 2 6 9 24<br />
California 32 28 19 24 36 23 22 24 27 33<br />
Colorado 16 13 13 18 32 28 39 54 74 89<br />
Florida 0 0 0 0 0 0 1 1 2 0<br />
Ill<strong>in</strong>ois 0 0 0 0 0 0 0 0 0 0<br />
Indiana 0 0 0 0 0 0 0 0 0 0<br />
Kansas 19 13 7 22 23 8 9 7 7 10<br />
Kentucky 5 3 6 5 6 5 4 5 5 7<br />
Louisiana 194 187 141 194 214 163 157 167 182 188<br />
Michigan 6 5 2 3 1 1 3 3 3 2<br />
Mississippi 13 14 7 11 14 8 8 10 10 10<br />
Montana 11 9 4 7 10 8 14 20 24 22<br />
Nebraska 1 1 0 1 0 0 0 1 0 0<br />
Nevada 0 0 0 0 0 0 1 2 2 1<br />
New Mexico 53 45 36 68 68 42 65 67 83 94<br />
New York 1 2 3 3 5 4 3 5 4 6<br />
North Dakota 18 11 6 13 14 10 14 15 21 32<br />
Ohio 9 10 11 9 10 9 8 7 9 8<br />
Oklahoma 104 85 62 99 130 91 129 159 152 179<br />
Oregon 0 0 0 0 0 0 0 0 0 0<br />
Pennsylvania 10 11 8 9 11 11 10 9 13 16<br />
South Dakota 1 0 1 0 1 0 0 1 2 1<br />
Texas 358 303 227 343 462 338 449 506 614 746<br />
Utah 14 12 9 16 21 13 14 22 28 40<br />
Virg<strong>in</strong>ia 2 2 5 2 2 2 1 1 2 1<br />
West Virg<strong>in</strong>ia 15 14 14 14 18 13 16 15 17 27<br />
Wyom<strong>in</strong>g 39 38 32 41 55 40 54 74 78 99<br />
Other 1 1 0 0 2 1 1 0 1 NA<br />
ROTARY RIGS OPERATING<br />
TOTAL U.S. 943 827 625 918 1,156 830 1,032 1,192 1,381 1,649<br />
ONSHORE 820 703 517 779 1,002 716 923 1,095 1,287 1,561<br />
OFFSHORE 123 124 107 139 154 114 109 97 94 88<br />
Source: Baker-Hughes.<br />
94 AMERICA’S INDEPENDENT COMPILED BY <strong>IPAA</strong> FEBRUARY 2009
NEW-FIELD WILDCAT WELLS DRILLED<br />
1997 1998 1999 2000 2001 2002 2003 2004 2005 2006<br />
Alabama 28 18 19 17 19 16 17 22 17 24<br />
Alaska 11 12 5 8 10 10 9 8 0 5<br />
Arizona 3 7 0 0 0 10 9 8 4 1<br />
Arkansas 22 15 13 13 18 10 10 20 13 55<br />
California 35 22 32 42 42 29 26 31 30 13<br />
Colorado 77 60 49 42 71 40 49 64 136 101<br />
Florida 0 0 0 0 0 0 0 0 2 0<br />
Georgia 0 1 0 0 1 0 0 0 0 0<br />
Ill<strong>in</strong>ois 57 23 13 20 36 17 33 31 33 31<br />
Indiana 28 9 7 5 19 10 17 20 20 32<br />
Iowa 0 0 0 0 1 0 0 0 0 0<br />
Kansas 188 120 82 147 215 155 160 180 227 277<br />
Kentucky 34 18 16 26 87 84 123 151 124 239<br />
Louisiana 95 80 76 83 63 74 61 59 59 51<br />
Maryland 0 0 0 0 0 0 0 0 0 0<br />
Michigan 57 40 22 20 19 24 19 23 17 28<br />
Mississippi 31 29 29 25 28 38 33 29 33 30<br />
Missouri 1 1 3 1 3 2 0 0 0 0<br />
Montana 69 67 45 56 90 95 121 159 168 138<br />
Nebraska 23 14 9 15 12 14 15 16 18 20<br />
Nevada 10 6 1 3 3 2 3 3 5 1<br />
New Mexico 48 40 38 44 58 32 61 77 45 65<br />
New York 1 9 16 22 39 35 25 47 2 13<br />
North Carol<strong>in</strong>a 0 2 0 0 0 0 0 0 0 0<br />
North Dakota 49 28 16 19 19 9 4 25 45 104<br />
Ohio 9 21 1 0 5 6 4 2 13 16<br />
Oklahoma 100 63 57 65 102 69 97 102 110 181<br />
Oregon 0 1 0 0 0 0 0 0 0 0<br />
Pennsylvania 2 2 5 4 23 15 37 67 142 217<br />
South Dakota 8 5 1 1 1 6 5 1 6 4<br />
Tennessee 4 4 8 9 11 23 42 25 33 79<br />
Texas 538 581 453 517 432 345 434 476 464 387<br />
Utah 15 23 15 6 20 30 12 22 32 53<br />
Virg<strong>in</strong>ia 1 0 1 7 4 8 7 1 2 6<br />
Wash<strong>in</strong>gton 1 1 1 1 1 0 0 0 0 0<br />
West Virg<strong>in</strong>ia 1 3 5 10 32 29 18 28 23 36<br />
Wyom<strong>in</strong>g 155 107 89 77 78 74 85 86 80 68<br />
Federal Offshore 61 54 66 106 106 70 83 81 158 146<br />
TOTAL U.S. 1,762 1,487 1,193 1,411 1,668 1,372 1,610 1,857 1,936 2,275<br />
Source: IHS.<br />
Note: Data <strong>in</strong>clude oil wells, gas wells, and dry holes and may not total due to Federal Offshore data duplication.<br />
NEW-FIELD WILDCAT WELLS DRILLED<br />
COMPILED BY <strong>IPAA</strong> FEBRUARY 2009 AMERICA’S INDEPENDENT 95
EXPLORATORY WELLS DRILLED<br />
1997 1998 1999 2000 2001 2002 2003 2004 2005 2006<br />
Alabama 30 19 20 17 22 17 23 36 27 33<br />
Alaska 12 13 5 8 14 17 11 13 18 11<br />
Arizona 3 7 0 1 0 1 0 1 4 1<br />
Arkansas 24 15 13 14 23 10 12 26 35 78<br />
California 71 66 67 80 90 64 50 60 62 30<br />
Colorado 115 135 104 88 137 57 82 100 204 158<br />
Florida 0 0 0 0 0 0 0 0 2 0<br />
Georgia 0 1 0 0 1 0 0 0 0 0<br />
Iowa 0 0 0 0 1 0 0 0 0 0<br />
Ill<strong>in</strong>ois 118 75 37 51 47 33 46 47 45 67<br />
Indiana 69 33 20 10 19 12 37 24 35 45<br />
Kansas 295 190 148 251 400 281 292 345 416 452<br />
Kentucky 80 63 46 58 121 125 173 269 269 489<br />
Louisiana 106 92 85 87 64 83 72 73 70 64<br />
Maryland 0 0 0 0 0 0 0 0 0 0<br />
Michigan 60 44 30 23 25 30 23 27 23 34<br />
Mississippi 43 30 31 33 33 43 41 33 44 40<br />
Missouri 1 1 3 1 3 2 0 0 0 0<br />
Montana 106 119 65 100 177 156 187 248 287 255<br />
Nebraska 38 18 17 30 19 17 22 18 29 31<br />
Nevada 11 7 1 3 4 2 3 3 5 1<br />
New Mexico 143 128 104 95 115 75 98 103 94 114<br />
New York 4 11 18 26 46 38 32 59 27 15<br />
North Carol<strong>in</strong>a 0 2 0 0 0 0 0 0 0 0<br />
North Dakota 132 88 41 51 52 22 23 53 73 165<br />
Ohio 83 55 25 26 35 27 22 24 38 47<br />
Oklahoma 153 86 67 103 188 109 209 251 276 324<br />
Oregon 0 2 5 0 0 0 0 0 0 0<br />
EXPLORATORY WELLS DRILLED<br />
Pennsylvania 2 7 13 10 31 29 70 206 436 649<br />
South Dakota 11 7 2 1 2 6 5 4 7 4<br />
Tennessee 16 11 12 21 16 26 54 56 71 117<br />
Texas 1,228 1,033 789 848 1,000 706 786 762 732 688<br />
Utah 35 45 23 19 72 41 35 47 68 125<br />
Virg<strong>in</strong>ia 1 1 1 9 5 14 10 2 6 14<br />
Wash<strong>in</strong>gton 1 1 1 0 1 0 0 0 0 0<br />
West Virg<strong>in</strong>ia 8 11 18 28 76 88 41 144 196 207<br />
Wyom<strong>in</strong>g 195 180 143 142 178 151 143 126 130 110<br />
Federal Offshore 62 74 78 106 106 70 83 81 166 155<br />
TOTAL U.S. 3,266 2,670 2,032 2,340 3,123 2,352 2,685 3,241 3,729 4,368<br />
Source: IHS.<br />
Note: Data <strong>in</strong>clude oil wells, gas wells, and dry holes and may not total due to Federal Offshore data duplication.<br />
96 AMERICA’S INDEPENDENT COMPILED BY <strong>IPAA</strong> FEBRUARY 2009
DEVELOPMENT WELLS DRILLED<br />
1997 1998 1999 2000 2001 2002 2003 2004 2005 2006<br />
Alabama 94 168 205 152 346 246 371 405 416 407<br />
Alaska 158 200 94 128 164 179 165 193 155 121<br />
Arizona 0 0 1 0 0 0 0 0 0 0<br />
Arkansas 215 177 136 155 227 144 216 278 299 417<br />
California 2,431 2,134 1,478 2,113 2,181 1,925 1,928 2,161 2,234 2,464<br />
Colorado 677 720 636 955 1,392 1,332 1,511 1,892 2,506 2,845<br />
Florida 4 1 0 4 0 1 0 0 1 0<br />
Ill<strong>in</strong>ois 456 339 213 328 367 289 308 277 379 411<br />
Indiana 76 55 34 53 117 81 145 125 128 72<br />
Kansas 1,414 728 497 911 1,099 902 1,339 1,542 1,867 2,709<br />
Kentucky 685 587 601 729 865 891 752 573 680 805<br />
Louisiana 1,249 1,098 757 1,031 1,217 790 1,003 1,188 1,381 1,569<br />
Maryland 0 0 1 0 0 0 0 0 0 0<br />
Michigan 610 540 298 374 414 337 353 403 505 524<br />
Mississippi 151 159 86 192 242 168 240 237 255 253<br />
Missouri 1 1 5 14 6 0 1 0 0 0<br />
Montana 345 242 383 418 406 388 644 504 682 863<br />
Nebraska 44 14 3 11 13 14 16 32 46 34<br />
Nevada 4 4 1 1 3 2 0 0 0 0<br />
New Mexico 1,169 1,097 935 1,461 1,574 1,200 1,526 1,686 1,812 1,914<br />
New York 60 54 69 70 77 54 46 77 133 227<br />
North Dakota 186 145 42 121 158 154 199 168 227 322<br />
Ohio 697 517 495 547 690 493 493 525 539 637<br />
Oklahoma 2,172 1,847 1,582 2,176 2,982 2,351 2,783 2,884 3,248 3,671<br />
Oregon 0 5 5 0 0 0 0 0 0 0<br />
Pennsylvania 1,245 1,502 1,362 1,591 2,232 2,183 2,505 2,290 2,908 3,611<br />
South Dakota 6 3 4 10 9 6 3 8 34 21<br />
Tennessee 67 98 109 165 103 81 198 146 163 168<br />
Texas 9,276 7,012 4,697 6,931 8,052 6,534 8,592 9,522 10,800 12,272<br />
Utah 376 455 237 414 549 383 381 554 709 880<br />
Virg<strong>in</strong>ia 263 221 278 245 304 291 358 361 318 531<br />
Wash<strong>in</strong>gton 0 0 0 0 0 0 0 2 0 0<br />
West Virg<strong>in</strong>ia 709 764 670 653 887 870 974 1,081 1,212 1,584<br />
Wyom<strong>in</strong>g 1,025 1,075 2,438 4,744 5,331 3,045 2,768 3,717 4,330 4,024<br />
Federal Offshore 1,035 893 794 939 952 612 630 615 551 483<br />
TOTAL U.S. 25,987 22,076 18,506 26,843 32,184 25,454 29,923 32,945 37,967 43,805<br />
Source: IHS.<br />
Note: Data <strong>in</strong>clude oil wells, gas wells, and dry holes and may not total due to Federal Offshore data duplication.<br />
DEVELOPMENT WELLS DRILLED<br />
COMPILED BY <strong>IPAA</strong> FEBRUARY 2009 AMERICA’S INDEPENDENT 97
TOTAL WELLS DRILLED<br />
1997 1998 1999 2000 2001 2002 2003 2004 2005 2006<br />
Alabama 124 187 225 169 368 263 394 441 443 440<br />
Alaska 170 213 99 136 178 196 176 206 173 132<br />
Arizona 3 7 1 1 0 1 0 1 4 1<br />
Arkansas 239 192 149 169 250 154 228 304 334 495<br />
California 2,502 2,200 1,545 2,193 2,271 1,989 1978 2,221 2,296 2,494<br />
Colorado 792 855 740 1,043 1,529 1,389 1,593 1,992 2,710 3,003<br />
Florida 4 1 0 4 0 1 0 0 3 0<br />
Georgia 0 1 0 0 1 0 0 0 0 0<br />
Ill<strong>in</strong>ois 574 414 250 379 414 322 354 324 424 478<br />
Indiana 145 88 54 63 136 93 182 149 163 117<br />
Iowa 0 0 0 0 1 0 0 0 0 0<br />
Kansas 1,709 918 645 1,162 1,499 1,183 1,631 1,887 2,283 3,161<br />
Kentucky 765 650 647 787 986 1,016 925 842 949 1,294<br />
Louisiana 1,355 1,190 842 1,118 1,281 873 1,075 1,261 1,451 1,633<br />
Maryland 0 0 1 0 0 0 0 0 0 0<br />
Michigan 670 584 328 397 439 367 376 430 528 558<br />
Mississippi 194 189 117 225 275 211 281 270 299 293<br />
Missouri 2 2 8 15 9 2 1 0 0 0<br />
Montana 451 361 448 518 583 544 831 752 969 1,118<br />
Nebraska 82 32 20 41 32 31 38 50 75 65<br />
Nevada 15 11 2 4 7 4 3 3 5 1<br />
New Mexico 1,312 1,225 1,039 1,556 1,689 1,275 1,624 1,789 1,906 2,028<br />
New York 64 65 87 96 123 92 78 136 160 242<br />
North Carol<strong>in</strong>a 0 2 0 0 0 0 0 0 0 0<br />
North Dakota 318 233 83 172 210 176 222 221 300 487<br />
Ohio 780 572 520 573 725 520 515 549 577 684<br />
Oklahoma 2,325 1,933 1,649 2,279 3,170 2,460 2,992 3,135 3,524 3,995<br />
Oregon 0 7 10 0 0 0 0 0 0 0<br />
Pennsylvania 1,247 1,509 1,375 1,601 2,263 2,212 2,575 2,496 3,344 4,260<br />
South Dakota 17 10 6 11 11 12 8 12 41 25<br />
Tennessee 83 109 121 186 119 107 252 202 234 285<br />
Texas 10,514 8,045 5,486 7,779 9,052 7,240 9,378 10,284 11,532 13,409<br />
TOTAL WELLS DRILLED<br />
Utah 411 500 260 433 621 424 416 601 777 1,005<br />
Virg<strong>in</strong>ia 264 222 279 254 309 305 368 363 324 545<br />
Wash<strong>in</strong>gton 1 1 1 0 1 0 0 2 0 0<br />
West Virg<strong>in</strong>ia 717 775 688 681 963 958 1,015 1,225 1,408 1,791<br />
Wyom<strong>in</strong>g 1,220 1,255 2,581 4,886 5,509 3,196 2,911 3,843 4,460 4,134<br />
Federal Offshore 1,237 1,078 971 1,135 1,158 758 807 786 716 638<br />
TOTAL U.S. 30,306 25,636 21,277 30,066 36,182 28,374 33,227 36,777 41,696 48,173<br />
Source: IHS.<br />
Note: Data <strong>in</strong>clude oil wells, gas wells, and dry holes and may not total due to Federal Offshore data duplication.<br />
98 AMERICA’S INDEPENDENT COMPILED BY <strong>IPAA</strong> FEBRUARY 2009
PRODUCING CRUDE WELLS<br />
1997 1998 1999 2000 2001 2002 2003 2004 2005 2006<br />
Alabama 564 549 521 502 494 481 485 502 557 493<br />
Alaska 2,229 2,349 2,256 2,243 2,304 2,310 2,283 2,384 2,505 2,465<br />
Arizona 27 29 30 28 27 24 24 21 23 25<br />
Arkansas 2,553 2,352 2,167 2,244 5,498 4,385 2,718 2,143 2,138 2,505<br />
California 45,731 46,267 45,293 46,654 47,148 46,811 47,060 47,666 48,239 49,705<br />
Colorado 5,519 5,370 5,305 5,400 5,322 5,272 5,133 5,140 5,088 5,049<br />
Florida 107 99 88 79 73 72 96 67 76 65<br />
Kansas 47,594 45,683 42,539 42,358 41,774 41,629 41,261 40,167 40,024 40,349<br />
Louisiana 20199 19,290 18,300 19,604 18,530 17,996 17,991 17,569 17,463 17,999<br />
Michigan 958 2,519 2,631 3,688 3,845 3,672 3,790 3,761 3,887 3,847<br />
Mississippi 1,854 1,796 1,715 1,742 1,768 1,616 1,664 1,685 1,647 1,788<br />
Montana 3,823 3,735 3,617 3,741 4,409 3,662 3,713 3,918 4,052 4,272<br />
Nebraska 1,493 1,424 1,269 1,270 1,250 1,224 1,222 1,224 1,211 1,229<br />
Nevada 80 75 70 69 69 71 71 68 71 68<br />
New Mexico 18,452 18517 18,189 18,809 19,512 19,420 19,652 20,034 20,553 21,219<br />
New York NA NA NA NA 10 NA 2,417 2,406 2,053 2,395<br />
North Dakota 3,572 3,483 3,391 3,418 3,481 4,224 3,519 3,779 3,506 3,512<br />
Ohio 16,866 16,222 15,443 16,760 17,277 17,529 17,165 17,147 17,436 17,867<br />
Oklahoma 69,172 66,986 64,254 61,074 60,923 58,088 53,530 52,326 51,869 54,408<br />
South Dakota 157 148 143 144 144 143 143 145 162 153<br />
Texas 179,250 175,147 166,711 163,487 161,943 158,410 154,932 152,693 152,045 153,455<br />
Utah 2,242 2,201 2,112 2,142 2,201 2,163 2,217 2,433 2,685 2,953<br />
West Virg<strong>in</strong>ia 2,041 1,895 1,558 1,263 1,708 2,188 1,469 2,099 2,115 2,107<br />
Wyom<strong>in</strong>g 12,096 11,775 11,599 11,910 11,921 11,716 11,688 11,743 12,147 12,813<br />
Federal Offshore 4,571 4,405 4,256 4,240 4,235 4,127 3,957 3,840 3,631 3,146<br />
TOTAL U.S. 441,150 432,316 413,457 412,869 415,866 407,233 398,200 394,960 395,183 403,887<br />
Source: IHS.<br />
PRODUCING CRUDE WELLS<br />
COMPILED BY <strong>IPAA</strong> FEBRUARY 2009 AMERICA’S INDEPENDENT 99
PRODUCING NATURAL GAS WELLS<br />
1997 1998 1999 2000 2001 2002 2003 2004 2005 2006<br />
Alabama 3,362 3,469 3,497 3,698 3,891 4,130 4,460 4,784 5,122 5,523<br />
Arizona 8 7 7 7 7 8 6 7 4 5<br />
Arkansas 3,068 3,117 3,073 3,336 3,454 3,510 3,704 3,959 4,298 4,481<br />
California 1,447 1,287 1,309 1,359 1,484 1,416 1,467 1,497 1,579 1,715<br />
Colorado 13,342 13,541 16,040 16,824 18,137 19,280 20,821 22,693 25,570 28,407<br />
Kansas 15,757 15,789 15,781 18,069 16,684 17,827 16,998 17,740 18,417 19,891<br />
Kentucky 9,045 9,598 9,859 10,225 10,541 11,038 11,510 12,298 11,754 12,771<br />
Louisiana 13,862 13,931 13,889 13,907 8,405 8,250 8,367 8,734 9,385 10,679<br />
Michigan 6,237 6,992 7,152 7,234 7,642 7,957 8,282 8,524 9,009 9,444<br />
Mississippi 640 648 665 765 913 992 1,151 1,284 1,469 1,574<br />
Montana 3,389 3,531 3,862 4,115 4,419 4,603 4,864 5,299 5,716 6,200<br />
Nebraska 90 100 108 99 102 104 108 112 115 117<br />
New Mexico 21,010 21,512 22,225 23,213 24,506 25,454 26,687 28,160 29,723 31,246<br />
New York 5,601 5,638 5,722 5,713 6,120 5,544 6,517 6,707 6,661 6,764<br />
North Dakota 87 83 82 92 100 97 111 133 208 371<br />
Ohio 22,568 21,619 20,661 22,011 22,585 22,426 22,613 22,212 22,151 23,123<br />
Oklahoma 24,094 24,633 25,200 26,297 27,829 29,077 30,551 32,214 34,081 36,358<br />
Oregon 20 20 21 18 18 16 16 16 14 13<br />
South Dakota 58 56 56 58 58 58 58 60 60 62<br />
Texas 57,692 59,072 59,760 61,388 64,760 66,747 70,056 74,550 79,879 86,272<br />
Utah 1,591 1,812 2,060 2,353 2,792 3,118 3,392 3,715 4,171 4,781<br />
West Virg<strong>in</strong>ia 38,283 40,298 39,429 29,977 39,465 40,846 39,763 41,309 44,172 41,364<br />
Wyom<strong>in</strong>g 5,467 6,119 7,470 11,115 15,705 19,269 21,099 23,749 26,475 29,875<br />
Federal Offshore 4,789 4,645 4,606 4,628 4,672 4,374 4,277 4,137 3,878 3,367<br />
TOTAL U.S. 251,507 257,517 262,534 266,501 284,289 296,141 306,878 323,893 344,095 369,410<br />
Source: IHS. Data not available for certa<strong>in</strong> states.<br />
*Alaska is not <strong>in</strong>cluded as produced natural gas is re-<strong>in</strong>jected <strong>in</strong> order to ma<strong>in</strong>ta<strong>in</strong> reservoir pressure.<br />
PRODUCING NATURAL GAS WELLS<br />
100 AMERICA’S INDEPENDENT COMPILED BY <strong>IPAA</strong> FEBRUARY 2009
CRUDE OIL PRODUCTION<br />
(thous. bbls.)<br />
1997 1998 1999 2000 2001 2002 2003 2004 2005 2006<br />
Alabama 8,787 7,453 6,406 5,983 5,415 5,163 4,970 4,662 5,197 5,276<br />
Alaska 472,957 429,232 383,199 355,149 351,466 359,496 362,371 335,740 335,740 269,150<br />
Arizona 79 74 62 55 58 61 45 50 48 53<br />
Arkansas 7,878 7,093 6,187 6,454 6,873 6,470 6,586 5,845 5,388 5,292<br />
California 285,047 284,232 273,222 271,027 260,545 255,195 247,393 239,485 228,811 222,874<br />
Colorado 17,990 16,668 13,971 13,884 13,209 12,771 12,682 12,014 11,764 11,357<br />
Florida 6,262 5,938 4,888 4,624 4,406 3,644 3,263 2,875 2,585 2,349<br />
Ill<strong>in</strong>ois 13,514 12,807 11,274 10,906 10,198 11,127 11,707 10,699 8,899 10,324<br />
Indiana 2,399 2,179 1,962 2,035 2,073 1,969 1,870 1,729 1,595 1,714<br />
Kansas 41,211 36,644 34,084 34,238 33,957 33,056 33,711 33,802 33,897 35,621<br />
Kentucky 1,587 1,372 1,459 1,545 1,490 1,381 1,347 1,210 1,215 1,181<br />
Louisiana 94,694 90,606 80,263 75,860 71,204 60,626 58,658 56,983 50,835 49,443<br />
Michigan 6,395 7,360 6,846 7,502 7,070 6,583 6,230 5,763 5,744 5,686<br />
Mississippi 19,648 19,620 16,389 18,564 18,040 16,781 15,678 15,635 16,402 16,103<br />
Montana 16,254 16,688 15,346 15,719 16,172 16,940 19,309 24,674 32,655 36,027<br />
Nebraska 3,315 3,166 2,666 2,953 2,911 2,746 2,810 2,520 2,405 2,297<br />
Nevada 974 799 706 621 571 553 492 463 446 426<br />
New Mexico 67,926 63,591 59,667 61,659 60,957 58,293 57,004 56,723 54,530 53,661<br />
New York 0 0 0 0 0 0 94 110 92 188<br />
North Dakota 35,334 35,071 32,360 32,042 30,653 29,876 28,413 30,142 34,092 36,763<br />
Ohio 5,842 5,163 4,563 4,935 5,532 4,917 4,521 4,264 4,250 4,372<br />
Oklahoma 75,990 71,992 65,297 62,930 61,248 58,543 56,770 54,899 52,288 53,947<br />
Oregon 0 0 0 0 0 0 0 0 0 0<br />
South Dakota 1,335 1,208 1,100 1,162 1,246 1,209 1,239 1,356 1,415 1,394<br />
Texas 490,861 459,255 408,993 400,930 380,943 365,891 359,907 351,459 347,614 346,079<br />
Utah 17,085 17,042 14,560 14,156 13,913 12,610 12,089 13,718 15,298 15,965<br />
West Virg<strong>in</strong>ia 691 627 533 538 706 571 768 586 676 788<br />
Wyom<strong>in</strong>g 64,279 58,893 52,901 52,987 48,963 46,020 43,174 41,689 41,452 42,287<br />
Federal Offshore 394,332 415,456 454,621 470,192 473,252 496,663 505,364 476,795 427,167 431,321<br />
TOTAL U.S. 2,152,667 2,070,229 1,953,524 1,928,649 1,883,071 1,869,155 1,858,465 1,785,890 1,700,805 1,661,939<br />
DAILY AVG. 6,452 6,252 5,881 5,822 5,801 5,746 5,681 5,419 5,178 4,553<br />
Source: IHS.<br />
Notes: Daily Average derived from EIA data.<br />
CRUDE OIL PRODUCTION<br />
COMPILED BY <strong>IPAA</strong> FEBRUARY 2009 AMERICA’S INDEPENDENT 101
NATURAL GAS PRODUCTION<br />
(MMcf)<br />
1997 1998 1999 2000 2001 2002 2003 2004 2005 2006<br />
Alabama 427,006 428,112 415,442 396,775 381,831 370,977 355,701 324,437 301,634 290,530<br />
Arizona 397 404 333 281 239 236 183 218 154 522<br />
Arkansas 166,023 152,174 146,407 149,085 149,662 147,897 153,236 170,222 182,452 192,991<br />
California 76,204 78,588 90,546 86,347 89,748 78,277 83,695 75,362 81,952 90,504<br />
Colorado 616,398 673,310 706,407 758,839 803,229 912,289 997,085 1,062,396 1,120,614 1,217,865<br />
Kansas 690,603 612,428 574,048 528,307 490,685 464,540 431,149 405,594 386,067 378,032<br />
Kentucky 70,077 72,949 75,096 76,073 77,031 81,344 83,452 85,668 79,419 85,840<br />
Louisiana 1,448,720 1,387,931 1,310,820 1,322,815 1,371,071 1,261,846 1,252,126 1,266,290 1,219,382 1,290,156<br />
Michigan 244,858 247,144 227,506 215,038 203,038 192,482 178,082 170,023 161,614 159,295<br />
Mississippi 119,636 119,764 120,227 110,869 132,500 142,950 157,847 170,157 183,103 206,269<br />
Montana 48,585 52,105 55,197 64,740 74,416 79,235 78,092 87,046 91,456 93,199<br />
Nebraska 1,114 1,209 1,021 861 871 894 1,183 1,217 939 898<br />
New Mexico 1,352,312 1,400,987 1,454,198 1,461,998 1,466,020 1,412,648 1,375,603 1,372,580 1,358,029 1,352,226<br />
New York 16,822 17,034 17,148 18,476 30,181 36,252 35,725 45,785 53,535 39,741<br />
North Dakota 16,023 16,108 13,732 12,896 14,744 14,485 12,823 13,329 13,150 17,216<br />
Ohio 86,329 87,785 74,411 74,125 72,225 70,426 68,428 66,562 60,451 62,021<br />
Oklahoma 1,474,597 1,417,037 1,393,706 1,433,317 1,448,236 1,396,439 1,412,925 1,446,878 1,486,872 1,557,944<br />
Oregon 1,381 1,263 1,555 1,596 1,115 840 734 468 457 624<br />
South Dakota 689 760 685 598 538 510 523 509 428 438<br />
Texas 4,819,180 4,854,011 4,715,593 4,869,777 4,940,417 4,886,656 4,962,056 5,072,699 5,319,815 5,647,050<br />
Utah 230,900 253,950 239,524 244,989 265,032 260,714 257,510 264,789 281,368 321,626<br />
West Virg<strong>in</strong>ia 168,619 172,312 218,565 161,940 190,798 194,328 183,091 195,084 215,145 205,051<br />
Wyom<strong>in</strong>g 1,000,235 1,045,758 1,118,077 1,266,885 1,390,353 1,539,308 1,636,903 1,735,410 1,839,625 1,948,640<br />
Fed. Offshore 4,576,487 4,406,420 4,316,714 4,177,882 4,278,528 3,829,757 3,715,894 3,355,752 2,594,879 2,376,086<br />
TOTAL U.S. 17,653,194 17,499,544 17,286,958 17,434,509 17,872,507 17,375,334 17,434,045 17,388,474 17,250,875 17,637,563<br />
Source: IHS. Data not available for certa<strong>in</strong> states.<br />
*Alaska data is not <strong>in</strong>cluded as produced natural gas <strong>in</strong> re-<strong>in</strong>jected <strong>in</strong> order to ma<strong>in</strong>ta<strong>in</strong> reservoir pressure.<br />
NATURAL GAS PRODUCTION<br />
102 AMERICA’S INDEPENDENT COMPILED BY <strong>IPAA</strong> FEBRUARY 2009
PRODUCING MARGINAL OIL WELLS<br />
1997 1998 1999 2000 2001 2002 2003 2004 2005 2006<br />
Alabama 317 317 307 295 305 300 304 320 387 320<br />
Alaska 90 128 95 101 136 145 151 140 144 154<br />
Arizona 24 26 27 25 24 22 23 19 22 24<br />
Arkansas 2,107 1,920 1,871 2,002 5,334 4,141 2,427 1,910 1,925 2,259<br />
California 28,720 29,484 28,803 30,194 31,274 31,314 31,770 33,010 34,338 36,126<br />
Colorado 4,594 4,461 4,437 4,504 4,454 4,455 4,344 4,384 4,334 4,318<br />
Florida 16 12 11 9 7 13 33 11 15 8<br />
Ill<strong>in</strong>ois 6,414 5,848 5,463 5,500 5,102 5,166 5,107 5,148 4,964 5,269<br />
Indiana 1,344 1,212 1,124 1,142 1,114 1,108 1,043 1,051 995 1,061<br />
Kansas 46,631 44,914 41,825 41,716 41,141 40,933 40,607 39,386 39,250 39,543<br />
Kentucky 1,274 1,107 1,078 1,060 1,034 995 981 965 947 994<br />
Louisiana 16,699 15,633 15,205 14,894 15,737 15,377 15,587 15,129 15,288 15,671<br />
Michigan 594 2,120 2,240 3,306 3,520 3,386 3,502 3,508 3,665 3,617<br />
Mississippi 926 948 919 864 867 793 822 850 883 964<br />
Montana 2,846 2,786 2,733 2,810 3,465 2,714 2,731 2,817 2,853 2,938<br />
Nebraska 1,397 1,335 1,199 1,190 1,172 1,154 1,140 1,177 1,157 1,181<br />
Nevada 42 39 32 35 38 39 42 40 45 45<br />
New Mexico 14,774 14,954 14,727 15,324 15,893 15,916 16,181 16,602 17,114 17,759<br />
New York NA NA NA NA NA NA 2,249 2,164 1,966 2,073<br />
North Dakota 2,119 2,053 2,019 2,035 2,085 2,819 2,163 2,412 2,164 2,146<br />
Ohio 14,922 14,035 13,809 14,812 15,251 15,762 15,162 15,308 15,360 15,570<br />
Oklahoma 64,411 61,599 59,045 56,384 56,346 53,846 49,700 48,542 47,937 48,234<br />
South Dakota 58 58 57 57 54 52 61 64 75 71<br />
Texas 156,915 153,113 145,466 146,200 145,415 142,031 139,807 138,498 138,295 140,644<br />
Utah 1,263 1,252 1,288 1,315 1,360 1,421 1,442 1,582 1,756 1,979<br />
West Virg<strong>in</strong>ia 1,909 1,787 1,456 1,143 1,544 2,016 1,201 1,722 1,480 1,689<br />
Wyom<strong>in</strong>g 9,046 9,020 8,997 9,248 9,360 9,237 9,355 9,473 9,911 10,520<br />
Federal Offshore 691 678 599 630 669 707 640 648 755 621<br />
TOTAL U.S. 380,143 370,838 354,832 356,795 362,701 355,862 348,575 346,876 348,021 355,794<br />
Source: IHS.<br />
Notes: A marg<strong>in</strong>al oil well is def<strong>in</strong>ed as a well produc<strong>in</strong>g 15 barrels/day or less.<br />
*Totals may not add due to round<strong>in</strong>g.<br />
PRODUCING MARGINAL OIL WELLS<br />
COMPILED BY <strong>IPAA</strong> FEBRUARY 2009 AMERICA’S INDEPENDENT 103
MARGINAL OIL WELL PRODUCTION<br />
( thous. bbls.)<br />
1997 1998 1999 2000 2001 2002 2003 2004 2005 2006<br />
Alabama 759 731 709 703 748 752 754 740 809 706<br />
Alaska 136 257 176 185 252 288 243 264 193 326<br />
Arizona 40 40 30 30 39 34 32 24 37 40<br />
Arkansas 3,068 2,667 2,910 3103 4,095 3,212 2,881 3,042 3,046 2,883<br />
California 59,565 59,951 58,766 62,439 63,431 62,603 62,889 64,825 66,663 69,591<br />
Colorado 4,083 3,831 3,591 3,768 3,881 4,212 4,199 4,188 4,028 3,970<br />
Florida 31 23 20 23 20 35 46 27 25 20<br />
Ill<strong>in</strong>ois 6,499 5,884 5,507 5,551 5,068 5,227 5,267 5,104 4,249 5,153<br />
Indiana 1,386 1,255 1,149 1,186 1,178 1,102 1,063 1,020 916 1,085<br />
Kansas 30,527 27,114 26,276 25,835 25,504 25,250 25,016 24,607 24,541 25,250<br />
Kentucky 912 847 793 804 799 753 698 701 677 671<br />
Louisiana 12,912 11,562 10,702 10,617 10,342 10,043 9,773 9,547 10,029 9,494<br />
Michigan 1,205 1,753 1,769 3,304 3,460 3,367 3,374 3,427 3,443 3,297<br />
Mississippi 2,134 2,176 1,913 1,997 1,994 1,855 1,966 2,010 2,121 2,202<br />
Montana 3,362 3,331 3,223 3,413 3,457 3,344 3,350 3,352 3,508 3,519<br />
Nebraska 2,518 2,228 2,010 1,981 1,857 1,826 1,777 1,842 1,711 1,676<br />
Nevada 77 84 60 71 89 92 90 91 103 117<br />
New Mexico 19,957 19,876 19,574 20,064 20,549 20,516 20,825 21,045 21,788 22,253<br />
New York NA NA NA NA NA NA 94 110 92 188<br />
North Dakota 4,791 4,459 4,318 4,572 4,658 4,648 4,815 4,531 4,601 4,710<br />
Ohio 4,383 3,918 3,692 4,042 4,364 4,152 3,871 3,669 3,716 3,709<br />
Oklahoma 48,470 44,715 41,612 41,413 41,037 39,526 37,636 36,618 34,834 35,018<br />
South Dakota 175 172 164 198 194 166 208 217 229 212<br />
Texas 165,124 157,315 150,271 153,498 151,564 147,152 145,505 142,581 142,740 145,308<br />
Utah 2,743 2,682 2,743 2,872 2,875 3,010 3,110 3,391 3,908 4,163<br />
West Virg<strong>in</strong>ia 428 402 317 330 351 370 343 384 422 463<br />
Wyom<strong>in</strong>g 14,181 13,752 13,494 13,785 13,611 13,344 13,383 13,289 13,448 13,316<br />
Federal Offshore 1,557 1,583 1,351 1,398 1,574 1,675 1,527 1,528 1,889 1,372<br />
MARGINAL OIL WELL PRODUCTION<br />
TOTAL U.S. 391,023 372,603 357,140 367,182 366,993 358,554 354,735 352,166 353,755 360,708<br />
Source: IHS.<br />
Notes:Totals may not add due to round<strong>in</strong>g.<br />
.<br />
104 AMERICA’S INDEPENDENT COMPILED BY <strong>IPAA</strong> FEBRUARY 2009
PRODUCING MARGINAL NATURAL GAS WELLS<br />
1997 1998 1999 2000 2001 2002 2003 2004 2005 2006<br />
Alabama 1,777 1,834 1,928 2,199 2,403 2,590 2,889 3,187 3,639 4,165<br />
Arizona 3 2 3 3 3 5 2 2 2 2<br />
Arkansas 1,709 1,827 1,814 2,030 2,155 2,216 2,387 2,526 2,750 2,888<br />
California 693 580 617 677 667 681 683 706 765 835<br />
Colorado 8,091 8,034 12,459 12,674 13,360 13,742 14,725 16,097 18,525 20,404<br />
Kansas 7,379 7,894 8,320 8,948 9,863 10,657 11,858 13,417 15,038 17,185<br />
Kentucky 8,881 9,444 9,684 10,074 10,405 10,868 11,329 12,129 11,616 12,617<br />
Louisiana 9,926 10,056 10,055 10,023 4,339 4,168 4,220 4,327 4,646 4,851<br />
Michigan 482 562 563 609 737 821 892 956 1,039 1,122<br />
Mississippi 286 290 296 388 447 506 684 806 932 1,063<br />
Montana 3,086 3,206 3,447 3,636 3,854 4,002 4,262 4,536 4,790 5,276<br />
Nebraska 84 85 87 87 89 92 95 98 101 103<br />
New Mexico 12,996 13,159 13,374 14,006 14,847 15,598 16,482 17,650 19,194 20,461<br />
New York 5,550 5,564 5,653 5,645 6,041 5,487 6,155 6,416 6,426 6,512<br />
North Dakota 67 67 65 68 69 65 78 82 144 244<br />
Ohio 21,958 20,976 20,048 21,400 22,082 21,917 22,096 21,689 21,573 22,268<br />
Oklahoma 13,611 14,318 15,054 16,118 17,462 18,785 20,134 21,455 23,151 24,955<br />
Oregon 12 12 12 10 9 9 10 11 11 10<br />
South Dakota 55 54 54 56 58 57 57 59 60 62<br />
Texas 33,799 34,688 35,811 36,844 39,069 40,295 42,002 44,656 47,307 50,964<br />
Utah 745 854 976 1,055 1,270 1,459 1,648 1,804 2,107 2,386<br />
West Virg<strong>in</strong>ia 37,601 39,699 38,724 29,366 38,704 40,053 38,844 40,452 43,242 40,544<br />
Wyom<strong>in</strong>g 1,706 1,959 2,807 4,671 7,160 9,587 11,139 13,474 15,513 18,043<br />
Federal Offshore 661 668 687 739 771 818 809 796 890 723<br />
TOTAL U.S.* 170,519 175,184 181,877 180,615 195,123 203,692 212,711 226,561 243,465 262,168<br />
Source: IHS.<br />
Notes: A marg<strong>in</strong>al natural gas well is def<strong>in</strong>ed as a well produc<strong>in</strong>g 90 thousand cubic feet per day or less.<br />
*Row may not total because it <strong>in</strong>cludes Pacific Coastal wells.<br />
PRODUCING MARGINAL NATURAL GAS WELLS<br />
COMPILED BY <strong>IPAA</strong> FEBRUARY 2009 AMERICA’S INDEPENDENT 105
MARGINAL NATURAL GAS PRODUCTION<br />
(Mmcf)<br />
1997 1998 1999 2000 2001 2002 2003 2004 2005 2006<br />
Alabama 26,995 28,068 30,121 33,921 37,297 39,807 44,565 47,877 53,488 60,255<br />
Arizona 37 4 35 25 4 60 37 28 30 26<br />
Arkansas 23,251 24,862 25,602 28,215 28,948 30,432 32,364 33,641 36,326 38,001<br />
California 9,158 7,406 7,896 7,831 8,547 8,441 8,642 8,986 9,566 10,121<br />
Colorado 103,071 100,311 126,128 129,869 141,830 153,960 172,625 195,674 219,087 243,647<br />
Kansas 99,001 111,463 118,887 129,410 146,535 158,854 178,136 201,997 222,426 240,025<br />
Kentucky 62,931 66,065 67,591 69,400 71,156 74,072 75,513 78,805 73,076 78,304<br />
Louisiana 39,208 40,645 39,732 40,557 38,425 38,934 39,254 40,083 43,650 47,268<br />
Michigan 7,392 8,467 8,766 9,283 10,538 11,686 12,851 13,559 14,376 15,088<br />
Mississippi 3,965 4,112 4,282 5,837 7,077 8,684 11,210 12,783 13,015 14,679<br />
Montana 26,496 27,769 28,823 30,391 32,251 35,138 37,128 37,963 40,661 43,617<br />
Nebraska 1,078 1,040 908 744 743 755 793 784 700 774<br />
New Mexico 167,044 167,586 173,320 181,395 189,490 198,823 210,356 229,209 247,151 261,711<br />
New York 14,494 13,726 12,800 12,181 12,340 10,976 11,002 10,874 10,842 10,828<br />
North Dakota 367 451 432 430 429 478 663 731 1,376 2,670<br />
Ohio 64,888 61,082 54,295 56,226 57,397 57,026 55,378 53,812 50,307 52,003<br />
Oklahoma 178,628 186,744 195,208 211,217 225,276 239,475 256,811 269,245 286,833 303,692<br />
Oregon 123 68 125 154 79 112 113 117 138 158<br />
South Dakota 581 668 600 523 538 473 483 466 428 438<br />
Texas 387,382 400,261 410,614 421,242 445,495 456,406 479,643 509,051 538,896 583,968<br />
Utah 11,302 12,728 14,089 15,922 19,724 21,985 25,297 27,683 30,898 35,126<br />
West Virg<strong>in</strong>ia 143,483 151,707 159,474 126,932 157,127 162,879 152,036 161,214 175,204 167,499<br />
Wyom<strong>in</strong>g 23,7111 27,805 36,222 56,571 87,966 110,593 136,750 158,345 174,046 187,793<br />
MARGINAL NATURAL GAS PRODUCTION<br />
Federal Offshore 7,630 7,710 8,277 9,158 10,033 10,078 9,897 9,722 11,030 8,802<br />
TOTAL U.S.* 1,394,886 1,443,215 1,516,247 1,568,617 1,719,644 1,820,473 1,942,122 2,093,201 2,253,603 2,459,875<br />
Source: IHS.<br />
Notes: Totals may not add due to round<strong>in</strong>g.<br />
*Row may not total because it <strong>in</strong>cludes Pacific Coastal wells.<br />
106 AMERICA’S INDEPENDENT COMPILED BY <strong>IPAA</strong> FEBRUARY 2009
COST OF DRILLING AND EQUIPPING WELLS ’06<br />
<strong>State</strong> No. of Wells Drilled Footage Drilled <strong>Depth</strong> per Well Total Cost Cost per Well Cost per Foot<br />
(ft.) ($)<br />
Alabama 440 1,523,127 3,462 386,886,000 879,286 254.01<br />
Alaska 132 970,519 7,352 3,199,617,000 24,239,523 3,296.81<br />
Arizona 1 7,000 7,000 1,022,000 1,022,000 146<br />
Arkansas 495 2,881,767 5,822 589,554,000 1,191,018 204.58<br />
California 2,494 6,699,771 2,686 2,843,060,000 1,139,960 424.35<br />
Colorado 3,003 17,258,154 5,747 6,305,991,000 2,099,897 365.39<br />
Florida - - - - - -<br />
Ill<strong>in</strong>ois 478 1,096,943 2,295 216,939,000 453,847 197.77<br />
Indiana 117 196,156 1,677 47,271,000 404,026 240.99<br />
Kansas 3,161 9,382,145 2,968 930,897,000 294,494 99.22<br />
Kentucky 1,294 3,581,272 2,768 417,329,000 322,511 116.53<br />
Louisiana 1,633 14,384,545 8,809 6,976,491,000 4,272,193 485<br />
Michigan 558 1,037,470 1,859 492,154,000 881,996 474.38<br />
Mississippi 293 2,134,313 7,284 902,948,000 3,081,734 423.06<br />
Montana 1,118 5,209,601 4,660 1,850,978,000 1,655,615 355.30<br />
Nebraska 65 280,649 4,318 37,652,000 579,262 134.16<br />
Nevada 1 7,400 7,400 1,080,000 1,080,000 145.95<br />
New Mexico 2,028 12,078,134 5,956 2,550,918,000 1,257,849 211.20<br />
New York 242 650,480 2,688 95,149,000 393,178 146.28<br />
North Dakota 487 4,288,452 8,806 1,500,504,000 3,081,117 349.89<br />
Ohio 684 2,638,475 3,857 233,586,000 341,500 88.53<br />
Oklahoma 3,995 25,489,808 6,380 6,917,851,000 1,731,627 271.40<br />
Pennsylvania 4,260 14,671,156 3,444 1,391,908,000 326,739 94.87<br />
South Dakota 25 125,342 5,014 48,548,000 1,941,920 387.32<br />
Tennessee 285 827,354 2,903 96,662,000 339,165 116.83<br />
Texas 13,409 105,721,057 7,884 34,569,181,000 2,578,058 326.98<br />
Utah 1,005 7,604,400 7,567 2,879,064,000 2,864,740 378.61<br />
Virg<strong>in</strong>ia 545 1,503,189 2,758 172,254,000 316,062 114.59<br />
Wash<strong>in</strong>gton - - - - - -<br />
West Virg<strong>in</strong>ia 1,791 7,393,289 4,128 643,971,000 359,559 87.10<br />
Wyom<strong>in</strong>g 4,134 17,220,244 4,166 9,187,238,000 2,222,360 533.51<br />
Federal Offshore 638 6,920,312 10,847 24,246,180,000 38,003,417 3,503.59<br />
TOTAL U.S. 48,811 273,782,524 5,609 109,733,000,000 2,248,118 400.80<br />
Exploratory 4,523 27,270,664 6,135 14,584,389,220 3,224,495 525.55<br />
Developmental 44,288 246,031,860 5,555 95,148,494,925 2,148,404 386.73<br />
Source: IHS<br />
COST OF DRILLING AND EQUIPPING WELLS ’06<br />
COMPILED BY <strong>IPAA</strong> FEBRUARY 2009 AMERICA’S INDEPENDENT 107
CRUDE OIL REVENUES<br />
(thous. $.)<br />
1997 1998 1999 2000 2001 2002 2003 2004 2005 2006<br />
Alabama 163,262 90,032 107,044 165,310 125,520 120,763 143,981 180,839 418,677 475,657<br />
Alaska 7,018,682 3,635,595 4,828,307 8,438,340 6,449,401 7,020,957 8,664,291 11,136,496 14,890,978 15,425,817<br />
Arizona 1,440 865 996 1,470 1,266 1,319 1,198 1,843 2,605 3,383<br />
Arkansas 138,495 78,732 98,311 174,129 149,969 139,105 174,990 214,336 322,656 358,121<br />
California 4498,042 2,714,416 3,803,250 6,699,787 5,210,900 5,532,628 6,506,436 8,221,520 11,113,988 12,240,536<br />
Colorado 342,350 209,350 242,676 400,553 327,847 322,979 380,589 485,125 1,263,025 1,492,282<br />
Florida 122,986 60,746 85,540 134,281 NA NA NA NA NA NA<br />
Ill<strong>in</strong>ois 258,253 163,673 195,829 306,895 242,304 265,268 340,674 414,479 522,598 616,283<br />
Indiana 44,933 27,216 33,962 56,797 48,633 46,134 53,071 66,013 81,112 102,665<br />
Kansas 767,761 446,690 582,155 964,142 800,027 780,452 966,831 1,324,362 1,806,486 2,165,442<br />
Kentucky 28,518 16,011 24,336 40,896 33,570 31,059 36,652 44,552 125,356 136,492<br />
Louisiana 1,820,019 1,140,730 1,411,826 2,188,561 1,734,529 1,496,250 1,777,924 2,283,879 4,079,856 4,745,055<br />
Michigan 119,906 91,190 113,849 210,956 160,418 155,885 181,791 225,564 297,815 310,112<br />
Mississippi 332,837 202,675 252,718 486,934 381,185 371,028 430,518 578,964 877,318 1,030,078<br />
Missouri 2,124 1,068 1,436 2,695 1,833 2,045 2,169 3,269 4,239 4,988<br />
Montana 276,318 188,241 253,823 437,303 374,544 385,554 553,396 950,689 1,730,144 2,055,692<br />
Nebraska 60,002 36,409 45,882 82,595 49,865 64,861 80,450 96,818 126,393 133,622<br />
Nevada 14,610 9,005 9,792 14,084 13,544 9,904 12,074 14,807 19,078 NA<br />
New Mexico 1,291,953 785,985 1,041,786 1,775,779 1,387,381 1,405,444 1,682,758 2,226,378 3,205,274 3,693,163<br />
New York* NA NA NA NA NA NA 2,718 4,334 10,764 20,259<br />
North Dakota* 622,938 399,459 540,412 903,264 691,225 721,505 831,649 1,184,581 1,867,871 2,262,554<br />
Ohio* 103,812 62,989 74,879 135,663 136,530 111,173 127,402 163,183 302,212 340,989<br />
Oklahoma 1,447,610 916,458 1,160,328 1,830,004 1,520,175 1,433,718 1,687,204 2,193,215 3,390,468 3,965,895<br />
Oregon 0 2 6 0 0 0 0 0 0 0<br />
Pennsylvania 24,803 27,039 27,180 43,200 40,208 55,512 71,780 100,200 215,388 232,136<br />
South Dakota* 23,763 14,846 18,546 32,745 27,362 28,968 35,857 52,070 74,405 72,278<br />
Tennessee 6,334 3,226 5,496 9,093 7,708 6,020 8,260 13,162 14,765 10,955<br />
Texas 9,159,466 5,639,651 7,075,579 11,466,598 8,917,876 8,697,229 10,484,091 13,633,095 20,395,845 24,353,558<br />
Utah 317,268 213,366 257,566 403,871 335,164 301,001 349,130 539,803 898,821 1,069,227<br />
Virg<strong>in</strong>ia NA NA NA NA NA NA NA NA NA NA<br />
West Virg<strong>in</strong>ia 12,134 7,493 8,773 14,591 15,779 12,876 21,550 22,491 84,011 110,309<br />
Wyom<strong>in</strong>g 1,119,097 630,155 871,279 1,424,820 1,055,153 1,010,599 1,149,724 1,463,284 2,355,694 2,817,138<br />
TOTAL U.S. 37,090,452 22,503,389 30,396,833 51,533,501 40,822,345 42,074,679 51,219,295 65,667,175 95,034,530 111,158,239<br />
CRUDE OIL REVENUES<br />
Source: EIA price and production data used <strong>in</strong> addition to state data when EIA not available. Total does not <strong>in</strong>clude Federal Offshore.<br />
108 AMERICA’S INDEPENDENT COMPILED BY <strong>IPAA</strong> FEBRUARY 2009
NATURAL GAS REVENUES<br />
(thous. $.)<br />
1997 1998 1999 2000 2001 2002 2003 2004 2005 2006<br />
Alabama 1,140,106 946,128 963,825 1,583,132 1,615,145 1,291,000 2,109,307 2,160,750 2,751,780 2,166,685<br />
Alaska** 852,326 615,975 634,265 807,831 938,166 986,831 1,180,314 1,613,895 2,314,590 2,574,952<br />
Arizona 953 760 693 984 985 614 792 1,116 1,596 3,593<br />
Arkansas 669,073 596,522 600,269 779,715 746,813 655,184 792,230 966,861 1,383,270 1,242,649<br />
California 183,652 154,818 213,689 415,329 621,954 228,569 421,823 425,795 2,336,396 2,039,402<br />
Colorado 1,374,568 1,279,289 1,539,967 2,784,939 3,084,399 2,198,616 4,526,766 5,535,083 8,418,829 7,361,265<br />
Florida NA NA NA NA NA NA NA NA NA NA<br />
Ill<strong>in</strong>ois NA NA NA NA NA NA NA NA NA NA<br />
Indiana 1,147 1,285 1,872 3,155 3,490 4,071 7,920 21,426 28,560 17,555<br />
Kansas 1,415,736 1,041,128 1,033,286 1,695,865 1,795,907 1,212,449 1,866,875 2,003,634 2,455761 2,081,557<br />
Kentucky 1,886,145 174,348 155,449 240,391 368,208 244,845 378,872 450,614 634,718 841,676<br />
Louisiana 3,418,979 2,803,621 2,910,020 4,867,959 5,470,573 4,037,907 7,061,991 7,547,088 11,301,539 9,432,555<br />
Maryland 263 164 49 128 133 132 216 213 342 366<br />
Michigan 536,239 437,445 402,686 524,693 704,542 415,761 714,109 654,589 1,383,894 NA<br />
Mississippi 206,970 170,065 195,970 365,868 520,725 437,427 809,755 992,015 451,962 414,032<br />
Missouri 9 NA NA NA NA NA NA NA NA NA<br />
Montana 77,250 79,721 92,731 183,862 232,178 189,372 291,283 392,577 709,021 624,033<br />
Nebraska 1,704 1,572 1,389 1,946 1,881 1,359 3,750 3,919 4,922 NA<br />
New Mexico 2,380,069 2,465,737 3,068,358 5,014,653 5,702,818 3,785,897 6,272,750 6,821,723 11,368,097 9,944,998<br />
New York* 43,064 43,607 37,040 69,285 150,905 109,844 206,491 319,579 429,300 399,137<br />
North Dakota 34,610 34,471 31,858 50,810 52,046 39,544 45,265 76,375 441,479 360,380<br />
Ohio* 233,088 258,966 180,819 300,948 327,902 318,326 403,725 442,637 754,213 668,941<br />
Oklahoma 3,421,065 2,508,155 2,857,097 5,202,941 5,836,391 4,105,531 7,022,237 7,986,767 11,819,425 10,674,385<br />
Oregon 3,024 3,006 3,919 4,293 4,081 3,335 3,288 1,821 1,930 2,745<br />
Pennsylvania 253,600 387,041 539,826 346,500 446,209 538,098 NA NA NA NA<br />
South Dakota 1,440 1,877 1,459 2,129 1,840 1,505 2,605 2,794 7,380 6,163<br />
Tennessee 4,310 3,247 3,238 5,031 4,140 6,820 10,701 12,441 21,010 12,157<br />
Texas 11,951,566 9,999,263 10,893,020 19,138,224 20,354,518 15,441,833 25,703,450 29,573,835 39,836,828 36,390,677<br />
Utah 429,474 439,334 462,281 803,564 932,913 518,821 1,058,366 1,387,494 2,156,757 1,983,828<br />
Virg<strong>in</strong>ia* 148,535 126,401 179,756 284,034 329,961 256,232 398,975 NA NA NA<br />
West Virg<strong>in</strong>ia 443,468 408,379 653,509 524,686 786,088 668,488 794,615 918,846 1,563,234 1,617,050<br />
Wyom<strong>in</strong>g 242,569 1,861,129 2,202,612 4,231,396 4,852,332 4,156,132 6,760,409 8,607,634 11,245,715 10,624,776<br />
TOTAL U.S. 31,420,431 26,852,256 29,876,317 50,246,100 55,887,242 41,854,540 68,848,881 94,941,068 138,735,606 124,044,128<br />
Source: EIA price and production data used <strong>in</strong> addition to state data when EIA not available. Total does not <strong>in</strong>clude Federal Offshore.<br />
Alaska natural gas is re<strong>in</strong>jected.<br />
NATURAL GAS REVENUES<br />
COMPILED BY <strong>IPAA</strong> FEBRUARY 2009 AMERICA’S INDEPENDENT 109
ABANDONMENTS<br />
Alabama 8 2 6 6 3 3 34 29 6 78<br />
Arizona 0 0 0 0 0 0 0 0 0 0<br />
Arkansas 138 97 77 116 43 42 108 69 51 73<br />
California 1,919 1,392 1,046 1,615 1,469 2,452 2,501 1,629 1,558 1,999<br />
Colorado 321 153 120 124 168 119 259 212 147 282<br />
Ill<strong>in</strong>ois 518 802 590 647 689 710 659 554 547 853<br />
Indiana 129 133 58 72 93 125 102 80 65 159<br />
Kansas 1,765 1,480 2,025 614 1,614 1,722 2,270 1,473 1,225 1,318<br />
Kentucky 166 233 179 232 202 237 312 263 206 503<br />
Louisiana 785 750 620 605 760 731 1,500 898 584 750<br />
Michigan 153 146 139 139 141 155 177 196 126 87<br />
Mississippi 74 58 83 91 62 109 106 90 55 34<br />
Missouri 251 2 4 12 1 4 12 4 4 11<br />
Montana 45 124 136 178 135 65 169 113 58 227<br />
Nebraska 66 90 66 67 83 100 81 55 54 15<br />
New Mexico 397 206 105 121 203 217 263 752 449 420<br />
New York 79 58 57 36 36 65 115 83 78 19<br />
North Dakota 51 37 26 35 48 38 40 50 44 71<br />
Ohio 335 243 183 211 216 183 500 572 201 577<br />
Oklahoma 1,871 1,442 841 922 710 774 1,056 956 619 1,090<br />
Pennsylvania 640 968 590 300 200 210 328 306 134 100<br />
South Dakota 1 7 2 0 0 2 2 0 0 0<br />
Tennessee 81 77 70 76 45 38 86 50 29 34<br />
Texas 5,246 5,110 4,078 4,255 5,126 5,228 6,902 6,718 5,461 6,417<br />
Utah 20 30 36 16 30 16 17 57 35 65<br />
Virg<strong>in</strong>ia 0 0 0 0 0 0 60 45 0 98<br />
West Virg<strong>in</strong>ia 100 84 80 78 50 46 327 335 30 285<br />
Wyom<strong>in</strong>g 14 188 10 120 107 228 241 517 211 635<br />
TOTAL U.S. 15,173 13,912 11,227 10,688 12,234 13,619 18,219 16,106 11,977 16,201<br />
Source: IOGCC.<br />
1997 1998 1999 2000 2001 2002 2003 2004 2005 2006<br />
Note: <strong>Oil</strong> and gas wells plugged and abandoned as of January 1, 2007. Estimated data for Colorado, Ill<strong>in</strong>ois, Pennsylvania,Tennessee<br />
and West Virg<strong>in</strong>ia.<br />
ABANDONMENTS<br />
110 AMERICA’S INDEPENDENT COMPILED BY <strong>IPAA</strong> FEBRUARY 2009
SEVERANCE AND PRODUCTION TAXES<br />
( thous. $)<br />
1997 1998 1999 2000 2001 2002 2003 2004 2005 2006<br />
Alabama 67,526 55,078 37,899 68,341 107,024 53,235 92,695 101,184 132,299 177,280<br />
Alaska 788,409 395,500 507,000 759,000 558,772 519,368 1,093,356 750,425 1,060,066 1,061,672<br />
Arizona 5,952 6,398 6,060 7,026 6,510 8,377 8,377 9,899 10,022 7,979<br />
Arkansas 6,872 4,371 4,616 9,476 9,546 6,608 8,355 9,802 15,078 15,078<br />
California 174,044 157,652 194,606 215,696 239,921 189,306 214,473 188,753 268,796 328,876<br />
Colorado 18,688 19,756 23,327 24,641 54,384 48,914 23,613 107,145 134,050 196,668<br />
Florida 10,441 7,318 4,157 6,046 8,258 5,197 5,469 6,084 8,278 9,527<br />
Indiana 599 550 502 653 572 567 590 845 1,119 1,215<br />
Kansas 78,531 51,686 120,333 56,900 109,232 59,895 84,212 116,677 148,855 148,855<br />
Kentucky 12,653 11,212 8,452 11,414 20,678 14,610 17,800 22,170 28,630 42,586<br />
Louisiana 380,699 336,293 240,055 354,314 478,805 454,429 480,749 677,320 714,729 885,402<br />
Maryland 2 1 1 1 2 1 1 1 3 3<br />
Michigan 40,961 30,982 30,570 40,012 61,279 35,967 54,651 56,186 66,749 88,143<br />
Mississippi 28,343 25,346 14,518 23,751 11,817 28,201 43,413 62,631 84,409 6,809<br />
Montana 42,482 35,065 28,997 43,770 92,818 50,304 75,454 114,218 180,077 204,129<br />
Nebraska 1,915 1,334 1,017 2,108 1,868 1,455 1,845 2,191 2,926 2,796<br />
Nevada 283 74 50 62 62 56 248 45 43 41<br />
New Mexico 372,600 375,800 227,200 345,300 355,370 479,109 571,862 737,200 926,884 1,169,270<br />
North Dakota 53,500 39,200 35,402 71,275 66,800 62,300 66,846 73,914 157,500 166,146<br />
Ohio 3,655 3,383 3,327 3,090 2,884 2,799 2,900 2,691 2,615 2,554<br />
Oklahoma 413,576 360,285 253,039 410,412 745,236 417,103 600,980 701,156 875,653 1,168,597<br />
Oregon 156 93 98 146 119 145 89 72 78 89<br />
South Dakota 1,178 1,018 730 1,051 1,566 1,239 1,522 1,658 2,507 3,255<br />
Tennessee 282 213 363 532 380 498 592 592 813 1,041<br />
Texas 1,091,284 926,561 659,396 1,153,086 1,956,108 1,049,054 1,492,743 1,887,879 2,338,380 3,200,806<br />
Utah 17,217 13,988 11,109 17,313 42,106 20,603 28,689 39,356 57,116 77,074<br />
West Virg<strong>in</strong>ia 17,431 16,118 19,161 18,048 34,549 28,382 30,475 41,544 53,557 84,947<br />
Wyom<strong>in</strong>g 152,448 73,754 125,178 567,445 581,532 327,497 370,381 504,731 713,456 660,461<br />
TOTAL U.S. 3,781,727 2,949,029 2,557,163 4,210,909 5,548,198 3,863,352 5,372,380 6,216,369 7,984,690 9,711,306<br />
Source: Various state and <strong>in</strong>dustry contacts.<br />
Notes: Figures <strong>in</strong>clude all state and local tax revenues. <strong>State</strong>s vary on the use of fi scal (Arizona) or calendar year data. West Virg<strong>in</strong>ia data switched<br />
to FY <strong>in</strong> 2001.<br />
SEVERANCE AND PRODUCTION TAXES<br />
COMPILED BY <strong>IPAA</strong> FEBRUARY 2009 AMERICA’S INDEPENDENT 111
CRUDE OIL WELLHEAD PRICES<br />
($/Bbl.)<br />
1997 1998 1999 2000 2001 2002 2003 2004 2005 2006<br />
Alabama 18.58 12.08 16.71 27.63 23.18 23.39 28.97 38.79 53.26 63.16<br />
Alaska 14.84 8.47 12.60 23.76 18.35 19.53 23.91 33.17 47.21 64.10<br />
Arizona* 18.23 11.69 16.06 26.72 21.82 21.63 26.63 36.86 52.09 61.51<br />
Arkansas 17.58 11.10 15.89 26.98 21.82 21.50 26.57 36.67 50.86 58.67<br />
California 15.78 9.55 13.92 24.72 20.00 21.68 26.30 34.33 47.08 57.34<br />
Colorado 19.03 12.56 17.37 28.85 24.82 25.29 30.71 40.38 55.34 63.80<br />
Florida 19.64 10.23 17.50 29.04 NA NA NA NA NA NA<br />
Ill<strong>in</strong>ois 19.11 12.78 17.37 28.14 23.76 23.84 29.10 38.74 51.20 59.70<br />
Indiana 18.73 12.49 17.31 27.91 23.46 23.43 28.38 38.18 51.02 59.31<br />
Kansas 18.63 12.19 17.08 28.16 23.56 23.61 28.68 39.18 53.41 60.74<br />
Kentucky 17.97 11.67 16.68 26.47 22.53 22.49 27.21 36.82 49.45 58.33<br />
Louisiana 19.22 12.59 17.59 28.85 24.36 24.68 30.31 40.08 54.05 64.23<br />
Michigan 18.75 12.39 16.63 28.12 22.69 23.68 29.18 39.14 53.67 60.89<br />
Mississippi 16.94 10.33 15.42 26.23 21.13 22.11 27.46 37.03 49.58 59.35<br />
Missouri* 18.63 11.48 15.61 28.37 20.37 21.53 26.45 37.15 49.87 57.34<br />
Montana 17.00 11.28 16.54 27.82 23.16 22.76 28.66 38.53 52.66 56.69<br />
Nebraska 18.10 11.50 17.21 27.97 23.67 23.62 28.63 38.42 52.38 57.77<br />
Nevada* 15.00 11.27 13.87 22.68 17.13 17.91 24.54 31.98 42.68 58.30<br />
New Mexico 19.02 12.36 17.46 28.80 23.72 24.11 29.52 39.25 52.84 61.74<br />
New York* 18.49 11.46 16.18 28.60 22.76 24.92 28.91 39.40 54.64 63.51<br />
North Dakota 17.63 11.39 16.70 28.19 23.55 24.15 29.27 39.30 52.38 56.69<br />
Ohio 17.77 12.20 16.41 27.49 22.55 22.61 28.18 38.27 53.47 62.89<br />
Oklahoma 19.05 12.73 17.77 29.08 24.68 24.49 29.72 39.95 54.46 63.11<br />
Pennsylvania 18.79 13.67 18.49 28.80 24.82 24.86 29.60 39.48 54.47 64.02<br />
South Dakota 17.80 12.29 16.86 28.18 23.89 23.96 28.94 38.40 50.65 51.85<br />
Tennessee* 17.26 11.24 15.93 26.28 21.96 21.89 26.56 36.46 45.57 57.06<br />
Texas 18.66 12.28 17.30 28.60 23.41 23.77 29.13 38.79 52.61 61.31<br />
Utah 18.57 12.52 17.69 28.53 24.09 23.87 28.88 39.35 53.98 59.70<br />
Virg<strong>in</strong>ia* 16.40 11.64 16.88 NA NA NA 26.23 NA NA NA<br />
West Virg<strong>in</strong>ia 17.56 11.95 16.46 27.12 22.35 22.55 28.06 38.38 53.75 63.07<br />
Wyom<strong>in</strong>g 17.41 10.70 16.47 26.89 21.55 21.96 26.63 35.10 45.63 53.25<br />
CRUDE OIL WELLHEAD PRICES<br />
TOTAL U.S. 17.23 10.87 15.56 26.72 21.84 22.51 27.56 36.77 50.28 59.69<br />
Source: <strong>Energy</strong> Information Adm<strong>in</strong>istration and <strong>State</strong> Sources*<br />
Notes: Data represent average first purchase price of crude oil at the lease or wellhead.<br />
112 AMERICA’S INDEPENDENT COMPILED BY <strong>IPAA</strong> FEBRUARY 2009
NATURAL GAS WELLHEAD PRICES<br />
($/Mcf)<br />
1997 1998 1999 2000 2001 2002 2003 2004 2005 2006<br />
Alabama 2.67 2.21 2.32 3.99 4.23 3.48 5.93 6.66 9.28 7.57<br />
Alaska 1.82 1.32 1.37 1.76 1.99 2.13 2.41 3.42 4.75 5.79<br />
Arizona* 2.40 1.88 2.08 3.50 4.12 2.60 4.33 5.12 6.85 5.70<br />
Arkansas 4.03 3.92 4.10 5.23 4.99 4.43 5.17 5.68 7.26 6.43<br />
California 2.41 1.97 2.36 4.81 6.93 2.92 5.04 5.65 7.45 6.47<br />
Colorado 2.23 1.90 2.18 3.67 3.84 2.41 4.54 5.21 7.43 6.12<br />
Florida* 1.06 1.42 2.50 1.76 NA NA NA NA NA NA<br />
Ill<strong>in</strong>ois* 2.81 2.74 2.74 2.05 NA NA NA NA NA NA<br />
Indiana 2.18 2.09 2.19 3.51 3.28 3.11 5.41 6.30 9.11 6.01<br />
Kansas 2.05 1.70 1.80 3.21 3.66 2.61 4.33 4.94 6.51 5.61<br />
Kentucky 2.66 2.39 2.07 3.16 4.78 3.01 4.54 5.26 6.84 8.83<br />
Louisiana 2.36 2.02 2.22 3.68 3.99 3.20 5.64 5.96 8.72 6.93<br />
Maryland 2.23 2.60 2.73 3.75 4.15 5.98 4.50 6.25 7.43 7.63<br />
Michigan 2.19 1.77 1.77 2.44 3.47 2.16 4.01 3.85 5.30 NA<br />
Mississippi 1.73 1.42 1.63 3.30 3.93 3.06 5.13 5.83 8.54 6,84<br />
Missouri 1.70 1.62 NA NA NA NA NA NA NA NA<br />
Montana 1.59 1.53 1.68 2.84 3.12 2.39 3.73 4.51 6.57 5.53<br />
Nebraska 1.53 1.30 1.36 2.26 2.16 1.52 3.17 3.22 4.29 NA<br />
New Mexico 1.76 1.76 2.11 3.43 3.89 2.68 4.56 4.97 6.91 6.18<br />
New York 2.56 2.56 2.16 3.75 5.00 3.03 5.78 6.98 7.78 7.13<br />
North Dakota 2.16 2.14 2.32 3.94 3.53 2.73 3.53 5.73 8.40 6.52<br />
Ohio 2.70 2.95 2.43 4.06 4.54 4.52 5.90 6.65 9.03 7.75<br />
Oklahoma 2.32 1.77 2.05 3.63 4.03 2.94 4.97 5.52 7.21 6.32<br />
Oregon 2.19 2.38 2.52 2.69 3.66 3.97 4.48 3.89 4.25 4.42<br />
Pennsylvania* 3.17 2.97 3.09 2.31 3.41 3.41 NA NA NA NA<br />
South Dakota 2.09 2.47 2.13 3.56 3.42 2.95 4.98 5.49 7.44 6.40<br />
Tennessee 2.55 2.15 2.28 4.09 3.60 3.41 5.22 6.90 9.55 6.78<br />
Texas 2.48 2.06 2.31 3.93 4.12 3.16 5.18 5.83 7.55 6.60<br />
Utah 1.86 1.73 1.93 3.28 3.52 1.99 4.11 5.24 7.16 5.70<br />
Virg<strong>in</strong>ia* 2.55 2.16 2.49 3.97 4.29 3.16 4.65 NA NA NA<br />
West Virg<strong>in</strong>ia* 2.63 2.37 2.99 3.24 4.12 3.44 4.34 4.71 7.07 NA<br />
Wyom<strong>in</strong>g 2.42 1.78 1.97 3.34 3.49 2.70 4.13 4.96 6.86 5.85<br />
TOTAL U.S. 2.32 1.96 2.19 3.68 4.00 2.95 4.88 5.46 7.33 6.40<br />
Source: <strong>Energy</strong> Information Adm<strong>in</strong>istration and <strong>State</strong> Sources*<br />
NATURAL GAS WELLHEAD PRICES<br />
COMPILED BY <strong>IPAA</strong> FEBRUARY 2009 AMERICA’S INDEPENDENT 113
REFINER ACQUISITION<br />
COST OF CRUDE OIL<br />
RETAIL GASOLINE PRICES<br />
($/Bbl.)<br />
Domestic Imported Composite<br />
(¢/gal.)<br />
Exclud<strong>in</strong>g Taxes Pump<br />
Taxes<br />
Price<br />
REFINER ACQUISITION COST OF CRUDE OIL<br />
1980 24.23 33.89 28.07<br />
1981 34.33 37.05 35.24<br />
1982 31.22 33.55 31.87<br />
1983 28.87 29.30 28.99<br />
1984 28.53 28.88 28.63<br />
1985 26.66 26.99 26.75<br />
1986 14.82 14.00 14.55<br />
1987 17.76 18.13 17.90<br />
1988 14.74 14.56 14.67<br />
1989 17.87 18.08 17.97<br />
1990 22.59 21.76 22.22<br />
1991 19.33 18.70 19.06<br />
1992 18.63 18.20 18.43<br />
1993 16.67 16.14 16.41<br />
1994 15.67 15.51 15.59<br />
1995 17.33 17.14 17.23<br />
1996 20.77 20.64 20.71<br />
1997 19.61 18.53 19.04<br />
1998 13.18 12.04 12.52<br />
1999 17.90 17.26 17.51<br />
2000 29.11 27.70 28.26<br />
2001 24.33 22.00 22.95<br />
2002 24.65 23.71 24.10<br />
2003 29.82 27.71 28.53<br />
2004 38.97 35.90 36.98<br />
2005 52.94 48.86 50.24<br />
2006 62.62 59.02 60.24<br />
Source: <strong>Energy</strong> Information Adm<strong>in</strong>istration<br />
1983 95.4 28.7 124.1<br />
1984 90.7 30.5 121.2<br />
1985 91.2 29.0 120.2<br />
1986 62.4 30.3 92.7<br />
1987 66.9 27.9 94.8<br />
1988 67.3 27.3 94.6<br />
1989 75.6 26.5 102.1<br />
1990 88.3 28.1 116.4<br />
1991 79.7 34.3 114.0<br />
1992 78.7 34.0 112.7<br />
1993 75.9 34.9 110.8<br />
1994 73.8 37.4 111.2<br />
1995 76.5 38.2 114.7<br />
1996 84.7 38.4 123.1<br />
1997 83.9 39.5 123.4<br />
1998 67.3 38.6 105.9<br />
1999 78.1 38.4 116.5<br />
2000 110.6 40.4 151.0<br />
2001 103.2 42.9 146.1<br />
2002 94.7 41.1 135.8<br />
2003 115.6 43.5 159.1<br />
2004 143.5 44.5 188.0<br />
2005 182.9 46.6 229.5<br />
2006 212.8 43.1 255.9<br />
Source: <strong>Energy</strong> Information Adm<strong>in</strong>istration.<br />
Pump price quoted for unleaded regular.<br />
WORLD CRUDE OIL RESERVES<br />
WORLD CRUDE OIL RESERVES<br />
(mill. bbls.)<br />
United<br />
<strong>State</strong>s<br />
Canada Lat<strong>in</strong><br />
America<br />
Middle<br />
East<br />
Africa Asia Western Eastern<br />
Pacific Europe Europe & FSU<br />
Total<br />
World<br />
1990 26,501 5,783 121,091 662,598 59,892 50,242 14,476 58,855 999,113<br />
1991 26,254 5,588 119,765 661,571 60,488 44,073 14,503 58,774 991,011<br />
1992 24,682 5,292 123,811 661,791 61,872 44,572 15,829 59,193 997,042<br />
1993 23,745 5,096 124,996 662,866 61,963 44,647 16,643 59,168 999,124<br />
1994 22,957 5,096 129,073 660,295 62,177 44,453 16,572 59,196 999,319<br />
1995 22,457 4,898 128,695 659,555 73,154 43,953 15,573 59,188 1,007,475<br />
1996 22,351 4,893 127,943 676,352 67,555 42,299 18,361 59,093 1,018,849<br />
1997 22,017 4,839 126,115 676,952 70,062 42,275 18,128 59,101 1,019,545<br />
1998 22,546 4,931 136,867 673,647 75,442 43,013 18,719 59,053 1,034,265<br />
1999 21,034 4,931 117,931 675,636 74,890 43,985 18,611 59,024 1,016,041<br />
2000 21,765 4,706 122,809 683,516 74,889 43,957 17,185 59,024 1,027,852<br />
2001 22,045 4,858 122,912 685,592 76,677 43,779 17,135 58,555 1,031,553<br />
2002 22,446 180,021 111,173 685,642 77,429 38,712 18,098 79,360 1,212,881<br />
2003 22,677 178,893 114,522 726,842 87,043 38,258 18,233 79,343 1,265,812<br />
2004 21,891 178,800 115,195 729,341 100,784 36,246 16,102 79,343 1,277,702<br />
2005 21,371 178,792 116,246 743,411 102,580 35,936 14,842 79,370 1,292,550<br />
2006 21,757 179,210 115,160 739,205 114,073 33,366 14,965 99,992 1,317,447<br />
Source: <strong>Oil</strong> & <strong>Gas</strong> Journal. Estimated proved reserves as of 1/1 of stated year. Totals may not add due to round<strong>in</strong>g. Canadian reserves <strong>in</strong>clude oil<br />
sands after 2001.<br />
114 AMERICA’S INDEPENDENT COMPILED BY <strong>IPAA</strong> FEBRUARY 2009
WHOLESALE PRICES—TOTAL U.S.<br />
Year Motor <strong>Gas</strong>ol<strong>in</strong>e Kerosene Fuel <strong>Oil</strong> Average Crude <strong>Oil</strong><br />
Distillate Residual Of Four Products<br />
(¢/gal.)<br />
($/bbl.)<br />
1951 11.40 9.85 8.50 4.42 8.79 3.69 2.53<br />
1952 11.38 9.90 8.52 3.84 8.62 3.62 2.53<br />
1953 12.01 10.23 8.83 3.73 8.96 3.76 2.68<br />
1954 11.66 10.40 8.94 3.97 8.88 3.73 2.78<br />
1955 11.62 10.53 9.08 4.53 9.06 3.81 2.77<br />
1956 11.75 10.99 9.45 5.30 9.43 3.96 2.79<br />
1957 12.34 11.54 10.05 6.15 10.10 4.24 3.09<br />
1958 11.74 10.96 9.39 4.82 9.27 3.89 3.01<br />
1959 11.64 11.26 9.31 4.79 9.22 3.87 2.90<br />
1960 11.61 11.17 8.79 4.88 9.15 3.84 2.88<br />
1961 11.62 11.49 9.10 4.85 9.21 3.87 2.89<br />
1962 11.52 11.42 9.11 4.78 9.13 3.84 2.90<br />
1963 11.35 11.51 9.18 4.61 9.01 3.79 2.89<br />
1964 11.27 10.93 8.65 4.50 8.83 3.71 2.88<br />
1965 11.52 11.28 9.04 4.81 9.12 3.83 2.86<br />
1966 11.59 11.49 9.09 4.73 9.15 3.84 2.88<br />
1967 11.84 11.96 9.71 4.53 9.33 3.92 2.92<br />
1968 11.55 12.03 9.84 4.30 9.14 3.84 2.94<br />
1969 11.80 11.98 10.06 4.20 9.27 3.89 3.09<br />
1970 12.33 12.43 10.45 6.14 10.20 4.28 3.18<br />
1971 12.70 12.90 10.75 7.76 10.94 4.59 3.39<br />
1972 12.70 12.87 10.61 7.60 10.87 4.57 3.39<br />
1973 14.72 14.08 12.61 8.45 12.49 5.25 3.89<br />
1974 25.53 24.02 22.57 20.43 23.48 9.86 6.87<br />
1975 30.27 27.41 26.09 22.03 27.03 11.35 7.67<br />
1976 33.82 31.67 30.38 21.66 29.55 12.41 8.19<br />
1977 36.99 35.81 34.41 25.87 33.21 13.95 8.57<br />
1978 39.22 37.23 35.66 23.00 33.72 14.16 9.00<br />
1979 56.84 56.60 54.47 33.63 49.50 20.79 12.64<br />
1980 87.40 80.26 78.21 44.43 72.77 30.56 21.59<br />
1981 101.63 101.03 97.20 61.17 88.75 37.28 31.77<br />
1982 94.56 97.18 91.95 57.80 83.27 34.97 28.52<br />
1983 86.97 85.12 80.05 57.30 76.94 32.31 26.19<br />
1984 81.14 84.75 79.62 59.14 74.49 31.29 25.88<br />
1985 81.11 81.69 76.66 56.41 73.06 30.69 24.09<br />
1986 47.74 49.92 44.91 36.23 43.97 18.47 12.51<br />
1987 53.22 56.75 52.25 45.36 50.89 21.37 15.40<br />
1988 50.31 50.72 46.10 38.72 46.22 19.41 12.58<br />
1989 59.15 60.78 56.02 40.87 53.28 22.38 15.86<br />
1990 72.13 73.37 67.82 50.99 65.20 27.38 20.03<br />
1991 64.24 64.79 59.81 40.94 56.61 23.78 16.54<br />
1992 60.90 62.78 58.12 41.67 54.81 23.02 15.99<br />
1993 54.85 59.98 55.54 40.22 50.82 21.34 14.25<br />
1994 52.95 57.67 53.22 42.50 50.09 21.04 13.19<br />
1995 55.51 58.15 53.74 47.41 51.63 21.68 14.62<br />
1996 68.29 74.02 69.64 53.78 64.43 27.06 18.46<br />
1997 66.21 62.26 66.81 54.69 62.19 26.12 17.23<br />
1998 52.60 45.00 43.90 28.00 42.38 17.80 10.87<br />
1999 64.50 53.00 53.60 35.40 51.63 21.68 15.56<br />
2000 96.30 88.00 89.60 56.60 82.63 34.70 26.72<br />
2001 88.60 76.30 77.90 47.60 72.60 30.49 21.84<br />
2002 82.80 71.60 71.80 53.00 69.80 29.32 22.51<br />
2003 100.20 87.10 88.20 66.10 85.40 35.87 27.56<br />
2004 128.80 120.80 117.80 68.10 108.88 45.73 36.77<br />
2005 167.50 172.30 172.00 97.10 152.23 63.88 50.28<br />
2006 196.90 196.10 201.20 113.60 176.95 74.10 59.69<br />
Sources: Petroleum product prices derived by <strong>IPAA</strong> from Platt’s <strong>Oil</strong>gram Price Report thru 1997. EIA prices used thereafter. Crude oil wellhead prices from EIA.<br />
Notes: Data refl ect price trends only, not actual sale prices. Motor gasol<strong>in</strong>e prices represent leaded fuel prior to 1982, and unleaded<br />
thereafter.<br />
WHOLESALE PRICES —TOTAL U.S.<br />
COMPILED BY <strong>IPAA</strong> FEBRUARY 2009 AMERICA’S INDEPENDENT 115
PETROLEUM CONSUMPTION<br />
(mill. bbls.)<br />
1997 1998 1999 2000 2001 2002 2003 2004 2005 2006<br />
PETROLEUM CONSUMPTION<br />
Alabama 98.3 97.2 101.6 105.4 103.9 108.1 107.1 117.1 114.6 115.9<br />
Alaska 45.3 45.6 48.6 48.5 51.1 48.7 50.0 58.9 58.7 60.3<br />
Arizona 81.3 88.0 92.9 94.6 95.7 97.8 99.3 103.6 108.6 110.8<br />
Arkansas 65.4 65.2 71.6 73.1 70.0 70.1 69.6 71.7 70.7 70.8<br />
California 604.8 609.8 628.5 654.1 651.7 685.8 701.2 693.1 706.0 713.7<br />
Colorado 70.1 75.0 77.8 83.5 86.9 83.3 86.7 93.7 92.2 95.9<br />
Connecticut 80.3 78.8 83.2 81.2 76.6 70.8 79.8 86.1 82.6 75.0<br />
Delaware 25.0 25.3 25.8 24.9 26.7 26.1 26.6 25.5 26.8 25.1<br />
Dist.of Columbia 6.3 6.7 6.1 6.3 6.1 6.1 5,.4 5.6 5.3 4.3<br />
Florida 309.5 339.9 341.4 354.2 352.7 345.4 351.4 382.7 390.4 373.3<br />
Georgia 179.3 183.3 192.6 193.7 193.0 192.5 196.1 206.2 213.3 207.8<br />
Hawaii 39.8 40.5 39.7 40.6 41.5 45.1 47.0 49.0 51.3 51.6<br />
Idaho 26.6 27.6 30.0 30.7 28.6 29.1 25.6 28.8 29.5 30.7<br />
Ill<strong>in</strong>ois 232.8 228.6 250.6 248.6 243.0 237.7 243.2 255.1 275.7 265.5<br />
Indiana 157.3 156.4 161.9 164.5 150.5 160.4 165.5 162.2 160.8 163.5<br />
Iowa 72.3 78.8 82.8 82.4 78.8 82.4 76.4 86,.5 88.2 89.9<br />
Kansas 75.6 75.8 86.6 79.3 73.7 71.1 83.8 81.8 65.2 66.7<br />
Kentucky 125.7 127.5 132.7 130.2 119.3 129.9 122.7 134.2 133.5 138.7<br />
Louisiana 258.3 248.1 278.9 327.7 325.8 331.5 300.9 310.5 297.9 320.7<br />
Ma<strong>in</strong>e 46.5 46.1 48.1 47.1 40.7 41.3 47.3 46.6 47.6 42.9<br />
Maryland 95.1 100.4 105.1 101.9 102.6 99.4 103.3 106.7 110.8 103.4<br />
Massachusetts 134.7 138.0 133.7 138.2 135.4 130.8 133.1 135.5 136.8 124.4<br />
Michigan 197.0 197.4 208.0 201.5 194.0 198.1 193.4 197.4 198.1 187.0<br />
M<strong>in</strong>nesota 117.2 116.5 122..1 125.6 125.0 126.3 129.2 133.0 133.9 130.1<br />
Mississippi 10.8 9.2 8.4 10.7 9.9 10.1 10.9 10.2 84.1 86.8<br />
Missouri 132.2 139.3 145.1 128.6 135.4 136.9 138.9 140.1 139.7 141.1<br />
Montana 28.4 28.1 30.4 29.6 30.4 30.0 29.5 33.7 35.0 35.6<br />
Nebraska 43.0 45.4 45.9 42.0 41.0 42.9 43.3 44.5 43.2 43.3<br />
Nevada 39.3 40.7 41.9 43.4 45.9 43.8 44.4 48.3 51.1 54.1<br />
New Hampshire 31.9 33.5 34.5 34.0 31.1 32.8 36.6 37.7 35.4 32.1<br />
New Jersey 216.0 212.5 221.5 226.7 232.2 229.5 222.9 229.8 239.8 234.1<br />
New Mexico 43.3 45.3 47.6 45.8 45.3 45.8 46.1 47.8 47.7 50.3<br />
New York 284.7 290.7 294.8 309.1 297.0 287.1 318.8 337.1 330.6 292.6<br />
North Carol<strong>in</strong>a 172.9 174.1 173.0 181.2 176.9 173.2 177.5 185.5 187.1 181.0<br />
North Dakota 22.3 20.8 22.9 22.5 26.4 23.3 22.6 25.0 25.7 25.4<br />
Ohio 233.5 231.5 245.0 242.2 238.4 242.8 250.2 251.2 251.6 248.8<br />
Oklahoma 85.8 86.7 93.5 95.4 106.4 101.6 99.6 98.3 105.5 111.7<br />
Oregon 65.4 70.5 71.8 69.9 67.4 69.5 67.4 70.7 71.3 70.6<br />
Pennsylvania 242.9 248.4 248.2 259.7 264.4 260.2 267.3 276.1 279.0 269.4<br />
Rhode Island 18.6 17.6 17.9 17.8 18.3 18.0 18.6 18.1 17.9 17.2<br />
South Carol<strong>in</strong>a 82.0 84.2 84.7 87.9 93.1 93.2 95.7 109.5 105.3 109.2<br />
South Dakota 21.3 20.9 21.4 22.1 20.9 22.7 21.3 21.6 22.3 22.1<br />
Tennessee 119.8 125.4 129.3 130.8 135.3 141.3 143.5 146.8 151.0 152.6<br />
Texas 1,150.6 1,163.6 1,153.5 1,125.6 1,113.0 1,150.0 1,159.9 1,198.4 1,162.5 1,199.9<br />
Utah 44.5 45.4 46.8 49.2 48.2 47.6 49.9 50.6 52.9 57.1<br />
Vermont 16.1 15.6 15.7 16.6 16.9 16.2 16.3 17.9 17.2 17.0<br />
Virg<strong>in</strong>ia 152.1 153.7 156.7 164.6 168.9 164.2 177.1 189.7 189.8 185.2<br />
Wash<strong>in</strong>gton 148.6 148.5 153.2 152.9 154.0 147.4 142.9 151.1 153.2 146.0<br />
West Virg<strong>in</strong>ia 38.5 40.5 38.8 39.2 47.2 49.2 46.7 51.4 49.9 53.0<br />
Wiscons<strong>in</strong> 115.6 118.0 126.1 124.9 116.3 117.6 112.2 118.2 117.2 115.7<br />
Wyom<strong>in</strong>g 23.4 23.0 26.3 26.2 28.9 27.8 28.9 28.4 28.9 31.0<br />
Total U.S.. 6,446.3 6,539.2 6,742.6 6,824.9 6,764.2 6,820.0 6,907.8 7,146.0 7,592.8 7,550.9<br />
Source: <strong>Energy</strong> Information Adm<strong>in</strong>istration.<br />
116 AMERICA’S INDEPENDENT COMPILED BY <strong>IPAA</strong> FEBRUARY 2009
NATURAL GAS CONSUMPTION<br />
(MMcf.)<br />
1997 1998 1999 2000 2001 2002 2003 2004 2005 2006<br />
Alabama 324,158 329,134 337,270 353,614 332,693 379,343 350,345 382,367 353,156 391,098<br />
Alaska 425,393 434,871 422,816 427,288 408,960 419,131 414,234 406,319 432,972 379,791<br />
Arizona 134,706 158,355 165,076 205,235 240,812 250,734 272,921 349,622 321,584 358,136<br />
Arkansas 260,113 266,485 252,853 251,329 227,943 242,325 246,916 215,124 213,609 233,640<br />
California 2,146,211 2,309,883 2,339,521 2,508,797 2,464,565 2,273,193 2,269,405 2,406,889 2,248,256 2,292,056<br />
Colorado 314,486 330,259 333,085 367,920 463,738 459,397 436,253 440,378 470,321 449,830<br />
Connecticut 144,708 131,497 152,237 159,712 146,278 177,587 154,075 162,642 168,067 172,707<br />
Delaware 46,511 40,809 56,013 48,387 50,113 52,216 46,177 48,057 46,904 43,194<br />
Dist.of Columbia 34,105 30,409 32,281 33,468 29,802 32,898 32,814 32,227 32,085 29,052<br />
Florida 522,116 503,844 559,366 541,847 543,143 689,337 689,986 734,178 778,209 891,607<br />
Georgia 371,376 368,579 337,576 413,845 351,109 383,546 379,761 394,986 412,560 419,908<br />
Hawaii 2,894 2,654 3,115 2,841 2,818 2,734 2,732 2,774 2,795 2,784<br />
Idaho 68,669 69,277 70,672 72,697 80,279 71,481 69,868 75,335 74,540 75,728<br />
Ill<strong>in</strong>ois 1,077,139 957,254 1,004,281 1,030,604 951,616 1,049,878 998,486 953,207 969,642 892,129<br />
Indiana 556,624 521,748 556,932 570,558 501,711 539,034 527,037 526,701 531,111 496,332<br />
Iowa 254,489 232,057 230,691 232,565 224,336 226,457 230,161 226,819 241,340 238,495<br />
Kansas 338,231 326,674 302,932 312,369 272,500 304,992 281,346 256,779 255,123 258,363<br />
Kentucky 227,931 205,129 218,399 225,168 208,974 227,920 223,226 225,470 234,080 211,067<br />
Louisiana 1,661,061 1,569,190 1,495,478 1,536,725 1,219,013 1,341,444 1,233,505 1,281,428 1,254,370 1,222,720<br />
Ma<strong>in</strong>e 6,290 5,716 6,572 44,779 95,733 101,536 70,832 72,565 57,835 49,605<br />
Maryland 212,017 188,552 196,350 212,133 178,376 196,276 197,024 194,725 202,509 182,057<br />
Massachusetts 402,629 358,846 344,790 343,314 349,103 393,194 403,991 372,532 378,068 370,789<br />
Michigan 994,342 876,444 951,143 963,136 906,001 966,354 924,819 916,629 913,827 809,099<br />
M<strong>in</strong>nesota 354,092 330,513 344,591 362,025 340,911 371,583 371,261 359,898 367,825 352,576<br />
Mississippi 255,475 241,342 306,733 300,652 332,589 343,890 265,842 282,051 301,663 307,293<br />
Missouri 283,294 258,652 265,798 284,763 283,793 275,629 262,529 263,945 268,040 250,797<br />
Montana 59,851 59,840 62,129 67,955 65,051 69,532 68,473 66,829 68,355 73,882<br />
Nebraska 132,221 130,730 121,487 126,962 121,984 120,333 118,922 115,011 119,070 121,756<br />
Nevada 132,128 148,539 154,689 189,170 176,835 176,596 185,846 214,984 227,149 249,683<br />
New Hampshire 20,848 19,127 20,313 24,950 23,398 24,901 54,147 61,172 70,484 62,549<br />
New Jersey 717,011 679,619 715,630 605,275 564,923 598,602 612,890 620,806 602,388 547,908<br />
New Mexico 256,464 245,823 236,264 266,469 266,283 235,098 221,021 223,575 220,717 224,103<br />
New York 1,324,164 1,232,473 1,274,162 1,244,746 1,171,898 1,199,632 1,101,618 1,098,056 1,080,215 1,097,040<br />
North Carol<strong>in</strong>a 215,634 214,092 217,159 233,714 207,108 235,376 218,642 224,796 229,715 223,103<br />
North Dakota 56,179 49,541 56,418 56,528 60,819 66,726 60,907 59,986 53,050 53,338<br />
Ohio 897,693 811,389 841,966 890,962 804,243 830,955 848,388 825,753 825,961 742,440<br />
Oklahoma 567,050 575,855 538,329 538,563 491,458 508,298 540,103 538,576 582,536 618,714<br />
Oregon 185,069 229,403 235,009 224,888 229,665 202,164 212,556 234,997 232,562 222,643<br />
Pennsylvania 706,230 644,017 688,740 702,847 634,794 675,583 689,992 696,175 691,591 659,848<br />
Rhode Island 117,707 130,751 118,001 88,419 95,607 87,805 78,456 72,609 80,764 77,197<br />
South Carol<strong>in</strong>a 153,917 159,458 162,926 160,436 141,785 184,803 146,641 163,787 172,032 174,805<br />
South Dakota 36,115 33,042 35,794 37,939 37,077 41,577 43,881 41,679 42,555 40,739<br />
Tennessee 282,395 279,070 278,841 270,658 255,990 255,515 257,315 231,133 230,338 220,426<br />
Texas 4,116,722 4,205,459 4,009,689 4,421,777 4,252,152 4,303,831 4,050,632 3,908,243 3,503,636 3,433,863<br />
Utah 165,253 169,776 159,889 164,557 159,299 163,379 154,125 155,891 160,275 187,537<br />
Vermont 8,061 7,735 8,033 10,426 7,919 8,367 8,400 8,685 8,372 8,056<br />
Virg<strong>in</strong>ia 248,960 260,332 276,793 268,770 237,853 258,202 262,970 277,434 299,746 274,055<br />
Wash<strong>in</strong>gton 256,366 290,229 287,302 286,653 312,114 233,716 249,599 262,485 264,754 263,467<br />
West Virg<strong>in</strong>ia 159,504 142,860 139,961 147,854 141,090 146,455 126,986 122,267 117,136 113,085<br />
Wiscons<strong>in</strong> 400,651 368,022 380,560 393,601 359,784 385,310 394,711 383,316 410,250 372,457<br />
Wyom<strong>in</strong>g 100,950 109,188 96,726 101,314 98,569 112,872 115,358 107,060 108,314 107,363<br />
Total U.S. 22,737,342 22,245,956 22,405,151 23,333,121 22,238,624 23,007,017 22,276,502 22,388,975 22,010,596 21,550,845<br />
Source: <strong>Energy</strong> Information Adm<strong>in</strong>istration. Volumes delivered to consumers.<br />
NATURAL GAS CONSUMPTION<br />
COMPILED BY <strong>IPAA</strong> FEBRUARY 2009 AMERICA’S INDEPENDENT 117
INDUSTRY EMPLOYMENT-2006<br />
<strong>State</strong> M<strong>in</strong><strong>in</strong>g Ref<strong>in</strong><strong>in</strong>g Transportation Wholesale Retail Total<br />
<strong>Oil</strong> & <strong>Gas</strong> Petroleum <strong>Oil</strong>s & Pipel<strong>in</strong>es, Pipel<strong>in</strong>e <strong>Gas</strong> Petroleum <strong>Gas</strong>ol<strong>in</strong>e<br />
Extraction Ref<strong>in</strong><strong>in</strong>g Greases Except <strong>Gas</strong> Construction Distribution Products Stations <strong>Industry</strong><br />
Alabama 1,957 337 611 196 1,057 3,133 3,145 19,001 29,437<br />
Alaska 10,434 ND 414 ND 481 ND 1,355 1,804 14,488<br />
Arizona 268 ND 215 247 779 182 1,935 16,582 20,208<br />
Arkansas 2,926 442 191 922 402 957 2,234 12,586 20,660<br />
California 17,988 12,158 834 2,533 1,854 1,207 11,323 54,180 102,077<br />
Colorado 15,589 NC ND 832 2,988 1,307 2,197 12,586 35,472<br />
Connecticut 28 ND ND 166 248 1,279 5,479 6,497 13,367<br />
Delaware 28 ND ND ND 88 ND 725 2,553 3,374<br />
Dist. of Columbia ND ND ND ND ND ND ND 477 477<br />
Florida 1,513 96 369 1,770 722 1,770 6,919 39,969 53,128<br />
Georgia 351 110 195 282 1,528 1,758 4,300 29,566 38,090<br />
Hawaii 12 ND ND ND 75 ND 439 2,688 3,194<br />
Idaho 136 ND ND ND 317 ND 911 5,394 6,758<br />
Ill<strong>in</strong>ois 2,610 2,837 1,682 979 1,120 4,917 5,734 26,326 46,205<br />
Indiana 394 ND ND 513 1,030 3,084 3,497 23,590 32,108<br />
Iowa 10 39 138 396 302 552 1,746 17,882 21,065<br />
Kansas 7,723 1,576 280 875 1,289 1,725 2,235 10,318 26,021<br />
Kentucky 2,299 725 452 991 706 791 3,107 19,134 28,205<br />
Louisiana 45,031 9,036 1,116 2,347 14,236 1,614 1,461 17,832 92,673<br />
Ma<strong>in</strong>e 17 ND 381 72 13 62 4,531 7,539 12,615<br />
Maryland 763 ND ND 54 772 683 3,435 10,545 16,252<br />
Massachusetts 136 ND ND 131 346 2,724 7,314 11,915 22,566<br />
Michigan 2,550 ND 784 1,131 1,283 3,124 3,146 25,487 37,505<br />
M<strong>in</strong>nesota 160 ND ND 369 1,041 1,703 1,736 23,105 28,114<br />
Mississippi 4,982 1,687 107 841 871 634 2,410 15,600 26,323<br />
Missouri 109 35 411 292 475 3,177 4,290 25,237 34,026<br />
Montana 2,711 ND ND 328 385 392 996 5,095 9,907<br />
Nebraska 236 ND ND 255 132 1,489 1,251 8,838 12,201<br />
Nevada 130 ND ND 20 743 ND 761 8,619 10,273<br />
New Hampshire 50 ND 201 ND ND 196 2,464 5,240 8,151<br />
New Jersey 392 2,515 572 311 1,159 3,749 6,319 14,770 29,787<br />
New Mexico 14,402 ND 716 932 214 694 1,607 7,814 26,379<br />
INDUSTRY EMPLOYMENT-2006<br />
New York 930 42 424 365 1,398 3,598 13,762 28,314 48,833<br />
North Carol<strong>in</strong>a 564 ND 1,067 119 1,124 2,165 6,829 28,694 40,562<br />
North Dakota 3,101 ND ND 240 167 ND 1,671 4058 9,237<br />
Ohio 4,962 1,414 744 982 1,340 3,488 5,880 35,401 54,211<br />
Oklahoma 40,017 1,319 476 1,382 1,843 3,093 10,690 13,271 72,091<br />
Oregon 22 ND ND ND 292 ND 1,797 10,969 13,080<br />
Pennsylvania 5,233 2,314 2,525 1,779 1,929 3,899 11,508 36,425 65,612<br />
Rhode Island 87 ND ND ND 87 ND 1,625 1,918 3,717<br />
South Carol<strong>in</strong>a 260 ND ND ND 199 908 2,401 18,233 22,001<br />
South Dakota 47 ND ND 60 44 228 1,277 5,759 7,415<br />
Tennessee 637 ND ND 355 646 1,960 3,629 24,063 31,290<br />
Texas 180,803 20,349 731 12,429 22,404 7,112 50,360 67,406 361,594<br />
Utah 5,168 819 ND 272 400 870 1,158 9,612 18,299<br />
Vermont 24 ND ND ND ND ND 1,703 3,896 5,623<br />
Virg<strong>in</strong>ia 1,543 ND ND 404 1,748 1,593 4,900 33,251 43,439<br />
Wash<strong>in</strong>gton 166 1,868 83 166 1,599 1,254 3,176 14,466 22,778<br />
West Virg<strong>in</strong>ia 4,493 333 567 1,369 826 928 1,042 9,233 18,791<br />
Wiscons<strong>in</strong> ND ND 126 235 439 849 3,620 23,674 28,943<br />
Wyom<strong>in</strong>g 17,523 861 ND 736 3,823 173 892 4,052 28,060<br />
Total U.S. 403,358 68,427 15,207 40,363 76,155 108,038 244,141 862,064 1,825,703<br />
Source: <strong>State</strong> Agencies & Bureau of Labor Statistics Note: Reported data only. N.A.I.C. codes used. ND - Non-Disclosure or not available = not <strong>in</strong>cluded <strong>in</strong> Total.<br />
Note: <strong>State</strong> data differ from the Bureau of Labor Statistics national averages (Total US) due to confidentiality rules. <strong>Oil</strong>field Mach<strong>in</strong>ery <strong>in</strong>cluded <strong>in</strong> Wholesale Petroleum<br />
Products. Pipel<strong>in</strong>e Construction and <strong>Oil</strong>field Mach<strong>in</strong>ery separated out on state pages. <strong>State</strong> page Ref<strong>in</strong><strong>in</strong>g <strong>in</strong>cludes <strong>Oil</strong> and Greases.<br />
118 AMERICA’S INDEPENDENT COMPILED BY <strong>IPAA</strong> FEBRUARY 2009
REFERENCE INFORMATION<br />
Data Sources & Notes<br />
The editorial staff gratefully acknowledges the<br />
follow<strong>in</strong>g sources of data that appear on the<br />
<strong>in</strong>dividual state pages.<br />
<strong>State</strong> maps ................................... <strong>State</strong> data and IHS data for<br />
produc<strong>in</strong>g entities by county<br />
First and peak production years ... AIME Statistical Yearbook,<br />
World <strong>Oil</strong>, <strong>Oil</strong> & <strong>Gas</strong> Journal,<br />
& World Petroleum Report<br />
(Note: Marketed production)<br />
Deepest wells drilled.....................IHS & <strong>State</strong> Data<br />
Cumulative wells drilled ............... IHS & <strong>State</strong> Data<br />
Cumulative wellhead value ........... <strong>Energy</strong> Information<br />
Adm<strong>in</strong>istration<br />
Cumulative production (marketed)<br />
& Reserves (dry) .......................... <strong>Energy</strong> Information<br />
Adm<strong>in</strong>istration<br />
Wellhead prices and value ...........EIA, <strong>IPAA</strong>, <strong>State</strong> Data<br />
End-use natural gas prices ...........EIA<br />
Severance and production taxes ..<strong>IPAA</strong> survey<br />
Wells and footage drilled ..............API, IHS & <strong>State</strong> Data<br />
Rotary drill<strong>in</strong>g rigs .........................Baker Hughes, Inc.<br />
<strong>Produc<strong>in</strong>g</strong> wells ............................IHS & <strong>State</strong> Data<br />
<strong>Oil</strong> and gas production.................. EIA & IHS<br />
Number of employees ..................<strong>IPAA</strong> survey & BLS. Ref<strong>in</strong><strong>in</strong>g<br />
<strong>in</strong>cludes <strong>Oil</strong> and Greases.<br />
Petroleum reserve position ...........EIA<br />
Lease & Royalties ........................M<strong>in</strong>erals Management<br />
Service<br />
Abbreviations<br />
bbl. = barrel<br />
b/d = barrels per day<br />
Mcf = thousand cubic feet<br />
MMcf = million cubic feet<br />
Bcf = billion cubic feet<br />
Tcf = trillion cubic feet<br />
BT = British Thermal Unit<br />
NGL = Natural <strong>Gas</strong> Liquid<br />
LPG = Liquefied Petroleum <strong>Gas</strong>es<br />
NA = Data Not Available<br />
ND = Not Disclosable<br />
<strong>Energy</strong> Conversions<br />
One barrel of crude oil:<br />
= 42 gallons<br />
= 5,800,000 BTU of energy<br />
= 5,614 cubic feet of natural gas<br />
= 0.22 ton of bitum<strong>in</strong>ous coal<br />
One cubic foot of natural gas:<br />
= 7.48 gallons<br />
= 1,030 BTU of energy<br />
= 0.000178 barrel of crude oil<br />
= 0.00004 ton of bitum<strong>in</strong>ous coal<br />
One short ton of bitum<strong>in</strong>ous coal:<br />
= 2,000 pounds<br />
= 26,200,000 BTU of energy<br />
= 4.52 barrels of crude oil<br />
= 25,314 cubic feet of natural gas<br />
One metric ton of crude oil:<br />
= 2,204 pounds<br />
= 7.46 barrels of domestic crude oil<br />
= 6.99 barrels of foreign crude oil<br />
One cubic meter of natural gas:<br />
= 35.314 cubic feet<br />
Marg<strong>in</strong>al wells & Abandonments...IHS & IOGCC<br />
Federal Leases & Royalties.......... Department of Interior and<br />
M<strong>in</strong>erals Management Service<br />
REFERENCE INFORMATION<br />
COMPILED BY <strong>IPAA</strong> FEBRUARY 2009 AMERICA’S INDEPENDENT 119
GLOSSARY<br />
Abandonments- The number of produc<strong>in</strong>g wells that have been<br />
abandoned dur<strong>in</strong>g a given time period.<br />
Artificial Lift<strong>in</strong>g - Any method used to stimulate the production<br />
of crude oil and/or natural gas <strong>in</strong> excess of the fl ow result<strong>in</strong>g<br />
under natural reservoir pressures, e.g. pump<strong>in</strong>g, secondary or<br />
tertiary recovery.<br />
Associated <strong>Gas</strong> - The comb<strong>in</strong>ed volume of natural gas which<br />
occurs <strong>in</strong> crude oil reservoirs either as free gas (associated) or<br />
as gas <strong>in</strong> solution with crude oil (dissolved).<br />
Barrel - Standard volumetric measure for petroleum, equivalent<br />
to 42 U.S. gallons.<br />
Condensate - A mixture of liquid hydrocarbons at atmospheric<br />
conditions which occur <strong>in</strong> a gaseous state underground, sometimes<br />
known as distillate or natural gasol<strong>in</strong>e.<br />
Crude <strong>Oil</strong> - Hydrocarbons <strong>in</strong> liquid unprocessed form that vary<br />
significantly <strong>in</strong> properties such as API gravity, viscosity, and<br />
sulfur content.<br />
Development Well - A crude oil, natural gas or dry hole drilled<br />
with<strong>in</strong> an area known to be productive.<br />
Distillate Fuel <strong>Oil</strong> - One of the petroleum fractions produced by<br />
conventional distillate, <strong>in</strong>cludes fuel oil and diesel fuel.<br />
Dry Hole - A completed well which is not productive of crude oil<br />
and/or natural gas <strong>in</strong> commercial quantities.<br />
Dry Natural <strong>Gas</strong> - Natural gas that does not conta<strong>in</strong> dissolved<br />
liquid hydrocarbons.<br />
Exploratory Well - A crude oil, natural gas, or dry hole drilled to<br />
discover a petroleum formation or its limits.<br />
<strong>Gas</strong> Well - An exploratory or development well completed for<br />
the production of natural gas.<br />
Natural <strong>Gas</strong> Liquids (NGL) - Hydrocarbons found with natural<br />
gas that are recoverable by condensation or absorption, such<br />
as LPG or natural gasol<strong>in</strong>e.<br />
Non-associated <strong>Gas</strong> - Natural gas not <strong>in</strong> contact with signifi cant<br />
quantities of crude oil <strong>in</strong> a reservoir.<br />
<strong>Oil</strong> Well - An exploratory or development well completed for the<br />
production of crude oil.<br />
Petroleum - Includes <strong>in</strong> its broadest sense the entire spectrum<br />
of hydrocarbons - gaseous, liquid, and solid.<br />
Pipel<strong>in</strong>e - A l<strong>in</strong>e of tubes with pump<strong>in</strong>g mach<strong>in</strong>ery that transports<br />
crude oil or natural gas from the wellhead to the storage<br />
tank or petroleum ref<strong>in</strong>ery.<br />
Proved Reserves - The estimated quantity of crude oil, natural<br />
gas, or NGL that is shown with reasonable certa<strong>in</strong>ty to be<br />
recoverable from known fields under exist<strong>in</strong>g economic and<br />
operat<strong>in</strong>g conditions.<br />
Residual Fuel <strong>Oil</strong> - The heavy, high-viscosity leftover from the<br />
ref<strong>in</strong><strong>in</strong>g process, used ma<strong>in</strong>ly for <strong>in</strong>dustrial purposes.<br />
Rotary Drill<strong>in</strong>g Rig - A derrick equipped with modern rotary<br />
equipment capable of drill<strong>in</strong>g a bore hole with a bit attached to<br />
a rotat<strong>in</strong>g column of steel pipe, <strong>in</strong> contrast to a cable tool rig<br />
which drills on the percussion pr<strong>in</strong>ciple.<br />
Seismic Exploration Activity -The search for geological structures<br />
which are potential petroleum-bear<strong>in</strong>g formations by<br />
<strong>in</strong>terpret<strong>in</strong>g data from seismic shocks.<br />
Severance Tax - A tax levied by some states on each barrel of<br />
crude oil or each thousand cubic feet of natural gas produced.<br />
Strategic Petroleum Reserve - Crude oil <strong>in</strong>ventories held <strong>in</strong><br />
government underground storage for use dur<strong>in</strong>g periods of<br />
supply <strong>in</strong>terruptions.<br />
GLOSSARY<br />
Liquefied Petroleum <strong>Gas</strong> (LPG) - Butane, propane, and other<br />
light products separated from natural gasol<strong>in</strong>e or crude oil by<br />
fractionation or other processes. At atmospheric pressure, it<br />
reverts to the gaseous state.<br />
Marg<strong>in</strong>al Well - A produc<strong>in</strong>g well which pumps or “strips” less<br />
than 10 barrels of crude oil or 60 Mcf of natural gas per day.<br />
Marg<strong>in</strong>al Well Reserves - The estimated amount of additional<br />
crude oil or natural gas which can be recovered by primary<br />
means or secondary recovery methods.<br />
Middle Distillates - A general classifi cation of petroleum products<br />
that <strong>in</strong>cludes distillate fuel oil and kerosene.<br />
Natural <strong>Gas</strong> - Hydrocarbons <strong>in</strong> gaseous form or mixed with<br />
crude oil.<br />
Stratigraphic Test - A hole drilled to gather <strong>in</strong>formation about<br />
a stratigraphic formation such as the general permeability and<br />
porosity of the rocks; <strong>in</strong>cludes core tests.<br />
Well - A hole drilled to f<strong>in</strong>d or produce hydrocarbons, or to provide<br />
services related to their production.<br />
Wet Natural <strong>Gas</strong> - Volumes of natural gas rema<strong>in</strong><strong>in</strong>g after<br />
removal of lease condensate, and after exclusion of nonhydrocarbon<br />
gases where they occur <strong>in</strong> sufficient quantity to render<br />
the gas u<br />
nmarketable.<br />
Wildcat Well - A type of exploratory well drilled <strong>in</strong> an unproven<br />
area where there has been no previous production.<br />
120 AMERICA’S INDEPENDENT COMPILED BY <strong>IPAA</strong> FEBRUARY 2009
The Best Place to F<strong>in</strong>d the Perfect Job<br />
Is Just a Click Away!<br />
No need to get lost on commercial job boards.<br />
The <strong>IPAA</strong> Career Center is tailored specifically for you.<br />
JOB SEEKERS<br />
Manage your job search<br />
Access hundreds of corporate job post<strong>in</strong>gs<br />
Post an anonymous resume<br />
Advanced Job Alert system<br />
EMPLOYERS<br />
Quickly post job open<strong>in</strong>gs<br />
Manage your onl<strong>in</strong>e recruit<strong>in</strong>g efforts<br />
Advanced resume search<strong>in</strong>g capabilities<br />
Reach targeted and qualified candidates<br />
Never Let a Job Opportunity Pass You by!<br />
Start <strong>Your</strong> Job Search Today at<br />
http://careers.ipaa.org/
At IHS, we see<br />
state data as a<br />
start<strong>in</strong>g po<strong>in</strong>t.<br />
More people <strong>in</strong> the field —Our scouts talk to 2,000 contacts <strong>in</strong><br />
oil & gas prov<strong>in</strong>ces from the West Coast to West Virg<strong>in</strong>ia, track<strong>in</strong>g wells<br />
from drill<strong>in</strong>g to <strong>in</strong>itial potential.<br />
More data details —In Texas alone, IHS has 106,000 wells with core<br />
data and more than 133,000 wells with DST data—attributes you won’t<br />
f<strong>in</strong>d from vendors who simply re-publish state data.<br />
More accurate data —More than 100 geoscientists and data<br />
professionals conduct a series of quality checks, <strong>in</strong>clud<strong>in</strong>g add<strong>in</strong>g<br />
formation names for local reservoirs and ensur<strong>in</strong>g wells are assigned<br />
to the correct field.<br />
<strong>State</strong> data gets our process roll<strong>in</strong>g. We work with state agencies and our<br />
own QC teams to enhance it. We scout every stage of a well’s life to add<br />
updates and new attributes. Then we put the result <strong>in</strong> a consistent platform,<br />
so you can m<strong>in</strong>e it for actionable knowledge— and base your <strong>in</strong>vestment<br />
decisions on the <strong>in</strong>dustry standard <strong>in</strong> E&P data.<br />
See for yourself. Visit ihs.com/energy/bestdata to see<br />
our <strong>in</strong>ventory comparison reports for well and production data.<br />
See further. See opportunity. See clearly.<br />
888 OIL DATA<br />
www.ihs.com/energy<br />
©2007 IHS Inc. All Rights Reserved.<br />
122 AMERICA’S INDEPENDENT COMPILED BY <strong>IPAA</strong> FEBRUARY 2009