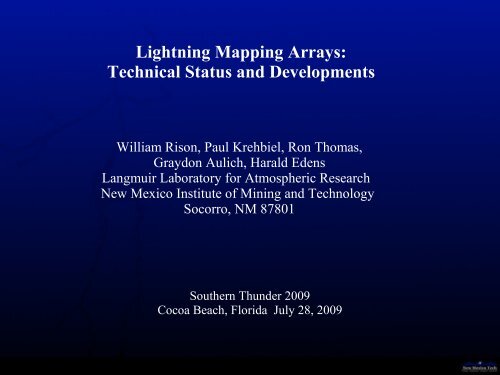
Lightning Mapping Arrays: Technical Status and Developments
Lightning Mapping Arrays: Technical Status and Developments
Lightning Mapping Arrays: Technical Status and Developments

Create successful ePaper yourself
Turn your PDF publications into a flip-book with our unique Google optimized e-Paper software.
<strong>Lightning</strong> <strong>Mapping</strong> <strong>Arrays</strong>:<br />
<strong>Technical</strong> <strong>Status</strong> <strong>and</strong> <strong>Developments</strong><br />
William Rison, Paul Krehbiel, Ron Thomas,<br />
Graydon Aulich, Harald Edens<br />
Langmuir Laboratory for Atmospheric Research<br />
New Mexico Institute of Mining <strong>and</strong> Technology<br />
Socorro, NM 87801<br />
Southern Thunder 2009<br />
Cocoa Beach, Florida July 28, 2009
LMA Operation<br />
●<br />
Listen in a locally unused TV channel<br />
●<br />
Detect peak event in successive<br />
80 microsecond time intervals<br />
●<br />
Measure arrival time within 40 ns<br />
●<br />
Up to 12,500 arrival times/second
Height vs. N-S<br />
Example of a highly dendritic negative cloud-to-ground (CG) flash<br />
Height vs. time<br />
Height vs. E-W<br />
60 km extent,<br />
2.5 sec duration,<br />
7350 sources<br />
Plan view
Oklahoma <strong>Lightning</strong> <strong>Mapping</strong> Array (OU, NSSL)<br />
●<br />
Density of points display<br />
Kansas<br />
Oklahoma<br />
Texas<br />
(http://lightning.nmt.edu/oklma)
VHF Time-Of-Arrival (TOA) Total <strong>Lightning</strong> <strong>Mapping</strong> Systems<br />
LMA<br />
LDAR-II<br />
DPG<br />
(?)<br />
LLAB(3)<br />
TSC<br />
(?)<br />
(N) VHF TV Channel<br />
WSMR<br />
(3)<br />
STEPS<br />
2000 (3)<br />
DFW<br />
(3)<br />
OK(3)<br />
HOUST<br />
(~4)<br />
HSV<br />
(5)<br />
ATL<br />
(9)<br />
DC<br />
(10)<br />
KSC<br />
(3-4)
Practical Considerations<br />
●<br />
VHF Frequency: <strong>Lightning</strong> measurements are best made in the lower VHF<br />
– Radiated source power decreases as ~1/f 2<br />
– Antenna gain decreases as 1/f 2 [(1/2)-wave dipole antennas]<br />
– Decreased detectability, range in upper VHF<br />
●<br />
Array Size<br />
– Station spacing of ~20 km necessary for 3D accuracy <strong>and</strong> good<br />
sensitivity<br />
●<br />
Number of Stations<br />
●<br />
– Better accuracy <strong>and</strong> detectability with more stations<br />
– Minimum number: 10<br />
●<br />
Communications Link<br />
– Need 150 Kb/sec for decimated real-time data<br />
– Need 1 Mb/sec for full data<br />
– 802.11 Wireless (OKLMA, NALMA)<br />
– Internet (DC)<br />
– Fiber Optic (WSMR)
VHF Frequency Spectrum<br />
LMA stations ‘listen’ on a locally unused TV channel (e.g., Ch. 3)
Total <strong>Lightning</strong> Observations
Oklahoma LMA<br />
●<br />
Eleven-station network,<br />
60 km diameter, southwest<br />
of Oklahoma City.<br />
●<br />
Central processing<br />
station in Norman<br />
● 802.11b wireless<br />
communications
Oklahoma <strong>Lightning</strong> <strong>Mapping</strong> Station
Oklahoma LMA<br />
●<br />
For 11 station network,:<br />
Good 3-D to about 150 km<br />
Good 2-D to about 250 km
Oklahoma LMA<br />
●<br />
Inside 3-D region,<br />
significant detail:<br />
●<br />
– Upper positive,<br />
– Mid-level negative,<br />
– Lower positive<br />
– Good sensitivity<br />
●<br />
Much less detail in 2-D<br />
region<br />
– No sources below ~7 km<br />
– Little altitude information<br />
– Low sensitivity, only<br />
see higher-power sources
VHF Time-Of-Arrival (TOA) Total <strong>Lightning</strong> <strong>Mapping</strong> Systems<br />
LMA<br />
LDAR-II<br />
DPG<br />
(?)<br />
LLAB(3)<br />
TSC<br />
(?)<br />
(N) VHF TV Channel<br />
WSMR<br />
(3)<br />
STEPS<br />
2000 (3)<br />
DFW<br />
(3)<br />
OK(3)<br />
HOUST<br />
(~4)<br />
HSV<br />
(5)<br />
ATL<br />
(9)<br />
DC<br />
(10)<br />
KSC<br />
(3-4)
Real Time Processing <strong>and</strong> Display<br />
●<br />
Full Data: typically one trigger every 80 µs<br />
●<br />
Real-time Decimated data: one trigger every 400 µs<br />
– Data links typically not fast enough<br />
– Cannot process 12-station real-time data in real time<br />
●<br />
For an active storm, number of decimated sources about one third the<br />
total of the full data set<br />
●<br />
A few second to a few minute delay in source location generation
●<br />
Decimated data or full data?<br />
●<br />
Number of active LMA stations<br />
– Significant reduction in number of located sources with fewer than<br />
eight active stations<br />
●<br />
VHF frequency used<br />
●<br />
Local noise threshold<br />
●<br />
Proximity to array center<br />
Interpretation of Source Density<br />
●<br />
WSMR LMA most sensitive system<br />
●<br />
DC LMA least sensitive system
Volcanic <strong>Lightning</strong><br />
Augustine Volcano<br />
Nov. 4., 2006 Photo by Jennifer Adleman, courtesy of AVO/USGS
Portable LMA Stations<br />
• Electronics housed in shielded<br />
thermoelectric cooler enclosure<br />
• Operate from external 12 VDC battery <strong>and</strong>/or<br />
power supply. ~12 (+48) watts power<br />
• Battery operation: 48+ hours (w/out cooling)<br />
20+ hours (with cooling)<br />
• Lightweight (10 lbs)
LMA Antenna –<br />
AVO Facility,<br />
Homer, Alaska<br />
(Augustine in the<br />
distant background,<br />
hidden by clouds)
Received signal at Homer during the main eruption on January 28<br />
Two types of electrical activity<br />
-30<br />
Continuous sparking<br />
Discrete (< 1 sec)<br />
-50<br />
Power(dBm)<br />
-70<br />
05:20 05:30 05:40 05:50<br />
Augustine Seismic<br />
Oil Point Seismic
Expected arrival time differences.<br />
Two stations give the azimuthal direction only
700 ms horizontally extensive lightning discharge<br />
in Augustine volcanic plume
40 ms vertical lightning discharge in Augustine volcanic plume
Three Types of Electrical Discharges<br />
-30<br />
-50<br />
Discrete short<br />
duration (< 100 ms)<br />
Discrete long<br />
duration (< 1 sec)<br />
Power(dBm)<br />
-70<br />
Continuous Sparking<br />
Thee types of electrical activity:<br />
05:25 05:30 05:35<br />
1) Continuous sparking, presumably in hot gases at the mouth of the crater<br />
2) Short-duration discharges, presumably negative leaders ascending into positive<br />
charge during rapid vertical development of the volcanic plume<br />
3) Longer duration lightning discharges, with both vertical <strong>and</strong> horizontal<br />
development, in the anvil of the volcanic plume
Redoubt Volcano Eruptions, Alaska, March 22 – April 4, 2009<br />
22 eruptions; 4-station <strong>Lightning</strong> <strong>Mapping</strong> Network ( )
March 28, 2009 eruption<br />
●<br />
~30 min duration (2330 --<br />
0000 UTC), major<br />
lightning.<br />
●<br />
Electrical activity began<br />
over Redoubt, but became<br />
detached from volcano <strong>and</strong><br />
drifted downwind with time.<br />
●<br />
Cloud was self-electrifying<br />
after becoming detached.<br />
●<br />
Charge structure of final<br />
discharge similar to upper<br />
dipole of normally-electrified<br />
storm.
Volcanic <strong>Lightning</strong><br />
●<br />
<strong>Lightning</strong> is common in volcanic eruptions<br />
●<br />
Horizontally extensive lightning in ash cloud<br />
●<br />
Not practical to routinely map lightning using VHF TOA system<br />
●<br />
Geostationary lightning mapping sensor might provide valuable<br />
information on volcanic ash clouds
Comparison of NEXRAD <strong>and</strong> <strong>Lightning</strong> Source Density<br />
(Oklahoma LMA)<br />
Radar<br />
LMA (plan view)<br />
LMA (vertical cross-section)<br />
Courtesy of Lakshmanan, Hondl, MacGorman, Stumpf (CIMMS, 2004)
Washington, DC Greater Metro Area <strong>Lightning</strong> <strong>Mapping</strong> Stations<br />
(8 Stations, 2 more stations to be added, Spring 2008)<br />
APL<br />
UMBC<br />
Sterling<br />
MCCC<br />
Howard<br />
GMU<br />
NVCC<br />
CSM<br />
Joint Project: New Mexico Tech, NASA Global Hydrology <strong>and</strong> Climatology Center,<br />
NOAA National Weather Service
DC <strong>Lightning</strong> <strong>Mapping</strong> Array<br />
●<br />
Experimental, demonstration network<br />
-- Urban environment, operates in upper VHF (Ch 10)<br />
-- Use internet for data communications (real-time, post-storm)<br />
●<br />
Real time data processing done by NASA <strong>and</strong> provided to NWS<br />
for nowcasting the weather.<br />
●<br />
Real time data at: http://branch.nsstc.nasa.gov/PUBLIC/DCLMA<br />
Hosting Institutions:<br />
●<br />
Howard University<br />
●<br />
Montgomery County Community College – Rockville, MD<br />
●<br />
NWS Test <strong>and</strong> Evaluation Facility – Sterling, VA<br />
●<br />
College of Southern Maryl<strong>and</strong> – La Plata, MD<br />
●<br />
Johns Hopkins – Applied Physics Laboratory<br />
●<br />
North Virginia Community College – Ann<strong>and</strong>ale, VA<br />
●<br />
University of Maryl<strong>and</strong> Baltimore County (UMBC)<br />
●<br />
George Mason University (Prince William Campus, Manassas).<br />
8 station network, 2 more stations to be added, Spring 2008
Isolated storm, Washington DC<br />
August 3, 2006<br />
Sterling<br />
Rockville<br />
UMBC<br />
Howard<br />
●<br />
1 hour of data; storm propagates<br />
west to east, from Sterling, VA<br />
to over DC area (40 km)<br />
●<br />
Note vertical growth phases in<br />
height-time panel (top).<br />
●<br />
Indicates growth of successive<br />
cells in the storm (plan view)<br />
●<br />
Storm produces a number of<br />
‘bolt-from-the-blue’ discharges<br />
out the sides <strong>and</strong> ahead of the<br />
storm (‘spider’-like channels).<br />
Ann<strong>and</strong>ale<br />
La Plata
Bolt from the Blue Discharge<br />
© Harald Edens
Real-time public website ( http://branch.nsstc.nasa.gov/PUBLIC/DCLMA/)
Sept 8, 2006
October 4, 2006
DC LMA diagnostic webpage<br />
Data ingest time (seconds)
April 4, 2007<br />
●<br />
Two hour time interval<br />
●<br />
Active Upper <strong>and</strong> Lower<br />
Positive Charge Regions<br />
=> Normal tripole<br />
charge structure
April 4, 2007<br />
●<br />
10 min time interval<br />
●<br />
Density of points plot
April 4, 2007<br />
+ --<br />
+ -<br />
●<br />
Charge density plot<br />
●<br />
(+) charge regions (orange)<br />
better detected than (-)<br />
charge regions (blue)
Intracloud Discharge<br />
(+)<br />
(--)<br />
●<br />
Between negative (blue)<br />
<strong>and</strong> upper positive (red)<br />
charges
CG Discharge<br />
●<br />
Between negative (blue)<br />
<strong>and</strong> ground, via lower<br />
positive charge (red)
Low IC Discharges<br />
●<br />
Between negative (blue)<br />
lower positive charge (red)<br />
Low Intracloud
Summary:<br />
+<br />
--<br />
+<br />
●<br />
High density of points<br />
=> (+) charge regions<br />
●<br />
(Negative in between)
May 13, 2007<br />
●<br />
Active lower (+) region<br />
(Low ICs <strong>and</strong> -CGs)<br />
●<br />
Upper (+) becomes active<br />
during convective growth<br />
phases.
SCAN Storm Cells / Site Storm Threat super imposed with DC LMA image (July 04, 2007 at<br />
23:01Z<br />
Red > 60<br />
Red > 6<br />
Yellow: 2-6<br />
White : 1-2<br />
Gray < 1<br />
SCAN CELL TABLE<br />
Cell S1<br />
DC LMA total lightning<br />
Red > 6<br />
Yellow: 2-6
AWIPS Display, NWS Forecast Office, Huntsville, AL<br />
VIL<br />
LMA<br />
2-min<br />
Composite<br />
dBZ<br />
NLDN<br />
5-min
Bolt from the blue<br />
lightning discharge<br />
(negative cloud-ground)
Total <strong>Lightning</strong> Observations
Total <strong>Lightning</strong> Observations
May 27, 2007
May 27, 2007
February 22, 2007<br />
Winter storm, low lightning<br />
rates, lower altitudes
April 4, 2007<br />
Active Upper <strong>and</strong><br />
Lower Positive Charge<br />
Regions
REFERENCE:<br />
Thomas, R.J., P.R. Krehbiel, W. Rison, S.J. Hunyady, W.P. Winn, T. Hamlin,<br />
<strong>and</strong> J. Harlin, Accuracy of the lightning mapping array, J. Geophys. Rsch.,<br />
109, D14207, doi:10.1029/2004/JD004549, 2004.
New Mexico LMA Networks
WSMR – Aircraft sparking observations<br />
Aircraft becomes electrically<br />
charged in flying through<br />
ice crystal clouds (cirrus,<br />
thunderstorm anvils). Emits<br />
steady stream of weak sparks<br />
that can be located by the<br />
LMA. 100 to 10,000 sparks<br />
per second, depending on<br />
charging rate.
L a ng m uir L a bora to ry<br />
C o m pa c t L MA<br />
Total <strong>Lightning</strong> Observations<br />
●<br />
Clouds are transparent at RF – therefore can use to sense intracloud (IC)<br />
discharges as well as in-cloud parts of cloud-to-ground (CG) lightning.<br />
=> Hence, “total” lightning.<br />
●<br />
<strong>Lightning</strong> is a good indicator of vigorous convective activity --<br />
valuably complements radar observations of storms by showing<br />
most active <strong>and</strong> intensifying parts of a storm system.<br />
●<br />
Total lightning observations now being made at several locations<br />
around U.S.<br />
●<br />
Data starting to be used by National Weather Service to nowcast<br />
potentially severe weather situations, lightning ground hazards.<br />
●<br />
Potential benefit to air traffic control, airport operations.<br />
●<br />
VHF observation technique potentially useful in other applications<br />
-- commercial, defense-related.
Multiple storm observations – June 17, 2006<br />
●<br />
830,000 sources in 1 hr;<br />
(200-250 per sec)<br />
●<br />
Increasing minimum height<br />
in vertical projections<br />
due to earth’s curvature<br />
(line of sight propagation)<br />
●<br />
Difference from radar:<br />
Essentially instantaneous<br />
pictures of storm activity<br />
(no need to scan).
Tornadic Storm, June 29, STEPS 2000: Height vs. time density plot<br />
convective surges<br />
F1 tornado<br />
F1 tornado preceded by 2 convective surges (A, B) 45 min earlier;<br />
accompanied by 3 rd surge <strong>and</strong> by onset of +CG discharges
<strong>Lightning</strong> ‘hole’ associated with F1 tornado<br />
●<br />
Tornado on west side of hole<br />
●<br />
Associated with 3 rd convective<br />
surge of storm – note upward surge<br />
in height-time panel (top).<br />
●<br />
Hole co-located with strong<br />
(100+ mph) updraft
DC LMA Stations (Urban Network)<br />
Howard University<br />
Montgomery Comm. College, Rockville<br />
North VA Comm College,<br />
Ann<strong>and</strong>ale<br />
Sterling Nat'l Weather Service Site
Airplane Track<br />
Aircraft becomes electrically<br />
charged in flying through<br />
ice crystal clouds (cirrus,<br />
thunderstorm anvils). Emits<br />
steady stream of weak sparks<br />
that can be located by the<br />
LMA.
DC LMA diagnostic web table<br />
December 12, 2006; quiescent
Examples of 24-hour lightning activity, DC mapping array<br />
Oct 4, 2006 Sept 8, 2006<br />
(http://branch.nsstc.nasa.gov/public/dclma)
5 min intvl
LMA Operation<br />
●<br />
Simple receiver<br />
●<br />
6 MHz b<strong>and</strong>width, t_rise ~160 ns<br />
●<br />
Detect peak event in successive<br />
80 microsecond time intervals<br />
●<br />
Measure arrival time within 40 ns<br />
(25 MHz A/D converter)<br />
●<br />
Up to 12,500 arrival times / second
Oklahoma <strong>Lightning</strong> <strong>Mapping</strong> Array (Univ. of Okla., National Severe Storms Lab)<br />
Kansas<br />
Oklahoma<br />
●<br />
One hour of data.<br />
●<br />
Eleven-station network,<br />
60 km diameter, southwest<br />
of Oklahoma City.<br />
●<br />
Density of points display<br />
●<br />
Squall line approaching<br />
Oklahoma City from west.<br />
●<br />
Operates on TV Ch. 3<br />
(60-66 Mhz, lower VHF)<br />
●<br />
Array covers most of OK<br />
<strong>and</strong> into KS <strong>and</strong> TX.<br />
(400-500 km diameter area)<br />
●<br />
Data ingested over wireless<br />
ethernet links, processed in<br />
real time; 1-2 min updates.<br />
Texas<br />
(http://lightning.nmt.edu/oklma)
DC LMA diagnostic web table<br />
August 3, 2007 storm, in progress
Concluding Remarks<br />
●<br />
Very helpful to have locally unused TV channels in the VHF.<br />
6 Mhz b<strong>and</strong>width provides good timing accuracy, sensitivity.<br />
●<br />
<strong>Lightning</strong> measurements are best made in the lower VHF<br />
-- Radiated source power decreases as ~1/f^2<br />
-- Antenna gain decreases as 1/f^2 [(1/2)-wave dipole antennas]<br />
●<br />
Lower versus upper VHF (Ch 2-6 vs. Ch. 7-13):<br />
-- factor of 2-3 difference in frequency<br />
-- (6-10 dB)*2 = 12-20 dB decrease in sensitivity<br />
-- decreased detectability, range in upper VHF<br />
●<br />
Urban environments: Stronger local noise in lower VHF, can<br />
benefit from operating in upper VHF.<br />
●<br />
<strong>Lightning</strong> data will be increasingly useful to the NWS <strong>and</strong> other<br />
governmental departments <strong>and</strong> agencies (public safety, national security).<br />
●<br />
If at all possible, leave a lower VHF channel free for<br />
this <strong>and</strong> future remote sensing applications
Intracloud <strong>Lightning</strong>
Cloud-t o-Ground<br />
Light ning