Nov 2009 - Travel Business Analyst
Nov 2009 - Travel Business Analyst
Nov 2009 - Travel Business Analyst

Create successful ePaper yourself
Turn your PDF publications into a flip-book with our unique Google optimized e-Paper software.
MARKET DATA<br />
Special<br />
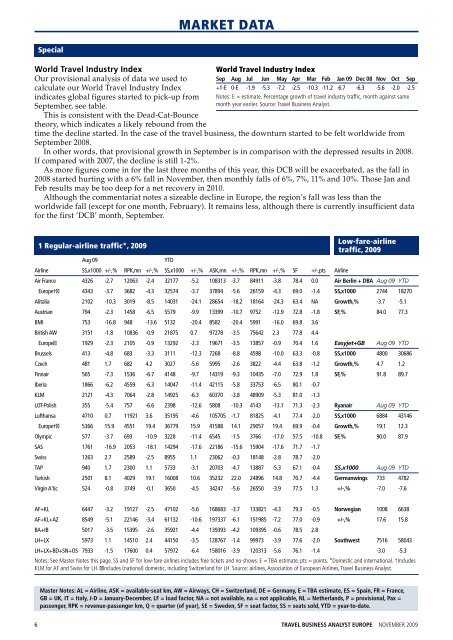
World <strong>Travel</strong> Industry Index<br />
Our provisional analysis of data we used to<br />
calculate our World <strong>Travel</strong> Industry Index<br />
indicates global figures started to pick-up from<br />
September, see table.<br />
This is consistent with the Dead-Cat-Bounce<br />
theory, which indicates a likely rebound from the<br />
World <strong>Travel</strong> Industry Index<br />
Sep Aug Jul Jun May Apr Mar Feb Jan 09 Dec 08 <strong>Nov</strong> Oct Sep<br />
+1-E 0-E -1.9 -5.3 -7.2 -2.5 -10.3 -11.2 -6.7 -6.3 -5.6 -2.0 -2.5<br />
Notes: E = estimate. Percentage growth of travel industry traffic, month against same<br />
month year earlier. Source: <strong>Travel</strong> <strong>Business</strong> <strong>Analyst</strong>.<br />
time the decline started. In the case of the travel business, the downturn started to be felt worldwide from<br />
September 2008.<br />
In other words, that provisional growth in September is in comparison with the depressed results in 2008.<br />
If compared with 2007, the decline is still 1-2%.<br />
As more figures come in for the last three months of this year, this DCB will be exacerbated, as the fall in<br />
2008 started hurting with a 6% fall in <strong>Nov</strong>ember, then monthly falls of 6%, 7%, 11% and 10%. Those Jan and<br />
Feb results may be too deep for a net recovery in 2010.<br />
Although the commentariat notes a sizeable decline in Europe, the region’s fall was less than the<br />
worldwide fall (except for one month, February). It remains less, although there is currently insufficient data<br />
for the first ‘DCB’ month, September.<br />
1 Regular-airline traffic*, <strong>2009</strong><br />
Aug 09<br />
YTD<br />
Airline SS,x1000 +/-,% RPK,mn +/-,% SS,x1000 +/-,% ASK,mn +/-,% RPK,mn +/-,% SF +/-,pts<br />
Low-fare-airline<br />
traffic, <strong>2009</strong><br />
Air France 4326 -2.7 12063 -2.4 32177 -5.2 108313 -3.7 84911 -3.8 78.4 0.0 Air Berlin + DBA Aug 09 YTD<br />
Europe†╪ 4343 -3.7 3682 -4.3 32574 -3.7 37894 -5.6 26159 -4.3 69.0 -1.4 SS,x1000 2744 18270<br />
Alitalia 2102 -10.3 3019 -8.5 14031 -24.1 28654 -18.2 18164 -24.3 63.4 NA Growth,% -3.7 -5.1<br />
Austrian 794 -2.3 1458 -6.5 5579 -9.9 13399 -10.7 9752 -12.9 72.8 -1.8 SF,% 84.0 77.3<br />
BMI 753 -16.8 948 -13.6 5132 -20.4 8582 -20.4 5991 -16.0 69.8 3.6<br />
British AW 3151 -1.8 10836 -0.9 21875 0.7 97278 -3.5 75642 2.3 77.8 4.4<br />
Europe╪ 1929 -2.3 2105 -0.9 13292 -2.3 19671 -3.5 13857 -0.9 70.4 1.6 Easyjet+GB Aug 09 YTD<br />
Brussels 413 -4.8 683 -3.3 3111 -12.3 7268 -8.8 4598 -10.0 63.3 -0.8 SS,x1000 4800 30686<br />
Czech 481 1.7 682 4.2 3027 -5.6 5995 -2.6 3822 -4.4 63.8 -1.2 Growth,% 4.7 1.2<br />
Finnair 565 -7.3 1536 -6.7 4148 -9.7 14319 -9.3 10435 -7.0 72.9 1.8 SF,% 91.8 89.7<br />
Iberia 1866 -6.2 4559 -6.3 14047 -11.4 42115 -5.8 33753 -6.5 80.1 -0.7<br />
KLM 2121 -4.3 7064 -2.8 14925 -6.3 60370 -3.8 48909 -5.3 81.0 -1.3<br />
LOT-Polish 355 -5.4 757 -6.6 2398 -12.6 5808 -10.3 4143 -13.1 71.3 -2.3 Ryanair Aug 09 YTD<br />
Lufthansa 4710 0.7 11921 3.6 35195 -4.6 105705 -1.7 81825 -4.1 77.4 -2.0 SS,x1000 6884 43146<br />
Europe†╪ 5366 15.9 4551 19.4 36779 15.9 41588 14.1 29057 19.4 69.9 -0.4 Growth,% 19.1 12.3<br />
Olympic 577 -3.7 693 -10.9 3228 -11.4 6545 -1.5 3766 -17.0 57.5 -10.8 SF,% 90.0 87.9<br />
SAS 1761 -16.9 2053 -18.1 14294 -17.6 22186 -15.6 15904 -17.6 71.7 -1.7<br />
Swiss 1263 2.7 2589 -2.5 8955 1.1 23062 -0.3 18148 -2.8 78.7 -2.0<br />
TAP 940 1.7 2300 1.1 5733 -3.1 20703 -4.7 13887 -5.3 67.1 -0.4 SS,x1000 Aug 09 YTD<br />
Turkish 2501 8.1 4029 19.1 16008 10.6 35232 22.0 24896 14.8 70.7 -4.4 Germanwings 733 4782<br />
Virgin A'tic 524 -0.8 3749 -0.1 3650 -4.5 34247 -5.6 26550 -3.9 77.5 1.3 +/-,% -7.0 -7.6<br />
Airline<br />
AF+KL 6447 -3.2 19127 -2.5 47102 -5.6 168683 -3.7 133821 -4.3 79.3 -0.5 Norwegian 1008 6638<br />
AF+KL+AZ 8549 -5.1 22146 -3.4 61132 -10.6 197337 -6.1 151985 -7.2 77.0 -0.9 +/-,% 17.6 15.8<br />
BA+IB 5017 -3.5 15395 -2.6 35921 -4.4 139393 -4.2 109395 -0.6 78.5 2.8<br />
LH+LX 5973 1.1 14510 2.4 44150 -3.5 128767 -1.4 99973 -3.9 77.6 -2.0 Southwest 7516 58043<br />
LH+LX+BD+SN+OS 7933 -1.5 17600 0.4 57972 -6.4 158016 -3.9 120313 -5.6 76.1 -1.4 -3.0 -5.3<br />
Notes: See Master Notes this page. SS and SF for low-fare-airlines includes free tickets and no-shows. E = TBA estimate, pts = points. *Domestic and international. †Includes<br />
KLM for AF and Swiss for LH. ╪Includes (national) domestic, including Switzerland for LH. Source: airlines, Association of European Airlines, <strong>Travel</strong> <strong>Business</strong> <strong>Analyst</strong>.<br />
Master Notes: AL = Airline, ASK = available-seat km, AW = Airways, CH = Switzerland, DE = Germany, E = TBA estimate, ES = Spain, FR = France,<br />
GB = UK, IT = Italy, J-D = January-December, LF = load factor, NA = not available, na = not applicable, NL = Netherlands, P = provisional, Pax =<br />
passenger, RPK = revenue-passenger km, Q = quarter (of year), SE = Sweden, SF = seat factor, SS = seats sold, YTD = year-to-date.<br />
6<br />
TRAVEL BUSINESS ANALYST EUROPE NOVEMBER <strong>2009</strong>